")
Back to Journals » OncoTargets and Therapy » Volume 11
Subgroup analysis reveals molecular heterogeneity and provides potential precise treatment for pancreatic cancers
Authors Zhang H, Zeng J, Tan Y , Lu L, Sun C, Liang Y, Zou H, Yang X, Tan Y
Received 19 January 2018
Accepted for publication 22 May 2018
Published 12 September 2018 Volume 2018:11 Pages 5811—5819
DOI https://doi.org/10.2147/OTT.S163139
Checked for plagiarism Yes
Review by Single anonymous peer review
Peer reviewer comments 3
Editor who approved publication: Dr XuYu Yang
Heying Zhang,1 Juan Zeng,1 Yongqiang Tan,2 Lin Lu,3 Cheng Sun,1 Yusi Liang,1 Huawei Zou,1 Xianghong Yang,4 Yonggang Tan1
1Department of Oncology, Shengjing Hospital, China Medical University, Shenyang, People’s Republic of China; 2Google Inc., Google Ads, Los Angeles, CA, USA; 3Department of Radiology, Columbia University Medical Center, New York, NY, USA; 4Department of Pathology, Shengjing Hospital, China Medical University, Shenyang, People’s Republic of China
Background: The relationship between molecular heterogeneity and clinical features of pancreatic cancer remains unclear. In this study, pancreatic cancer was divided into different subgroups to explore its specific molecular characteristics and potential therapeutic targets.
Patients and methods: Expression profiling data were downloaded from The Cancer Genome Atlas database and standardized. Bioinformatics techniques such as unsupervised hierarchical clustering was used to explore the optimal molecular subgroups in pancreatic cancer. Clinical pathological features and pathways in each subgroup were also analyzed to find out the potential clinical applications and initial promotive mechanisms of pancreatic cancer.
Results: Pancreatic cancer was divided into three subgroups based on different gene expression features. Patients included in each subgroup had specific biological features and responded significantly different to chemotherapy.
Conclusion: Three distinct subgroups of pancreatic cancer were identified, which means that patients in each subgroup might benefit from targeted individual management.
Keywords: pancreatic cancer, TCGA, bioinformatics, therapeutic target
Introduction
Pancreatic cancer is one of the most aggressive and lethal malignancies. Although patients received same treatment, different outcomes might be obtained in individuals and call for personalized treatment. Recent advances in gene research, including large-scale high-throughput sequencing and genome-wide association studies, have not yet translated into effective therapeutics or overall survival benefits for pancreatic cancer patients.1,2
Effective treatment of pancreatic cancer has progressed rather slowly over the past decades and only few patients have been shown to survive more than 5 years after diagnosis.3,4 Gemcitabine is a standard agent for pancreatic cancer treatment; however, it has a limited effect, particularly on overall survival.5,6 Gemcitabine plus albumin-bound paclitaxel increased 1- and 2-year overall survival rates from 22% to 35% and 4% to 9%, respectively.7 Therefore, it is important to advance the personalized treatment to improve the prognosis of pancreatic cancer, and exploring gene expression or biomarkers might be a suitable way to improve the diagnosis and treatment of pancreatic cancer.
In this study, pancreatic cancer data were downloaded from The Cancer Genome Atlas (TCGA) database and divided into different subgroups according to gene expression. According to these efforts, we hope to provide precise therapeutic options for pancreatic cancer patients and improve their prognoses.
Patients and methods
Data collection
The level 3 expression profile data of pancreatic cancers (IlluminaHiSeq_RNASeq platform), including 183 samples with corresponding clinical information (Table S1), were downloaded from TCGA and normalized with z-score.8 Among these samples, 178 of them were primary pancreatic cancers and analyzed in the current study.
Pancreatic cancer-related genes were downloaded from the Online Mendelian Inheritance in Man (OMIM) database (Supplementary file 1),9 including 132 Entrez gene IDs, gene name, MIM number, and chromosome location (Supplementary materials).
In silico analysis
All pancreatic cancer samples were analyzed by unsupervised hierarchical clustering to explore the optimal number of molecular subgroups with Euclidean distance matrices and the average linkage method (Supplementary materials).10–12 Clinical information of samples in different subgroups was statistically analyzed (Supplementary materials). Furthermore, chemotherapeutic drugs in different subgroups of pancreatic cancer patients were also calculated and analyzed to further confirm the specific characteristics in each subgroup identified in the current study. Chemotherapeutic drug-associated information was downloaded from the TCGA-pancreatic cancer database, and samples with complete therapeutic methods were screened out and analyzed in the current study. For samples <2 in each, Irinotecan, ABRAXANE, Chemo, NOS, capecitabine, cisplatin, and Eloxatin were categorized in “the other group”.
Genes belonged to a particular subgroup was confirmed with a Student’s t-test (Supplementary materials).13 Each subgroup was thus assigned a specific gene set (Supplementary materials), which was identified by comparing individual genes among different cancer subgroups (Supplementary materials). KEGG pathway enrichment analysis was performed using DAVID.14 Then, enriched KEGG pathways for each subgroup was calculated.15 Finally, by comparing the degree of pathway deviation among different subgroups, functional pathways with specific alterations and genes involved were identified.
MicroRNA (miRNA)-long non-coding RNA (lncRNA)-mRNA co-expression analysis was performed,16 including the following relationships: mRNA-mRNA, miRNA-mRNA, lncRNA-mRNA, and lncRNA-miRNA. A composite regulatory network was constructed with the co-expression correlation; mRNA, miRNA, and lncRNA as nodes; and edges indicating their correlations (Supplementary materials).11,17
Results
Unsupervised cluster analysis identified three subgroups in pancreatic cancer samples
Unsupervised hierarchical clustering analysis of 178 pancreatic cancer patients was conducted with the 107 pancreatic cancer-related genes downloaded from OMIM. These pancreatic cancer samples were divided into three subgroups based on differences of molecular signatures (Figure 1). Specifically, subgroup 1 contained 84 samples, subgroup 2 contained 80 samples, and subgroup 3 contained 14 samples. Patients of subgroups were relatively mutually indenpendent and highly clustered in each intra-subgroup. Therefore, pancreatic cancer patients could be divided into three subgroups based on molecular differences.
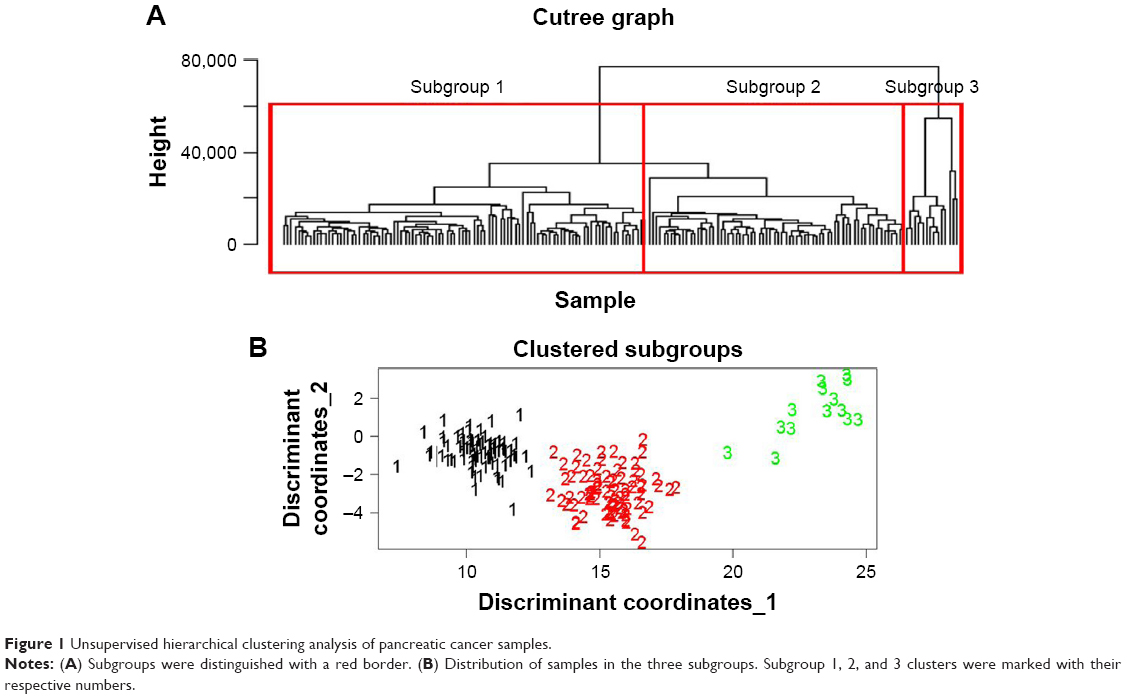 | Figure 1 Unsupervised hierarchical clustering analysis of pancreatic cancer samples. |
Subgroup-specific clinical features were confirmed
To investigate the molecular differences among the three subgroups, associated clinical manifestations, typical characterization, and therapeutic indicators of samples were analyzed (Supplementary file 2), including sex, history of smoking and alcohol consumption, pancreatitis and other malignant tumors, tumor diameter, staging, treatment response (Figure 2), and survival times (Figure S1).
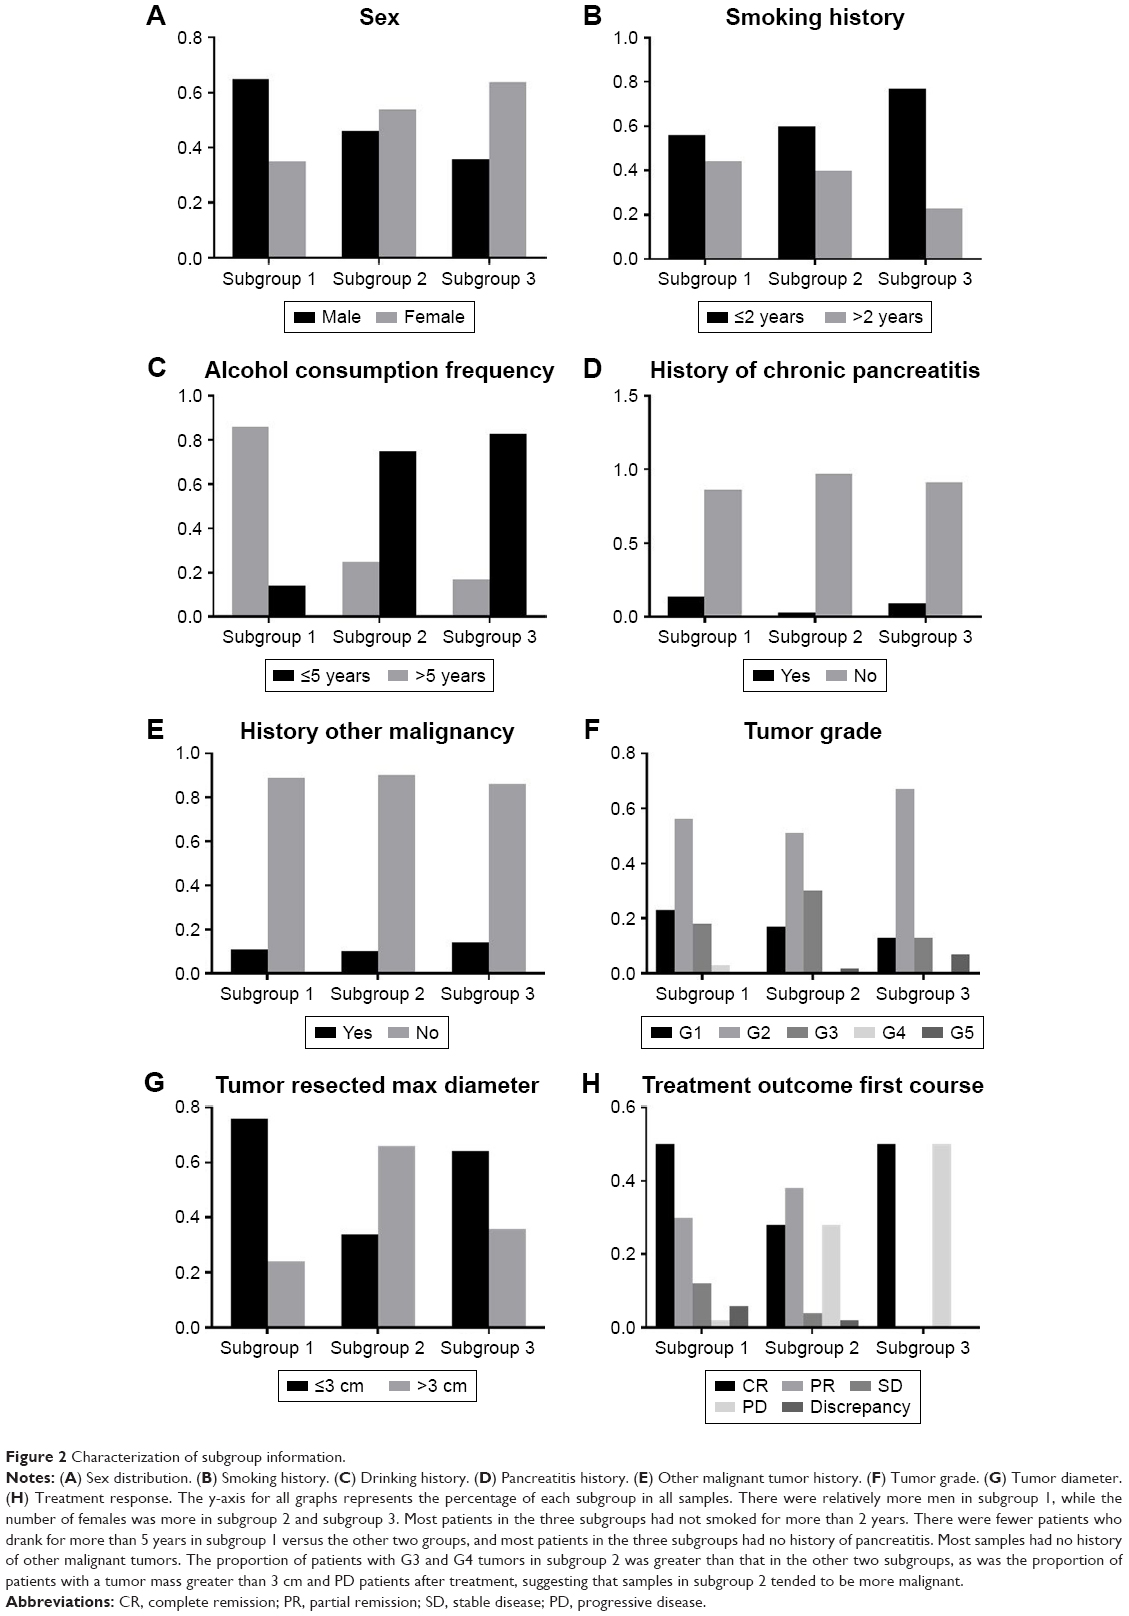 | Figure 2 Characterization of subgroup information. |
The three pancreatic cancer subgroups differed not only in the functional level but also in terms of lifestyle, tumor properties, and therapeutic response. These results were of great importance for the development of individualized treatment, clinical medication guidance, as well as for the identification of different molecular subgroups.
The chemotherapeutic drugs in these three subgroups were also analyzed (Figure 3). Specifically, gemcitabine was the most prevalent drug in all subgroups, followed by 5-Fu and oxaliplatin. Moreover, usage percentage of 5-Fu in subgroup 1 (58.3%) was obviously higher than that in subgroup 2 (33.3%) and subgroup 3 (8.3%). Subgroup 2 (48.0%) had a comparable usage percentage of gemcitabine to subgroup 1 (42.7%), which was obviously higher than that in subgroup 3 (9.3%). In addition, oxaliplatin was another common drug used in subgroup 2 (60%), followed by subgroup 1 (30.0%) and subgroup 2 (10.0%).
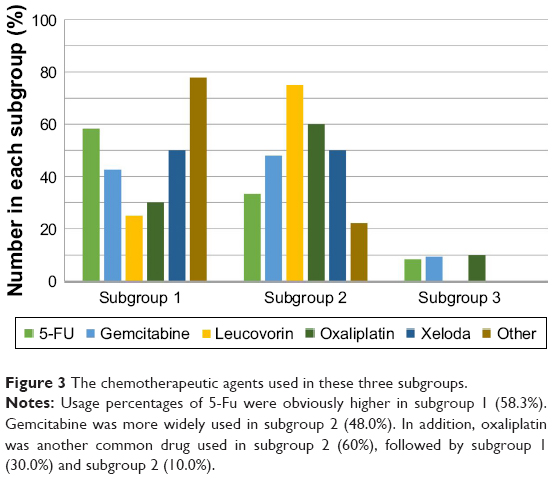 | Figure 3 The chemotherapeutic agents used in these three subgroups. |
Distribution of specific genes
Pancreatic cancer-related genes were distributed based on their mean expression in the three subgroups (Supplementary file 3) (Supplementary file 4). Then, three subgroup-specific gene sets were obtained, and contained 33, 34, and 19 genes, respectively. The number of specific genes shared by subgroup 1 and subgroup 2 was 31, subgroup 2 and subgroup 3 was 17, and subgroup 1 and subgroup 3 was 16. The number of overlapping genes of the three subgroups was 14 (Figure S2). These genes were shared by at least two subgroups and had significantly different expression levels making them specific for those subgroups.
Functional annotation analysis of specific genes
The KEGG pathway function of all specific genes was analyzed to study the mechanisms of drug resistance shared by different subgroups. As a result, 16 functional channels were obtained (Table S2). The biological functional analysis of specific genes in the three subgroups showed that most functioned in the regulation of cell interactions, including cytokine receptor interactions, gap junctions, Notch signaling, and other signaling pathways (eg, STAT, GnRH, and MAPK). STAT signaling was one of the most significant pathways and involved five genes: CDKN2A, BRAF, TP53, BCG2, and PIK3Cα. In addition, gonadotropin-releasing hormone and mitogen-activated protein kinase signaling pathways were shown to be associated with chemotherapeutic resistance, indicating the importance of distinguishing these pancreatic cancer subgroups at the molecular level to develop targeted and personalized treatments that improve therapeutic outcomes.
Pathway deviation score
Pathway-specific genes were integrated, and function enrichment analysis was conducted. A total of 16 pathways were screened out (Table S3). Deviation scores of 16 pathways in different subgroups were determined. After logarithmic conversion, a higher deviation score indicated a greater pathway deviation from the normal level, indicating a more abnormal pathway function. To more intuitively compare the three subgroups, the function of each pathway was visualized with a radar map (Figure 4).
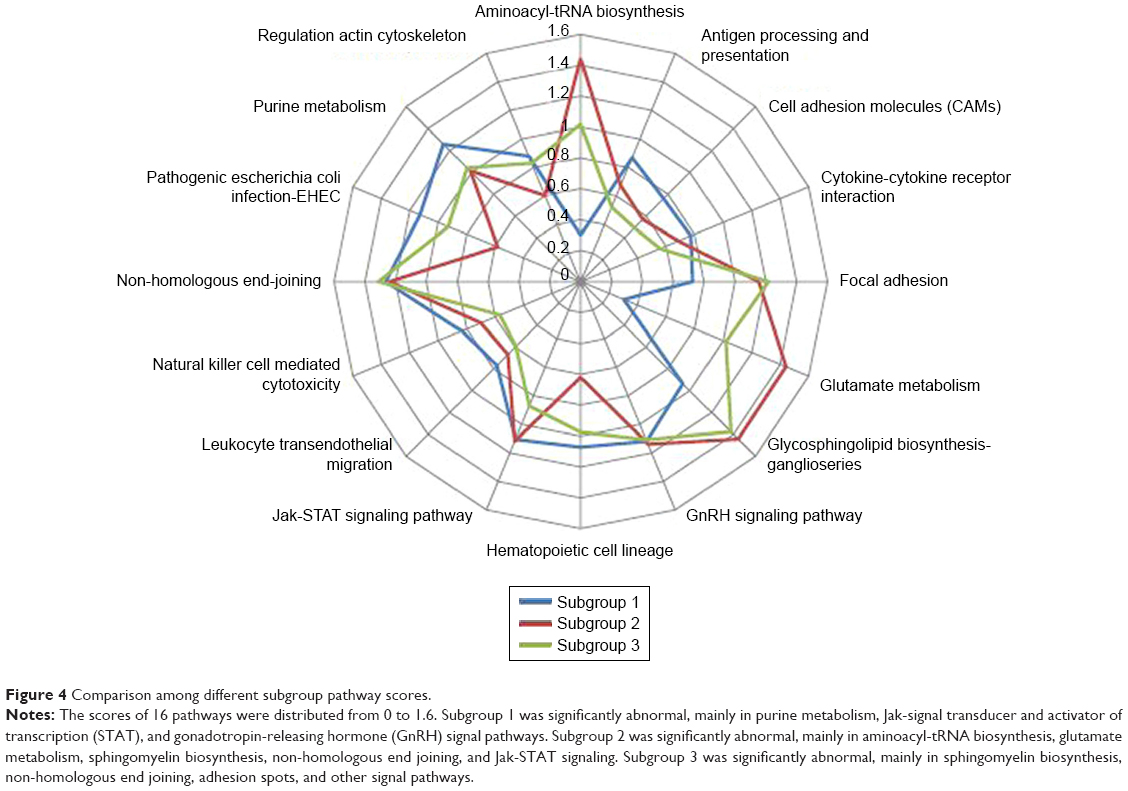 | Figure 4 Comparison among different subgroup pathway scores. |
Diagnostic and prediction models based on specific pathways
With 16 specific pathways as features and the deviation score in each sample as eigenvalues (Supplementary materials, Formula 2), a boxplot was created to visually compare the function of each pathway in these three pancreatic cancer subgroups (Figure S3).
To validate whether these significant differences in the functional pathways could effectively distinguish different subgroups of pancreatic cancer patients, a support vector machine classification model was created, and its receiver operating characteristic curve was drawn by cross-validation with average area under curve of 0.84, indicating a promising distinguishing ability (Figure S4).
Analysis of multiple omics data
Combining functional analysis with the molecular classification of each subgroup confirmed that each subgroup had significantly different functional levels. While subgroup-specific genes were found to be abnormal at the transcriptional level, the cause of these abnormalities at the sequence level generally stemmed from copy number variation, gene mutation, and epigenetic regulation (eg, methylation). Therefore, these data were integrated into the analysis to identify subgroup-specific gene variations.
Thirteen out of 14 intersection genes showed copy number variation (Table S4). After a 2-based logarithmic conversion, gene copy numbers were analyzed and averaged in each subgroup with the criteria of −1 for genes with reduced copy numbers, 1 for genes with increased copy numbers, and 0 for genes with no copy number alterations. The results showed that 8 out of 13 genes in subgroup 1 had increased copy number variations and 5 had reduced variations; 5 out of 13 genes in subgroup 2 had increased expression and 8 had reduced changes; 7 of 13 genes in subgroup 3 had increased, 4 had reduced, and 2 had normal expression.
Of the 14 intersected genes shared by these three subgroups, 6 genes had altered methylation levels (Table S5). The methylation score of genes in subgroup 2 was higher than that in the other two subgroups, suggesting that the malignancy in subgroup 2 was higher than that in subgroups 1 and 3. To investigate whether gene copy number and methylation alterations directly affected gene transcriptome, the correlation between them and the transcriptome was analyzed (Tables S6 and S7).
Correlations among copy number variation, methylation, and transcript groups are shown in Tables S6 and S7. Seven of 13 genes with copy number variations showed similarity at the copy number and transcript level (R >0.5) and both were positively correlated, suggesting that the copy number of these 7 genes (increased or decreased) was a positive control for these transcripts. Three out of 6 methylated mutation-associated genes showed significant negative correlation (R <−0.5), suggesting that increased methylation repressed transcript expression. Therefore, highly methylated tumor suppressor genes were likely to cause tumorigenesis due to lack of function. Genes not related with the transcript group in copy number and methylation level might be controlled by various regulatory factors such as lncRNA, miRNA, acetylation, mutation, and SNPs.
Co-expression analysis of miRNA-lncRNA-mRNA
Nodes (840) and sides (8322) were finally obtained using Pearson correlation analysis, including 76 mRNAs, 559 miRNAs, and 205 lncRNAs. In the complex regulatory network, miRNAs had a more dominant regulatory effect. The co-expression correlation among multiple miRNAs also reflected the biological coherence of these miRNAs involved in regulating certain important genes or functions. The composite control network is shown in Figure 5.
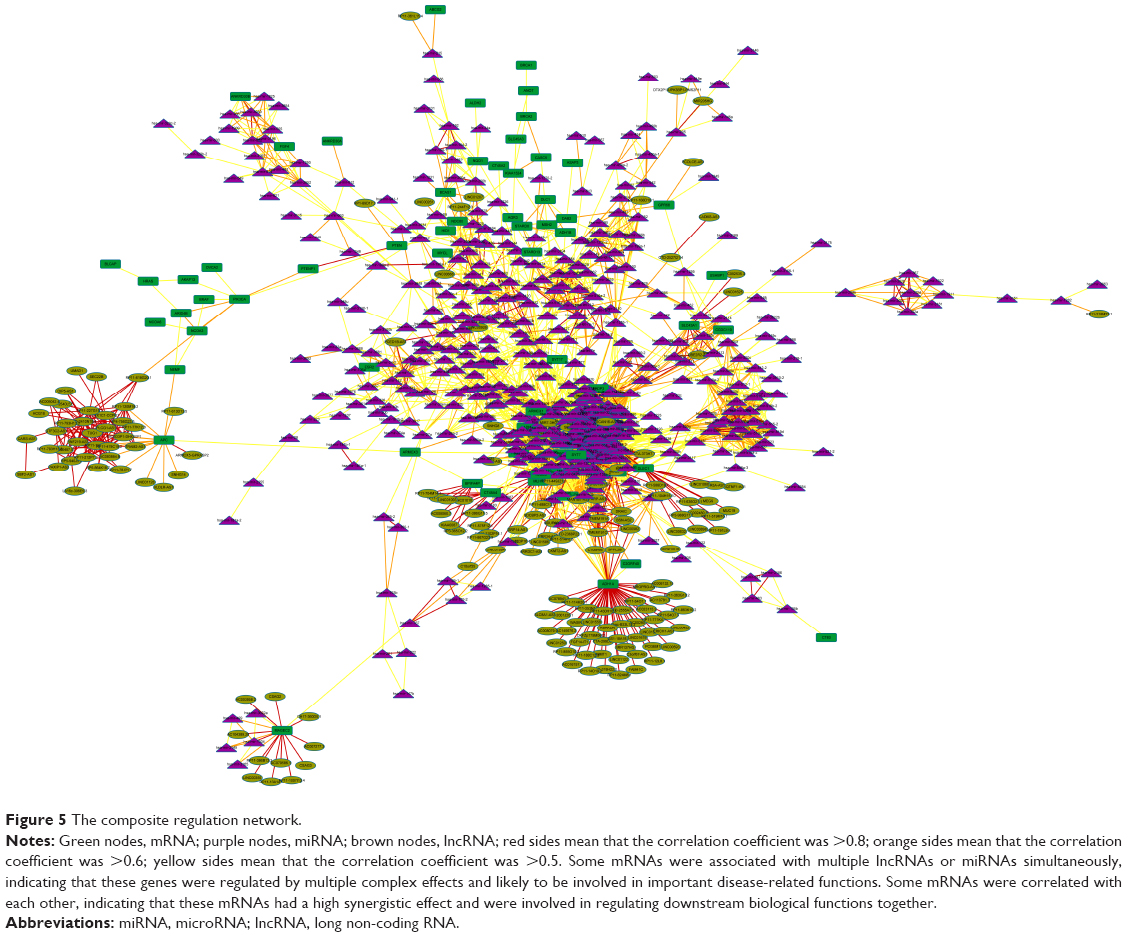 | Figure 5 The composite regulation network. |
The topological property of complex network was analyzed, and the top 10 mRNA with highest degrees are listed in Table S8. Compared to the average level, the top 10 mRNAs had higher node degree distributions, clustering coefficients, adjacent nodes, and topological coefficients but lower mean distances in the network, suggesting that these mRNAs had more important central roles in the complex regulatory network and might be important molecular markers for distinguishing these three pancreatic cancer subgroups and their pathological mechanisms.
Discussion
According to these three different molecular subgroups of pancreatic cancer identified in the present study, analysis of subgroup-specific clinical features was performed, and significant statistical differences in sex distribution, drinking history, tumor grade and diameter, and treatment response were confirmed. There were no statistically significant differences in the overall survival among these three pancreatic cancer subtypes, partly because 120 out of 178 patients missing survival data. Further in silico analysis revealed that alterations of gene expressions, copy numbers, methylation status, and functional pathways might contribute to the abovementioned subgroup-specific clinical features and suggested that treatment tailored to each subgroup should improve the prognosis of pancreatic cancer patients.
Pancreatic cancer-related genes were obtained from the OMIM database and analyzed by unsupervised hierarchical classification to obtain subgroups with significant molecular differences. Combined with functional analysis, multi-omics analysis, and co-expression analysis, important specific molecular markers and functional pathways were identified. Using a supervised support vector machine classifier and clinical features, these pathways were validated to effectively distinguish pancreatic cancer samples among the three subgroups and determine significant differences in clinical features that might be important for the development of personalized treatment for pancreatic cancer patients.
The quantitative evaluation of functional pathways was obtained by the deviation score algorithm, and a total of 16 pathways were screened out. Most pathways were deeply involved in cancer development with the promotion of proliferation, invasion, and metastasis. In particular, cell adhesion molecules,18,19 focal adhesion,20–27 and Jak-STAT signaling were found to be crucial pathways in pancreatic cancers.28–32 These functional pathways showed significant differences among the three subgroups, and the patterns of change were also different. For example, cytokine-cytokine receptor interactions were lower in subgroup 2 but higher in subgroup 3, while non-homologous end joining was higher in subgroup 2 but lower in subgroup 3. In addition, the convergence of each pathway showed significant difference. For example, cell adhesion molecules in the three subgroups were relatively discrete with a large variance, and regulation of actin cytoskeleton was relatively more convergent with a small variance. Furthermore, the pattern of alteration among the different pathways was significantly specific and likely related to the consistency of the molecular alterations of patients from different subgroups. The good convergent function suggests the more consistency and the more effective to evaluate the disease process or prognosis in different subgroups.
Gene copy number variation and methylation status are also important features associated with the biological behavior and prognosis of pancreatic cancer.33–36 Understanding the biological function of these particular genes and gene sets is very important for the development of individualized treatments. In the current multidisciplinary data integration analysis, copy number variation and the methylation spectrum were evaluated and their correlation with transcript group data was analyzed to find genes with consistent changes. These genes were likely to be associated with the occurrence of pancreatic cancer either at the chromosomal or at the epigenetic level. Genes that could not be explained by copy number or methylation variation were more likely to come from alterations at the regulatory level.
To explore gene changes at the regulatory level, mRNA, miRNA, and lncRNA co-expression correlations were integrated and analyzed, and a complex regulatory network was built. Some lncRNAs, such as MEG3,37,38 play important roles in pancreatic cancer development. A further topological analysis of the network created herein revealed that some mRNAs, which are transcriptionally regulated by multiple miRNAs or lncRNAs, such as TUSC3,39 might be important hub genes and valuable therapeutic targets or diagnostic markers closely related to pancreatic cancer.
Nonetheless, the current subgroup analysis based on TCGA data will likely provide more precise treatment choices and better prognoses for pancreatic cancer patients.
Conclusion
Three distinct subgroups of pancreatic cancer were identified, which means that patients in each subgroup might benefit from targeted and individual disease management. Our findings provide better understanding of the pathogenesis of pancreatic cancer, and valuable information of individualized therapeutic choice for pancreatic cancer patients.
Acknowledgments
We thank Yuan Yuan for critical advice and improvement of the manuscript. We also thank Wei Song for technical assistance.
Disclosure
The authors report no conflicts of interest in this work.
References
Nayar P, Chandak A, Gupta N, et al. Postoperative mortality following multi-modality therapy for pancreatic cancer: analysis of the SEER-Medicare data. J Surg Oncol. 2017;115(2):158–163. | ||
Sun H, Ma H, Hong G, Sun H, Wang J. Survival improvement in patients with pancreatic cancer by decade: a period analysis of the SEER database, 1981–2010. Sci Rep. 2014;4:6747. | ||
Miller KD, Siegel RL, Lin CC, et al. Cancer treatment and survivorship statistics, 2016. CA Cancer J Clin. 2016;66(4):271–289. | ||
Opfermann KJ, Wahlquist AE, Garrett-Mayer E, Shridhar R, Cannick L, Marshall DT. Adjuvant radiotherapy and lymph node status for pancreatic cancer: results of a study from the Surveillance, Epidemiology, and End Results (SEER) Registry Data. Am J Clin Oncol. 2014;37(2):112–116. | ||
Masui T, Doi R, Kawaguchi Y, et al. Concurrent gemcitabine+S-1 neoadjuvant chemotherapy contributes to the improved survival of patients with small borderline-resectable pancreatic cancer tumors. Surg Today. 2016;46(11):1282–1289. | ||
Oettle H, Post S, Neuhaus P, et al. Adjuvant chemotherapy with gemcitabine vs observation in patients undergoing curative-intent resection of pancreatic cancer: a randomized controlled trial. JAMA. 2007;297(3):267–277. | ||
Von Hoff DD, Ervin T, Arena FP, et al. Increased survival in pancreatic cancer with nab-paclitaxel plus gemcitabine. N Engl J Med. 2013;369(18):1691–1703. | ||
Foo LC, Mafauzy M. Does the use of mean or median Z-score of the thyroid volume indices provide a more precise description of the iodine deficiency disorder status of a population? Eur J Endocrinol. 1999;141(6):557–560. | ||
Martelli PL, Fariselli P, Savojardo C, Babbi G, Aggazio F, Casadio R. Large scale analysis of protein stability in OMIM disease related human protein variants. BMC Genomics. 2016;17 Suppl 2:397. Available from: https://bmcgenomics.biomedcentral.com/articles/10.1186/s12864-016-2726-y. Accessed August 21, 2018. | ||
Taamneh M, Taamneh S, Alkheder S. Clustering-based classification of road traffic accidents using hierarchical clustering and artificial neural networks. Int J Inj Contr Saf Promot. 2017;24(3):388–395. | ||
Ghosh A, Barman S. Application of Euclidean distance measurement and principal component analysis for gene identification. Gene. 2016;583(2):112–120. | ||
Liu CH, Li M, Feng YQ, Hu YJ, Yu BY, Qi J. Determination of Ruscogenin in Ophiopogonis Radix by high-performance liquid chromatography-evaporative light scattering detector coupled with hierarchical clustering analysis. Pharmacogn Mag. 2016;12(45):13–20. | ||
Lu K. Distribution of the two-sample t-test statistic following blinded sample size re-estimation. Pharm Stat. 2016;15(3):208–215. | ||
Gonçalves L, Filipe M, Marques S, Salgueiro AM, Becker JD, Belo JA. Identification and functional analysis of novel genes expressed in the Anterior Visceral Endoderm. Int J Dev Biol. 2011;55(3):281–295. | ||
Chen X, Liu L, Wang Y, et al. Identification of breast cancer recurrence risk factors based on functional pathways in tumor and normal tissues. Oncotarget. 2017;8(13):20679–20694. | ||
Mori K, Haraguchi S, Hiori M, Shimada J, Ohmori Y. Tumor-associated macrophages in oral premalignant lesions coexpress CD163 and STAT1 in a Th1-dominated microenvironment. BMC Cancer. 2015;15:573. | ||
Soul J, Dunn SL, Hardingham TE, Boot-Handford RP, Schwartz JM. PhenomeScape: a cytoscape app to identify differentially regulated sub-networks using known disease associations. Bioinformatics. 2016;32(24):3847–3849. | ||
Gebauer F, Wicklein D, Horst J, et al. Carcinoembryonic antigen-related cell adhesion molecules (CEACAM) 1, 5 and 6 as biomarkers in pancreatic cancer. PLoS One. 2014;9(11):e113023. | ||
Arcangeli A, Crociani O, Bencini L. Interaction of tumour cells with their microenvironment: ion channels and cell adhesion molecules. A focus on pancreatic cancer. Philos Trans R Soc Lond B Biol Sci. 2014;369(1638):20130101. | ||
Che P, Yang Y, Han X, et al. S100A4 promotes pancreatic cancer progression through a dual signaling pathway mediated by Src and focal adhesion kinase. Sci Rep. 2015;5:8453. | ||
Furuyama K, Doi R, Mori T, et al. Clinical significance of focal adhesion kinase in resectable pancreatic cancer. World J Surg. 2006;30(2):219–226. | ||
Gogate PN, Kurenova EV, Ethirajan M, et al. Targeting the C-terminal focal adhesion kinase scaffold in pancreatic cancer. Cancer Lett. 2014;353(2):281–289. | ||
Okamoto H, Kusama T, Fujii H. Tyrosine phosphorylation of focal adhesion anchoring proteins enhances human pancreatic cancer cell invasion. Pancreas. 2016;45(7):e37–e39. | ||
Pham H, Chen M, Takahashi H, et al. Apigenin inhibits NNK-induced focal adhesion kinase activation in pancreatic cancer cells. Pancreas. 2012;41(8):1306–1315. | ||
Sawai H, Okada Y, Funahashi H, et al. Activation of focal adhesion kinase enhances the adhesion and invasion of pancreatic cancer cells via extracellular signal-regulated kinase-1/2 signaling pathway activation. Mol Cancer. 2005;4:37. | ||
Stokes JB, Adair SJ, Slack-Davis JK, et al. Inhibition of focal adhesion kinase by PF-562,271 inhibits the growth and metastasis of pancreatic cancer concomitant with altering the tumor microenvironment. Mol Cancer Ther. 2011;10(11):2135–2145. | ||
Ucar DA, Dang LH, Hochwald SN: Focal adhesion kinase signaling and function in pancreatic cancer. Front Biosci (Elite Ed). 2011;3:750–756. | ||
Doi T, Ishikawa T, Okayama T, et al: The JAK/STAT pathway is involved in the upregulation of PD-L1 expression in pancreatic cancer cell lines. Oncol Rep. 2017;37(3):1545–1554. | ||
Lu C, Talukder A, Savage NM, Singh N, Liu K. JAK-STAT-mediated chronic inflammation impairs cytotoxic T lymphocyte activation to decrease anti-PD-1 immunotherapy efficacy in pancreatic cancer. Oncoimmunology. 2017;6(3):e1291106. | ||
Palagani V, Bozko P, El Khatib M, et al. Combined inhibition of Notch and JAK/STAT is superior to monotherapies and impairs pancreatic cancer progression. Carcinogenesis. 2014;35(4):859–866. | ||
Thoennissen NH, Iwanski GB, Doan NB, et al. Cucurbitacin B induces apoptosis by inhibition of the JAK/STAT pathway and potentiates antiproliferative effects of gemcitabine on pancreatic cancer cells. Cancer Res. 2009;69(14):5876–5884. | ||
Macha MA, Rachagani S, Gupta S, et al. Guggulsterone decreases proliferation and metastatic behavior of pancreatic cancer cells by modulating JAK/STAT and Src/FAK signaling. Cancer Lett. 2013;341(2):166–177. | ||
Huang L, Yu D, Wu C, et al. Copy number variation at 6q13 functions as a long-range regulator and is associated with pancreatic cancer risk. Carcinogenesis. 2012;33(1):94–100. | ||
Kisiel JB, Raimondo M, Taylor WR, et al. New DNA methylation markers for pancreatic cancer: discovery, tissue validation, and pilot testing in pancreatic juice. Clin Cancer Res. 2015;21(19):4473–4481. | ||
Thompson MJ, Rubbi L, Dawson DW, Donahue TR, Pellegrini M. Pancreatic cancer patient survival correlates with DNA methylation of pancreas development genes. PLoS One. 2015;10(6):e0128814. | ||
Xiao Q, Zhou D, Rucki AA, et al. Cancer-associated fibroblasts in pancreatic cancer are reprogrammed by tumor-induced alterations in genomic DNA methylation. Cancer Res. 2016;76(18):5395–5404. | ||
Gu L, Zhang J, Shi M, Zhan Q, Shen B, Peng C. lncRNA MEG3 had anti-cancer effects to suppress pancreatic cancer activity. Biomed Pharmacother. 2017;89:1269–1276. | ||
Hu D, Su C, Jiang M, et al. Fenofibrate inhibited pancreatic cancer cells proliferation via activation of p53 mediated by upregulation of LncRNA MEG3. Biochem Biophys Res Commun. 2016;471(2):290–295. | ||
Fan X, Zhang X, Shen J, et al. Decreased TUSC3 promotes pancreatic cancer proliferation, invasion and metastasis. PLoS One. 2016;11(2):e0149028. |
 © 2018 The Author(s). This work is published and licensed by Dove Medical Press Limited. The full terms of this license are available at https://www.dovepress.com/terms.php and incorporate the Creative Commons Attribution - Non Commercial (unported, v3.0) License.
By accessing the work you hereby accept the Terms. Non-commercial uses of the work are permitted without any further permission from Dove Medical Press Limited, provided the work is properly attributed. For permission for commercial use of this work, please see paragraphs 4.2 and 5 of our Terms.
© 2018 The Author(s). This work is published and licensed by Dove Medical Press Limited. The full terms of this license are available at https://www.dovepress.com/terms.php and incorporate the Creative Commons Attribution - Non Commercial (unported, v3.0) License.
By accessing the work you hereby accept the Terms. Non-commercial uses of the work are permitted without any further permission from Dove Medical Press Limited, provided the work is properly attributed. For permission for commercial use of this work, please see paragraphs 4.2 and 5 of our Terms.