")
Back to Journals » Clinical Ophthalmology » Volume 13
Subfoveal choroidal thickness in diabetic macular edema
Authors Mohamed DM, Hassan NA, Osman AA, Osman MH
Received 2 March 2019
Accepted for publication 10 May 2019
Published 31 May 2019 Volume 2019:13 Pages 921—925
DOI https://doi.org/10.2147/OPTH.S207376
Checked for plagiarism Yes
Review by Single anonymous peer review
Peer reviewer comments 2
Editor who approved publication: Dr Scott Fraser
Dalia Mohamed Fawzy Mohamed,1 Nihal Adel Hassan,2 Amr Abdellatif Osman,2 Moataz Hamed Osman2
1Department of Ophthalmology, National Institute of Diabetes, Cairo, Egypt; 2Faculty of Medicine, Cairo University, Giza, Egypt
Purpose: To evaluate subfoveal choroidal thickness (SFCT) in eyes with diabetic macular edema (DME) using spectral domain OCT (SD-OCT).
Materials and methods: Ninety eyes were divided into three equal groups: group A, non-proliferative diabetic retinopathy (NPDR) with no DME; group B, NPDR having DME; and group C, non-diabetic patients. The central subfield retinal thickness (CSRT) and SFCT were measured using spectral domain OCT.
Results: There was a moderate negative correlation between age and SFCT in group B (r=−0.455, P=0.012). We found no significant correlation between best corrected visual acuity (BCVA) and SFCT in all groups (for groups A, B, and C, respectively: r=0.189, P=0.316; r=−0.195, P=0.302; and r=−0.181, P=0.337). There was no significant correlation between duration of diabetes and SFCT (r=−0.118, P=0.534 and r=−0.136, P=0.475 for groups A and B, respectively). The CSRT was 229.13±16.2, 336.4±74.85, and 223.13±16.9 μm in groups A, B, and C, respectively. The mean SFCT was 260.6±49.2, 259±50.8, and 252±50 μm in groups A, B, and C, respectively. We found no significant correlation between CSRT and SFCT in all groups (for groups A, B, and C, respectively: r=−0.049, P=0.796, r=0.239, P=0.204, r=−0.021, P=0.914). There was no significant difference in SFCT between group B (DME) on one hand and groups A and C on the other hand (P=0.9 and 0.59, respectively).
Conclusion: There is no significant correlation between CSRT and SFCT in DME. Choroidal thickness assessment is not an indicator of the severity of DME and cannot be used as a monitor of its progression.
Keywords: diabetic retinopathy, macular edema, optical coherence tomography, choroidal thickness, diabetes
Introduction
Diabetes is a metabolic disorder affecting the ocular vasculature. Although the principal posterior segment changes in diabetes usually occur in the retinal vasculature, additional changes are also observed in the choroid which provides an important blood supply to the outer retina. Diabetic choroidopathy involves choroidal abnormalities occurring in diabetic patients and may participate in mechanisms that lead to the decrease of visual acuity.1
Several studies demonstrated the possibility of imaging of the choroid using spectral-domain OCT.2–6 Many studies investigated variation in the choroidal thickness (CT) occurring with changes in age3,4 and axial length,5 or in different ocular diseases.6 Diabetic macular edema (DME) is a major cause of visual loss in diabetic patients.6 There are large differences in the results of papers studying choroidal thickness in patients having DME. Some studies showed that the mean subfoveal choroidal thickness (SFCT) was significantly reduced in these patients6,7 while others reported that SFCT was thicker.1,8
In this OCT study, subfoveal choroidal thickness in eyes with DME was compared to normal and non-proliferative diabetic retinopathy (NPDR) eyes having no DME. We also assessed the correlation between SFCT and central subfield retinal thickness (CSRT) in eyes with diabetic macular edema. We aimed to find if the SFCT can be used as an indicator of the severity of DME or not and if it can be used to monitor DME progression.
Materials and methods
This study was performed on 90 eyes of 90 patients at the National Institute of Diabetes in Egypt under the supervision of Cairo University ophthalmology department. A written consent form was obtained from all patients. The National Institute of Diabetes ethics review board approved the protocol. The study was conducted in accordance with the principles of the Declaration of Helsinki. This study included patients with age ranging between 30 and 60 years. Eyes were divided into three equal groups: group A included 30 eyes of 30 type 2 diabetic patients with non-proliferative diabetic retinopathy (NPDR) having no macular edema, group B included 30 eyes of 30 type 2 diabetic patients with NPDR having diabetic macular edema (DME) while group C included 30 eyes of 30 non-diabetic cases as a control group. DME was detected at the fovea (500 µm region) by OCT as a diffuse thickening of 300 μm or more or presence of cystic change or serous retinal detachment.
Exclusion criteria were presence of proliferative diabetic retinopathy (PDR), macular scar, macular ischemia detected by fundus fluorescein angiography, previous laser treatment or intravitreal injection, significant cataract (which does not allow fundus examination), any previous intra-ocular surgery, other causes of retinopathies such as renal disease and hypertension, and presence of refractive errors of more than ±4.0 diopters, because CT may change with refractive state.
We recorded demographic and clinical data of all patients including age, gender, duration of diabetes in years, hemoglobin A1c (HBA1c) and best corrected visual acuity (BCVA) in decimal. Fundus examination using slit-lamp biomicroscopy with a 90 D and fluorescein angiography using a fundus camera (model FF 450; Carl Zeiss Meditec, Jena, Germany) were done for all diabetic patients after pupil dilatation.
SD-OCT (Retinascan RS-3000 advance; NIDEK, Gamagori, Japan) was done for all cases to measure central subfield retinal thickness in retinal mode SFCT in choroidal mode (Figure 1). The SFCT was measured as a perpendicular line from the outer limit of the hyperreflective line (RPE), to the line representing sclero-choroidal interface (Figure 2). OCT was done for all cases between 8 am and 10 am to avoid the effect of diurnal variation of CT.
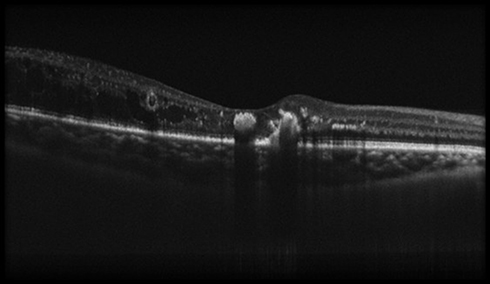 | Figure 1 OCT macula done in choroidal mode showing sclero-choroidal interface. |
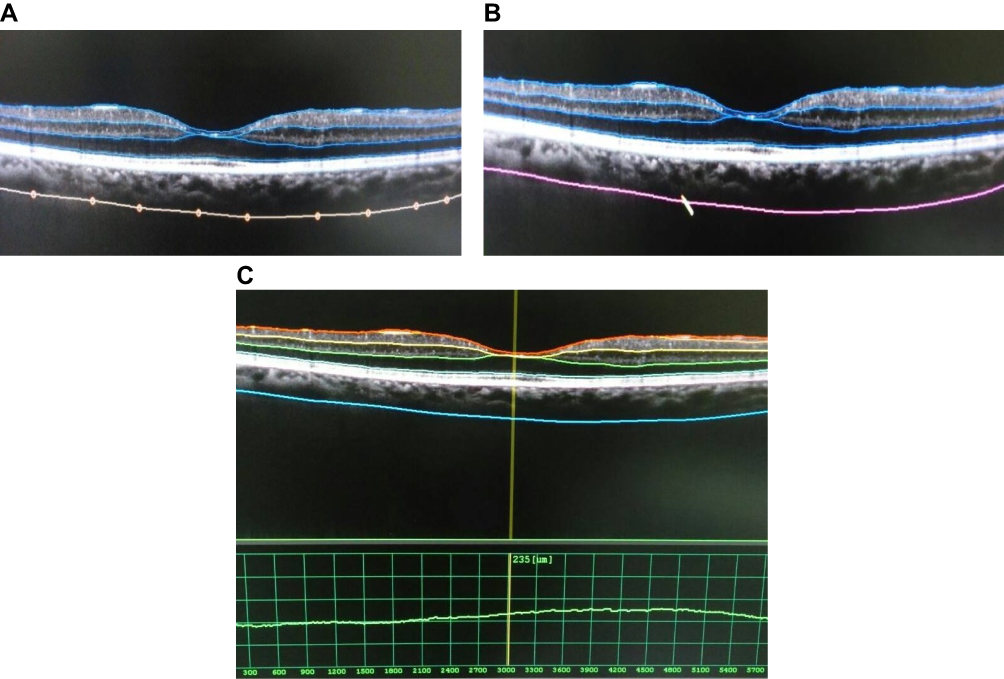 | Figure 2 Measurement of choroidal thickness. (A) The sclero-choroidal interface is marked manually. (B) The line connects the marked points automatically by the software. (C) Measurement is done automatically between the outer choroid line and retinal pigment epithelium. |
Statistical analysis
All data were expressed as mean ± SD. P-values of less than 0.05 were considered significant. Descriptive statistics were used for illustrating the mean and standard deviation of quantitative data. Comparison of means to check for statistically significant difference for different variables was conducted using the unpaired t-test for continuous independent variables. Pearson correlation was used to calculate the correlation between different variables. All data were computed and conducted using the SPSS (version 20) (IBM Corporation, Armonk, NY, USA).
Results
This study included 30 eyes of 30 patients in each group. Male percentages were 73%, 43% and 57% in groups A, B, and C, respectively. The mean HbA1c level in DME patients was 9.6±0.8 while in NPDR patients without edema was 9.6±0.9. The mean age in group A was 50.4±7.2 years while in groups B and C it was 53.2±5.8 and 44.6±7.1, respectively. Duration of diabetes was 11.5±4.8 years in group A and 11.6±4.5 years in group B. Best corrected visual acuity in decimal was 0.8±0.1, 0.5±0.3 and 0.998±0.019 in groups A, B, and C, respectively. Demographic and clinical data of the three groups are summarized in Table 1.
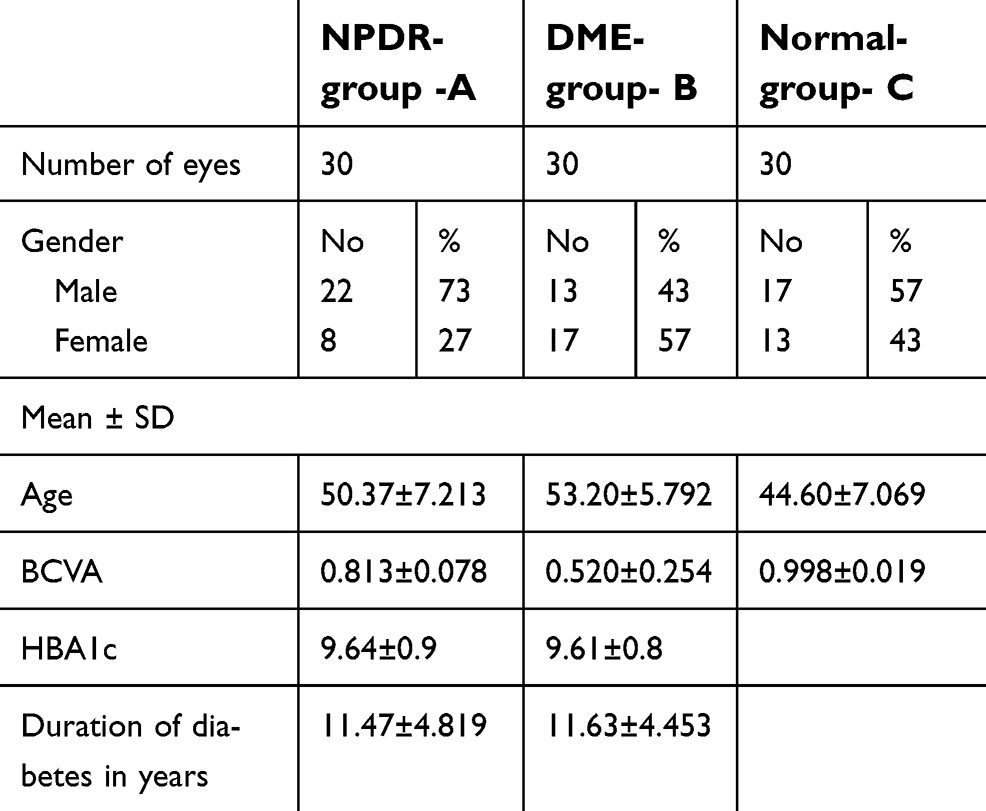 | Table 1 Demographic and clinical data of the three groups |
There was a moderate negative correlation between age and SFCT in group B (r=−0.455, P=0.012). No significant correlation was found between age and SFCT in the other two groups (r=−0.321, P=0.084 and r=−0.242, P=0.198 for groups A and C, respectively). We found no significant correlation between BCVA and SFCT in all groups (for groups A, B, and C, respectively: r=0.189, P=0.316; r=−0.195, P=0.302; and r=−0.181, P=0.337). There was no significant correlation between duration of diabetes and SFCT in all diabetic patients (r=−0.118, P=0.534 and r=−0.136, P=0.475 for groups A and B, respectively).
The mean central subfield retinal thickness (CSRT) was 229.13±16.2, 336.4±74.85, and 223.13±16.9 µm in groups A, B, and C, respectively. The mean SFCT was 260.6±49.2, 259±50.8, and 252±50 µm in groups A, B, and C, respectively. Data of the three groups are summarized in Table 2.
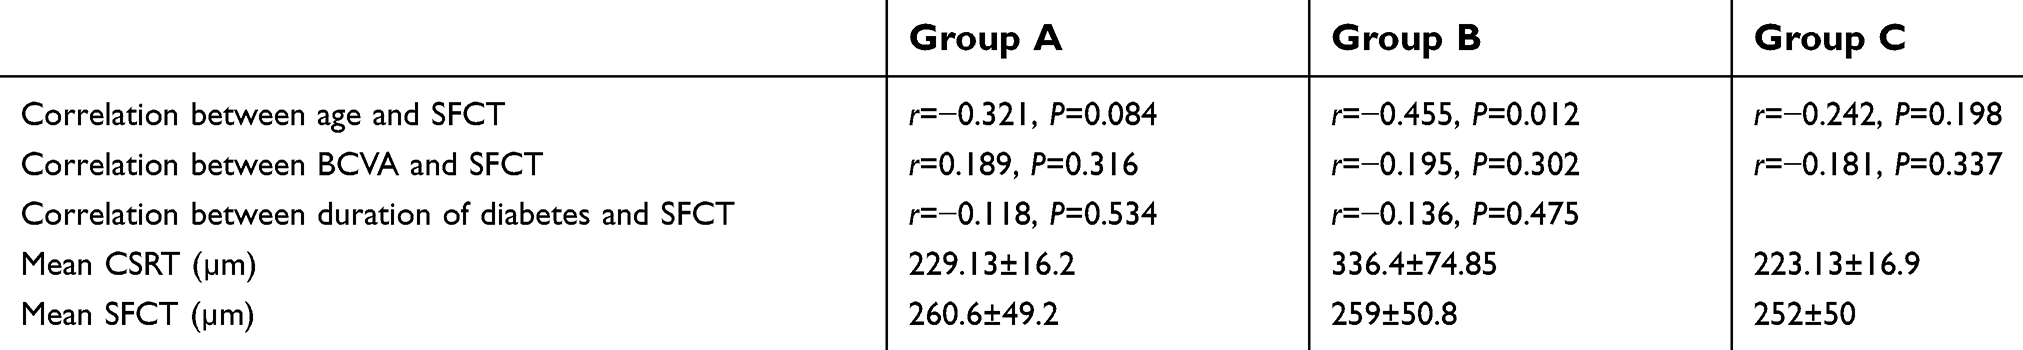 | Table 2 Data of the three groups |
Correlation between subfoveal choroidal thickness and central subfield retinal thickness in each group
We found no significant correlation between CSRT and SFCT in all groups (for groups A, B, and C, respectively: r=−0.049, P=0.796; r=0.239, P=0.204; and r=−0.021, P=0.914).
Comparison of SFCT between DME group and the other two groups
There is no significant difference in SFCT between group B (DME) on one hand and groups A and C on the other hand (P=0.9 and 0.59, respectively).
Discussion
Diabetic retinopathy is a microangiopathy of the retina that leads to capillary occlusion and leakage.9 Histologic examination of the choroid of diabetic eyes showed an increase in tortuosity, focal narrowing or dilation of vessels, presence of sinus-like structures between the choroidal lobules, capillary dropout, and focal scarring.10 Diabetic choroidopathy was also documented using indocyanine green angiography.11 Reliable choroidal thickness measurement can be performed using OCT utilizing different techniques to compensate for decreased signal strength posterior to the retinal pigment epithelium to visualize of the sclero-choroidal interface.1–6
In this work, we used high-speed SD-OCT to provide direct uninverted clear images of the choroid, which is different from the enhanced depth imaging technique. SD-Nidek RS-3000 works by averaging 50 B-scans in a single raster line using a light source of 880-nm wavelength. The device is positioned close to the eye to be close to the zero-delay line. We excluded any patient with refractive error more than ±4 diopters to avoid the decrease in CT which occurs with increased axial length.12 We also excluded other confounding factors including previous ocular laser or injection and PDR.
In this work, the correlation between age and SFCT in groups A and C was nonsignificant. Conversely, we found a statistically significant negative correlation between age and SFCT in group B (DME) which is consistent with results of many studies reporting reduction in CT occurring with increase in age.3,4
There is a great controversy regarding changes of SFCT in diabetic retinopathy and DME. Many studies reported a decrease in CT in diabetic eyes either unrelated to the stage of diabetic retinopathy (DR)7,13 or progressive decrease in CT with advance of the stage of DR.6,14–16 Conversely, Kim et al and Rewbury et al reported progressive thickening of the choroid with increasing severity of DR.8,17 Xu et al noted that diabetes mellitus led to mild choroidal thickening, but diabetic retinopathy is not associated with CT changes.18
We found no significant correlation between CSRT and SFCT in all groups. There is no significant difference in SFCT between group B (DME) on one hand and groups A and C on the other hand. This is consistent with some studies reporting no association between DME and CT.13,14,16 However, most authors related DME with decreased CT.6,7,15,19 On the other hand, Hua et al and Kim et al found that CT increases in eyes with DME.1,8
These contradicting results can be explained by the diversity of pathological changes occurring in diabetic eyes in different proportions, such as ischemia of different layers of the choroid, VEGF secretion and damage to outer blood-retinal barrier. Also, results are affected by different types of OCT devices using different imaging techniques, diurnal variation of CT and the amount of subretinal fluid. This great controversy in results, together with our results, allows us to conclude that CT assessment using OCT dose not actually reflect histological choroidal changes occurring in diabetic retinopathy and cannot be used as an indicator of the severity of DME or monitor its progression. Moreover, absence of significant correlation, in our study, between SFCT on one hand and BCVA and duration of diabetes, on the other hand, makes CT measurement unsuitable to be used as an indicator of clinical effect of diabetes on the eye.
Our study is limited by the small number of eyes in each group, so we could not study each type of DME separately. Another limitation is the manual measurement of a single point in absence of assessment of parafoveal choroidal points; however, we focused on the important subfoveal area that has the greatest impact on nutrition of foveal photoreceptors and vision. The average of CSRT in cases of DME enrolled in our study was 336.4±74.85 µm, which denotes that many of these cases had a mild degree of edema which may be similar to diabetic retinopathy with no edema. Further studies are needed to be done on cases with more severe edema.
Conclusion
Our results showed no apparent relationship between CSRT and SFCT in DME. SFCT in eyes with DME is not significantly different from eyes with no DME including NPDR and normal eyes. CT assessment using OCT is not an indicator of the severity of DME and cannot be used as a monitor of its progression. We recommend searching for other non-invasive tools of choroidal assessment which reliably demonstrate choroidal changes with DME.
Disclosure
The authors report no conflicts of interest in this work.
References
1. Hua R, Liu L, Wang X, Chen L. Imaging evidence of diabetic choroidopathy in vivo: angiographic pathoanatomy and choroidal-enhanced depth imaging. PLoS One. 2013;8(12):e83494. doi:10.1371/journal.pone.0083494
2. Imamura Y, Fujiwara T, Margolis R, Spaide RF. Enhanced depth imaging optical coherence tomography of the choroid in central serous chorioretinopathy. Retina. 2009;29:1469–1473. doi:10.1097/IAE.0b013e3181be0a83
3. Margolis R, Spaide RF. A pilot study of enhanced depth imaging optical coherence tomography of the choroid in normal eyes. Am J Ophthalmol. 2009;147(5):811–815. doi:10.1016/j.ajo.2008.12.008
4. Shin JW, Shin YN, Cho HY, Lee BR. Measurement of choroidal thickness in normal eyes using 3D OCT-1000 spectral domain optical coherence tomography. Korean J Ophthalmol. 2012;26(4):255–259. doi:10.3341/kjo.2012.26.4.255
5. Li XQ, Larsen M, Munch IC. Subfoveal choroidal thickness in relation to sex and axial length in 93 Danish university students. Invest Ophthalmol Vis Sci. 2011;52:8438–8441. doi:10.1167/iovs.11-8108
6. Regatieri CV, Branchini L, Carmody J, Fujimoto JG, Duker JS. Choroidal thickness in patients with diabetic retinopathy analyzed by spectral-domain optical coherence tomography. Retina. 2012;32:563–568. doi:10.1097/IAE.0b013e31822f5678
7. Querques G, Lattanzio R, Querques L, et al. Enhanced depth imaging optical coherence tomography in type 2 diabetes. Invest Ophthalmol Vis Sci. 2012;53:6017–6024. doi:10.1167/iovs.12-9692
8. Kim JT, Lee DH, Joe SG, Kim J-G, Yoon YH. Changes in choroidal thickness in relation to the severity of retinopathy and macular edema in type 2 diabetic patients. Invest Ophthalmol Vis Sci. 2013;54:3378–3384. doi:10.1167/iovs.12-11503
9. Kollias AN, Ulbig MW. Diabetic retinopathy: early diagnosis and effective treatment. Dtsch Arztebl Int. 2010;107(5):75–84. doi:10.3238/arztebl.2010.0075
10. Hidayat AA, Fine BS. Diabetic choroidopathy. Light and electron microscopic observations of seven cases. Ophthalmology. 1985;92:512–522. doi:10.1016/S0161-6420(85)34013-7
11. Campos A, Campos EJ, Martins J, Ambrosio AF, Silva R. Viewing the choroid: where we stand, challenges and contradictions in diabetic retinopathy and diabetic macular oedema. Acta Ophthalmol. 2017;95(5):446–459. doi:10.1111/aos.13210
12. Wei WB, Xu L, Jonas JB, et al. Subfoveal choroidal thickness: the Beijing Eye Study. Ophthalmology. 2013;120:175–180. doi:10.1016/j.ophtha.2012.07.048
13. Esmaeelpour M, Považay B, Hermann B, et al. Mapping choroidal and retinal thickness variation in type 2 diabetes using three-dimensional 1060-nm optical coherence tomography. Invest Ophthalmol Vis Sci. 2011;52:5311–5316. doi:10.1167/iovs.10-6875
14. Lee HK, Lim JW, Shin MC. Comparison of choroidal thickness in patients with diabetes by spectral-domain optical coherence tomography. Korean J Ophthalmol. 2013;27:433–439. doi:10.3341/kjo.2013.27.6.433
15. Ünsal E, Eltutar K, Zirtiloğlu S, Dinçer N, Özdoğan Erkul S, Güngel H. Choroidal thickness in patients with diabetic retinopathy. Clin Ophthalmol. 2014;8:637–642. doi:10.2147/OPTH.S59395
16. Vujosevic S, Martini F, Cavarzeran F, Pilotto E, Midena E. Macular and peripapillary choroidal thickness in diabetic patients. Retina. 2012;32(9):1781–1790. doi:10.1097/IAE.0b013e31825db73d
17. Rewbury R, Want A, Varughese R, Chong V. Subfoveal choroidal thickness in patients with diabetic retinopathy and diabetic macular oedema. Eye (Lond). 2016;30(12):1568–1572. doi:10.1038/eye.2016.187
18. Xu J, Xu L, Du KF, et al. Subfoveal choroidal thickness in diabetes and diabetic retinopathy. Ophthalmology. 2013;120:2023–2028. doi:10.1016/j.ophtha.2013.03.009
19. Adhi M, Brewer E, Waheed NK, Duker JS. Analysis of morphological features and vascular layers of choroid in diabetic retinopathy using spectral-domain optical coherence tomography. JAMA Ophthalmol. 2013;131:1267–1274. doi:10.1001/jamaophthalmol.2013.4321
 © 2019 The Author(s). This work is published and licensed by Dove Medical Press Limited. The full terms of this license are available at https://www.dovepress.com/terms.php and incorporate the Creative Commons Attribution - Non Commercial (unported, v3.0) License.
By accessing the work you hereby accept the Terms. Non-commercial uses of the work are permitted without any further permission from Dove Medical Press Limited, provided the work is properly attributed. For permission for commercial use of this work, please see paragraphs 4.2 and 5 of our Terms.
© 2019 The Author(s). This work is published and licensed by Dove Medical Press Limited. The full terms of this license are available at https://www.dovepress.com/terms.php and incorporate the Creative Commons Attribution - Non Commercial (unported, v3.0) License.
By accessing the work you hereby accept the Terms. Non-commercial uses of the work are permitted without any further permission from Dove Medical Press Limited, provided the work is properly attributed. For permission for commercial use of this work, please see paragraphs 4.2 and 5 of our Terms.