")
Back to Journals » International Journal of General Medicine » Volume 14
Study on the Optic Nerve Fiber Layer Thickness and Changes in Blood Flow in Myopic Children
Authors Lin T, Su L, Lin J, Qiu H
Received 25 April 2021
Accepted for publication 16 June 2021
Published 9 July 2021 Volume 2021:14 Pages 3287—3293
DOI https://doi.org/10.2147/IJGM.S317476
Checked for plagiarism Yes
Review by Single anonymous peer review
Peer reviewer comments 2
Editor who approved publication: Dr Scott Fraser
TaiNan Lin,1 Ling Su,2 JinHua Lin,1 Hong Qiu1
1Department of Ophthalmology, Fujian Provincial Governmental Hospital, Fuzhou, People’s Republic of China; 2School Health Department, Fujian Center for Disease Control and Prevention, Fuzhou, People’s Republic of China
Correspondence: TaiNan Lin
Department of Ophthalmology, Fujian Provincial Governmental Hospital, No. 67 of Gupin Street, Gulou District, Fuzhou, 350003, People’s Republic of China
Tel +86 591 88013047
Fax +86 591 88013003
Email [email protected]
Objective: The present study aims to observe the optic nerve fiber layer thickness and blood flow density in the papillary area and investigate the effects of axial length (AL) and the refractive state of the optic papilla blood flow density in children with different refractive conditions.
Methods: The present study was a clinical control study. The right eyes of 204 minors aged 6– 17 years were studied. The eyes were divided into four groups according to myopic refractive states. OCTA analyzed the data to compare the radial peripapillary capillary (RPC) density and the difference in the retinal nerve fiber layer (RNFL) thickness adjacent to the optic papilla between the four refraction groups.
Results: The intra-optic disc blood flow density was significantly and negatively correlated with the AL and was negatively correlated with the AL in the inferior temporal quadrants. The RNFL in the superior, nasal, and inferior quadrants was negatively correlated with the AL. The RNFL in the temporal quadrant was positively correlated with the AL.
Conclusion: Our present study revealed that aAs myopia increased and the AL grew in children, the blood density of the entire image of the optic papilla, in the optic disc, and the retinal capillaries in the inferior parapapillary and temporal quadrant would change significantly. With increasing AL, a significant decrease in the intra-disc and para-disc RNFL was observed in the superior, nasal, and inferior quadrants, while a substantial increase in RNFL was observed in the temporal quadrant.
Keywords: myopic, optic nerve, fiber layer, blood flow, OCTA
Introduction
In recent years, the prevalence of myopia in children in China has been increasing yearly, and myopia at a younger age is more prominent.1 The younger the age at onset of myopia, the more likely it is to cause high myopia in adulthood.2 The eyes were divided into four groups according to myopic refractive states, the emmetrope group (EM, –0.5 OD < spherical equivalent [SE] ≤ –0.5 OD), the mild myope group (MIM, –3.0 OD < SE ≤ –0.5 OD), the moderate myope group (MOM, –6.0 OD < SE ≤ –3.0 OD) and the high myope group (HM, SE < –6.0 OD). As myopia progresses and the axial length (AL) grows, a series of pathological changes occur in the fundus structure, including the post-equatorial scleral thinning, absence of Bruch’s membrane at the edge of the optic disc, macular splitting, retinal splitting, lamina cleft, and choroidal neovascularization.3 High myopia is one of the blinding eye diseases. It can lead to a series of serious complications such as complicated cataracts,4 glaucoma secondary to high myopia and defects in the thickness of the retinal nerve fiber layer adjacent to the optic disc, myopic macular degeneration, choroidal neovascularization, retinal detachment, retinal fissures, and posterior scleral staphyloma, which seriously affect vision quality and quality of life.5
At present, numerous studies focus on fundus blood flow changes in myopia, and radial peripapillary capillary (RPC) density is an important indicator of fundus blood flow.6 One study found that myopic adults had reduced retinal vessel density and thinner retinas, correlated with AL, compared with adults with emmetropia.7 However, there are few studies on children with myopia, especially those with high myopia. In the present study, the ZEISS Cirrus HD 5000A was used to scan a 3.0×3.0 mm area of the optic papillary by optical coherence tomography angiography (OCTA) for imaging and quantitative analysis of vessel density. The FORUM software of OCTA analyzed the data to compare the differences in RPC and parapapillary retinal nerve fiber layer (RNFL) between the four refraction groups and investigate the correlation between AL, RNFL thickness, and vessel density. The SPSS 23.0 software was used for data processing.
The Advantages and Limitations in the Present Study
The optical coherence tomography (OCT) angiography (OCTA) is a recently developed non-invasive clinical tool that allows for the non-invasive and quantitative analyses of the optic nerve, peripheral vascular system, and RNFL thickness, including the microvascular-choroidal vascular system.
Methods
The present study was a retrospective, cross-sectional, case-control study. All procedures used were in accordance with the principles of the Declaration of Helsinki. This study was conducted with approval from the Ethics Committee of Fujian Provincial Organ Hospital (2020–01). The legal guardian of the minor knew and signed the informed consent form. The participants were fully informed of the purpose and procedures used. The retrospective study included 204 minor subject’s right eyes with emmetropia and confirmed myopia attending the outpatient department of ophthalmology at Fujian Provincial Governmental Hospital from June 2020 to December 2020.
The main observation indicators: the parapapillary RPC and RNFL were measured. The differences were compared among the groups to investigate the correlation between the above indicators and AL and refraction.
Those studied were divided into four groups: (1) the emmetrope group (EM), the mild myope group (MIM), the moderate myope group (MOM), and the high myope group (HM). The exclusion criteria were as follows: (1) patients with other eye diseases, such as glaucoma or any retinal vascular disease; (2) patients with a history of systemic disease that may affect the ocular circulation, such as diabetes mellitus; (3) patients with a history of intraocular surgery, laser photocoagulation, or eye injury.
The best-corrected visual acuity (BCVA), slit-lamp microscopy, optometry, intraocular pressure (IOP) measurement, and corneal topography were conducted in all patients. AL was measured using the IOL Master.
The OCTA in a 3×3 mm scanning mode was used to obtain data from the optic disc areas in the four groups of children, and the scanning depth was from the inner boundary membrane to the inner plexiform layer. The OCTA could automatically identify and record the vessel density (VD) (ie, the length of vessels per unit area, reflecting the number of blood vessels) and perfusion density (PD) (ie, the ratio of the area covered by vessels in the scan plane to the scan area, reflecting the degree of perfusion) in the scan area. All children were scanned twice by the same professional operator. The data were saved after confirming that the scanned images were clear, with good vascular articulation and no obvious motion artifacts. The images obtained afterward were divided by the FORUM system into the superficial retinal layer (SRL) and deep retinal layer (DRL) according to the structure, with the superficial retinal vascular plexus corresponding to the retinal nerve fiber layer and ganglion cell layer, and the deep retinal vascular plexus corresponding to the inner retinal core layer and the outer plexiform layer. The vessel density was automatically calculated. The same doctor conducted all the examinations. The signal strength index (SSI) was detected and guaranteed at ≥90% to ensure the data’s accuracy.
Meanwhile, for other artifacts, it was confirmed that the subject was in a comfortable, quiet environment, with a relaxed body and good cooperation, and the number of examinations, the generation of artifacts, and the experiment’s impact were minimized. The SPSS 23.0 software was adopted for statistical analysis. When comparing data among the four groups, the normality distribution test was performed first, and the mean ± standard deviation was used for the data conforming to the normality distribution. The t-test of independent samples was used to compare two separate groups of measurement data. One-way ANOVA with a completely randomized design was used to compare multiple groups. Before correlation analysis, whether the data characteristics were satisfied with the normal distribution was assessed, and the Pearman correlation analysis was conducted for those satisfied with normal distribution. The Kendall correlation analysis was used for those unsatisfied with the normal distribution. P < 0.05 was considered statistically significant. The correlation between the degree of myopia, AL, parapapillary vessel density, and the RNFL thickness was investigated.
Results
Results of the General Characteristics of the Eyes
A total of 204 right eyes from 204 subjects (108 eyes from males and 96 eyes from females) with an average age of 10.3 ± 2.9 years (age range 6–17 years) were included in the present study. The EM group had 31 eyes, with 17 males and 14 females. There were 59 eyes in the MIM group, with 34 males and 25 females. There were 58 eyes in the MOM group, with 27 males and 31 females. There were 56 eyes in the HM group, with 26 males and 30 females. The general characteristics of the eyes are illustrated in Table 1. There was no statistically significant difference in gender or age (F = 1.473, P > 0.05), and the composition of the diseased eyes (all were the right eyes), and IOP among different groups (P > 0.05). There was a statistically significant difference in SE among the four groups (F = 401.22, P < 0.001) (Table 1). The AL in the EM, MIM, MOM, and HM groups was 23.20 ± 0.40 mm, 24.13 ± 0.87 mm, 25.55 ± 0.69 mm, and 26.73 ± 0.94 mm, respectively. There was a statistically significant difference in AL among the four groups (F = 176.031, P < 0.001); the AL in the HM group was the longest. The results are shown in Table 1.
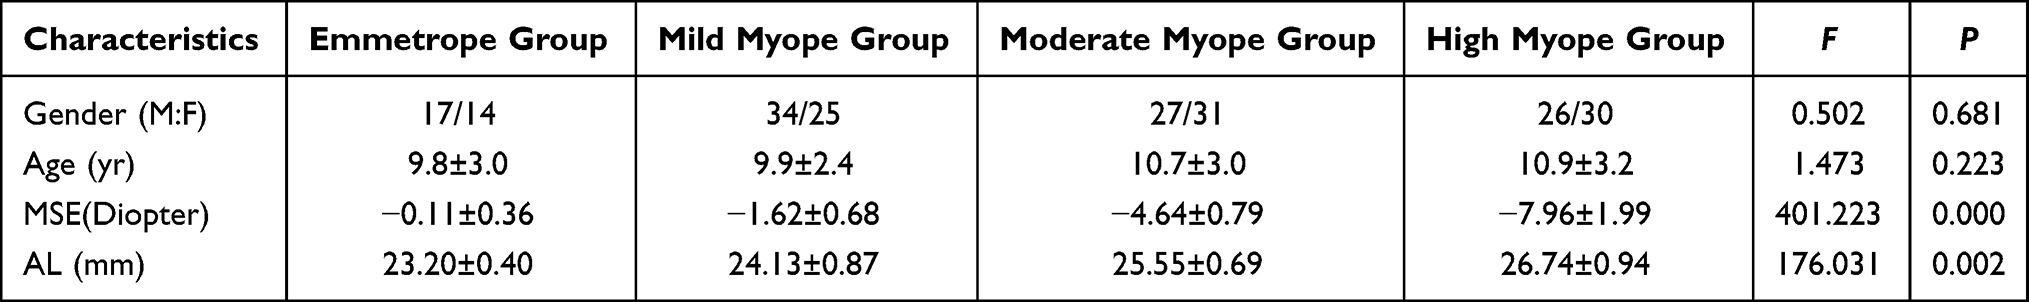 |
Table 1 Eye Related Parameters |
The parapapillary RPC vessel density and RNFL thickness in four groups of myopic children with different refractions were compared in the present study to investigate the fundus changes.
RPC Vessel Density
The RPC vessel densities in the parapapillary region and subregions are listed in Table 2. The RPC vessel densities in the parapapillary region were 52.38 ± 2.75% in the EM group, 51.67 ± 2.11% in the MIM group, 51.91 ± 3.19% in the MOM group, and 49.81 ± 2.70% in the HM group, and the differences among the four groups were significant (P = 0.014). Moreover, the parapapillary vessel density of RPC was significantly lower in the HM group than in the EM, MIM, and MOM groups (P = 0.000). As the degree of myopia increased, the optic papillary flow density, the flow density of the superior nasal subregion (NS) and inferior nasal subregion (NI), the blood flow density of the superior temporal subregion (TS) and temporal quadrant (quadrant IV) significantly decreased, and the differences between the HM group and the other three groups were all statistically significant (P < 0.05). The difference in flow density among the remaining regions was not statistically significant. The results are shown in Table 2.
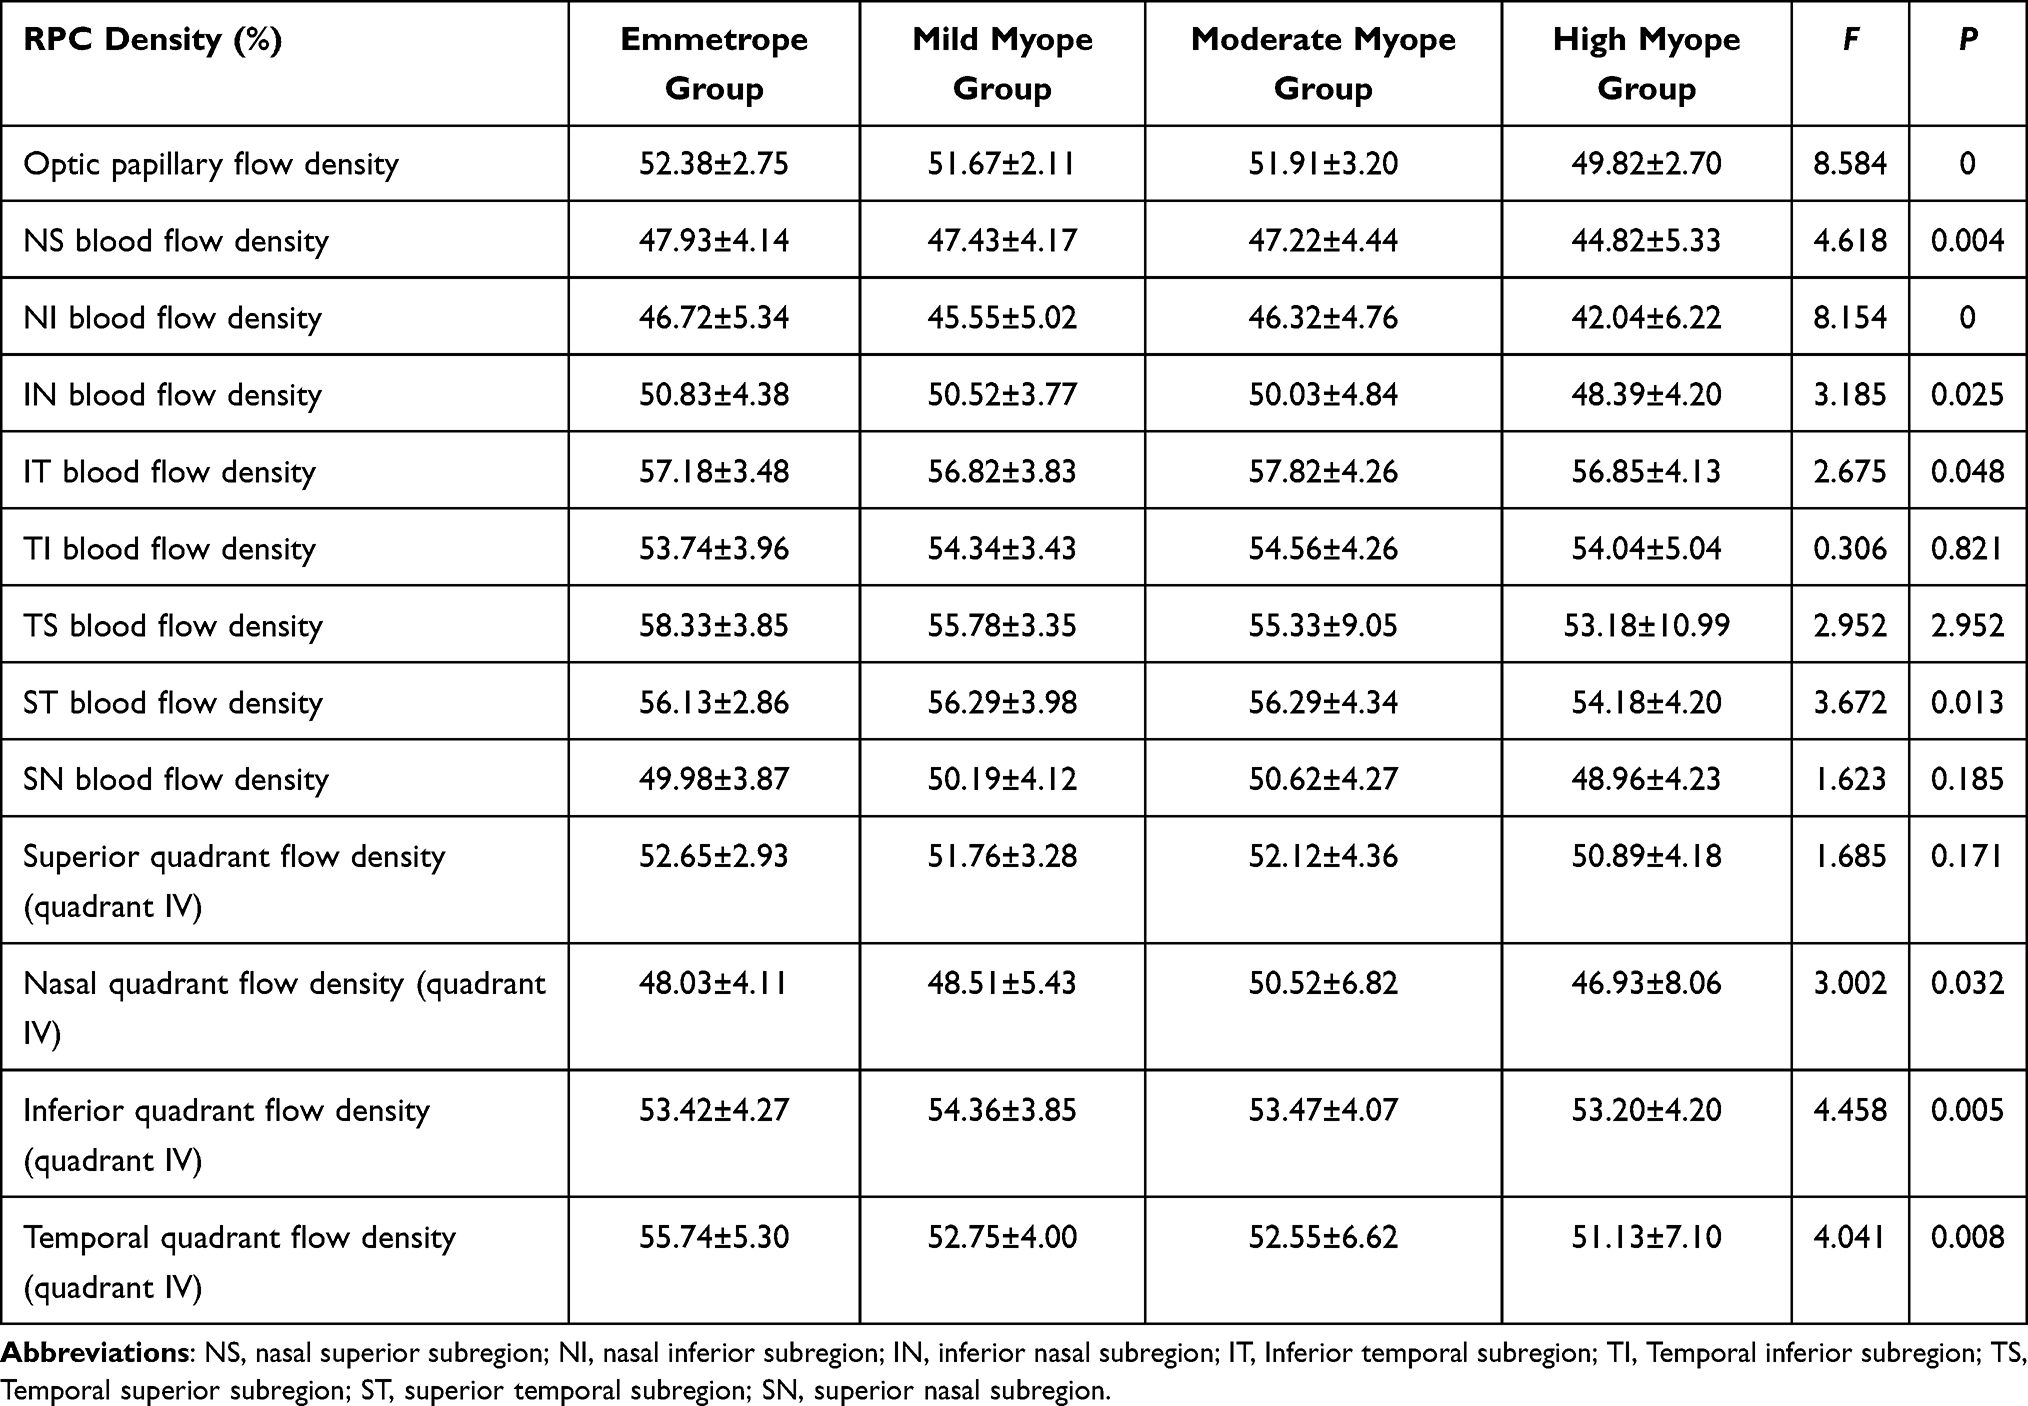 |
Table 2 RPC Density (%) |
RNFL Thickness
The RNFL thickness of the parapapillary region and the various subregions are illustrated in Table 3. The RNFL thickness was 119.74 ± 8.81 μm in the EM group, 120.08 ± 10.30 μm in the MIM group, 119.55 ± 15.13 μm in the MOM group, 114.80 ± 13.59 μm in the HM group, and the difference in RNFL thickness (P = 0.014), and the optic papillary thickness (P = 0.016) among the four groups was significant. The RNFL thickness in the MIM and MOM groups was thicker than in the HM group. There was a statistically significant difference in the RNFL thickness between the superior quadrant and the inferior quadrant (P = 0.003, P = 0.003). There was also a statistically significant difference in the RNFL thickness among the NS, NI, inferior temporal (IT), temporal inferior (TI), TS, and NS (P = 0.003, P = 0.001, P = 0.038, P = 0.000, P = 0.002, P = 0.000, respectively). There was no statistically significant difference in the RNFL thickness between the NI and superior temporal subregion (ST) (P > 0.05). There was a statistically significant difference in the RNFL thickness among the superior quadrant, nasal quadrant, and inferior quadrant (quadrant IV) (P = 0.000, P=0.000, P=0.016, respectively). There were statistically significant differences in the RNFL thickness in the temporal quadrant (quadrant IV) (P = 0.006) between the HM group and the other three groups. As the myopia degree increased, the RNFL thickness in the IS, IT, SN, and the inferior quadrant (quadrant IV) significantly decreased, and the difference between the HM and EM groups was statistically significant when compared with the difference between the MIM and MOM groups (P < 0.05). The RNFL thickness in the temporal quadrant (quadrant IV) increased, and the difference was statistically significant compared with the HM, EM, MIM, and MOM groups. The results are shown in Table 3.
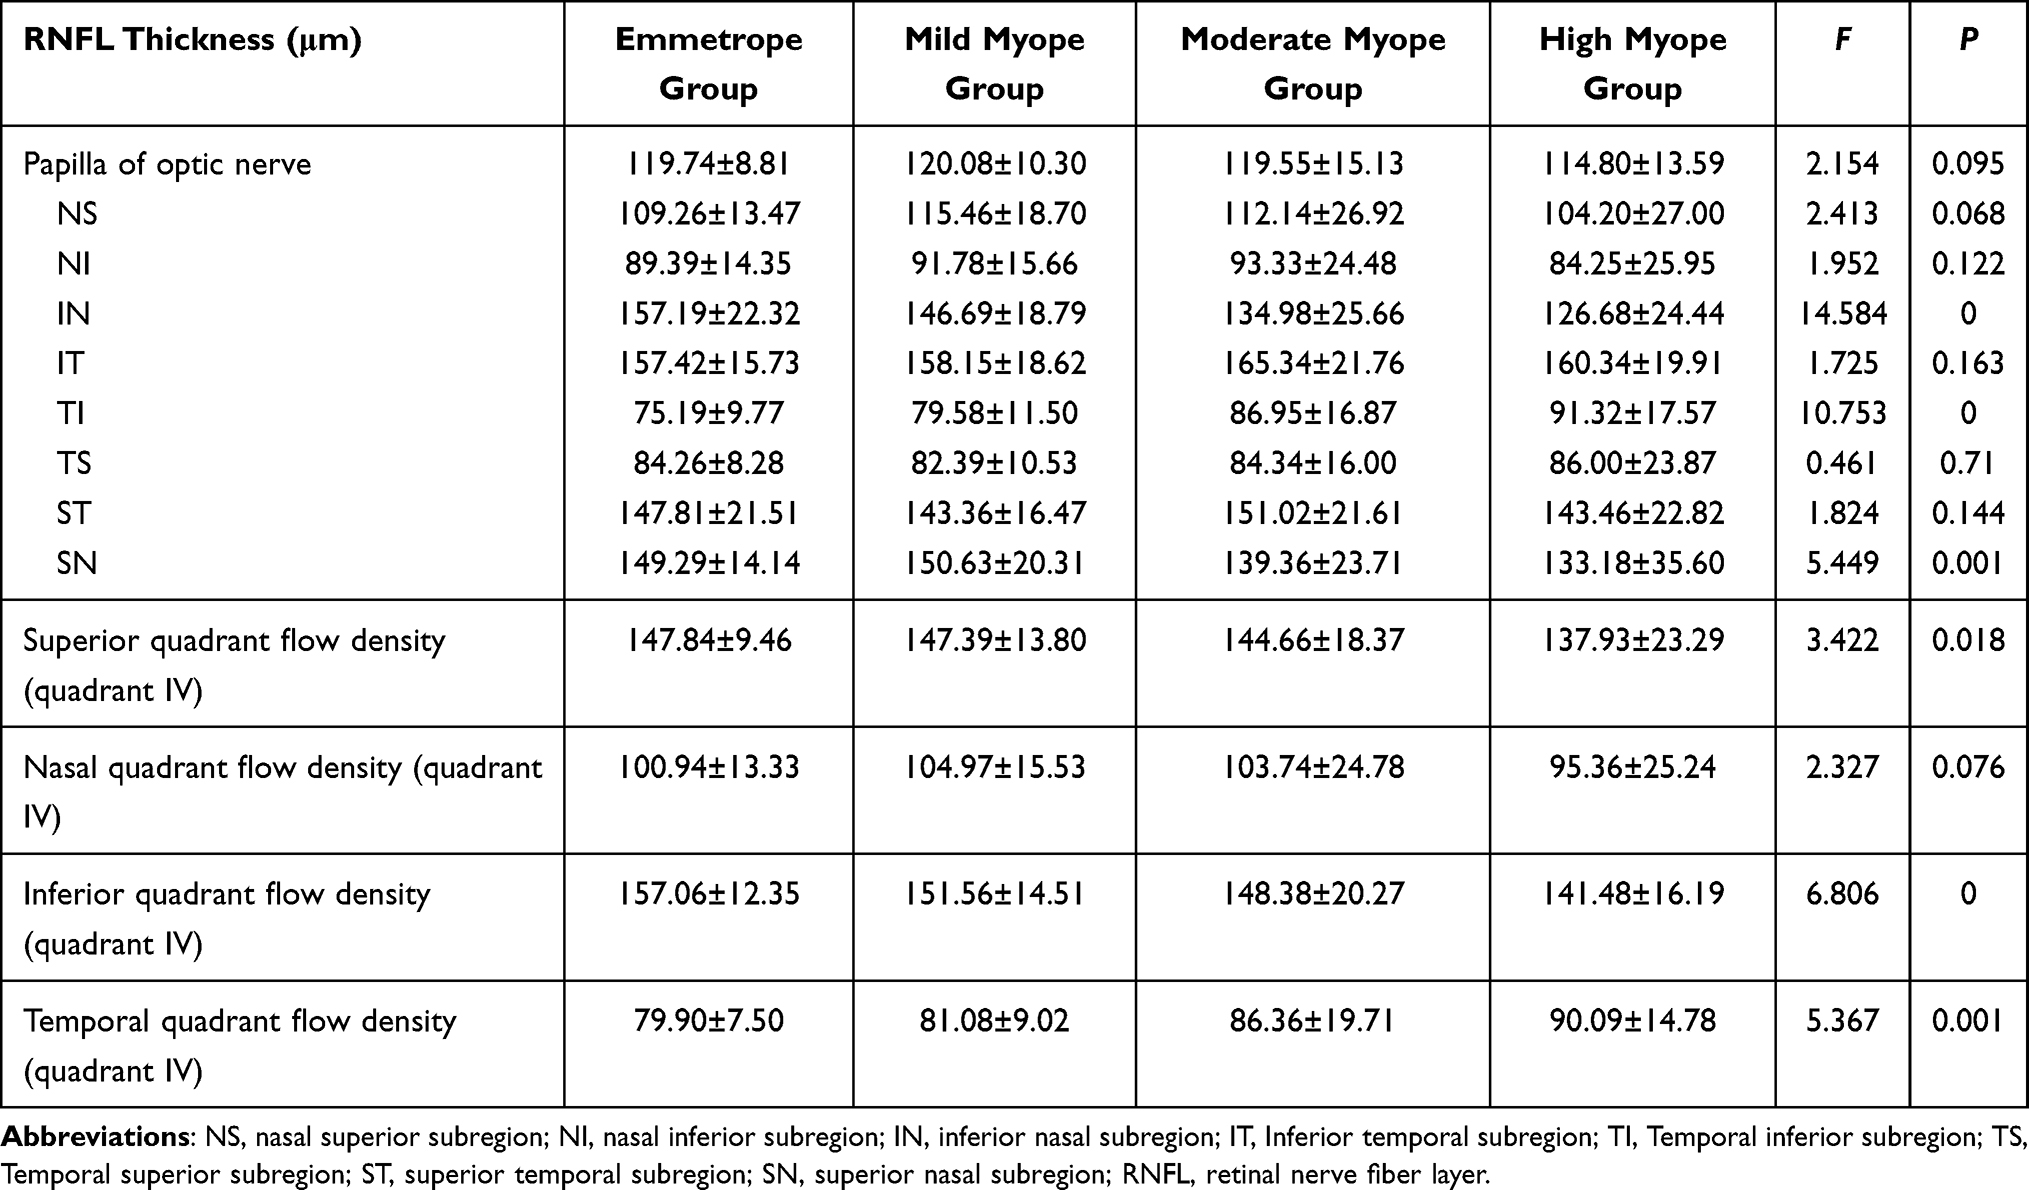 |
Table 3 RNFL Thickness (μm) |
Correlation Between the Blood Flow Density in the Optic Papilla, RNFL Thickness, and Axial Length
Before correlation analysis, the data characteristics were assessed whether they conformed to the normal distribution. The Pearman correlation analysis was used if the data satisfied normal distribution. The Kendall correlation analysis was used if the data did not satisfy normal distribution.
The correlation between the flow density in the optic papilla, RNFL thickness, and AL showed the intra-optic flow density was significantly and negatively correlated with AL (r = –0.279, P = 0.000). The flow density in the inferior quadrant and the temporal quadrant was negatively correlated with AL (r = –0.186, P = 0.008; r = –0.173, P = 0.013, respectively). The flow density in the superior quadrant and the nasal quadrant was not correlated with AL (P > 0.05).
The RNFL in the optic papillary disc was significantly and negatively correlated with AL (r = –0.160, P = 0.021). The RNFL in the superior quadrant, nasal quadrant, and the inferior quadrant was negatively correlated with AL (r = –0.165, P = 0.018; r = –0.158, P = 0.024; r = –0.317, P = 0.000, respectively). The RNFL in the temporal quadrant (quadrant IV) was positively correlated with AL (r = 0.313, P = 0.000).
Discussion
The present study found that as the degree of myopia increased and the AL grew, the blood perfusion in the optic papillary became less in children (P < 0.05). It was revealed that the optic papillary, parapapillary capillary, the NS, NI, TS, and temporal quadrant (quadrant IV) flow densities were significantly reduced. The difference was statistically significant between the HM, EM, MIM, and MOM groups, and the flow density was lower than those in all other quadrants. In addition to being correlated with the optic disc’s vascular distribution, changes in these subregions might reflect the hypoperfusion of the optic nerve papillae caused by the process of myopia in children.
The present study found that the total flow density of the retinal capillaries around the optic disc and in the inferior and temporal quadrants showed a negative correlation with AL. Previous studies have suggested that this might be associated with the initiation site of fundus changes in high myopia.8 Thus, we hypothesized that myopia might also develop from the optic papilla in children. The changes in flow density around the optic papilla in children with high myopia should precede those in the macula. This might be because the central retinal artery’s capillaries supply the nerve fiber layer on the optic papilla’s surface. The radial capillary blood around the optic papilla is supplied by the posterior ciliary artery’s capillary branches. However, they communicate with each other, and both are single-vessel supplies.
In contrast, the macula’s blood supply is related to another system besides the choroidal vascular supply; the ciliary retinal artery emits capillaries that communicate with the central retinal artery capillaries, partially compensating for the decrease in macular flow caused by the increased myopia degree.9 The results showed that the increased myopia degree led to a reduction in the parapapillary retinal capillary flow density and parapapillary retinal RNFL thickness, and there was a significant negative association between the increased myopia and RNFL thickness. This might be correlated with the reduced local blood supply after the thinning of the RNFL, which led to a flow density decrease.
There have been numerous studies on the RNFL thickness of the optic papilla in adults, but the results have been mixed. In contrast, few studies have reported on the RNFL thickness of the optic papilla in children, especially in children with high myopia. Previous studies have found no connection between the RNFL thickness and myopia and AL in adults using OCT.10,11 Conversely, some studies have found a negative association between the RNFL thickness and AL.12 The parapapillary retinal RNFL thickness varies in different studies, and the findings of the studies vary in each region. Chen et al showed that the RNFL thinning caused by high myopia is mainly located in the superior region.13 It has also been shown that the RNFL thinning was primarily involved in the temporal region.14,15 Few studies have been conducted using OCTA to study the optic papillary RNFL thickness in children and even fewer studies on high myopia. Guo Yin et al used OCTA to analyze 274 eyes with differing degrees of myopia and found that the RNFL thickness in the superior and inferior quadrants was negatively correlated with AL.16 Al-Sheikh Mayss found that the RNFL thickness became thinner with increasing myopia.17
In the present study, with the adoption of OCTA, it was found that with the increased degree of myopia in children, the flow density in the optic papillary, nasal, and temporal quadrant (four quadrants) decreased significantly, and the difference between the HM and EM groups was statistically significant than between the MIM and MOM groups (P < 0.05). Meanwhile, the thickness in the nasal side, the NS, and NI subregions were also significantly reduced. The difference between the HM and EM groups was statistically significant compared with the MIM and MOM groups (P < 0.05). It was also found that the flow density in the intra-optic disc, the inferior quadrant, and temporal quadrant were negatively associated with AL. The RNFL in the optic disc, the superior, nasal, and inferior quadrant of the optic papillary area were also negatively correlated with AL. These results suggest that as the AL became longer, it inevitably caused a decrease in flow density and RNFL thickness in the optic papilla capillaries and the optic disc region. This was also consistent with the findings of previous studies of adult myopia.18–20 The RPC vessel density and RNFL thickness were lower in HM children than in EM children, except for the temporal subregion. The RPC vessel density in the NI, IN, and SN adjacent to the optic papilla was negatively linked with AL in children. The present study’s findings suggest that as myopia increased in children, the density of the RPC vessels adjacent to the optic papilla might change as the eye dilated unevenly. This change occurred early in the superior, inferior, and nasal subregions but not in the temporal subregion.
In children with myopia, we found that the RNFL thickness in the temporal quadrant (quadrant IV) was positively correlated with AL, and the thickness increased. In normal adults, the temporal RNFL thickness was the thinnest of the four regions.21,22 There was a statistically significant relationship between the MOM and HM groups compared with the control group (P < 0.001). We speculated that there are anatomical changes caused by fundus stretching during the progression to high myopia in pediatric patients. The reason might be that during myopia development, the nerve fibers adjacent to the optic papillary would be redistributed as the eye grows in length.22 During the progression of myopia, the optic nerve fiber bundles in the superior and inferior temporal regions are stretched and accumulate in the temporal horizontal line.23 This retinal “pull” might be the reason for the constant thinning of the RNFL in the temporal region of the optic disc in early childhood. However, as myopia develops with age, the RNFL in the temporal region begins to decrease. Thus myopia-induced changes in the optic nerve and papillary blood flow and RNFL are widespread and region-wide. Ocular biometry should be performed with OCTA to correct image magnification error induced by axial length variation. Relative changes in parafoveal RVD and FAZA after correction can reach 10%. We advise caution when interpreting interocular and interindividual comparisons of RVD derived from OCTA without image size correction.24
Disclosure
The authors report no conflicts of interest in this work.
References
1. Jinag J. Expert consensus on myopia management white paper (2019). Chine J Optometry Ophthalmol Visual Sci. 2019;021(003):
2. Guggenheim JA, Pong-Wong R, Haley CS, Gazzard G, Saw SM. Correlations in refractive errors between siblings in the Singapore Cohort Study of Risk factors for Myopia. Br J Ophthalmol. 2007;91(6):781–784. doi:10.1136/bjo.2006.107441
3. Jin P, Deng J, Lv M, et al. Development of the retina and its relation with myopic shift varies from childhood to adolescence. Br J Ophthalmol. 2021;
4. Qiu X, Shi Y, Han X, Hua Z, Lu Y, Yang J. Toric Intraocular Lens Implantation in the Correction of Moderate-To-High Corneal Astigmatism in Cataract Patients: clinical Efficacy and Safety. J Ophthalmol. 2021;2021:5960328. doi:10.1155/2021/5960328
5. WuDunn D, Takusagawa HL, Sit AJ, et al. OCT Angiography for the Diagnosis of Glaucoma: a Report by the American Academy of Ophthalmology. Ophthalmology. 2021. doi:10.1016/j.ophtha.2020.12.027
6. Cheng T, Deng J, Xu X, et al. Prevalence of fundus tessellation and its associated factors in Chinese children and adolescents with high myopia. Acta Ophthalmol. 2021. doi:10.1111/aos.14826
7. Lin F, Li F, Gao K, et al. Longitudinal Changes in macular optical coherence tomography angiography metrics in primary open-angle glaucoma with high myopia: a prospective study. Invest Ophthalmol Vis Sci. 2021;62(1):30. doi:10.1167/iovs.62.1.30
8. Jiang Y, Wang D, Han X, et al. Visual impairment in highly myopic eyes: the ZOC-BHVI High Myopia Cohort Study. Clin Exp Ophthalmol. 2020;48(6):783–792. doi:10.1111/ceo.13779
9. Zhu X, Meng J, Wei L, Zhang K, He W, Cilioretinal Arteries LY. Macular vasculature in highly myopic eyes: an oct angiography-based study. Ophthalmol Retina. 2020;4(10):965–972. doi:10.1016/j.oret.2020.05.014
10. Willemse J, Mgo G, Verbraak FD, de Boer JF. In Vivo 3D Determination of Peripapillary Scleral and Retinal Layer Architecture Using Polarization-Sensitive Optical Coherence Tomography. Transl Vis Sci Technol. 2020;9(11):21. doi:10.1167/tvst.9.11.21
11. Arranz-Marquez E, Lauzirika G, Teus MA, Katsanos A. Thinner retinal nerve fibre layer in healthy myopic eyes with thinner central corneal thickness. Graefes Arch Clin Exp Ophthalmol. 2020;258(11):2477–2481. doi:10.1007/s00417-020-04873-8
12. Mayss A-S, Nopasak P, Dolz-Marco R, et al. Quantitative OCT Angiography of the Retinal Microvasculature and the Choriocapillaris in Myopic Eyes.[J]. Invest Ophthalmol Vis Sci. 2017;58:2063–2069. doi:10.1167/iovs.16-21289
13. Chen Q, He J, Hua Y, Fan Y. Exploration of peripapillary vessel density in highly myopic eyes with peripapillary intrachoroidal cavitation and its relationship with ocular parameters using optical coherence tomography angiography. Clin Exp Ophthalmol. 2017;45(9):884–893. doi:10.1111/ceo.12986
14. Grudzińska EM, Zaborski D, Modrzejewska M. Correlation between retrobulbar blood flow parameters and retinal nerve fiber, ganglion cell and inner plexus layer thickness in myopia. Eur J Ophthalmol. 2021;1120672121992007. doi:10.1177/1120672121992007
15. Porwal S, Nithyanandam S, Joseph M, Vasnaik AK. Correlation of axial length and peripapillary retinal nerve fiber layer thickness measured by Cirrus HD optical coherence tomography in myopes. Indian J Ophthalmol. 2020;68(8):1584–1586. doi:10.4103/ijo.IJO_1778_19
16. Guo Y, Liu L, Tang P, et al. Progression of myopic maculopathy in chinese children with high myopia: a long term follow-up study. Retina. 2020. doi:10.1097/IAE.0000000000002487
17. Al-Sheikh M, Phasukkijwatana N, Dolz-Marco R, et al. Quantitative OCT Angiography of the Retinal Microvasculature and the Choriocapillaris in Myopic Eyes. Invest Ophthalmol Vis Sci. 2017;58(4):2063–2069.
18. Mei-Ching T, Yi-Chieh P, Kuo-Chi H, et al. Diagnostic capability of peripapillary retinal nerve fiber layer parameters in time-domain versus spectral-domain optical coherence tomography for assessing glaucoma in high myopia. Int J Ophthalmol. 2017;10:1106–1112. doi:10.18240/ijo.2017.07.14
19. Seo S, Lee CE, Jeong JH, Park KH, Kim DM, Jeoung JW. Ganglion cell-inner plexiform layer and retinal nerve fiber layer thickness according to myopia and optic disc area: a quantitative and three-dimensional analysis. BMC Ophthalmol. 2017;17(1):22. doi:10.1186/s12886-017-0419-1
20. Rao HL, Kumar AU, Bonala SR, Yogesh K, Lakshmi B. Repeatability of spectral domain optical coherence tomography measurements in high myopia. J Glaucoma. 2016;25(5):e526–30. doi:10.1097/IJG.0000000000000385
21. Hsu SY, Chang MS, Ko ML, Harnod T. Retinal nerve fibre layer thickness and optic nerve head size measured in high myopes by optical coherence tomography. Clin Exp Optom. 2013;96(4):373–378. doi:10.1111/cxo.12052
22. Choi YJ, Jeoung JW, Park KH, Kim DM. Glaucoma detection ability of ganglion cell-inner plexiform layer thickness by spectral-domain optical coherence tomography in high myopia. Invest Ophthalmol Vis Sci. 2013;54(3):2296–2304. doi:10.1167/iovs.12-10530
23. Szumiński M, Bakunowicz-łazarczyk A. Ocena grubości komórek zwojowych siatkówki w przebiegu wysokiej krótkowzroczności [Assessment of retinal ganglion cells thickness in high myopia]. Klin Oczna. 2012;114(3):180–183.
24. Sampson DM, Gong P, An D, et al. Axial length variation impacts on superficial retinal vessel density and foveal avascular zone area measurements using optical coherence tomography angiography. Invest Ophthalmol Vis Sci. 2017;58(7):3065–3072. doi:10.1167/iovs.17-21551
 © 2021 The Author(s). This work is published and licensed by Dove Medical Press Limited. The full terms of this license are available at https://www.dovepress.com/terms.php and incorporate the Creative Commons Attribution - Non Commercial (unported, v3.0) License.
By accessing the work you hereby accept the Terms. Non-commercial uses of the work are permitted without any further permission from Dove Medical Press Limited, provided the work is properly attributed. For permission for commercial use of this work, please see paragraphs 4.2 and 5 of our Terms.
© 2021 The Author(s). This work is published and licensed by Dove Medical Press Limited. The full terms of this license are available at https://www.dovepress.com/terms.php and incorporate the Creative Commons Attribution - Non Commercial (unported, v3.0) License.
By accessing the work you hereby accept the Terms. Non-commercial uses of the work are permitted without any further permission from Dove Medical Press Limited, provided the work is properly attributed. For permission for commercial use of this work, please see paragraphs 4.2 and 5 of our Terms.