")
Back to Journals » Clinical Interventions in Aging » Volume 17
Study on the Association Between Dietary Habits, Patterns and Frailty of the Elderly: A Cross-Sectional Survey from Communities in China
Authors Yang J, Wang A, Shang L , Sun C, Jia X, Hou L, Xu R, Wang X
Received 10 June 2022
Accepted for publication 27 September 2022
Published 13 October 2022 Volume 2022:17 Pages 1527—1538
DOI https://doi.org/10.2147/CIA.S378138
Checked for plagiarism Yes
Review by Single anonymous peer review
Peer reviewer comments 2
Editor who approved publication: Dr Zhi-Ying Wu
Jie Yang,1 Anhui Wang,2 Lei Shang,3 Chao Sun,1 Xin Jia,1 Liming Hou,1 Rong Xu,1 Xiaoming Wang1
1Department of Geriatrics, Xijing Hospital, Air Force Medical University, Xi’an, 710032, People’s Republic of China; 2Department of Epidemiology, Air Force Medical University, Xi’an, 710032, People’s Republic of China; 3Department of Health Statistics, Air Force Medical University, Xi’an, 710032, People’s Republic of China
Correspondence: Xiaoming Wang, Department of Geriatrics, Xijing Hospital, Air Force Medical University, 127 Changle West Road, Xi’an, 710032, People’s Republic of China, Tel +86-29-84775543, Email [email protected]
Objective: The purpose of this study was to explore the effects of Chinese dietary habits and patterns on frailty among elderly people in Xi’an the community. We also sought to provide dietary suggestions for prevention of frailty.
Methods: A cross-sectional survey was conducted and participants were divided into three groups: non-frail group, pre-frail group, and frail group. Our sample included 100 individuals randomly selected from each group for the dietary survey. Information regarding general socio-demographic characteristics and the types and quantity of food intake in the past 3 days was collected by a questionnaire. Factor analysis was used to identify dietary patterns; multiple logistic regression analysis was used to explore the correlation between dietary pattern and frailty.
Results: (1) 1693 elderly individuals were screened. The prevalence of pre-frailty and frailty was 41.0% and 16.2%, respectively. (2) Two dietary patterns were defined: ordinary dietary pattern and high-fat dietary pattern. Compared with the high-fat diet, the intake of iron, vitamin E, polyunsaturated fatty acids, and legume protein was significantly lower in the ordinary diet (P < 0.05). (3) Multivariate regression analysis showed that the ordinary dietary pattern score was positively correlated with frailty, which was consistent after adjusting for confounding factors (P < 0.05).
Conclusion: The low-fat and low-protein diet was positively correlated with the risk of frailty. Appropriate increase in fat and protein intake can help improve the frailty of the elderly in China.
Keywords: elderly, frailty, dietary pattern, nutrients, protein
Introduction
With acceleration of the aging process, China has the largest aged population in the world. By the end of 2020, China’s population of individuals aged ≥60 years was approximately 264 million, accounting for 18.7% of the country’s total population. By 2050, it is estimated that this number will reach 400 million in China and 2 billion worldwide.1 However, while the human life span is increasing, the number of years with a healthy quality of life does not seem to be keeping pace.2 Frailty is among the many syndromes that commonly affect the elderly and their quality of life. The incidence rate of frailty among individuals aged >85 years ranges from 25% to 50%.3
Frailty is a clinical syndrome caused by a variety of chronic and degenerative diseases. It can lead to a decline in an individual’s multi-system physiological reserve capacity and his or her sensitivity to stress, approaching or exceeding the threshold of clinical failure. This means small external stimulation may lead to negative clinical events and adverse consequences, such as falls, hospitalization, and even death.4 Frailty is also promoted by manifold factors, including social, psychological, cognitive, and nutritional factors. Therefore, more attention is being given to the causes and risk factors of debilitation for establishing preventive intervention measures to avoid or delay the occurrence of debilitation.2
Recent studies have reported many risk factors associated with frailty, including genetics, comorbidities, multiple medications, falls, and malnutrition.5 Though intervention is difficult for most of these factors, nutrition is changeable and easily controllable. There is increasing evidence showing that different dietary patterns may prevent or slow the onset of frailty. Previous studies focused on the effect of a single nutrient or food group on frailty but not on the interaction between food nutrients and the synergy between food groups.6 Further research is needed on dietary patterns. Dietary pattern is a variable that takes into account the type, intake, frequency, and proportion of different food and food groups. It can be used to evaluate the synergy, accumulation, and antagonism between food and nutrients in the overall diet.7 It has provided a new direction for researchers seeking to elucidate the relationship between diet and frailty.
People living in different countries and regions of the world have significantly different dietary patterns due to the influence of culture and living habits. Common dietary patterns include the Eastern, Western, and Mediterranean dietary structures. The elderly in China tend to eat an Oriental diet, which consists of staple food and vegetables as the mainstay and less meat than other dietary patterns. Although there have been a few relevant studies,8,9 there are no reports on dietary patterns and frailty among the elderly in northwestern China. The present study is the first to use the Fried Frailty Scale to assess frailty status among the elderly in middle-class communities in northwestern China. We compared the dietary components and patterns of different groups and explored the association between different dietary patterns and frailty. We hope that these real data will reflect the current dietary status of the elderly in China, and provide a reliable basis for formulating a diet plan suitable in the future.
Methods
Study Population
This study was conducted in compliance with the Declaration of Helsinki and was approved by the Ethical Committee of the First Affiliated Hospital of Air Force Medical University (KY20192015-F-1). All participants gave written informed consent. So the epidemiological survey was conducted from November 2018 to May 2019 in 13 communities of Xi’an. The inclusion criteria were as follows: age ≥65 years; could stand from a chair and walk 6 meters; had clear awareness; possessed a certain reading ability (participants were asked to read the first page of the questionnaire independently and answer five randomly selected questions about what they read, in order to assess their reading ability and comprehension) or verbal expression; had barrier-free communication; and agreed to and accepted the research plan. The exclusion criteria were as follows: acute and chronic inflammatory diseases of the intestine within 3 months; use of antibiotics, probiotics, prebiotics, or synbiotics within 1 month; use of laxatives or drugs for diarrhea, proton pump inhibitors, or gastric motility drugs for more than 3 days; dementia or mental illness; blindness; acute infection; or cancer. In all, 300 elderly were included in the analysis. We conducted face-to-face anthropometry examinations on each participant and distributed questionnaire. Sixteen of the 300 participants did not complete the diet survey.
Sociological Characteristics and Anthropometry
The self-report general questionnaire included questions on
sex, age, occupation, income, family status, education level, residence status, tobacco consumption, alcohol consumption, number of comorbidities, history of surgery, number of medications, exercise habits (If exercise frequency less than or equal to 2 times a week, it is considered to be infrequent exercise. Exercise more than 3 times a week, which is considered to be regular exercise.), and self-health score.
Anthropometric measurements were recorded by qualified medical staff members using a unified method; they measured height and weight at baseline and calculated the body mass index (BMI) according to weight (kg)/height (m)2. BMI data were divided into four grades according to the criteria recommended by the “Chinese Guidelines for the Prevention and Control of Overweight and Obesity in Adults”: BMI <18.5 kg/m2 for emaciated, 18.5–23.9 kg/m2 for normal, 24.0–27.9 kg/m2 for overweight, and ≥28 kg/m2 for obese.
Dietary Survey and Analysis
All participants will come to the community hospital in batches to collect the 3-day dietary questionnaire, and truthfully fill in the diet for the next 3 days (including Thursday, Friday and Saturday) after returning home, including all meals and snacks as required. When they received the dietary questionnaires, the researchers would give each participant face-to-face explanations and demonstrations using the food models, focusing on how to estimate the weight of the food and what to look out for. The questionnaire will not be issued until every elderly person truly understands and can fill in the questionnaire accurately. After three days of recording, the researchers will take back the questionnaire in time and checked it personally. Finally, two researchers inputted and exported data using V3.0 software for outpatient nutrition consultation and guidance management, developed by Shanghai Zhending Health Technology Co., Ltd., and checked each other’s data to ensure the authenticity and accuracy of the information.
Identification of Dietary Patterns
Foods reported were categorized into 1 of 10 food groupings (Table 1). Food patterns were then identified by using factor analysis.10 This procedure generates factor loadings for each of the 10 food groupings related to each dietary pattern extracted. The factor loadings measure the correlation between the identified dietary pattern and the food grouping. Larger factor loading values indicate a greater contribution of that food grouping to the specified dietary pattern. The identified factors represent a proportion of the variance in the original data. The Bartlett’s test indicated that the correlation among the variables was sufficiently strong to justify undertaking the factor analysis (p< 0.01). The common factors with Eigenvalues >0.4 were extracted. Of the derived factors, 2 were retained based on the Scree plot.11 An orthogonal rotation procedure, the Varimax rotation, was then applied to simplify the factor structure and render it more easily interpretable The derived factors were named according to the food groupings that loaded most strongly on the factor (loading >0.4).12 For each participant, the factor score for each pattern was calculated by summing the quantity of each food grouping weighted by their loading on each factor. Daily average intake of nutrients was compared between food pattern score groups.13
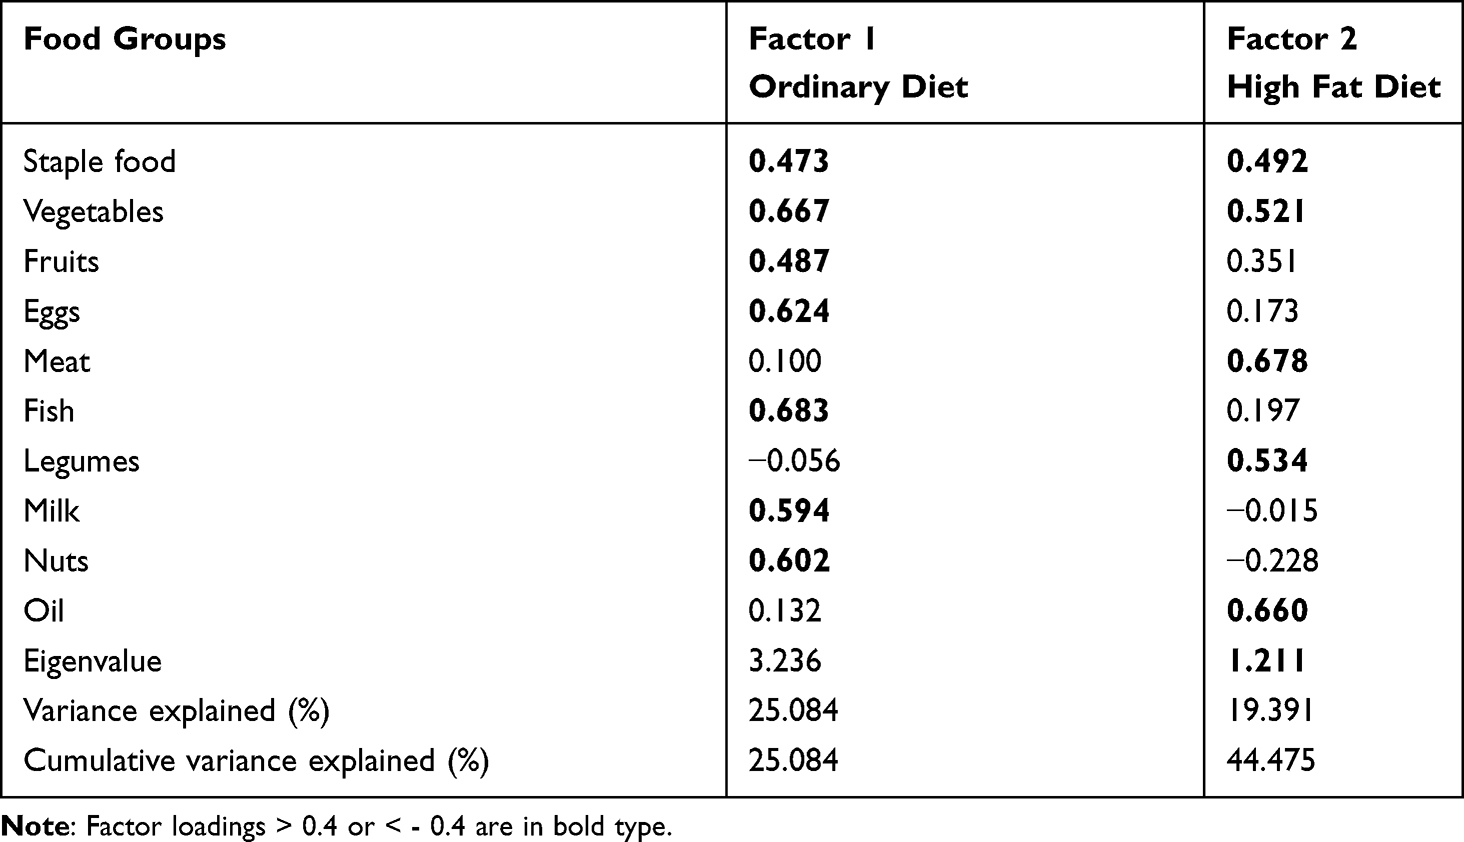 |
Table 1 Food Group Factor for Two Dietary Patterns |
Assessment of Frailty
The internationally recognized Fried criteria were adopted,4 which included five items: (1) unintentional weight loss (unintentional weight loss greater than 4.5 kg or 5% of body weight in the past year).; (2) fatigue (We applied Center for Epidemiological Survey, Depression Scale (CES-D) to evaluate. That is, the score of any one of the two questions in CES-D is 2–3 points, which can be determined as the score of the item. ① I feel like I need to work hard in everything I do; ②. I cannot walk forward. 0 score: <1 day; 1 point: 1–2 days: 2 points: 3–4 days; 3 points: >4 days.); (3) decreased grip strength (We determined by gender and body mass index (BMI). Male: BMI ≤ 24.0 kg/m2, ≤ 29 kg; BMI 24.1–28.0 kg/m2, ≤30 kg; BMI > 28 kg/m2, ≤32 kg. Female: BMI ≤ 23.0 kg/m2, ≤ 17kg; BMI 23.1–26.0 kg/m2, ≤17.3 kg; BMI 26.1–29.0 kg/m2, ≤18 kg; BMI > 29 kg/m2, ≤21 kg); (4) decreased walking speed (We applied walking time in 4.57 m by gender and height. Male: height ≤173 cm, ≥ 7 s; height >173 cm, ≥ 6 s; Female: height ≤159 cm, ≥ 7 s; height >159 cm, ≥ 6 s); and (5) reduced physical activity (We applied Minnesota leisure time physical activity questionnaire (MLTA) by gender. Male: < 383 kcal/week (about 2.5 hours of walking); Female: < 270 kcal/week (about 2 hours of walking). Specifically, the grip strength was measured by a grip dynamometer, and all of these indicators were inquired by face-to-face surveys. Accordingly, the participants were divided into the following categories: non frailty (NF, 0 items), prefrailty (PF, 1–2 items) and frailty (F, 3 items or more).
Statistical Analysis
Each dietary factor score was divided into quartiles, with increasing intake from quartile 1 to 4 (<25th, 25th–50th, 50th–75th,≥75th percentile) The means and standard deviation were used to describe continuous variables of normal distribution; proportions were used to describe categorical variables. One-way analysis of variance was used to test the differences of continuous variables, the chi-square test was used to analyze the differences between categorical variables, and Kruskal–Wallis Test was used to analyze data with non-normal distribution. Multivariate logistic regression was used to study the relationship between dietary pattern and frailty. P < 0.05 was considered significant.
All analyses were performed using SPSS 25.0.
Results
Population Characteristics and Frailty Status
Frailty Status
We screened 1693 individuals (mean age 74.56±6.29 years; 719 men, 42.5%), including 724 categorized as NF (mean age 72.1±5.14 years; 229 men, 31.6%), 694 categorized as PF (mean age 75.36±6.16 years; 377 men, 54.3%), and 275 categorized as F (mean age 79.02±6.41 years; 113 men, 41.1%). The overall prevalence of PF was 41.0% and the prevalence of PF was higher in men than in women (52.4% in men and 32.5% in women, P < 0.001). The overall prevalence of F was 16.2%, and the prevalence did not differ between the sexes (15.7% in men and 16.6% in women, P = 0.613).
Basic Information and Comparison Among Groups
According to the inclusion and exclusion criteria, 100 individuals were randomly selected from each group. Finally, we obtained valid data from 284 participants. The effective recovery rate was 94.67%. Among the 284 participants, 120 were men (42.3%) and 164 were women (57.7%), with an average age of 73.92±6.68 years (Table 2). There were differences in the age, number of children, number of comorbidities, surgical history, exercise frequency, and fatigue among the three groups (P < 0.05). Among these, exercise frequency was a protective factor negatively related to frailty; the other factors showed a positive correlation. There were no statistical differences in sex, BMI, occupation, education level, marital status, income status, living status, tobacco consumption, or drinking status (P > 0.05).
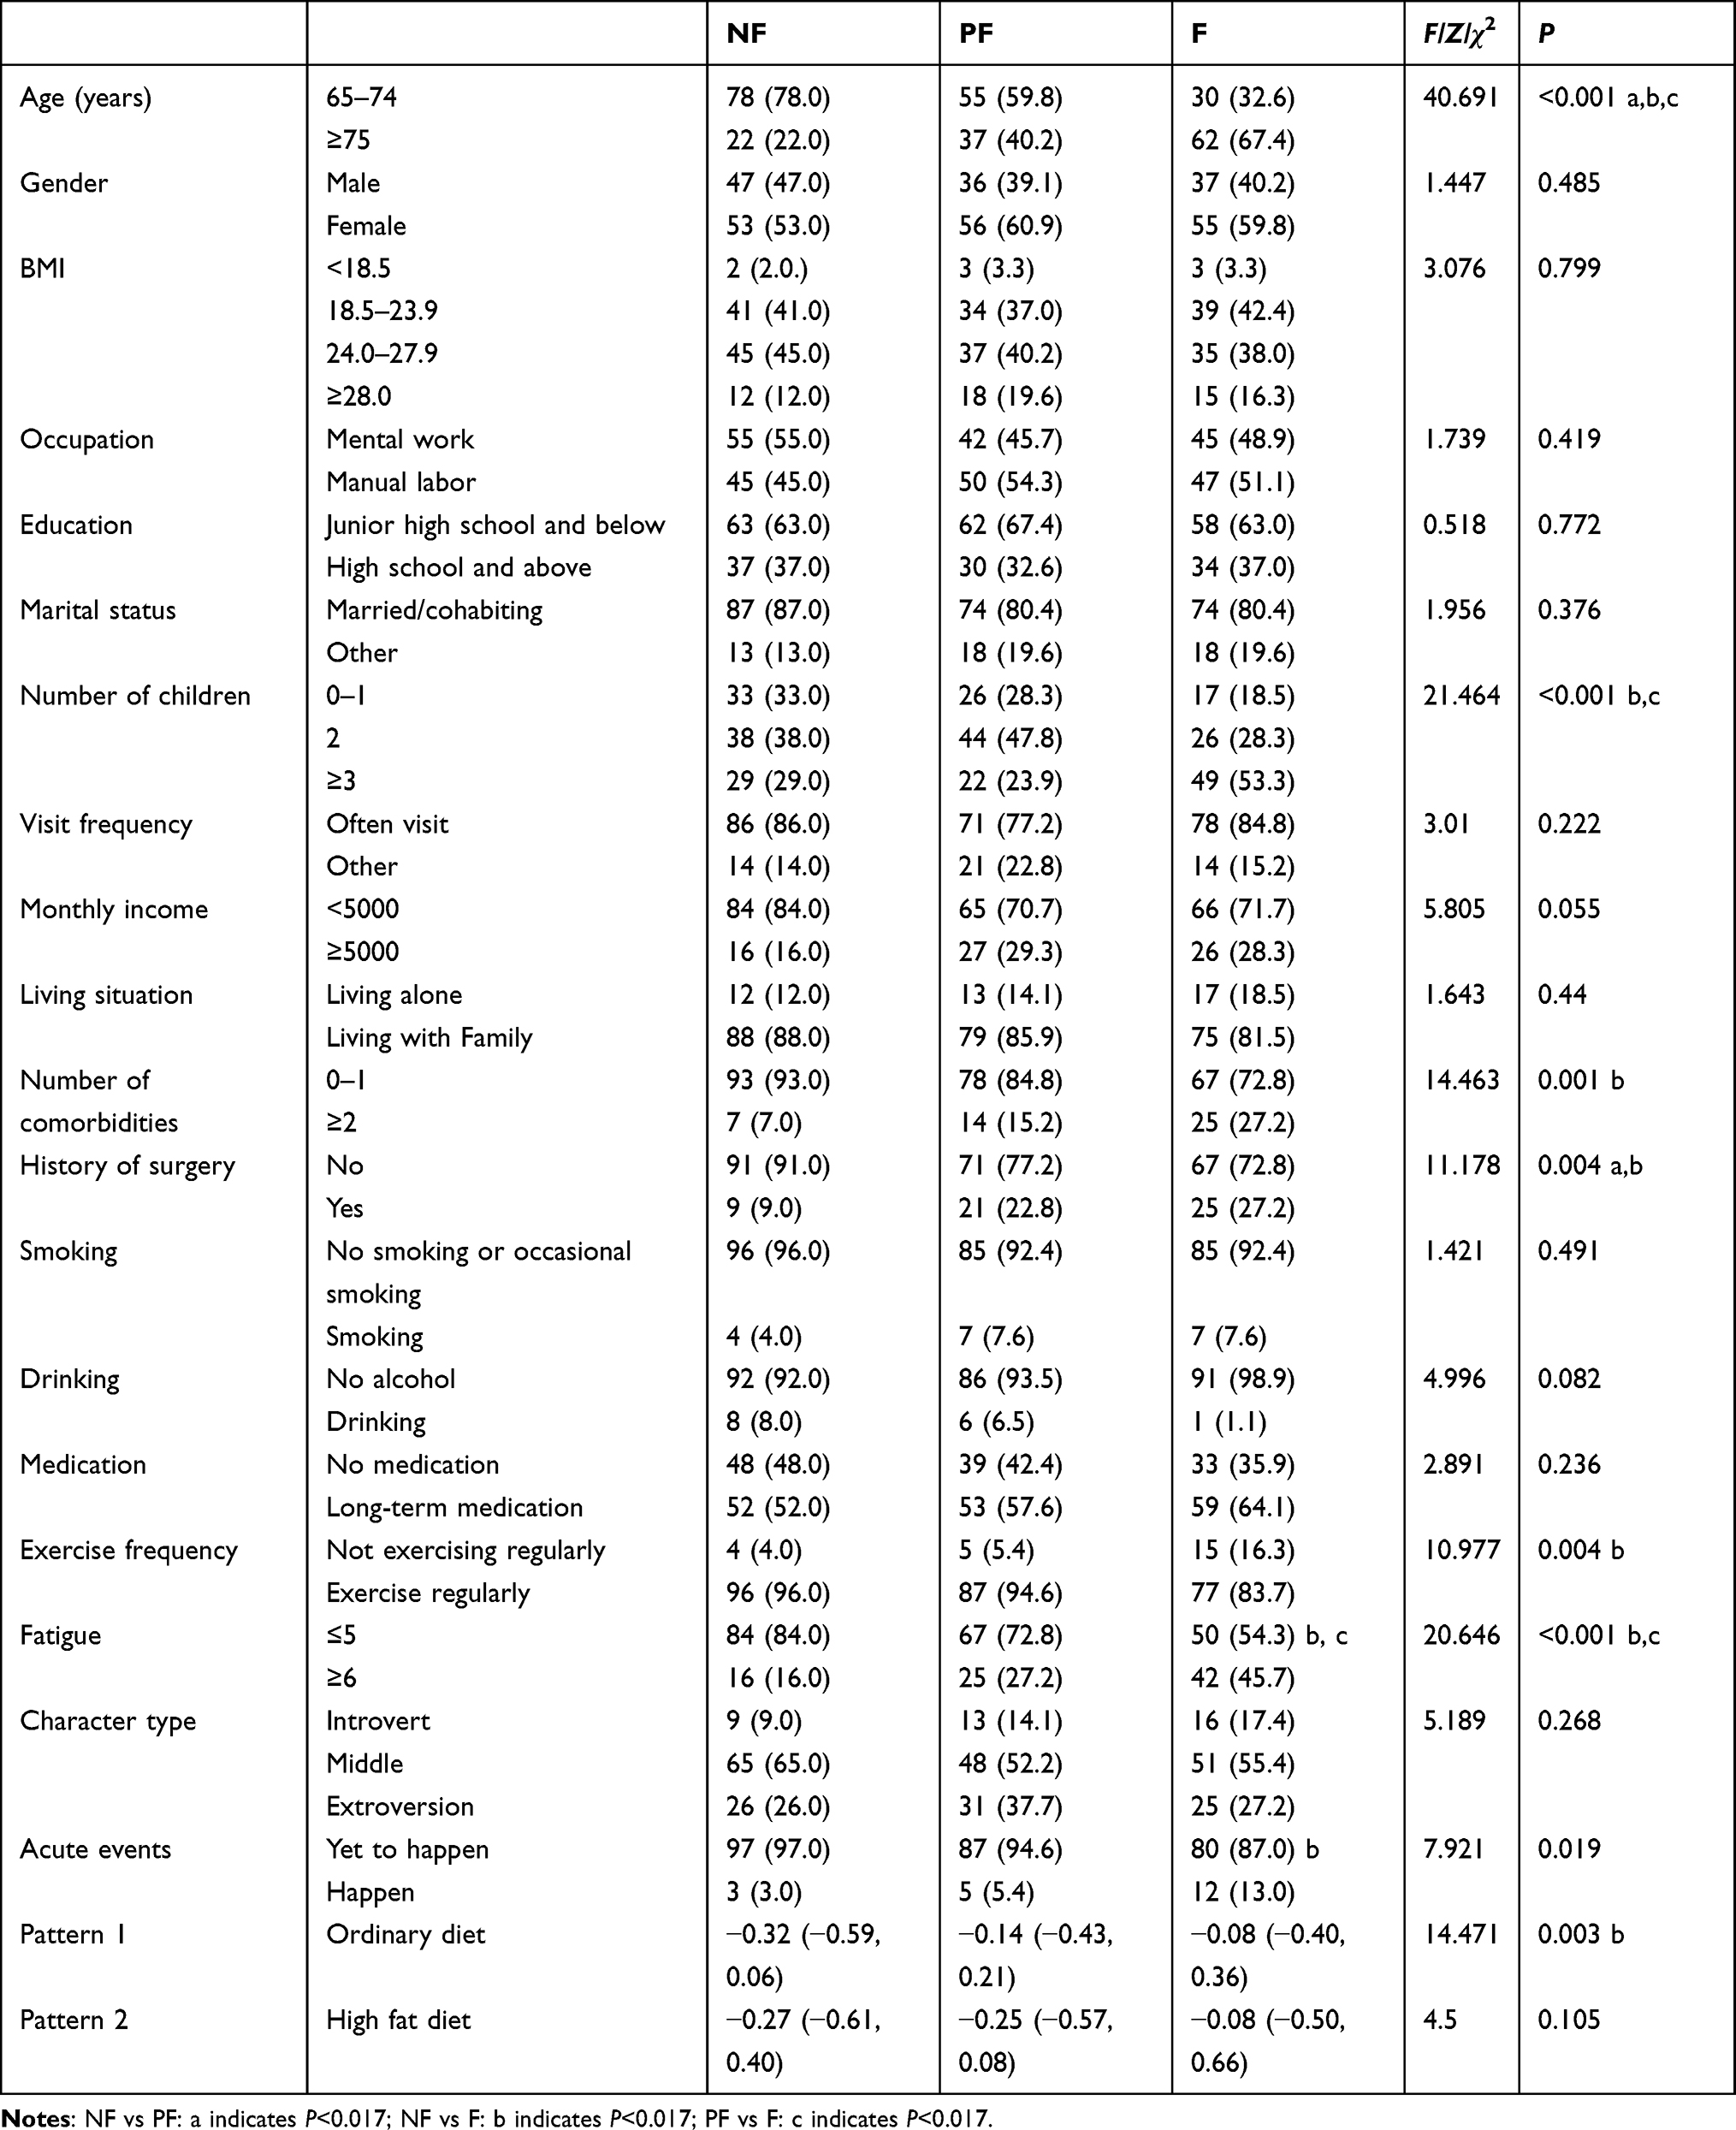 |
Table 2 Baseline Characteristics of Participants (n, %) |
Dietary Patterns and Nutrients
Overall Comparison of Two Dietary Patterns
Two dietary patterns were utilized for analysis (Table 1): the ordinary dietary pattern (consisting of staple food, vegetables, fruits, eggs, fish, milk, and nuts; eigenvalue = 3.24) and the high-fat dietary pattern (staple foods, vegetables, meat, beans, and oils; eigenvalue = 1.21). The ordinary dietary pattern accounted for 25.08% of the total variance, and the high-fat dietary pattern accounted for 19.39% (together the two accounted for 44.48% of the variance). According to the dietary grouping factor >0.4, both dietary patterns included staple food and vegetables.
Comparison of Groups with ≥75% Dietary Pattern Scores
When comparing main nutrients (Table 3), there were no differences in energy, protein, fat, carbohydrates, or dietary fiber between the two dietary patterns, but the overall intake in the ordinary diet was lower. The intake of iron, vitamin E, polyunsaturated fatty acids, and legume protein in the ordinary diet was significantly lower than in the high-fat diet (P < 0.05).
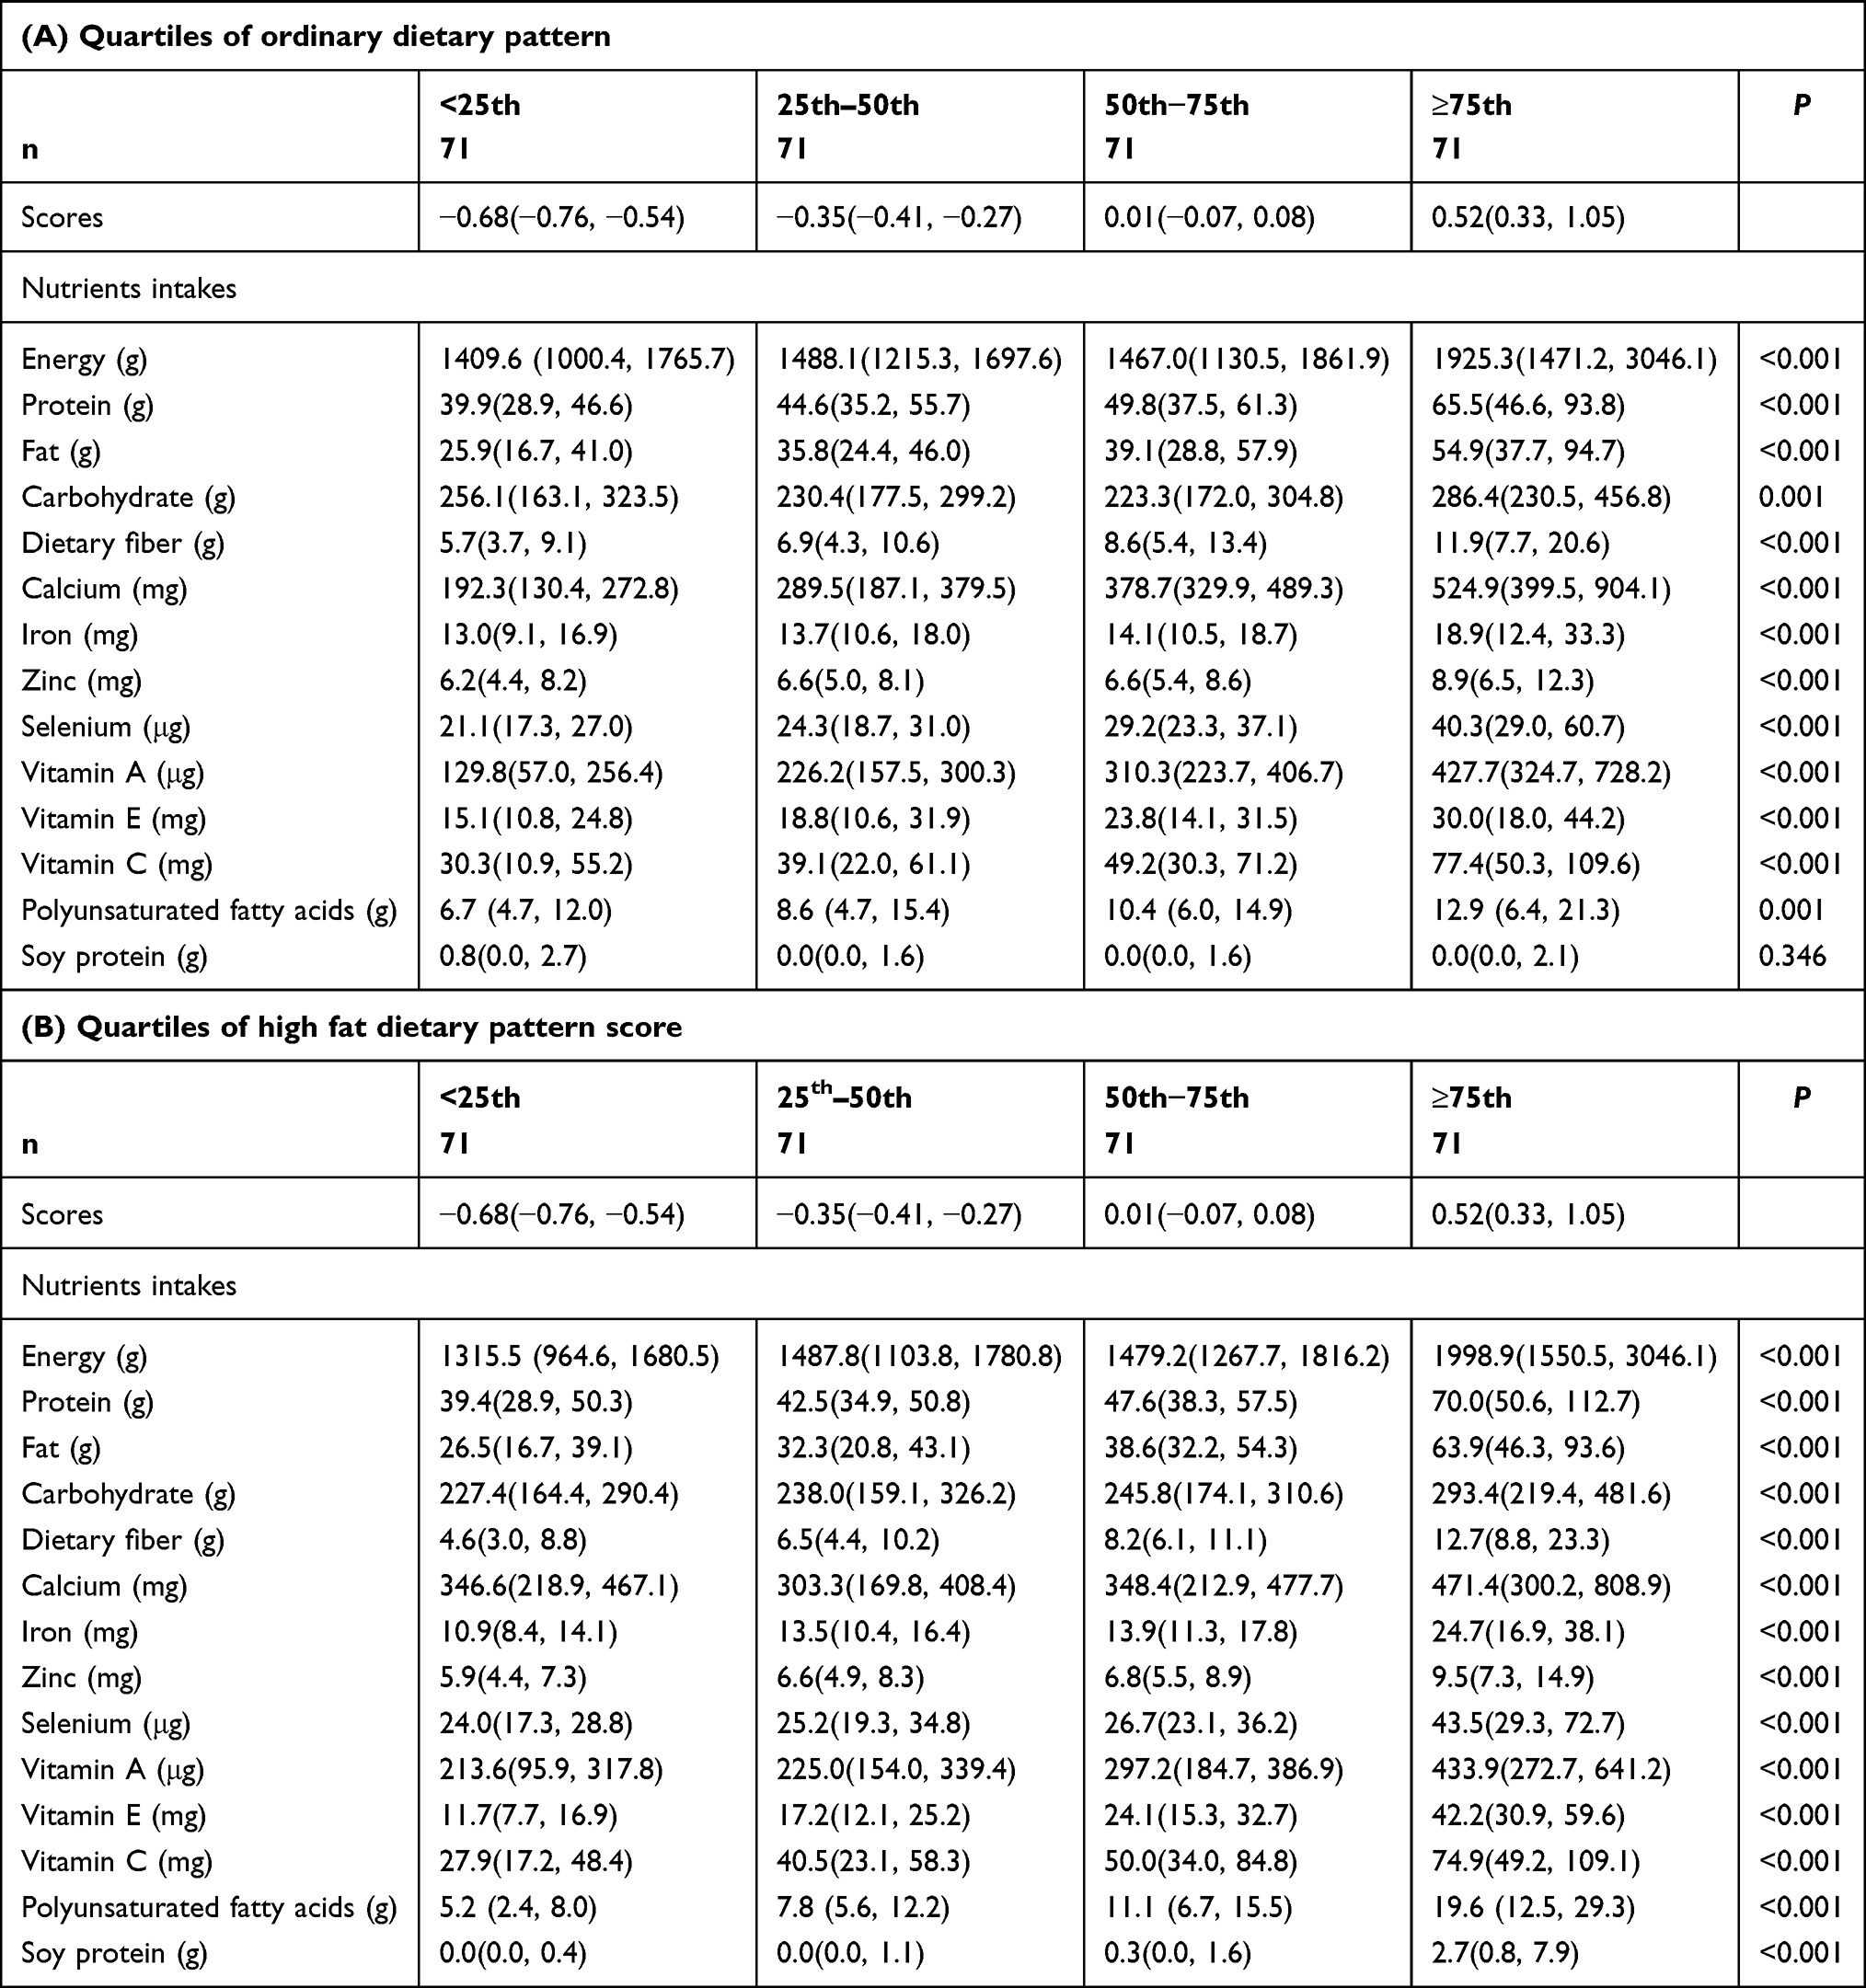 |
Table 3 Nutrients Intakes by Quartile |
Relationship Between Dietary Patterns and Frailty
Dietary Factor Scores
For the ordinary dietary pattern, the dietary factor score in the frailty group was higher than in the non-frailty group (F: −0.08 [−0.40, 0.36], NF: −0.32 [−0.59, 0.06], P=0.001), while there were no differences between the other groups (P > 0.017). There were also no significant differences among the three groups for the high-fat dietary pattern. This suggests that frail elderly are more inclined to have an ordinary dietary pattern.
Quartile Comparison of Dietary Factor Scores
The scores of the two dietary patterns are expressed in quartiles to compare different intakes (Table 4). There were no significant differences in age, sex, or BMI at the quartile level in either food pattern. The frailty score of the ordinary dietary pattern differed significantly from the other group scores (P = 0.008), and only the frailty group differed significantly from the NF group (P = 0.001). However, no significant correlation was observed between the score of the high-fat dietary pattern and frailty.
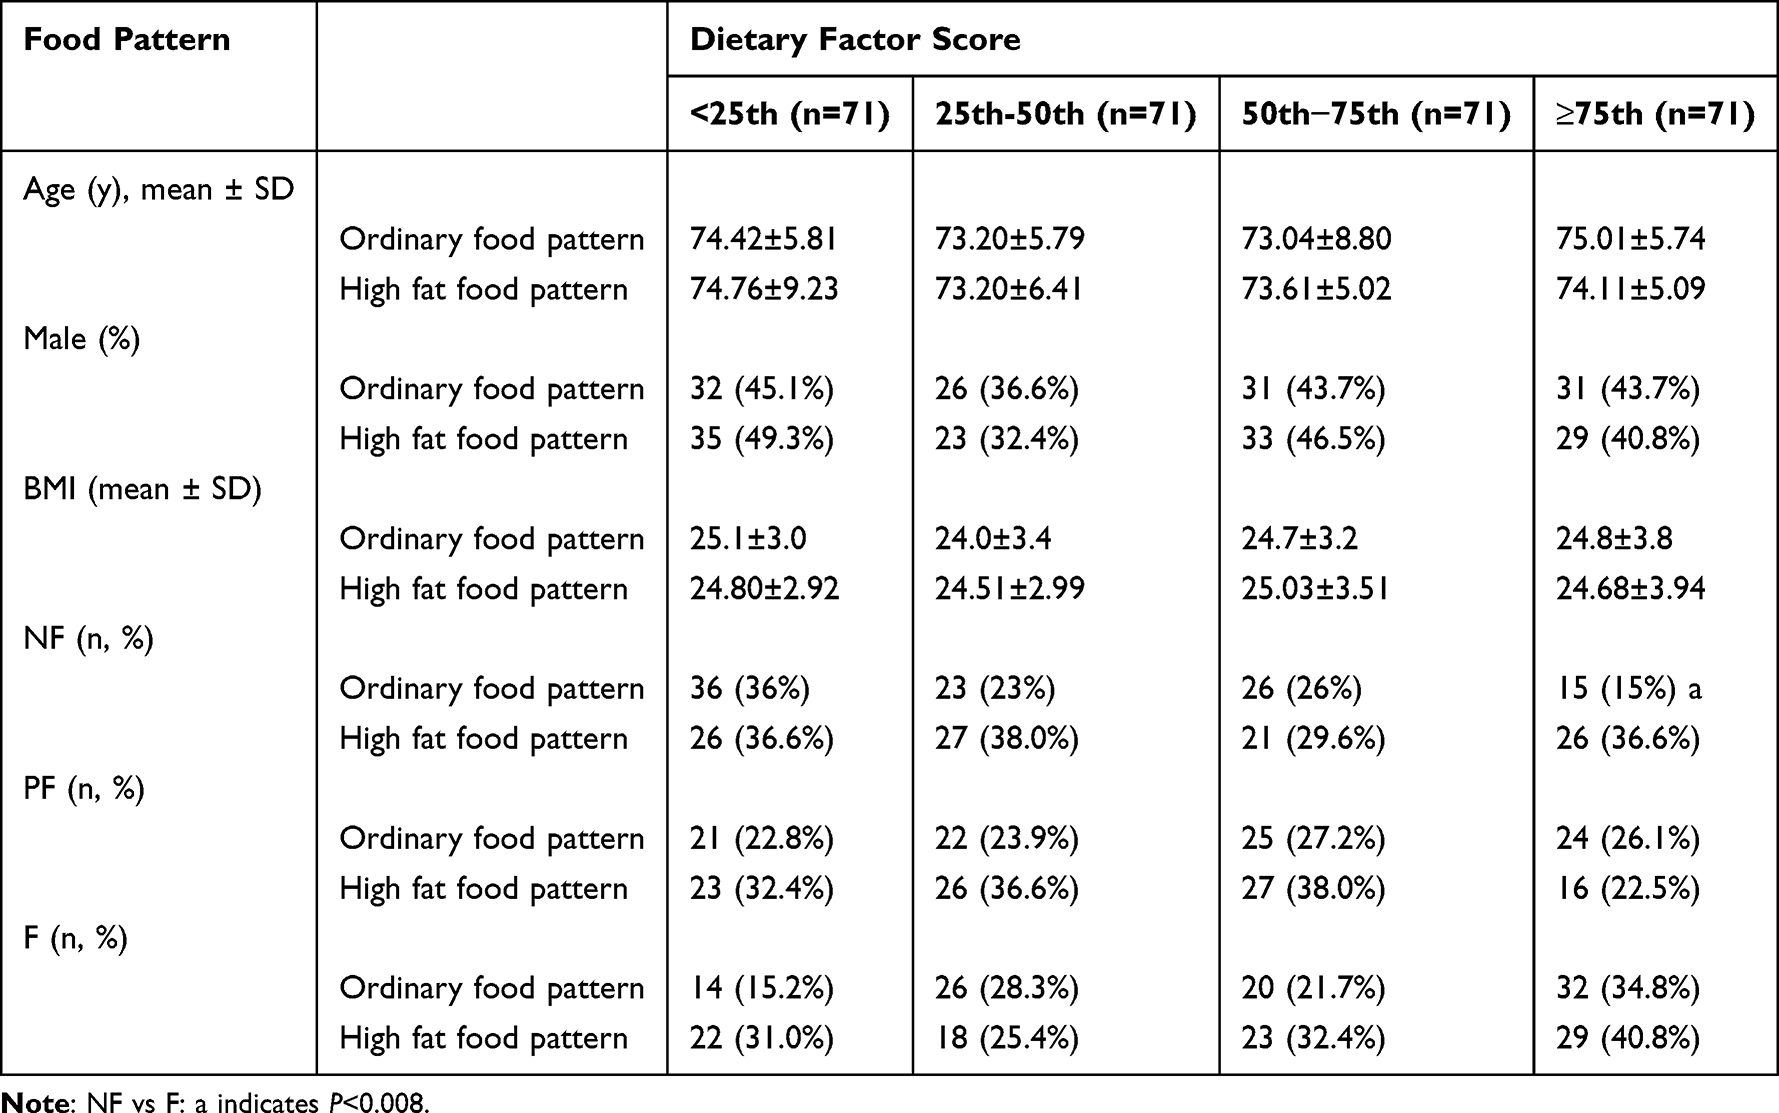 |
Table 4 Food Pattern Scores by Quartile |
Logistic Regression Analysis of Dietary Patterns and Frailty
Multiple logistic regression was used to analyze dietary patterns and frailty (Table 5). Frailty was positively correlated with the score of the ordinary dietary patterns (NF as the reference, P < 0.05 for both PF and F). After adjusting for factors such as sex, age, BMI, number of children, number of comorbidities, history of surgery, and exercise frequency, the PF group was positively correlated with the scores for the ordinary diet pattern, age, and surgical history (P < 0.05), whereas the F group was positively correlated with the ordinary dietary pattern score, age, number of comorbidities, and surgical history. That is, as the degree of frailty worsened, the participants were more likely to have an ordinary dietary pattern and age, the number of comorbidities, and the proportion of participants with a surgical history increased. No statistical correlation was observed between the high-fat dietary pattern and frailty. The higher a participant’s score for the ordinary dietary pattern, the more that participant was prone to frailty, notwithstanding the influence of numerous confounding factors.
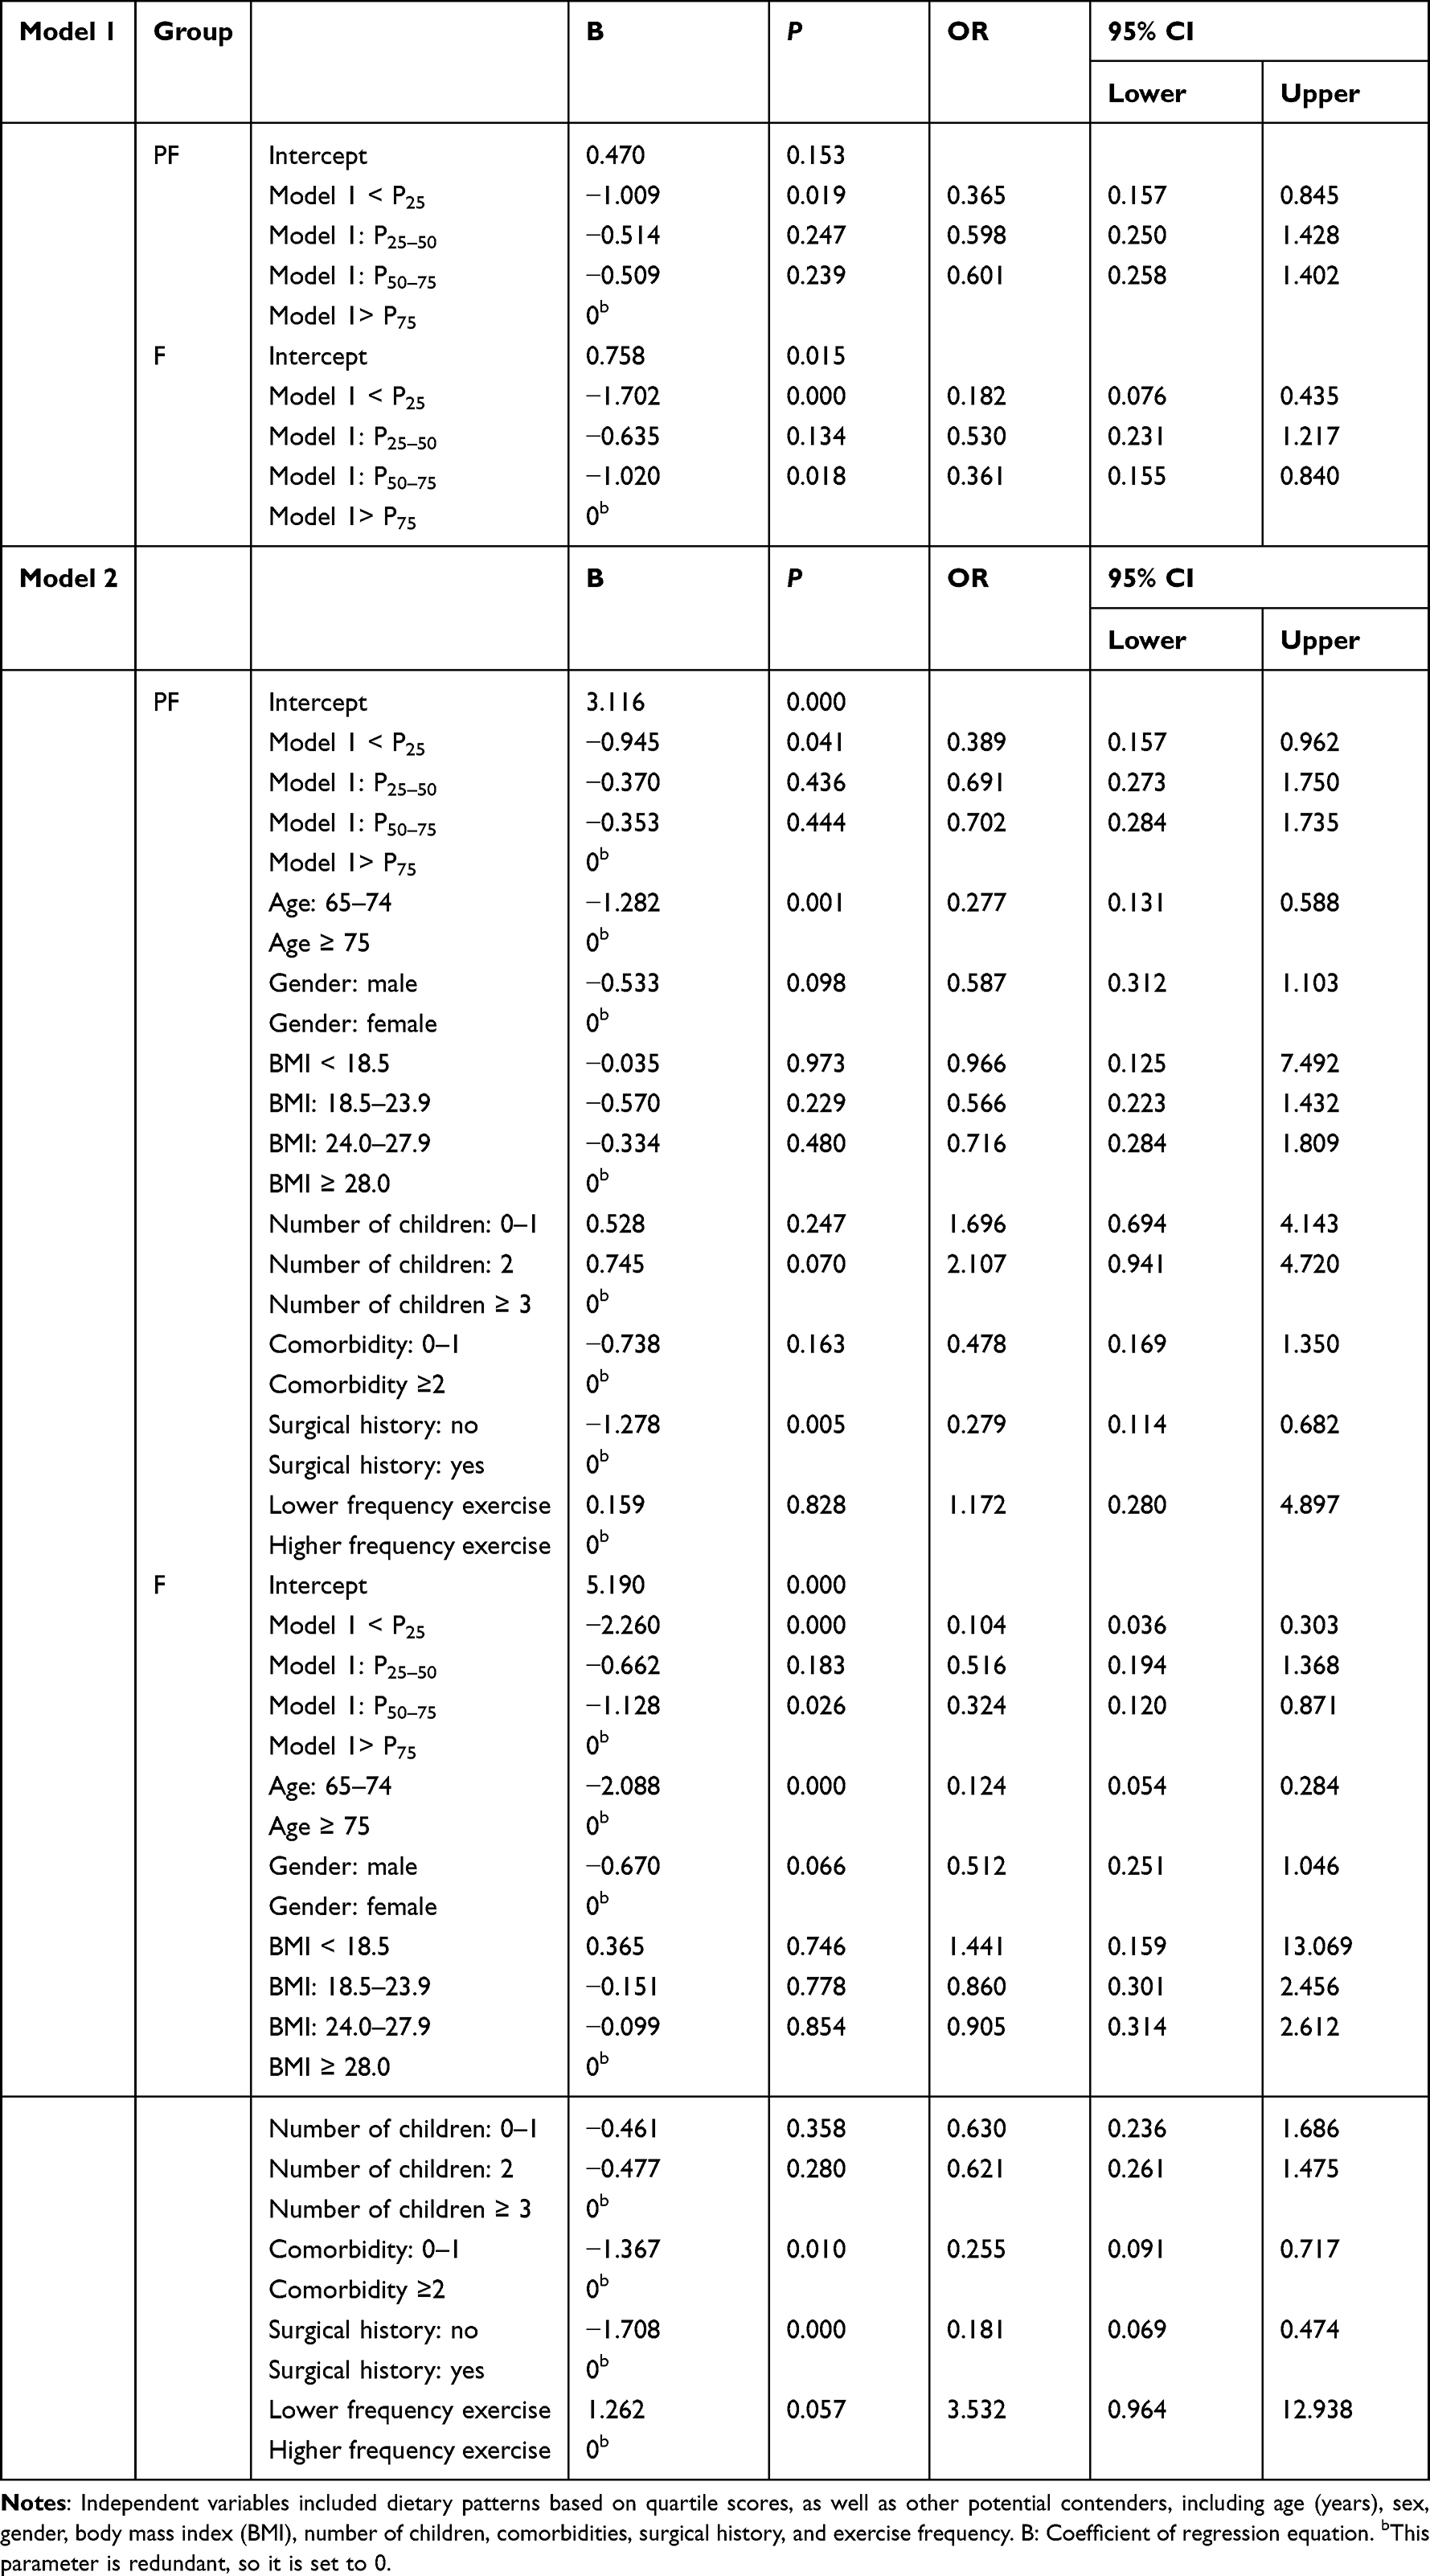 |
Table 5 Odds Ratios (OR) and 95% Confidence Intervals (CI) for Frailty According to the Ordinary Food Pattern Score Quartile |
Discussion
This research reflects a certain degree of innovation. First, it is the first study to examine the correlation between dietary structure and frailty among the elderly in northwestern China. Second, we found that the elderly in the community generally had poor dietary quality. Though the intake of staple food fell within the recommended range, their intake of other kinds of foods was low. Third, frail individuals are more likely to have an ordinary diet, and the overall intake of energy, protein, fat, and dietary fiber in the ordinary diet is low, especially iron, vitamin E, polyunsaturated fatty acids, and legume protein. This indicates that frail elderly have an inadequate intake of soy products, oils, and seafoods such as deep-sea fish. This may be due to the loss of appetite and reduced intake associated with frailty, which leads to a cycle of malnutrition.
A meta-analysis including 5447 elderly (mean age 77.2 years) showed that the prevalence of frailty and the prevalence of malnutrition were significantly correlated (P < 0.001), with approximately 90% of malnourished elderly individuals also displaying frailty (P < 0.001).14 Moreover, anabolic resistance and impairment may occur in the elderly, and their anabolic threshold is elevated. As such, nutrient intake should be increased to extend the refractory period of anabolic signals.15 The type of protein source is also thought to influence muscle mass. Positive correlations have been found between plant proteins and muscle mass, strength, function, and faster walking speed.16
Although our dietary survey showed there was no significant difference between the NF and F groups in the intake of protein and other major nutrients, the overall trend was decreasing. This may be related to an insufficient sample size. Recently a Japanese study found that diets high in protein and antioxidants were closely related to a low prevalence of frailty in elderly women.17 Intervention trials further showed that protein supplementation for frail elderly individuals may delay the process of functional decline,18 prevent somatic hypofunction, increase body mass and muscle volume, and enhance grip and knee-joint strength.19 In addition, certain amino acids inhibit age-related muscle loss by enhancing muscle protein synthesis, and leucine-rich supplements are now recommended for the treatment of sarcopenia.20 The elderly in China should also increase their protein intake appropriately, especially plant proteins such as beans.
We also found that the intake of iron, vitamin E, and polyunsaturated fatty acids among the frail elderly is insufficient. Studies have shown that iron deficiency decreases the hemoglobin levels and increases the risk of frailty.21 Another meta-analysis involving four older European populations found that low vitamin A and vitamin E levels were associated with the prevalence of frailty.22 It has been found that higher circulating long-chain omega-3 fatty acids are positively correlated with gait speed23 and intake of more omega-3 fatty acids can help reduce the risk of frailty development.24 Obviously, frailty is not only related to insufficient intake of macronutrients, but also of various micronutrients, such as vitamins C, D, and E.25
Although the above-mentioned studies have confirmed the relationship between nutrients and frailty, individuals eat a variety of complex foods with various antagonistic or synergistic effects. Therefore, more researchers have begun to analyze dietary patterns to comprehensively consider the interaction of different nutrients. Currently, there are two main analytical methods used:26 one is a priori dietary pattern, which refers to scoring an individual’s compliance with recommended dietary guidelines or predetermined dietary patterns based on popular scientific evidence, such as widespread Mediterranean dietary patterns. A cohort study in the United Kingdom confirmed that the Mediterranean diet can reduce the risk of frailty.27 The second method is the posterior dietary pattern, which uses statistical exploratory methods to determine the dietary pattern founded on the individual’s dietary intake. Obviously, this method is more in line with the actual situation. A prospective study from Spain showed that a “prudent” dietary pattern (characterized by high consumption of olive oil and vegetables) was inversely associated with the incidence of frailty; conversely, the Western dietary pattern was associated with a higher risk of slower gait speed and weight loss.24 Another study showed that healthier dietary patterns in men aged 58–79 years were linked to a lower risk of mobility restriction 15 years later.28 However, a prospective study conducted by Chan et al in Hong Kong found that frailty was not related to dietary patterns and only negatively correlated with the international diet quality index. As such, the relationship between frailty and dietary patterns among the elderly in China should be further explored.8
A healthy diet is based on a high intake of fruits, vegetables, and whole grains as well as a low intake of high-fat dairy products and red and processed meats,29 whose anti-inflammatory properties and antioxidants may delay frailty.30 However, because of economic conditions and traditional culture, the overall dietary intake of the elderly in China is low. Contradictory to traditional concepts, we believe that the elderly should increase their intake of meat, beans, and seafood to improve their frail state.
This study also has some limitations. First, the sample size was relatively small and many elderly people were not part of in the study due to mobility difficulties Therefore, the prevalence and severity of frailty may have been underestimated. Second, this study was conducted in autumn and the results may be affected by the seasons. In the future, data should be taken several times in different seasons. Third, dietary questionnaires were used instead of actual weighing. Moreover, because Chinese individuals are used to eating multiple dishes with their families, only the per capita portions were estimated, which may lead to omissions and under counts. Fourth, although we adjusted for potential confounding factors, there may be others that were not measured. Fifth, factor analysis inevitably involves subjective decisions: the combination of foods into food groups, the number of factors extracted, conversion methods, and labeling the dietary patterns. The derived dietary patterns may also have some shared components, making them difficult to compare. However, to reduce the risk of bias, the most common dietary patterns and food-matching factors were selected in the study. Sixth, although this study investigated the diet of the elderly in 13 communities, these are relatively low-income communities, and there was a certain gap between the living standard of the elderly in middle-class and high-class communities. This means they cannot fully represent the overall dietary condition, and the result may not be extended to the general population. Finally, as this was essentially a cross-sectional study, the observed relationship cannot be interpreted as causation and has yet to be explored in future prospective studies.
In short, ordinary diets may not be suitable for the elderly in China. The ordinary diet in our study was positively correlated with the risk of frailty, indicating that it is necessary to increase their intake of meat, beans, and seafood to improve their overall nutritional level. The implications of these findings may significantly help in improving the nutritional level of the elderly, alleviating frailty, promoting health, and greatly reducing the country’s medical burden, as simple dietary adjustments may provide tremendous overall nutritional benefits and risk reduction. Next, we plan to conduct prospective studies to further explore the relationship between aging, frailty, health, and nutrition through dietary interventions.
Abbreviations
NF, Non-frailty group; PF, Pre-frailty group; F, Frailty group; BMI, Body mass index.
Acknowledgments
Thanks to all authors for their efforts, especially to Professor Shang Lei for his guidance in statistical methods.
Author Contributions
All authors made a significant contribution to the work reported, whether that is in the conception, study design, execution, acquisition of data, analysis and interpretation, or in all these areas; took part in drafting, revising or critically reviewing the article; gave final approval of the version to be published; have agreed on the journal to which the article has been submitted; and agree to be accountable for all aspects of the work.
Funding
This research was supported by National Key R&D Program of China (No.2020YFC2008000), Military Health Care Project of China (19BJZ05) and Shaanxi Provincial Key Research and Development Program (2020SF-225).
Disclosure
All authors have no conflicts of interest.
References
1. Clegg A, Young J, Iliffe S, Rikkert MO, Rockwood K. Frailty in Elderly People. Lancet. 2013;381(9868):752–762. doi:10.1016/S0140-6736(12)62167-9
2. Visschere LD, Janssens B, Reu GD, Duyck J, Vanobbergen J. An oral health survey of vulnerable older people in Belgium. Clin Oral Investig. 2016;20(8):1903–1912. doi:10.1007/s00784-015-1652-8
3. Morley JE, Vellas B, Van Kan GA, et al. Frailty consensus: a call to action. J Am Med Dir Assoc. 2013;14:392–397. doi:10.1016/j.jamda.2013.03.022
4. Fried LP, Tangen CM, Walston J, et al. Frailty in older adults: evidence for a phenotype. J Gerontol a Biol Sci Med Sci. 2001;56(3):M146–M156. doi:10.1093/gerona/56.3.M146
5. Artaza-Artabe I, Sáez-López P, Sánchez-Hernández N, Fernández- Gutierrez N, Malafarina V. The relationship between nutrition and frailty: effects of protein intake, nutritional supplementation, vitamin D and exercise on muscle metabolism in the elderly. a systematic review. Maturitas. 2016;93:89–99. doi:10.1016/j.maturitas.2016.04.009
6. Bonnefoy M, Berrut G, Lesourd B, et al. Frailty and nutrition: searching for evidence. J Nutr Health Aging. 2015;19:250–257. doi:10.1007/s12603-014-0568-3
7. Liu KQ, Ding XY, Zhao WH. Influence of dietary pattern on human immunity. Natl Med J China. 2020;48:3890–3896.
8. Chan R, Leung J, Woo J. Dietary patterns and risk of frailty in Chinese community-dwelling older people in Hong Kong: a prospective cohort study. Nutrients. 2015;7(8):7070–7084. doi:10.3390/nu7085326
9. Wang Y, Huang Y, Wu H. Association between dietary patterns and frailty prevalence in shanghai suburban elders: a cross-sectional study. Int J Environ Res Public Health. 2021;18(20):10852.
10. Basilevsky AT. Statistical Factor Analysis and Related Methods-Theory and Application. New York: Wiley Interscience; 1994.
11. Kim J-O, Mueller CW. Factor Analysis: Statistical Methods and Practical Issues. Thousand Oaks, Calif., USA: Sage Publications; 1978.
12. Rezazadeh A, Rashidkhani B, Omidvar N. Association of major dietary patterns with socioeconomic and lifestyle factors of adult women living in Tehran, Iran. Nutrition. 2010;26(3):337–341. doi:10.1016/j.nut.2009.06.019
13. Shang L, O’Loughlin J, Tremblay A, Gray-Donald K. The association between food patterns and adiposity among Canadian children at risk of overweight. Appl Physiol Nutr Metab. 2014;39(2):195–201. doi:10.1139/apnm-2012-0392
14. Verlaan S, Ligthart-Melis GC, Wijers SLJ, Cederholm T, Maier AB, Schueren MAE. High prevalence of physical frailty among community- dwelling malnourished older adults-a systematic review and meta-analysis. J Am Med Dir Assoc. 2017;18(5):374–382. doi:10.1016/j.jamda.2016.12.074
15. Dardevet D, Remond D, Peyron MA, Papet I, Savary-Auzeloux I, Mosoni L. Muscle wasting and resistance of muscle anabolism: the“anabolic threshold concept” for adapted nutritional strategies during sarcopenia. Sci World J. 2012;2012:269531. doi:10.1100/2012/269531
16. Smeets ETHC, Feskens EJM, Groot LCPGM, Eeuwijk FA. Dietary intakes of vegetable protein, folate, and vitamins B-6 and B-12 are partially correlated with physical functioning of Dutch older adults using copula graphical models. Nutr. 2020;150:634–643.
17. Kobayashi S, Asakura K, Suga H, Sasaki S. Three-generation Study of Women on Diets and Health Study Group. Diet with a combination of high protein and high total antioxidant capacity is strongly associated with low prevalence of frailty among old Japanese women: a multicenter cross-sectional study. Nutr J. 2017;16(1):29. doi:10.1186/s12937-017-0250-9
18. Kim CO, Lee KR. Preventive effect of protein-energy supplementation on the functional decline of frail older adults with low socioeconomic status: a community- based randomized controlled study. J Gerontol a Biol Sci Med Sci. 2013;68(3):309–316. doi:10.1093/gerona/gls167
19. Coelho-Júnior HJ, Rodrigues B, Uchida M, Marzetti E. Low protein intake is associated with frailty in older adults: a systematic review and meta- analysis of observational studies. Nutrients. 2018;10(9):1334. doi:10.3390/nu10091334
20. Morley JE, Argiles JM, Evans WJ, et al. Nutritional recommendations for the management of sarcopenia. J Am Med Dir Assoc. 2010;11:391–396. doi:10.1016/j.jamda.2010.04.014
21. Wawera AA, Jennings A, Fairweather-Tait SJ. Iron status in the elderly: a review of recent evidence. Mech Ageing Dev. 2018;175:55–73. doi:10.1016/j.mad.2018.07.003
22. Pilleron S, Weber D, Peres K, et al. Patterns of circulating fat-soluble vitamins and carotenoids and risk of frailty in four European cohorts of older adults. Eur J Nutr. 2019;58(1):379–389. doi:10.1007/s00394-017-1602-0
23. Frison E, Boirie Y, Peuchant E, Tabue-Teguo M, Barberger-Gateau P, Féart C. Plasma fatty acid biomarkers are associated with gait speed in community-dwelling older adults: the Three-City-Bordeaux study. Clin Nutr. 2017;36(2):416–422. doi:10.1016/j.clnu.2015.12.008
24. Leon-Munoz LM, Garcia-Esquinas E, Lopez-Garcia E, Banegas JR, Rodríguez-Artalejo F. Major dietary patterns and risk of frailty in older adults: a prospective cohort study. BMC Med. 2015;13:11. doi:10.1186/s12916-014-0255-6
25. Yannakoulia M, Ntanasi E, Anastasiou CA, Scarmeas N. Frailty and nutrition: from epidemiological and clinical evidence to potential mechanisms. Metabolism. 2017;68:64–76. doi:10.1016/j.metabol.2016.12.005
26. Guallar-Castillón P, Rodríguez-Artalejo F, Tormo MJ, et al. Major dietary patterns and risk of coronary heart disease in middle-aged persons from a Mediterranean country: the EPIC-Spain cohort study. Nutr Metab Cardiovasc Dis. 2012;22(3):192–199. doi:10.1016/j.numecd.2010.06.004
27. Parsons TJ, Papachristou E, Atkins JL, et al. Physical frailty in older men: prospective associations with diet quality and patterns. Age Ageing. 2019;48(3):355–360. doi:10.1093/ageing/afy216
28. Parsons TJ, Papachristou E, Atkins JL, et al. Healthier diet quality and dietary patterns are associated with lower risk of mobility limitation in older men. Eur J Nutr. 2019;58(6):2335–2343. doi:10.1007/s00394-018-1786-y
29. US Department of Health and Human Services and US Department of Agriculture. Dietary Guidelines for Americans. 2015–2020.
30. Soysal P, Stubbs B, Lucato P, et al. Inflammation and frailty in the elderly: a systematic review and meta-analysis. Ageing Res Rev. 2016;31:1–8. doi:10.1016/j.arr.2016.08.006
 © 2022 The Author(s). This work is published and licensed by Dove Medical Press Limited. The full terms of this license are available at https://www.dovepress.com/terms.php and incorporate the Creative Commons Attribution - Non Commercial (unported, v3.0) License.
By accessing the work you hereby accept the Terms. Non-commercial uses of the work are permitted without any further permission from Dove Medical Press Limited, provided the work is properly attributed. For permission for commercial use of this work, please see paragraphs 4.2 and 5 of our Terms.
© 2022 The Author(s). This work is published and licensed by Dove Medical Press Limited. The full terms of this license are available at https://www.dovepress.com/terms.php and incorporate the Creative Commons Attribution - Non Commercial (unported, v3.0) License.
By accessing the work you hereby accept the Terms. Non-commercial uses of the work are permitted without any further permission from Dove Medical Press Limited, provided the work is properly attributed. For permission for commercial use of this work, please see paragraphs 4.2 and 5 of our Terms.