")
Back to Journals » International Journal of Nanomedicine » Volume 10 » Issue 1
Study of antitumor activity in breast cell lines using silver nanoparticles produced by yeast
Authors Ortega F, Fernández Baldo M, Fernández J, Serrano M, Sanz M, Díaz-Mochón J, Lorente J, Raba J
Received 15 October 2014
Accepted for publication 22 November 2014
Published 16 March 2015 Volume 2015:10(1) Pages 2021—2031
DOI https://doi.org/10.2147/IJN.S75835
Checked for plagiarism Yes
Review by Single anonymous peer review
Peer reviewer comments 4
Editor who approved publication: Dr Thomas Webster
Francisco G Ortega,1 Martín A Fernández-Baldo,2 Jorge G Fernández,2 María J Serrano,1 María I Sanz,2 Juan J Diaz-Mochón,1 José A Lorente,1 Julio Raba2
1GENYO, Centre for Genomics and Oncological Research: Pfizer-University of Granada, Andalusian Regional Government, PTS Granada, Avenida de Ilustración, Granada, Spain; 2INQUISAL, Departamento de Química, CONICET, Universidad Nacional de San Luis, San Luis, Argentina
Abstract: In the present article, we describe a study of antitumor activity in breast cell lines using silver nanoparticles (Ag NPs) synthesized by a microbiological method. These Ag NPs were tested for their antitumor activity against MCF7 and T47D cancer cells and MCF10-A normal breast cell line. We analyzed cell viability, apoptosis induction, and endocytosis activity of those cell lines and we observed that the effects of the biosynthesized Ag NPs were directly related with the endocytosis activity. Moreover, Ag NPs had higher inhibition efficacy in tumor lines than in normal lines of breast cells, which is due to the higher endocytic activity of tumor cells compared to normal cells. In this way, we demonstrate that biosynthesized Ag NPs can be an alternative for the treatment of tumors.
Keywords: apoptosis, biosynthesized silver nanoparticles, breast cancer, microbiological synthesis
Introduction
Breast cancer is the most frequently diagnosed malignancy in women.1 Despite considerable advances in early detection, diagnosis, and treatment, breast cancer is among the leading causes of cancer-related death in women.2
Silver nanoparticles (Ag NPs) have gained interest in the field of nanomedicine due to their unique properties and obvious therapeutic potential in the diagnosis and treatment of some human cancer types.3 Numerous studies have used Ag NPs to induce apoptosis in tumor cell lines, but so far, no study has been able to reliably observe a significant difference in the effect of the Ag NPs between tumor and nontumor cell lines.4–6
The Ag NPs can be synthesized by chemical or microbiological methods. During the past few years, the microbiological alternative has gained importance because it presents some important advantages over chemical synthesis such as higher production, faster production, lower costs, and being eco-friendly.7–19 Other relevant advantages have been observed in the different functional groups conjugated with the surface of biosynthesized Ag NPs, which could play an important role in various biomedical applications.5,16
In the search for specific mechanisms which focus on discriminating tumor and nontumor cells, recent studies have reported that the endocytosis activity of tumor cells is largely increased compared to nontumor cells.20 Considering that the mechanism by which Ag NPs are uptaken by cells may be endocytosis,21,22 and due to endocytosis being increased in tumor cells, we hypothesized that Ag NPs produced by microbiological methods will be uptaken in a higher proportion by tumor cells than nontumor cells and will therefore be capable of inducing higher apoptosis rates in those cells.
In the present work, Ag NPs synthesized by a microbiological method were tested as antitumoral agents using two breast cancer cell lines. Fluorescent microscopy was used to measure endocytosis, showing the differences in apoptosis rates and cell viability between tumor and nontumor cells.20
Materials and methods
Silver nanoparticles
The Ag NPs used in the present study were synthesized and characterized in the Laboratory of Industrial Microbiology of FQByF (Universidad Nacional de San Luis, [UNSL]) (unpublished data). These nanoparticles were obtained by microbiological synthesis from culture supernatants of the yeast Cryptococcus laurentii (BNM 0525). Moreover, chemical Ag NPs from Sigma-Aldrich Co. (St Louis, MO, USA) were used as control. The principal characteristics of Ag NPs are presented in Table 1.
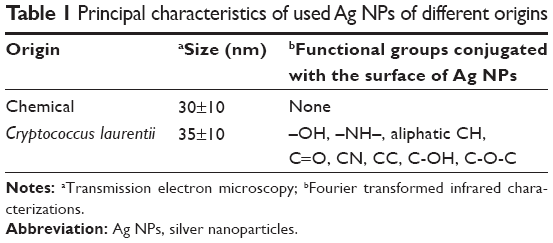 | Table 1 Principal characteristics of used Ag NPs of different origins |
Cell culture
MCF7 and T47D human breast cancer cells and MCF10-A normal breast cells were kindly provided by Scientific Implementation Center, University of Granada, Granada, Spain. Breast cancer cell lines were grown adherently and maintained in Dulbecco’s Modified Eagle’s Medium containing 10% fetal bovine serum, and 1% antibiotic solution containing penicillin and streptomycin at 37°C in 5% CO2. MCF10-A line cells were grown adherently and maintained in Mammary Epithelial Cell Growth Medium (without fetal bovine serum), 1% antibiotic solution containing penicillin and streptomycin, and 100 ng·mL−1 of choleric toxin, which has an enhanced mitogenic effect on epithelial cells.23 All experiments were performed in six-well plates, unless stated otherwise. Cells were seeded onto the plates at a density of 1×10⁶ cells per well and incubated for 24 hours prior to the experiments.
Cell viability assay
The MTT (3-(4,5-dimethylthiazol-2-yl)-2,5-diphenyltetrazolium bromide) assay is a colorimetric assay for assessing cell viability. The NAD(P)H oxidoreductase enzymes may reflect the number of viable cells present. These enzymes are capable of reducing the tetrazolium dye MTT to purple insoluble formazan.24 MTT assay was used to determine cellular mitochondrial dehydrogenase activity, in order to reflect cell death.
The cells were plated in 96-well plates at an initial density of 1×10⁴ cells per well and cultured for 12 hours. Following this, different concentrations of Ag NPs were added and incubated for another 12 hours. Then, a total of 50 μL of MTT solution 2 mg·mL−1 in phosphate buffered saline (PBS) was added to each well and incubated for 4 hours. After careful removal of the culture media, 150 μL dimethyl sulfoxide per well was added to dissolve the precipitate for 30 minutes. Plates were read on a microplate reader (NanoQuant, Infinite M200 pro; Tecan, San Jose, CA, USA) at a wavelength of 570 nm and a reference wavelength of 690 nm.
Annexin assay
Annexin A5 is used as a test to detect phosphatidylserine and phosphatidylethanolamine expression on cell surface, an event found in apoptosis as well as other forms of cell death.25–27 The three cell lines were incubated for 12 hours with 0, 2.5, and 5 μg·mL−1 of Ag NPs. After that, the cells were unstuck with trypsin and apoptosis detection was made using the Annexin V-FITC Apoptosis Detection Kit (Abcam, Cambridge, UK). Cells were labeled with annexin V fluorescein isothiocyanate (FITC) and counted by flow cytometry (Becton, Dickinson and Company, Franklin Lakes, NJ, USA).
Western blotting
To determine procaspase-9 and Bcl-2, the culture cells were exposed to 5 μg·mL−1 of Ag NPs. Cells were collected at 12 hours and lysed with buffer lysis (Cell Signaling Technology, Boston, MA, USA). Proteins were extracted and quantified by Pierce® BCA-Protein assay kit (Thermo Fisher Scientific, Waltham, MA, USA) and 20 μg of proteins per well were placed in polyacrylamide gel (Bio-Rad Laboratories Inc., Hercules, CA, USA) and transferred to membrane (Bio-Rad Laboratories Inc.) by fast transference trans blot® Turbo (Bio-Rad Laboratories Inc.). Membranes were blocked with nonfat milk for 1 hour and incubated with their corresponding primary antibodies overnight. Then, membranes were cleaned in PBS Tween 0.2% and incubated with corresponding secondary antibodies conjugated with horseradish peroxidase for 1 hour. After the cleaning of the membranes, they were revealed (GE Healthcare Ltd, Little Chalfont, UK) and observed in the photocamera (ImageQuant LAS 4000; GE Healthcare).
Caspase-3/7 and -8 activities
Caspase-3/7 and -8 activities were measured using Caspase-Glo® 3/7 and Caspase-Glo® 8 Assay kits (Promega Corporation, Fitchburg, WI, USA) according to manufacturer’s instructions. (Caspase-Glo® 3/7 kit use a substrate to caspase-3 and caspase-7, detect activity of each one is not possible) Briefly, MCF7, T47D, and MCF10-A cells were seeded at 5×10⁴ cells/well in 96-well plates and grown for 12 hours. After incubation for 6 hours with 0, 2.5, and 5 μg·mL−1 of Ag NPs, Caspase-Glo® reagent was added in each well. These plates were incubated for 1 hour, and the luminescence was determined by luminometer. We present the data as the mean ± standard deviation from three replicates.
FITC-dextran assay
Endocytosis differences between MCF7, T47D, and MCF10-A cell lines were measured using FITC-dextran (FD10S, average molar weight: 10.000; Sigma-Aldrich Co.). Cells were grown in 24-well plates over poly-L-lysine-coated coverslips for 12 hours, then treated with FITC-dextran at 0.5 mg·mL−1 and incubated for 0, 6, and 12 hours in culture conditions. After washing with cold PBS and fixing with 4% paraformaldehyde, the coverslips were mounted onto slides, using mounting medium with 4′,6-diamidino-2-phenylindole (DAPI). The samples were analyzed by fluorescence confocal microscope and quantification was performed using ImageJ 1.47t software (National institutes of Health, Bethesda, MD, USA).
Ag NPs endocytosis
To check that the Ag NPs are endocyted by the cells, a FITC conjugation was realized thanks to NH2 groups associated to NPs. (Figure S1). On milliliter of the Ag NPs suspension was added to a solution of FITC in 0.1 M carbonate–bicarbonate buffer and vortexed for 1 minute, and the vial reaction was covered with aluminum foil and incubated for 2 hours at room temperature. To finish, the Ag NPs were washed with cold PBS. The cell lines were incubated with conjugated FITC Ag NPs for 15 minutes. After the incubation, the cells were washed with cold PBS and fixed as described previously, followed by a fluorescent identification of the early endosome marker EEA1. The cells were incubated for 30 minutes with blocking reagent, then incubated overnight with anti-EEA1 antibody (Abcam), and finally for 1 hour with alexa fluor 568 conjugated secondary antibody (Figure S2). The slides were mounted using mounting medium with DAPI (Vector, Cambridgeshire, UK). Finally, the analysis was performed with confocal microscope (Zeiss LSM710; Carl Zeiss Meditec AG, Jena, Germany).
Endocytosis inhibition
To see if the Ag NPs endocytosis is related to the cell activity loss, we performed a comparison between treated and untreated cells with dynasore. Dynasore is a dynamin inhibitor and dynamin is essential for clathrin-dependent coated vesicle formation. It is required for membrane budding at a late stage during the transition from a fully formed pit to a pinched-off vesicle.28 The cells were cultured in a 96-well plate for 12 hours, then they were incubated with dynasore for 6 hours, and finally were incubated with 0, 2.5, and 5 μg·mL−1 of Ag NPs for 12 hours. To detect the cell viability, an MTT assay was performed as described previously.
Statistical analysis
Experiments were performed in triplicates. Data are expressed as mean ± standard error. Statistical analyses were performed using independent t-tests for two-group comparisons and a one-way analysis of variance, after checking homogeneity of variance using Levene’s test, in case of multiple comparisons. Analysis of variance was followed by post-hoc Scheffé’s test. Differences at P<0.05 were considered to be statistically significant.
Results
Previous studies
Prior to the present work, our previous studies of antitumor activity using chemical Ag NPs from Sigma-Aldrich Co. as control were been carried out. The chemical Ag NPs showed antitumor activity. But these did not show significant differences between tumor and nontumor cells (Figure S3; Table S1).
Antitumoral activity
To determinate cytotoxicity of Ag NPs, MTT assays were carried out. We observed that cell viability reduction was correlated to Ag NP concentrations so that, at higher Ag NP concentrations, there was higher cell viability inhibition. A key aspect in this research was to see if tumor cells (MCF7 and T47D) were more sensitive than nontumor cells to the presence of Ag NPs. Figure 1 and Table S1 show that cell viability was significantly reduced in tumor cells following 12 hours’ incubation and using concentrations above 2.5 μg·mL−1, while in the case of MCF10-A, cell viability was just slightly reduced. Therefore, these data confirm that tumor cells are more sensitive than nontumor cells to biosynthetic Ag NPs treatment.
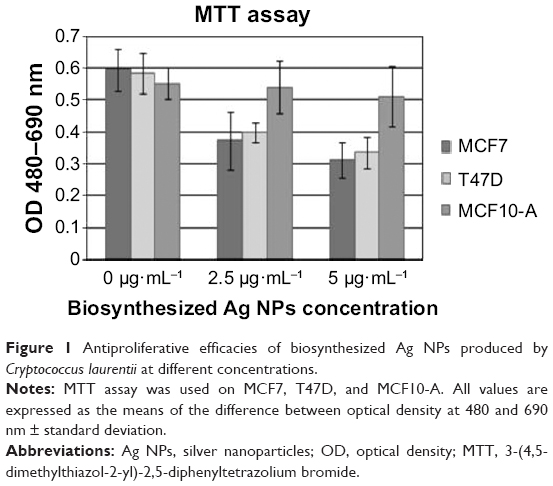 | Figure 1 Antiproliferative efficacies of biosynthesized Ag NPs produced by Cryptococcus laurentii at different concentrations. |
To see if the cell viability was reduced via apoptotic pathways, we performed annexin V affinity assay, which labels cells found in apoptosis so they can be detected by flow cytometry analysis. Following 6 hours’ incubation and using 5 μg·mL−1 Ag NPs, 61% and 57% of the total number of MCF7 and T47D cells were found in the apoptosis process, respectively, while in the case of MCF10-A, the apoptotic population corresponded to just approximately 17% (Figures 2 and S4; Table S2).
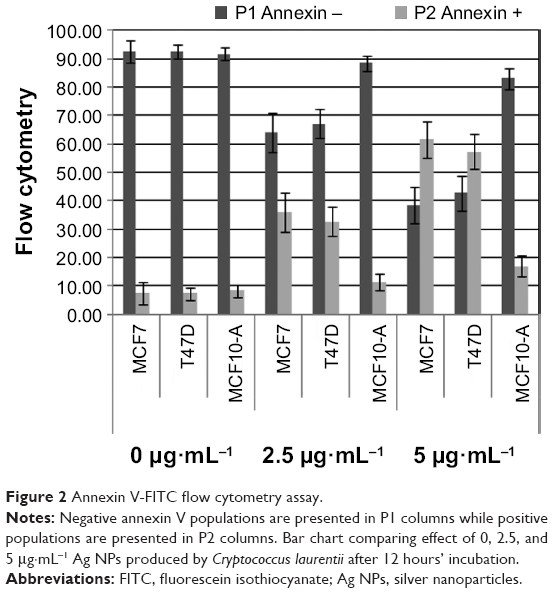 | Figure 2 Annexin V-FITC flow cytometry assay. |
To observe if apoptosis was induced via either extrinsic or intrinsic pathways, as the result of mitochondrial toxicity generated by Ag ions inside of mitochondria,4–6 we analyzed caspase-9 and Bcl-2 concentrations by Western blotting, and caspase-8 and caspase-3/7 concentrations by luciferase assay from cell lysates. The results showed that caspase-9 was overexpressed and caspase-3/7 activity was increased in MCF7 and T47D cells treated with Ag NPs, and those increases were proportional to Ag NP concentrations. Moreover, Bcl-2 expression proportionally decreased as Ag NP concentrations increased, while caspase-8 activity was unaffected. On the other hand, in nontumoral MCF10-A cells, caspase levels and activities presented only subtle changes, and Bcl-2 concentration was also maintained at constant levels (Figures 3 and 4).
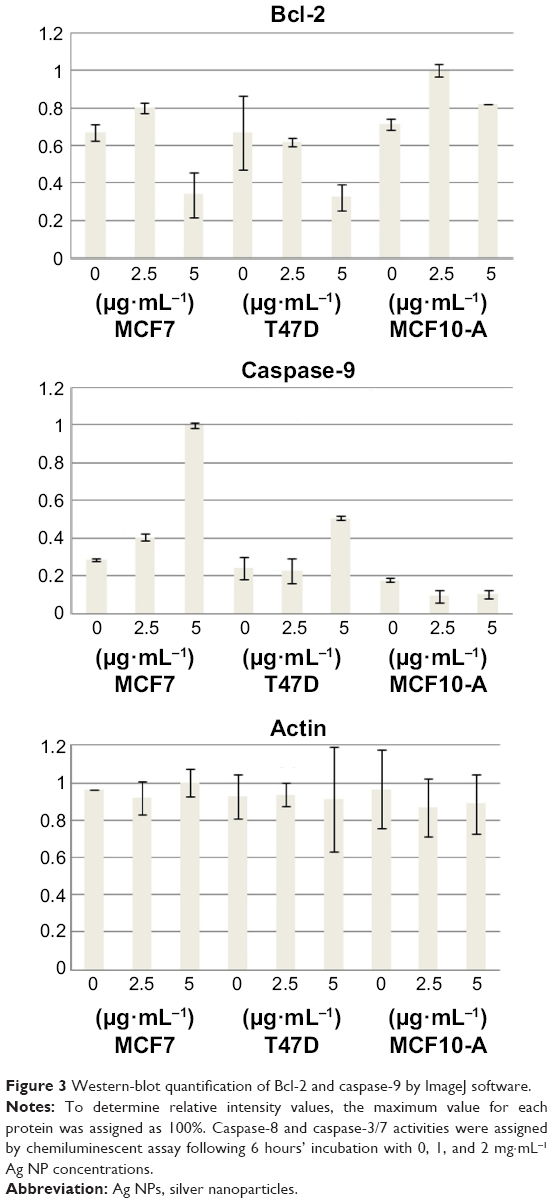 | Figure 3 Western-blot quantification of Bcl-2 and caspase-9 by ImageJ software. |
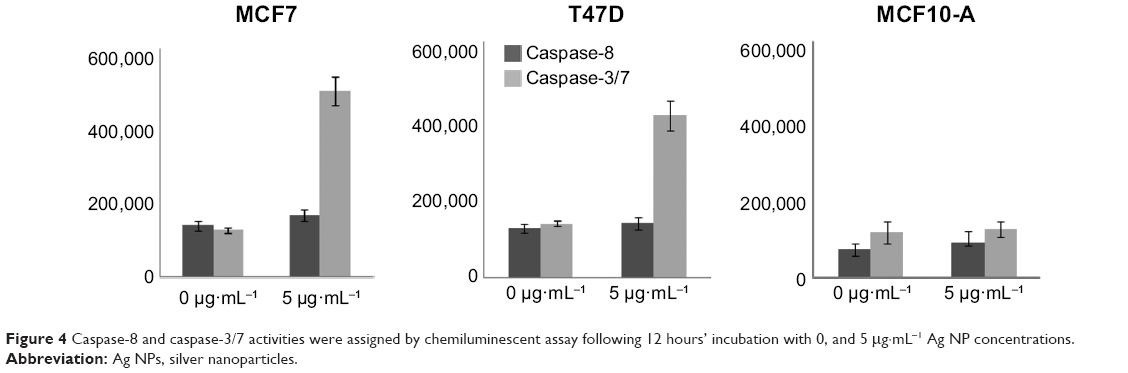 | Figure 4 Caspase-8 and caspase-3/7 activities were assigned by chemiluminescent assay following 12 hours’ incubation with 0, and 5 μg·mL−1 Ag NP concentrations. |
Endocytosis activity
To assess endocytosis activity, we performed a FITC-dextran assay, where we observed that tumor cells uptake dextran particles faster than MCF10-A cells (Figures 5 and S5). When we used FITC-conjugated Ag NPs, we observed that the Ag NPs enter into the tumor cells through endosomes. The colocalization between EEA 1 and Ag NPs was observed in the confocal analysis (Figure 6). The inhibition of endocytosis with dynasore showed an increase in cell viability in treated cells relative to untreated cells in the MTT assay results (Figure 7).
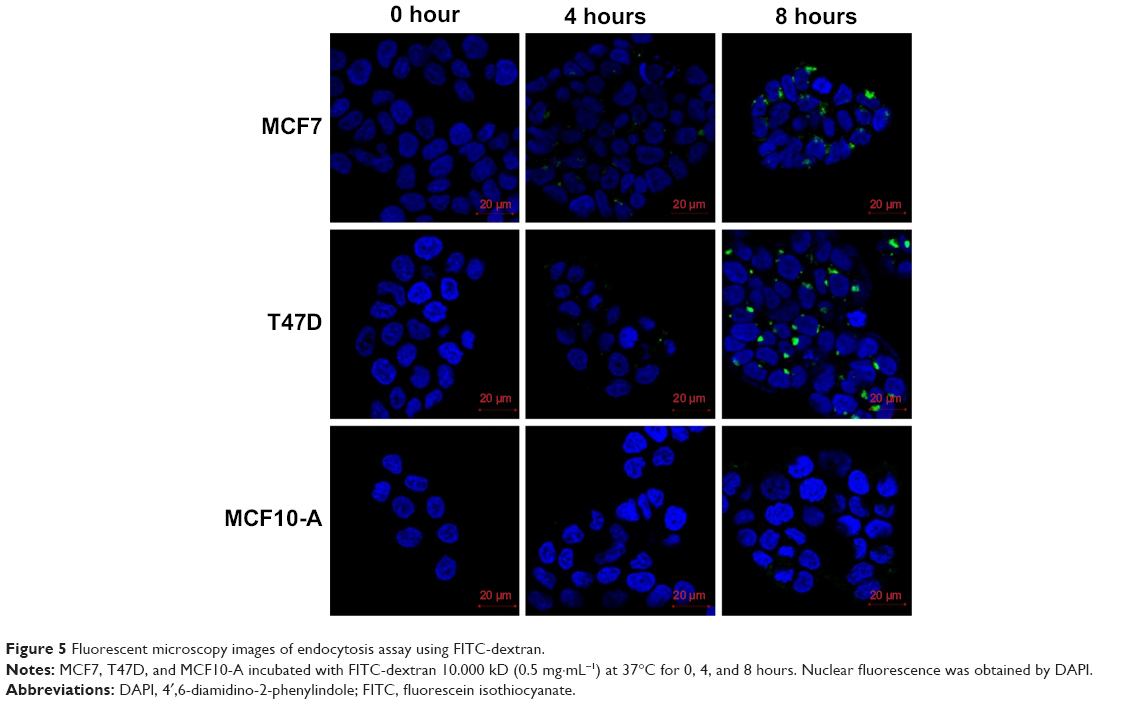 | Figure 5 Fluorescent microscopy images of endocytosis assay using FITC-dextran. |
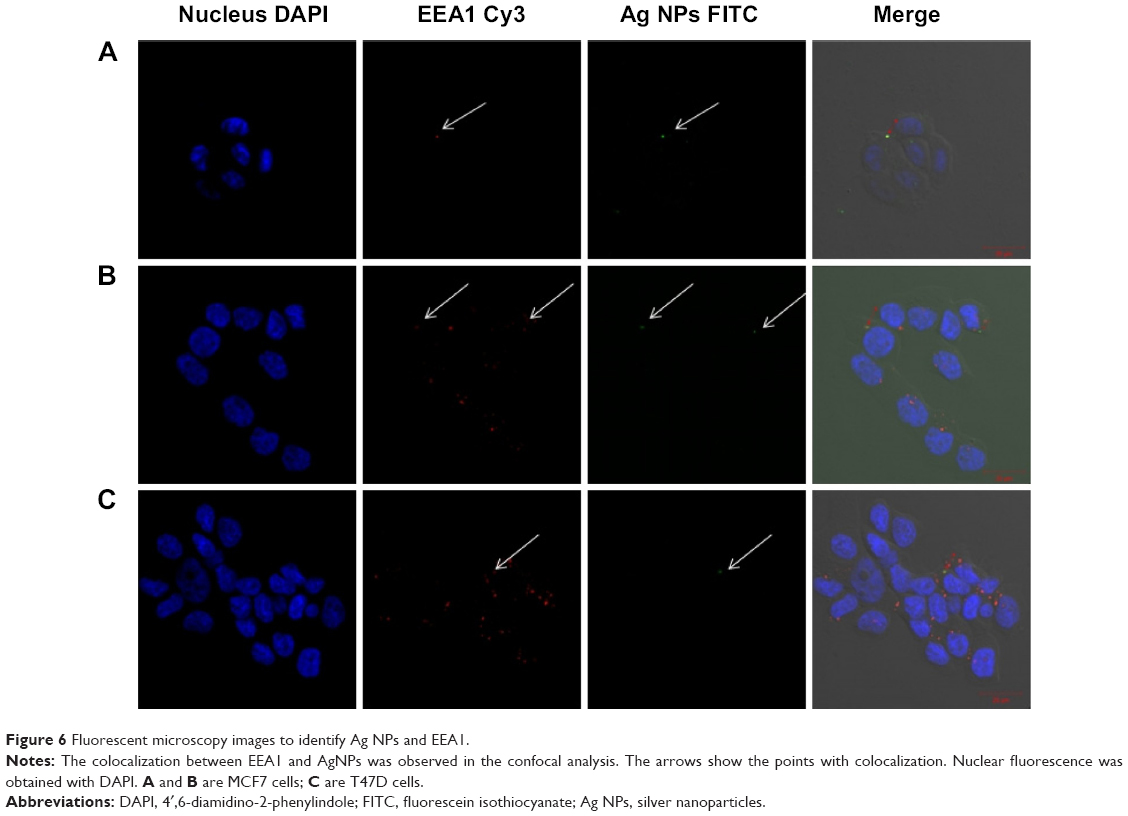 | Figure 6 Fluorescent microscopy images to identify Ag NPs and EEA1. |
 | Figure 7 Antiproliferative efficacy of biosynthesized Ag NPs produced by Cryptococcus laurentii at different concentrations after 12 hours. |
Discussion
The aim of this work was to apply Ag NPs previously synthesized by a microbiological method in order to assess their cytotoxic activity and sensitivity in tumor and nontumor cell lines of breast cancer.
The cytotoxicity assays of biosynthesized Ag NPs from culture supernatants of C. laurentii showed that these Ag NPs reduced cell viability of two cell lines related to breast cancer. We observed that cell viability of breast tumor lines MCF7 and T47D was considerably decreased when cells were exposed to Ag NPs at concentration levels from and above 2.5 μg·mL−1. Moreover, apoptotic assays demonstrated that cell viability was induced by apoptotic mechanisms generated through the intrinsic pathway of caspase activation.29
On the other hand, according to assays of the functional groups conjugated with the surface of Ag NPs and Fourier transformed infrared studies (unpublished data), we can confirm the presence of yeast proteins and polymeric carbohydrates perhaps of arabinogalactan type surrounding this nanoparticle, which would not allow their passing through cytoplasmic membranes by simple diffusion. Therefore, big parts of biosynthesized Ag NPs are uptaken by cells via endocytosis, and they enter into the cytosol within endosomes. These endosomes then fuse with lysosomes to give rise to endolysosomes characterized by an acidic environment. Then, inside the endolysosomes, the biosynthesized Ag NPs are catabolized forming amino acids and Ag ions.30 These ions produce increments of reactive oxygen species that, at mitochondrial levels, generate a dysfunction and the activation of caspases involved in apoptotic intrinsic pathways.31
Moreover, by comparing apoptosis induction by Ag NPs in the MCF10-A nontumor cell line and MCF7 and T47D tumor cell lines, it can be clearly seen that the impact of biosynthesized Ag NPs from C. laurentii was significantly lower in the nontumor cells than in the tumor cells. We also observed, through utilization of FITC-dextran endocytosis assay, that MCF10-A has a lower endocytosis capability than MCF7 and T47D. These differences in endocytic capabilities between tumor and nontumor cells could explain why tumor cells are induced into apoptosis at lower Ag NPs concentrations than nontumor cells. For this reason, biosynthesized Ag NPs from C. laurentii, which are associated with proteins, can be an alternative to tackle, in a selective manner, tumor cells versus nontumor cells where differences in endocytosis activity acts as the targeting mechanism.
Conclusion
In conclusion, we have shown that biosynthesized Ag NPs from culture supernatants of C. laurentii induce apoptosis in breast cancer cell lines while having a much milder effect in nontumor cell lines. Previous studies demonstrated that those Ag NPs were capped by yeast proteins and polymeric carbohydrates of arabinogalactan type, which is pivotal to avoid passive penetration through cytoplasmatic membranes by NPs into mammalian cells. Therefore, these biosynthesized Ag NPs were uptaken by breast cell lines via endocytosis, which is increased in tumor cells compared to nontumor cells. This has allowed us to present endocytic activity differences between tumor and nontumor cells as a targeting mechanism for selective antitumor treatments. These results can help to advance the design of new functionalized Ag NPs for direction towards specific tumor markers.
Acknowledgments
Support from Universidad Nacional de San Luis, to the Agencia Nacional de Promoción Científica y Tecnológica, from Consejo Nacional de Investigaciones Científicas y Técnicas (CONICET) (Argentina), and from GENYO, Centre for Genomics and Oncological Research: Pfizer-University of Granada, Andalusian Regional Government, Granada, Spain are acknowledged.
Disclosure
The authors report no conflicts of interest in this work.
References
Jemal A, Siegel R, Xu J, Ward E. Cancer statistics, 2010. CA Cancer J Clin. 2010;60(5):277–300. | ||
Nadal R, Fernandez A, Sanchez-Rovira P, et al. Biomarkers characterization of circulating tumour cells in breast cancer patients. Breast Cancer Res. 2012;14(3):R71. | ||
Yezhelyev MV, Gao X, Xing Y, Hajj AA, Nie S, O’Regan RM. Emerging use of nanoparticles in diagnosis and treatment of breast cancer. Lancet Oncol. 2006;7(8):657–667. | ||
Gurunathan S, Raman J, Abd Malek SN, John PA, Vikineswary S. Green synthesis of silver nanoparticles using Ganoderma neo-japonicum Imazeki: a potential cytotoxic agent against breast cancer cells. Int J Nanomedicine. 2013;8:4399–4413. | ||
Gopinath P, Gogoi SK, Sanpui P, Paul A, Chattopadhyay A, Ghosh SS. Signaling gene cascade in silver nanoparticle induced apoptosis. Colloids Surf B Biointerfaces. 2010;77(2):240–245. | ||
Hekmat A, Saboury AA, Divsalar A. The effects of silver nanoparticles and doxorubicin combination on DNA structure and its antiproliferative effect against T47D and MCF7 cell lines. J Biomed Nanotechnol. 2012;8(6):968–982. | ||
Blanco-Andujar C, Tung LD, Thanh NTK. Synthesis of nanoparticles for biomedical applications. Annual Reports Section “A” (Inorganic Chemistry). 2010;106:553–568. | ||
Durán N, Marcato PD, Ingle A, Gade A, Rai M. Fungi-Mediated Synthesis of Silver Nanoparticles: Characterization Processes and Applications. In: Rai M, Kövics G, editors. Progress in Mycology. Scientific Publishers, Jodhpur, India. 2010:425–449. | ||
Gade A, Ingle A, Whiteley C, Rai M. Mycogenic metal nanoparticles: progress and applications. Biotechnol Lett. 2010;32(5):593–600. | ||
Gaikwad S, Ingle A, Gade A, et al. Antiviral activity of mycosynthesized silver nanoparticles against herpes simplex virus and human parainfluenza virus type 3. Int J Nanomedicine. 2013;8:4303–4314. | ||
Marcato PD, Nakasato G, Brocchi M, et al. Biogenic silver nanoparticles: antibacterial and cytotoxicity applied to textile fabrics. Journal of Nano Research. 2012;20:69–76. | ||
Singh R, Wagh P, Wadhwani S, et al. Synthesis, optimization, and characterization of silver nanoparticles from Acinetobacter calcoaceticus and their enhanced antibacterial activity when combined with antibiotics. Int J Nanomedicine. 2013;8:4277–4290. | ||
Zhang X, Yan S, Tyagi RD, Surampalli RY. Synthesis of nanoparticles by microorganisms and their application in enhancing microbiological reaction rates. Chemosphere. 2011;82(4):489–494. | ||
Kumar RR, Priyadharsani KP, Thamaraiselvi K. Mycogenic synthesis of silver nanoparticles by the Japanese environmental isolate Aspergillus tamarii. J Nanopart Res. 2012;14:860–865. | ||
Rodriguez AG, Ping LY, Marcato PD, et al. Biogenic antimicrobial silver nanoparticles produced by fungi. Appl Microbiol Biotechnol. 2013;97(2):775–782. | ||
Durán N, Marcato PD, Durán M, Yadav A, Gade A, Rai M. Mechanistic aspects in the biogenic synthesis of extracellular metal nanoparticles by peptides, bacteria, fungi, and plants. Appl Microbiol Biotechnol. 2011;90:1609–1624. | ||
Subramanian M, Alikunhi NM, Kandasamy K. In Vitro Synthesis of Silver Nanoparticles by Marine Yeasts from Coastal Mangrove Sediment. Adv Sci Lett. 2010;3(4):428–433. | ||
Mishra A, Tripathy SK, Yun SI. Bio-synthesis of gold and silver nanoparticles from Candida guilliermondii and their antimicrobial effect against pathogenic bacteria. J Nanosci Nanotechnol. 2011;11(1):243–248. | ||
Namasivayam SKR, Ganesh S, Avimanyu. Evaluation of anti-bacterial activity of silver nanoparticles synthesized from Candida glabrata and Fusarium oxysporum. Int J Med Res. 2011;1(3):131–136. | ||
Levine MN, Hoang TT, Raines RT. Fluorogenic probe for constitutive cellular endocytosis. Chem Biol. 2013;20:614–618. | ||
dos Santos T, Varela J, Lynch I, Salvati A, Dawson KA. Quantitative assessment of the comparative nanoparticle-uptake efficiency of a range of cell lines. Small. 2011;7(23):3341–3349. | ||
Wall DA, Maack T. Endocytic uptake, transport, and catabolism of proteins by epithelial cells. Am J Physiol. 1985;248(1 Pt 1):C12–C20. | ||
Taylor-Papadimitriou J, Purkis P, Fentiman IS. Cholera toxin and analogues of cyclic AMP stimulate the growth of cultured human mammary epithelial cells. J Cell Physiol. 1980;102:317–321. | ||
Mosmann T. Rapid colorimetric assay for cellular growth and survival: application to proliferation and cytotoxicity assays. J Immunol Methods. 1983;65(1–2):55–63. | ||
Huber R, Berendes R, Burger A, et al. Crystal and molecular structure of human annexin V after refinement. Implication for structure, membrane binding and ion channel formation of the annexin family of proteins. J Mol Biol. 1992;223(3):683–704. | ||
Zhou T, Rosen BP. Tryptophan fluorescence reports nucleotide-induced conformational changes in a domain of the ArsA ATPase. J Biol Chem. 1997;272(32):19731–19737. | ||
van Engleland M, Nieland LJ, Ramaekers FC, Schutte B, Reutelingsperger CP. Annexin V-affinity assay: a review on an apoptosis detection system based on phosphatidylserine exposure. Cytometry. 1998;31(1):1–9. | ||
Macia E, Ehrlich M, Massol R, Boucrot E, Brunner C, Kirchhausen T. Dynasore, a cell-permeable inhibitor of dynamin. Dev Cell. 2006;10(6):839–850. | ||
Hileman EO, Liu J, Albitar M, Keating MJ, Huang P. Intrinsic oxidative stress in cancer cells: a biochemical basis for therapeutic selectivity. Cancer Chemother Pharmacol. 2004;53(3):209–219. | ||
Sundaramoorthi C, Kalaivani M, Mathews DM, Palanisamy S, Kalaiselvan V, Rajasekaran A. Biosynthesis of silver nanoparticles from Aspergillus niger and evaluation of its wound healing activity in experimental rat model. International Journal of PharmTech Research. 2009;1(4):1523–1529. | ||
Vertelov GK, Krutyakov YA, Efremenkova OV, Olenin AY, Lisichkin GV. A versatile synthesis of highly bactericidal Myramistin® stabilized silver nanoparticles. Nanotechnology. 2008;19(35):355707. |
Supplementary materials
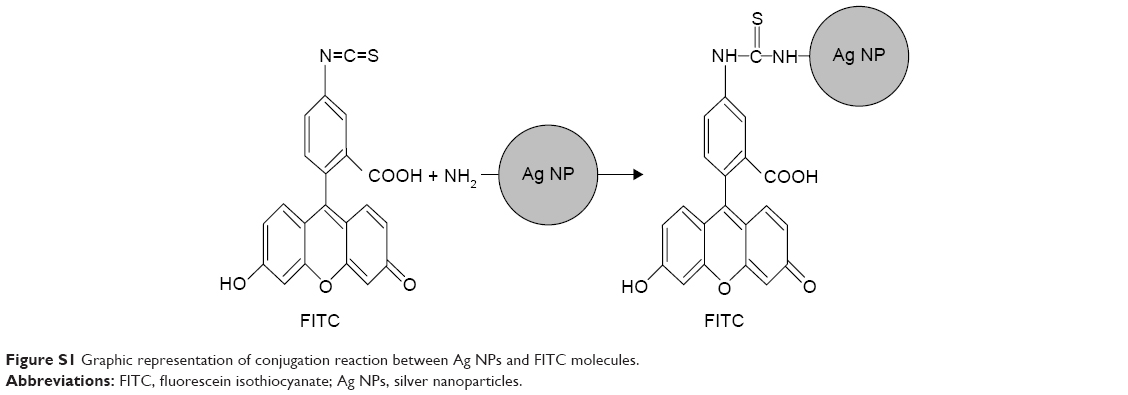 | Figure S1 Graphic representation of conjugation reaction between Ag NPs and FITC molecules. |
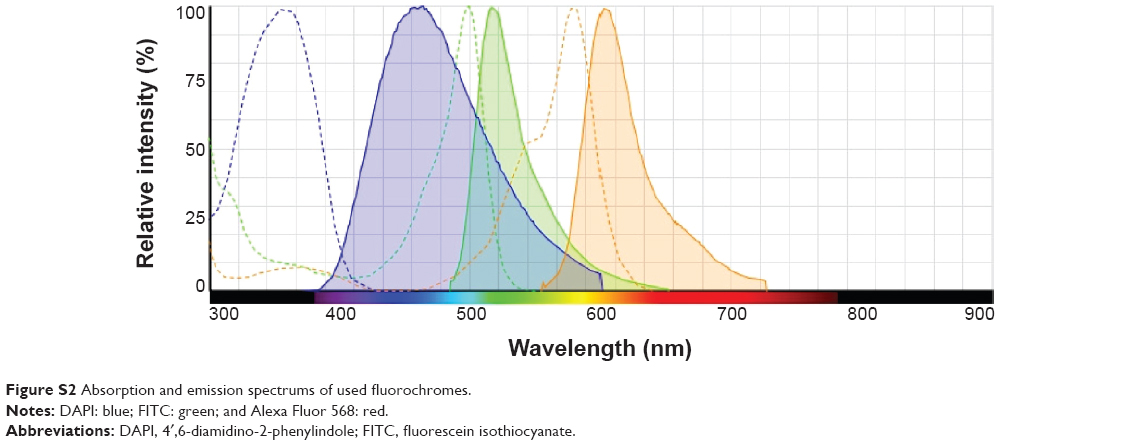 | Figure S2 Absorption and emission spectrums of used fluorochromes. |
 | Figure S3 Antiproliferative efficacy of the Ag NPs produced by synthetic methods at different concentrations. |
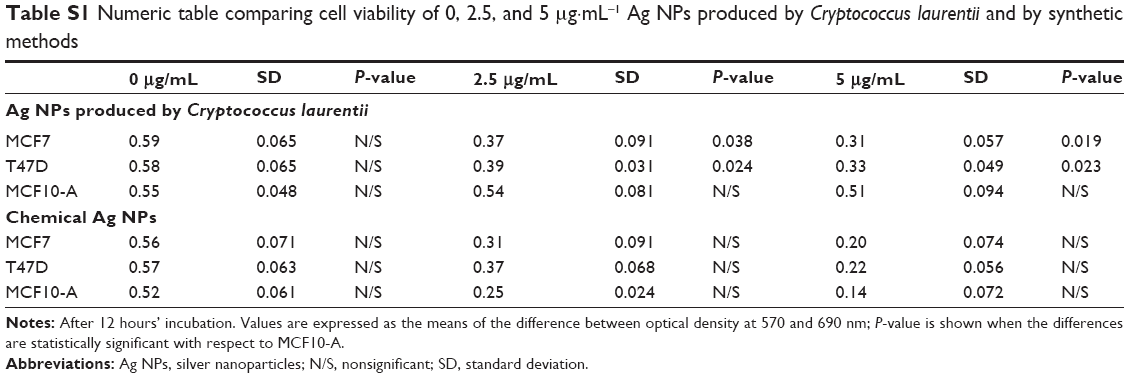 | Table S1 Numeric table comparing cell viability of 0, 2.5, and 5 μg·mL−1 Ag NPs produced by Cryptococcus laurentii and by synthetic methods |
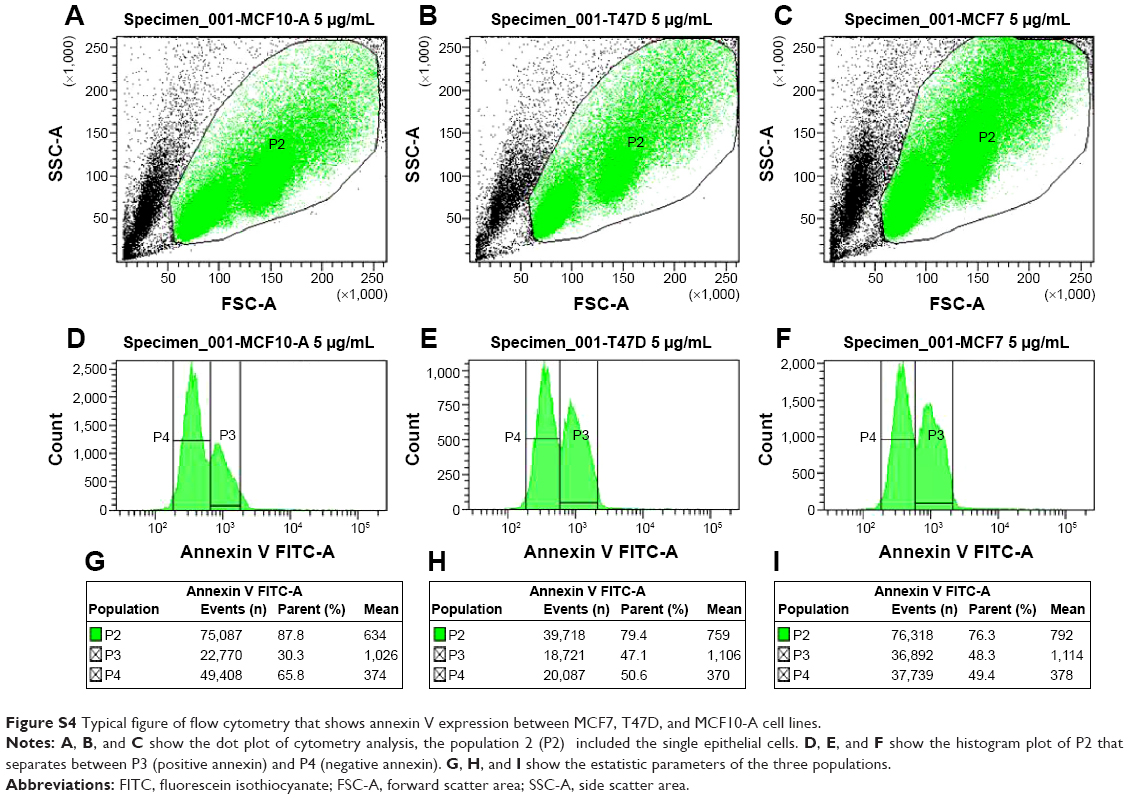 | Figure S4 Typical figure of flow cytometry that shows annexin V expression between MCF7, T47D, and MCF10-A cell lines. |
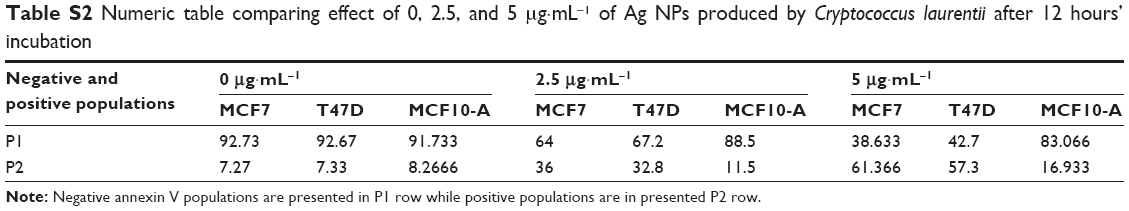 | Table S2 Numeric table comparing effect of 0, 2.5, and 5 μg·mL−1 of Ag NPs produced by Cryptococcus laurentii after 12 hours’ incubation |
 | Figure S5 Endocytosis assay using FITC-dextran. |
 © 2015 The Author(s). This work is published and licensed by Dove Medical Press Limited. The full terms of this license are available at https://www.dovepress.com/terms.php and incorporate the Creative Commons Attribution - Non Commercial (unported, v3.0) License.
By accessing the work you hereby accept the Terms. Non-commercial uses of the work are permitted without any further permission from Dove Medical Press Limited, provided the work is properly attributed. For permission for commercial use of this work, please see paragraphs 4.2 and 5 of our Terms.
© 2015 The Author(s). This work is published and licensed by Dove Medical Press Limited. The full terms of this license are available at https://www.dovepress.com/terms.php and incorporate the Creative Commons Attribution - Non Commercial (unported, v3.0) License.
By accessing the work you hereby accept the Terms. Non-commercial uses of the work are permitted without any further permission from Dove Medical Press Limited, provided the work is properly attributed. For permission for commercial use of this work, please see paragraphs 4.2 and 5 of our Terms.