")
Back to Journals » Advances in Medical Education and Practice » Volume 6
Students’ perceptions of educational climate in a new dental college using the DREEM tool
Authors Chandran C, Ranjan R
Received 15 September 2014
Accepted for publication 12 November 2014
Published 13 February 2015 Volume 2015:6 Pages 83—92
DOI https://doi.org/10.2147/AMEP.S74314
Checked for plagiarism Yes
Review by Single anonymous peer review
Peer reviewer comments 3
Editor who approved publication: Dr Md Anwarul Azim Majumder
Chitraa R Chandran, Rakesh Ranjan
Department of Periodontics, Tagore Dental College and Hospitals, Tamil Nadu, India
Aim: The purpose of the study was to evaluate students’ perceptions of conditions prevailing in Tagore Dental College.
Methods: Data were collected from all students enrolled in 2013, using the Dundee Ready Education Environment Measure (DREEM) forms filled in by them. For this exercise, prior approval from the Tagore Dental College Ethics Committee was obtained.
Results: The global score for EC was 124 (interpretation: predominantly positive). The scores obtained in the different domains were 31.03 in Learning (interpretation: a more positive perception); 26.69 in Teachers (interpretation: moving in the right direction); 21.48 in Academics (interpretation: feeling more in the positive side); 28.23 in Atmosphere (interpretation: a more positive atmosphere); and 16.52 in Social (interpretation: acceptable), all the points indicate that the institution is moving in the right direction. The DREEM score assigned by female students was significantly greater (P=0.048) than that assigned by male students. The second-year students were more positive in their perception of EC than students of the other classes.
Conclusion: Overall, Tagore Dental College students felt the EC to be acceptable. Admittedly, some areas need to be revisited to make improvements.
Keywords: educational climate, DREEM scale, students' perception, learning environment
Background
A realistic assessment of an intangible factor such as the educational climate (EC) of an institution on a measurable scale is difficult. It is a summation of the perceptions of individual students of the different indicators factored in the study. Such perceptions also have a bearing on the background that the students come from. The environment-related features of the institution, such as being competitive or passive, peaceful or stressful, motivating or indifferent, have a major impact. The endeavor to create and maintain a helpful environment for study without compromising on quality of education is continuous. This can be achieved only through students’ feedback and course corrections by the institution.
The World Federation of Medical Education, in 1998, highlighted the learning environment as one of the targets for the evaluation of medical education programs.1 The effects of educational environment, both academic and clinical, are important determinants of medical students’ attitudes, knowledge, skills, progression, and behaviors.2 Evaluation of the educational environment at both academic and clinical sites is important for the delivery of high-quality education and curriculum. It is necessary to identify the gap between student expectations and their actual experience. Furthermore, there are differences between students’ experiences at different stages of their medical education.
In 1997, Roff et al3 published the Dundee Ready Education Environment Measure (DREEM scale), which is a generic, international instrument, and not specific to any culture,4 for the assessment of EC for health science students in universities and health institutions, which helps in planning improvements to the particular course. This allows the medical or dental school to evaluate the education environment of their institution. DREEM has been widely used as a tool to gather information about the educational environment in many institutions.3,5–34 It was originally developed by Dundee and has been validated as a universal diagnostic inventory for assessing the quality of educational environment of different institutions.2,3,35,36 The DREEM has been reported3,4,37–39to have a high level of internal consistency and a reliable index for EC assessment. It was found to be valid, reliable, and sensitive by a study in Pakistan.4 Some studies36,38,40 have reported questionable validity for the five-factor structure.
Tagore Dental College is a newly established dental college, offering Bachelor of Dental Surgery (BDS) program. This college was established as per the norms of the Dental Council of India (DCI) in 2007 in the suburbs of Chennai, in South India. Students are from different financial and religious backgrounds. Moreover, a sizable number of students are from minority communities. The constant effort of the institution is to maintain high standards through good teaching practices. The purpose of this study was to learn how this wide variety of students perceived the EC in the institution.
This objective was further subdivided as follows:
- To understand the students’ perceptions of the teachers and their teaching, the learning atmosphere, and the academic and social environments in the institution;
- To identify whether there were any sex difference in students’ perceptions; and
- To assess the strengths and weaknesses of the college, as perceived by the students.
Materials and methods
This was a cross-sectional questionnaire study that used the data collected in the year 2013. The college offers BDS program under the auspices of The Tamil Nadu Dr MGR Medical University within the guidelines of the Dental Council of India. The BDS comprises 4 years of study and 1 year of internship, with a yearly pattern of exams. Preclinical subjects are taught during the first 2 years and clinical subjects during the next 2 years.
Previous studies5,11,12,26,27 have shown a variable rate of response ranging from 36.0%–82.8%. Therefore, it was planned to recruit all the students, and the study was conducted at the end of the academic year. After obtaining the approval of the Tagore Dental College Ethics Committee, the DREEM forms were distributed to the students to be filled and returned within half an hour in order to avoid discussion among them. Before beginning the survey, the collaborator explained briefly the study’s objectives and its data-processing characteristics, giving special emphasis to the importance of voluntary participation and the anonymity of the process. Information on age, gender, and academic year of study was collected from each participant. Because it was voluntary and anonymous, a separate consent form was not collected. In the event of the return of filled questionnaire, consent was implicit. The data were handled and stored in accordance with the tenets of the Declaration of Helsinki.
DREEM questionnaire
The DREEM questionnaire consists of 50 statements that can be grouped under five domains or five subscales, namely, learning, teachers, academics, atmosphere, and social environment. Each of the statements is given a score based on a Likert scale of five options: 4= strongly agree, 3= agree, 2= uncertain,1= disagree, and 0= strongly disagree. In the case of nine negative statements, the scores are reversed.
- D1: Students’ perception of learning, consisting of 12 items, with a maximum score of 48;
- D2: Students’ perception of teachers, consisting of 11 items, with a maximum score of 44;
- D3: Students’ academic self-perceptions, consisting of 8 items, with a maximum score of 32;
- D4: Students’ perceptions of the atmosphere, consisting of 12 items, with a maximum score of 48; and
- D5: Students’ social self-perception, consisting of 7 items, with a maximum score of 28.
The DREEM scale provides results for each item, for each domain (by adding up the scores of the corresponding items), and the total score for EC (adding up all the scores of all the domains). The maximum score for EC is 200. The interpretation of the overall scores is as follows: 0–50: very poor; 51–100: plenty of problems; 101–150: more positive than negative; and 151–200: excellent.
Taking into account these maximum scores, the data are converted into percentages of their respective subscales.6,41 The mean scores for the different items, domains, and EC are grouped into four ordinal categories (0–50, 51–100, 101–150, and 151–200), associated with a specific interpretation.42 Broadly, a higher score (percentage) signifies a perception that the institution is more positive than negative in relation to the aspect being examined.
Description of the study group
Table 1 summarizes the sample size, dropout rate, sex, and age of the participants. In total, 257 students (83.7%) with an average age of 20.5 years (standard deviation [SD]: 1.77 years) answered the DREEM questionnaire (Table 1). Among them, males were 19.8% and females comprised 80.2%.
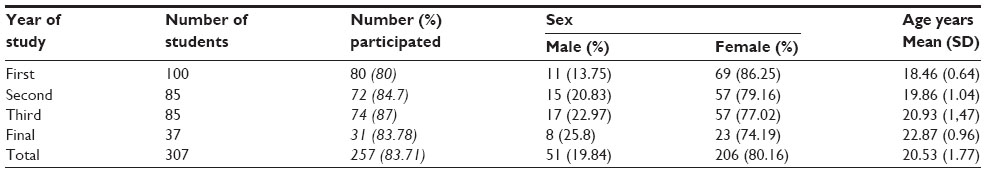 | Table 1 Number and percentage of students who participated in the study (n=257) in different years of study, with their age and sex |
Statistical analysis
The data were entered into a Microsoft Excel spreadsheet, and the mean and SD were calculated for all the items. The data in the overall assessment of the EC, for each domain and each item of the questionnaire, were expressed as averages and comparison was done between the different years of study. The data for the overall assessment of the EC and each domain were also expressed as percentages in relation to the maximum score for comparison.3,35 Because the maximum scores for each domain or subscale were different, they were compared according to their percentages.23 The differences in EC, as perceived by 1) male and female students, and 2) first- and final-year students were evaluated, and the significance was calculated using SPSS version 20 (IBM Corporation). P-values were calculated using Student’s t-test. A score of P<0.05 was considered statistically significant.
Results
The overall mean score was 2.48±1.02, which is interpreted as educational aspects that could be improved; and the score was 124 (62%) out of a total maximum score of 200, which is more positive than negative. Mean values (percentage) of the EC and the domains of the DREEM questionnaire, as well as the number of students (percentage) included in each category along with an interpretation, are presented in Table 2. When the practical guide of McAleer and Roff2,42 was used to interpret the total mean scores (Table 2), all the students taken together viewed positively, in general, learning, teaching, academic self-perception, atmosphere, and social life. The general result was that the institution is moving in the right direction, and that there are many negative aspects that need changing in all the five domains. The comparative percentage scores of the five domains for the various years of study show that the students’ perception of atmosphere (58.81%) was the lowest when compared to social self-perception (59%), students’ perception of teachers (60.66%), perception of learning (64.65%), and their academic self-perception (67.13%) (Table 2).
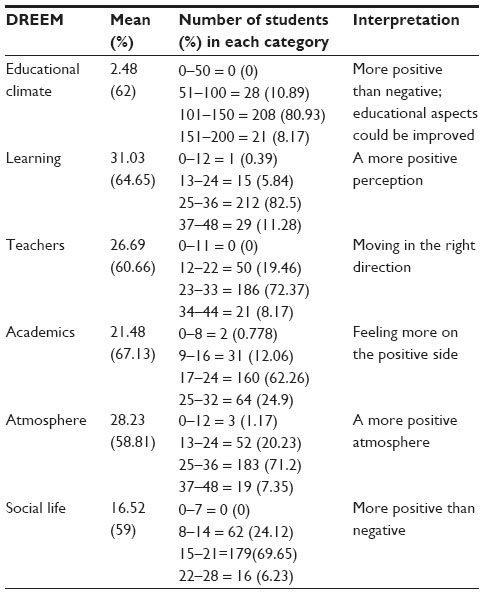 | Table 2 Mean values (percentage) of the educational climate and the domains of the DREEM questionnaire, as well as the number of students (percentage) included in each category, associated with the interpretation (n=257) |
The mean score for each year of students, along with SD, was calculated for all the five domains, as shown in Table 3. The total score was lowest for the final-year students, with114.48±0.44, when compared to the score assigned by the third-year (122.18±0.44), first-year (123.13±0.45), and second-year students (136.04±0.58) (Table 3).
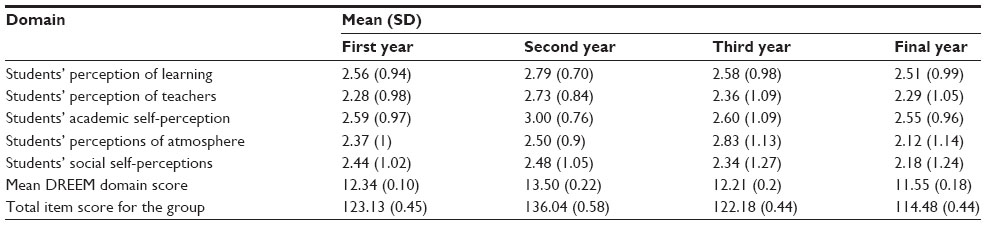 | Table 3 Mean (SD) domain scores for the respective years of dental study |
The difference in perception among the two sexes is summarized in Table 4. Girls seem to have a better perception of EC in the overall assessment, as well as in all the five domains. On comparing the responses between male (118/200) and female students (127/200), the girls were more positive than boys in all domains, but there was a significant difference in EC (P=0.048) and all other domains. The boys felt that the atmosphere did not motivate them as a learner and that the stress outweighed the enjoyment. They found it difficult to concentrate, and the lectures and clinical teaching were not taking place in a relaxed environment. They also found the course not well scheduled and cheating to be rampant. They felt bored and lonely and felt the need for and expected a better support system.
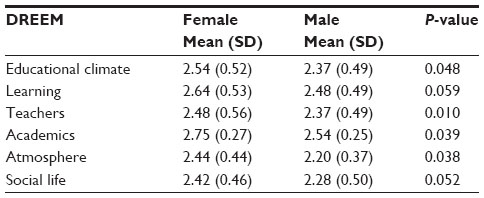 | Table 4 Mean values of the educational climate and the domains of the DREEM questionnaire with regard to sex (n=257) |
Table 5 shows individual items in the different domains with the mean scores and SDs. Comparing the individual scores of each of the questions, most of the questions (33) scored between 2 and 3, and only nine questions scored <2 and none >3.5. There were eight items with scores >3. The most highly rated items were that the staff are knowledgeable (Q2), teaching time was put to good use (Q24), students were encouraged to participate in class (Q1), and they have good friends in their course (Q15). The items in which the students had the greatest problems and stressed the need to improve were that the lecturers were authoritarian (Q9), teaching was too teacher oriented (Q48), more emphasis on factual learning (Q25), cheating was rampant in this course (Q17), and students irritate their teachers (Q49). Scores of ≥3.5 are considered to represent a positive aspect of the curriculum. Six of the questions had scores ≥3, showing a positive trend, and very few (only four) scored <2, which was very heartening. The highest scores were reported from the learning domain, and items with scores <2 points pertained to factual and teacher-centered learning.
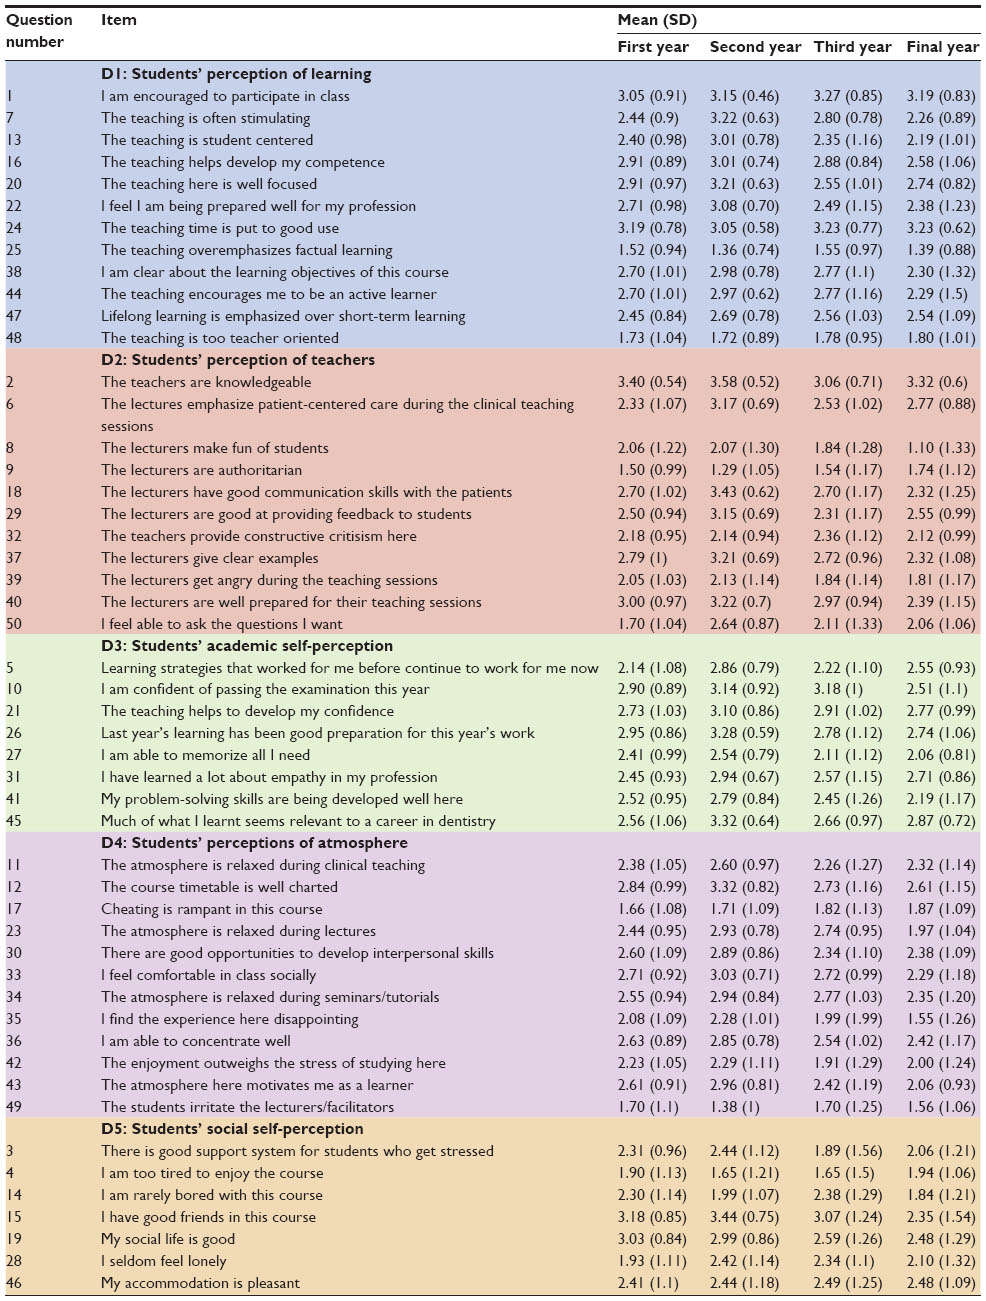 | Table 5 Average score (SD) of 50 items and eight domains of DREEM from 257 students of Tagore Dental College and Hospitals (2013) |
When comparing the scores of individual questions, there were no significant differences between the first- and final-year students except in terms of the questions mentioned in Table 6.
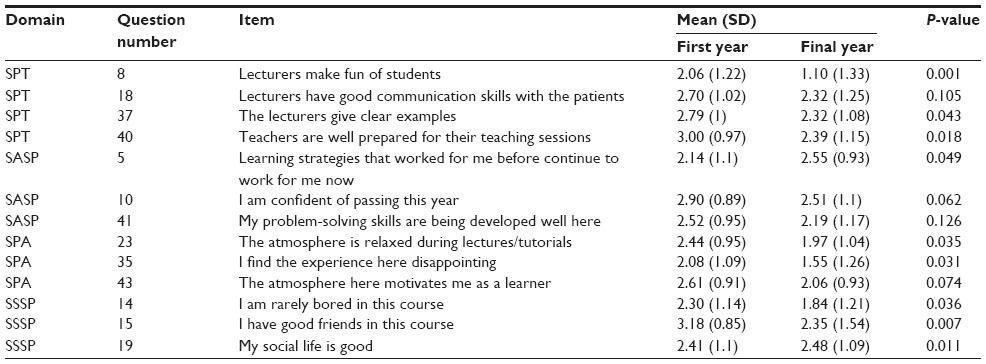 | Table 6 Mean DREEM scores in which significant differences were observed between the first-year and final-year students |
Discussion
Recently, Soemantri et al29 stated that analysis of EC should form part of the appropriate educational practices developed by an institution. Being a new institution, it was essential to know about the EC of the college to bring in changes at the early stages of college development to set the principles of teaching and learning. The DREEM questionnaire3 was used because it has been the most used tool globally, in health sciences, for EC analysis. The review of literature shows its wide usage among medical students5–10,29,30 and also in some dental schools.11–17 Moreover, the questionnaire is culturally nonspecific and reliable for all health profession courses. According to the considerations pointed out by Miles and Leinster,18 our results were expressed in terms of mean values of the global scale, subscale, or items and also as percentage of students in each category associated with a specific interpretation.
Although the data were collected anonymously, only 83.7% of the students returned the questionnaire. The students who did not submit their responses before the deadline were not included. Previous studies5,11,12,26,27 have shown a variable rate of response ranging from 36% to 82.8%.
Students’ perception of learning
The highest scores were reported from this domain, and items with scores <2 points pertained to factual and teacher-centered learning. The problem of factual learning may be due to the pattern of formative and summative assessments encountered by the students. A problem-based evaluation may be the key to do away with the teacher-centered and factual learning. Reorientation and retraining of the staff members on appropriate teaching and assessment methods might stimulate active learning, thereby building confidence. The learning experience in the clinics could be improved by structured and systematic clinical teaching, based on a specific set of curriculum objectives. Students were encouraged to participate in class and the teaching time was used wisely, which are welcome positive points.
Students’ perception of teachers
Items in the teachers’ domain that scored <2 points pertain to authoritarian teachers, factual learning, and ridicule of students. Of the students, the final-year students reported the greatest difficulty because they spend more time with teachers in close contact during the clinical hours; it also suggests that teachers in this institution are inclined toward the traditional style of teaching and factual learning. It is important that the teachers realize that respect to students is critical to the learning process. The first-year students felt that they were unable to ask questions. This may be because they are new to the system and have their own inhibitions. On the more positive side, the students felt that the teachers are knowledgeable, they come well prepared for class, and are able to communicate well with patients and students.
Students’ academic self-perception
The academic self-perception is related to the ability to cope with the academic overload, and low scores in this domain indicate clearly the need for curriculum revision in terms of methodology and course content. The students felt burdened by the academic workload and their main problem was that they were not able to memorize everything as they would have liked to do.
Students’ perception of atmosphere
In the domain of atmosphere, which is of a low score, the areas of concern were that students irritate the teachers and cheat them and their fellow students. This could be attributed again to the work overload and stress of performance. The atmosphere is not perceived to be relaxed during lectures and clinical teaching, and a critical review of the current practice of teaching in the institution is necessary to implement contemporary learning techniques in the clinic and during lectures.
Students’ social self-perception
The social section is the domain with a comparatively lower score, and the problems were that there is poor support system for the students who get bored, tired, or stressed during their academic life. There is a serious concern that they are too tired to enjoy their course. The students reported to have good friends and do not feel lonely but do not have a good social life. Again, the schedule leaves them no time to socialize. Curriculum planners could consider ways to reduce the bulky curriculum and make it more innovative, engaging, and meaningful so as to reduce student boredom and tiredness.
Comparison of EC in the different schools of dentistry
The majority of the studies on EC carried out in medical schools have reported a DREEM score between 101 and 140,2,4,5,19–21,37,43 and only a few studies in British and Swedish medical schools have obtained scores between 141 and 150.8,22 In the field of dentistry, studies conducted by Thomas et al in Indian students (score: 116),17 Ali et al in Pakistani students12 (score: 115; 57%) and by Kissioni et al15 among Greek students (score: 112; 56%) reported EC to be more positive than negative. A positive EC with a higher score has been reported from studies conducted in New Zealand, Germany, UK, and Spain,14,16,20,26 with scores ranging from 123 to 144 (61%–72%). In accordance with the majority of these studies, the present study revealed a positive climate with a score of 124 (62%), with 92.6% of the students assigning a score of ≥101. Many other institutions that follow the traditional teacher-centered, discipline-based curriculum have reported similar global scores.2,5,13,15,17,19,21 However, scores obtained from students from student-centered, integrated, problem-based curricula10,13,14,16,22,26,39 are rated higher by the students.
On comparing the responses between male (118/200) and female students (127/200), female students scored better than male students in all domains; there was a significant difference in all the domains and in EC (P=0.048). These results were similar to the findings in many other studies.11,15,20,37,43 A few studies5,11,13,18,26,27,32,33 have shown no difference in perception between males and females. Only in a few studies5,28 have females reported poor EC.
The present study showed significant differences in some questions between first- and final-year students, and similar results have been reported in other studies.11,12,15,27,32,34 This could be attributed again to the work overload and stress of performance.
In the individual domains, more than half of the studies on EC in medical schools6,9,10,18,19,22–24,26,35,41 yielded results of >52% in all domains, which is interpreted as positive and acceptable. In a few studies,8,10 some domains (Learning, Teachers, and Atmosphere) achieved scores of 77%–78%, indicating educational excellence. Thomas et al,11 in their study on Indian dental students, reported a percentage of ≥52% in all domains, except in the social domain.11 In other studies among Greek, German, and Spanish dental students,15,16,26 a percentage of ≥52% was detected in all domains. In agreement with these studies, the present study also reached a score of ≥52% in all domains, with a positive interpretation, given by 81.7% of the respondents.
Among the various domains in medical schools,6,9,10,18,22–24,35,41 the teachers domain is generally the highest rated, while the academic domain is generally the lowest. A similar pattern is noticed in dental schools in New Zealand,14 with teachers and academic domains showing scores of 73% and 66%, respectively. In the study by Ostapczuk,16 the best and the worst domains cataloged were social life and learning (64% and 58%, respectively). In contrast, in the study by Foster Page et al,14 the best domains cataloged were teachers (73%) and atmosphere (73%), whereas academics was the worst (66%). As reported by Kossioni et al and Tomas et al,15,26 in this study also, the domain that showed the highest percentage value was academics (67%); however, Tomas et al reported the lowest percentage in the learning domain, with a score of 58.3%. But in our study, our lowest scoring domains were atmosphere and social life, with 58.8% and 59%, respectively. An Indian study34 that reports a high score in academics, relative to learning and teaching, is similar to the present study. In a study in Pakistan,37 the highest-scoring domain was academic self-perception, similar to this study, but the former reported the lowest score in learning; an Indian study34 too reported the lowest score in learning, next only to the social life domain. Montazeri et al33 reported highest scores in atmosphere, while our study has revealed the atmosphere to possess the lowest score next only to social life, which is a worrying factor. Some studies11,34,37,39 also have reported social life as a problematic area.
In several studies5,9,14,16,17,23,25,26,35on EC using the DREEM scale, the items most often considered problematic are Q3 (There is good support system for the students who get stressed), followed by Q27 (I am able to memorize all I need), Q4 (I am too tired to enjoy the course), Q9 (Teachers are authoritarian), Q25 (The teaching overemphasizes factual learning), Q42 (The enjoyment outweighs the stress of the course), and Q48 (The teaching is too teacher oriented). As in previous studies,13 in our study also, the areas of concern are items 3, 4, 9, 25, 42, and 48. Question 17 (Cheating is a problem in the school) and Q39 (The teachers get angry in the class) are serious concerns that need to be dealt with immediately.
In most studies8,18,23,25 on EC, using the DREEM scale, the most positive points were Q2 (The teachers are knowledgeable), Q15 (I have good friends in this school), and Q46 (My accommodation is pleasant). In other studies,15,16,26 Q19 (My social life is good) and Q33 (I feel comfortable in class socially) also have reported good scores. In this study, Q1 (I am encouraged to participate in class), Q2 (Teachers are knowledgeable), Q15 (I have good friends in the school), Q19 (My social life is good), and Q24 (The teaching time is put to good use) scored >3 and were hence very positive. Many studies13,15,34,37,39 have reported stress, boredom, too tired to enjoy course, and dissatisfaction in social life among students. This study also reveals a similar feature. Good scores in Q2 and Q24 indicate the quality of teaching in the institution, and this institution has good dedicated teachers. Positive scores in Q15 and Q19 indicate a healthy social life, which is very important to counteract stress associated with training in health sciences. The teachers in our institution, as elsewhere, are authoritarian11,26,34,37,39 and are inclined toward a traditional style of teaching and factual learning.5,9,15,23,25,28,34,35 Low scores in the academic domain, which is found to be the case in most studies,6,8,10,15,26,28 suggest that this is a universal problem, regardless of whether the curriculum is traditional or innovative.
Regarding the question of good support system and the measures to counteract learning, academics, and stress, some authors24,30 have suggested improving the educational aspect by including structured and available personal tutoring system, peer tutoring, an approachable chaplaincy service, better accessibility to school office staff, and senior-to-junior student mentoring. Regarding Q4 and Q42, Till28,31 stated that the frequent complaints of students regarding curriculum is due principally to overload. Tomas et al26 have suggested outcome-based curricula that lay emphasis on outcome and application of knowledge and that are student centered.
Overall, the students are stressed and do not enjoy the course, and the teachers’ following of the traditional pattern of teaching and behavior is disturbing; measures have to be taken to target these specific issues in an attempt to improve the education environment of this institution. Factual learning may be due to the pattern of formative and summative assessments encountered by the students. A problem-based learning and evaluation may be the key to do away with this difficulty. Reorientation and retraining of the staff members on appropriate teaching and assessment methods might stimulate active learning and may thereby build confidence. Introduction of inquiry-based pedagogy, special study units, small-group teaching, improved formative feedback, structured and available personal tutoring system, accessibility to school office staff, and peer mentoring have been suggested by previous studies13,24,30,43 for the improvement in EC.
A limitation of the study is that a standard questionnaire with predetermined choices was used, and some of the factors affecting this institution may have been left out. Informal feedback from the students indicates that the questionnaire was lengthy and that some of the questions could not be understood properly and some were overlapping. The EC is complex, a mix of various factors specific to every institution, and the results of the study in this institution may not be applicable to other institutions in India or worldwide. This is the first assessment of this institution, and this may serve as a baseline to monitor changes in the pattern of teaching and attitude of teachers, in addition to the atmospheric changes over a period of time.
Conclusion
In conclusion, all the students perceived the EC to be positive. There are negative aspects revealed, such as the fact of students being stressed and being too tired to enjoy the course, teachers being authoritarian, and emphasis on factual and teacher-centered learning. These need looking into. A curriculum that includes elements of problem-based learning and assessment might provide students with stimulating opportunities for learning. Furthermore, systematic clinical teaching might improve the learning environment for the students. A better support system from the staff and senior students would help to mitigate most of the deficiencies in the institution. A change in the attitudes and approach is understood to be necessary for making the learning atmosphere congenial for the students and for molding them into competent professionals.
Acknowledgments
Sincere thanks to Dr Valarmathi Srinivasan, Professor of Statistics in the Department of Epidemiology at The Tamil Nadu Dr MGR Medical University, for her kind contribution.
Disclosure
The authors report no conflicts of interest in this work.
References
The Executive Council of WFME. International standards in medical education, assessment and accreditation of medical schools’-educational programmes. A WFME position paper. Med Educ. 1998;32(5):549–558. | |
Roff S, McAleer S. What is educational climate? Med Teach. 2001;23(3):333–334. | |
Roff S, McAleer S, Harden R, Al-Qahtani M. Development and validation of dundee ready education environment measure (DREEM). Med Teach. 1997;19:295–299. | |
Khan JS, Tabasum S, Yousafzai UK, Fatima M. DREEM ON: validation of the Dundee ready education environment measure in Pakistan. J Pak Med Assoc. 2011;61(9):885–888. | |
Mayya S, Roff S. Students’ perceptions of educational environment: a comparison of academic achievers and under-achievers at Kasturba Medical College, India. Educ Health (Abingdon). 2004;17:280–291. | |
Whittle SR, Whelan B, Murdoch-Eaton DG. DREEM and beyond; studies of the educational environment as a means for its enhancement. Educ Health (Abingdon). 2007;20:7. | |
Al-Ayed IH, Sheik SA. Assessment of the educational environment at the college of medicine of King Saud University, Riyadh. East Mediterr Health J. 2008;14:953–959. | |
Edgren G, Haffling AC, Jakobsson U, McAleer S, Danielsoen N. Comparing the educational environment (as measured by DREEM) at two different stages of curriculum reform. Med Teach. 2010;32: e233–e238. | |
Herrera C, Pacheco J, Rosso F, et al. Evaluation of the undergraduate educational environment in six medical schools in Chile. Rev Med Chil. 2010;138:677–684. | |
Bennett D, Kelly M, O’Flynn S. Are the bigger hospitals better: DREEM on? Ir J Med Sci. 2010;179:515–519. | |
Thomas BS, Abraham RR, Alexander M, Ramnarayan K. Students’ perceptions regarding educational environment in an Indian dental school. Med Teach. 2009;31:e185–e186. | |
Ali K, McHarg J, Kay E, et al. Academic environment in a newly established dental school with an enquiry-based curriculum: perceptions of students from the inaugural cohorts. Eur J Dent Educ. 2012;16: 102–109. | |
Ali K, Raja M, Watson G, Coombes L, Heffernan E. The dental school learning milieu: students’ perceptions at five academic dental institutions in Pakistan. J Dent Educ. 2012;76:487–494. | |
Foster Page LA, Kang M, Anderson V, Thomson WM. Appraisal of the Dundee ready educational environment measure in the New Zealand dental educational environment. Eur J Dent Educ. 2012;16:78–85. | |
Kossioni AE, Varela R, Ekonomu I, Lyrakos G, Dimoliatis IDK. Students’ perceptions of the educational environment in a Greek dental school, as a measured by DREEM. Eur J Dent Educ. 2012;16:e73–e78. | |
Ostapczuk MS, Hugger A, de Bruin J, Ritz-Timme S, Rotthoff T. DREEM on, tentists! Students perceptions of the educational environment in German dental school as measured by the Dundee ready education environment measure. Eur J Dent Educ. 2012;16:67–77. | |
Zamzuri AT, Ali AN, Roff S, McAleer S. Students’ perceptions of the educational environment at dental training college, Malaysia. Malays Dent J. 2004;25:15–26. | |
Miles S, Leinster SJ. Comparing staff and student perceptions of the student experience at a new medical school. Med Teach. 2009;31: 539–546. | |
Shehnaz SI, Sreedharan J. Students’ perceptions of educational environment in a medical school experiencing curricular transition in United Arab Emirates. Med Teach. 2011;33:e37–e42. | |
Brown T, Williams B, Lynch M. The Australian DREEM: evaluating student perceptions of academic learning environments within eight health science courses. Int J Med Educ. 2011;2:94–101. | |
Vieira JE, do Patrocínio Tenório Nunes M, de Arruda Martins M. Directing student response to early patient contact by questionnaire. Med Educ. 2003;37:119–125. | |
McKendree J. Can we create an equivalent educational experience on a two campus medical school? Med Teach. 2009;31:e202–e205. | |
Demiroren M, Palaoglu O, Kemahli S, Ozyurda F, Ayhan IH. Perceptions of students in different phases of medical education of educational environment: Ankara University, faculty of medicine. Med Educ Online. 2008;13:8. | |
Avalos G, Freeman C, Dunne F. Determining the quality of the medical educational environment at an Irish medical school using the DREEM inventory. Ir Med J. 2007;100:522–525. | |
Al-Hazimi A, Al-Hyiani A, Roff S. Perceptions of the educational environment of the medical school in King Abdul Aziz University, Saudi Arabia. Med Teach. 2004;26:570–573. | |
Tomas I, Millan U, Casares MA, et al. Analysis of the ‘educational climate’ in Spanish public schools of dentistry using the Dundee ready education environment; measure: a multicenter study. Eur J Dent Educ. 2013;17(3):159–168. | |
Abraham R, Ramnarayan K, Vinod P, Torke S. Students’ perceptions of learning environment in an Indian medical school. BMC Med Educ. 2008;8:20. | |
Till H. Identifying the perceived weakness of a new curriculum by means of Dundee ready education enviornment measure (DREEM) inventory. Med Teach. 2004;26:39–45. | |
Soemantri D, Herrera C, Riqueline SJ. Measuring the educational environment in health professional studies, a systematic review. Med Teach. 2010;12:947–952. | |
Dunne F, Mc Aleer S, Roff S. Assessment of the undergraduate medical education environment in a large UK medical school. Health Edu J. 2006;65:149–158. | |
Till H. Climate studies: can students perceptions of the ideal educational environment be of use for institutional planning and resource utilization? Mead Teach. 2005;27:332–337. | |
Aghamolaei T, Fazel I. Medical students perceptions of the educational environment at an Iranian medical sciences university. BMC Med Educ. 2010;10:87. | |
Montazeri H, Beigzadeh A, Shokoohi M, Bazrafshan A, Esmaili A. Perceptions of students and clinical instructors of academic learning enviornment at Yazd University of medical sciences. Res Dev Med Educ. 2012;1(2):65–70. | |
Kohli V, Dhaliwal U. Medical students’ perception of the educational environment in a medical college in India: a cross-sectional study using the Dundee ready education environment questionnaire. J Educ Health Prof. 2013;10:5. | |
Roff S, Mc Aleer S, Ifere OS, Bhattacharya S. A global diagnostic tool for measuring educational environment: comparing Nigeria and Nepal. Med Teach. 2001;23:378–382. | |
Dimoliatis ID, Vasilaki E, Anastassopoulos P, Ioannidis JP, Roff S. Validation of the Greek translation of the Dundee ready education environment measure. Edu Health. 2010;23(1):1–16. | |
Jawaid M, Raheel S, Ahmed F, Aijaz H. Students perception of educational environment at public sector medical university of Pakistan. J Res Med Sci. 2013;18:417–421. | |
Hammond SM, O’Rourke M, Kelly M, Bennett D, O’Flynn S. A psychometric appraisal of the DREEM. BMC Med Educ. 2012;12:2. | |
Zawawi AH, Elzubbeir M. Using DREEM to compare graduating students perceptions of learning environments at medical schools adopting contrasting educational strategies. Med Teach. 2012;34:S25–S31. | |
Yusoff MSB. The Dundee ready educational environment measure: a confirmatory factor analysis in a sample of Malaysian medical students. Int J Humanit Soc Sci. 2012;2(16):313–321. | |
Denz-Pehey H, Murdoch C. A comparison between findings from the DREEM questionnaire and that from qualitative reviews. Med Teach. 2009;31:e449–e453. | |
McAleer S, Roff S. A practical guide to using the dundee ready education environment measure (DREEM). AMEE medical education guide No 23. Med Teach. 2001;23:29–33. | |
Makhdoom NM. Assessment of the quality of Educational Climate during undergraduate clinical teaching years in the college of medicine, Taibah University. J T U Med Sci. 2009;4(1):42–52. |
 © 2015 The Author(s). This work is published and licensed by Dove Medical Press Limited. The full terms of this license are available at https://www.dovepress.com/terms.php and incorporate the Creative Commons Attribution - Non Commercial (unported, v3.0) License.
By accessing the work you hereby accept the Terms. Non-commercial uses of the work are permitted without any further permission from Dove Medical Press Limited, provided the work is properly attributed. For permission for commercial use of this work, please see paragraphs 4.2 and 5 of our Terms.
© 2015 The Author(s). This work is published and licensed by Dove Medical Press Limited. The full terms of this license are available at https://www.dovepress.com/terms.php and incorporate the Creative Commons Attribution - Non Commercial (unported, v3.0) License.
By accessing the work you hereby accept the Terms. Non-commercial uses of the work are permitted without any further permission from Dove Medical Press Limited, provided the work is properly attributed. For permission for commercial use of this work, please see paragraphs 4.2 and 5 of our Terms.