")
Back to Journals » Research and Reports in Urology » Volume 11
Structural, biomechanical and hemodynamic assessment of the bladder wall in healthy subjects
Authors Volikova AI, Marshall BJ, Yin JMA, Goodwin R , Chow PEP, Wise MJ
Received 14 February 2019
Accepted for publication 5 August 2019
Published 3 September 2019 Volume 2019:11 Pages 233—245
DOI https://doi.org/10.2147/RRU.S205383
Checked for plagiarism Yes
Review by Single anonymous peer review
Peer reviewer comments 2
Editor who approved publication: Dr Jan Colli
Antonina I Volikova1, Barry J Marshall1, J M A Yin2, Robert Goodwin2, Peter Ee-Pan Chow1, Michael J Wise1,3
1Marshall Centre for Infectious Disease Research and Training, School of Biological Sciences, University of Western Australia, Perth, Australia; 2Urology Department, Sir Charles Gairdner Hospital, Perth, Australia; 3Department of Computer Science and Software Engineering, School of Physics, Mathematics and Computing, University of Western Australia, Perth, Australia
Correspondence: Antonina I Volikova
University of Western Australia, 35, Stirling Highway, Crawley WA 6009, Australia
Tel +61 845 015 4041
Email [email protected]
Aim: The aim of this study was to apply and evaluate three ultrasound methods to measure the bladder wall in a healthy population using high-resolution applications and to establish reference points and baselines for future research into lower urinary tract diseases, specifically to understand how lower urinary tract disorders affect the bladder wall and to find objective, non-invasive diagnostic tests.
Methods: The study was conducted on 116 healthy volunteers aged 19–79 years old with approximately 10 participants in each decade group.
Results: The following bladder parameters were recorded and measured using a GE LOGIQ E9 XDclear 2.0 ultrasound machine (GE Healthcare, Wauwatosa, WI, USA):
- Full bladder wall thickness (BWT) and each of three bladder wall layers thickness (BWLT) – serosa, detrusor and mucosa;
- Shear Wave Velocity (SWV) in m/s, using 2D Shear Wave Elastography (2D-SWE); and
- Bladder wall blood circulation (Resistive Index, RI), using Duplex Doppler ultrasound.
All of the above measurements were recorded at three different urine filling volumes: V0 (20–50 mL), V2 (180–200 mL) and V4 (380–400 mL) with ten repeats for each measured parameter. As expected, BWT and BWLT correlated inversely with increasing bladder volume.While there are no large differences in the healthy bladders of men compared with women, or with age, some small, but statistically significant, differences revealed. BWT at V0 is greater in men, as is the detrusor thickness at VO, but there are no differences at other volumes or for other layers. There is a small, but statistically significant thickening ofBWTand detrusor layer and increase in SWVwith age in men at V0. SWE showed increase in SWVmeasured at 400 mL bladder volume across all gender and age groups. There was no change in bladder wall vessels RI with age, between gender groups or increasing bladder volume.
Conclusion: We used three ultrasound applications to obtain bladder wall reference data in healthy individuals and investigated the relationships between BWT, BWLT, SWV, RI and gender, age at three bladder volumes, for further studies into identifying and diagnosing different urinary bladder disorders. With further research, ultrasound could be used as a diagnostic test to differentiate bladder pathology in clinical practice.
Keywords: urinary bladder, healthy subjects, reference data, high-frequency ultrasound, duplex doppler, shear wave elastography
Introduction – reasons for the study
Bladder disorders due to inflammation, infection, obstruction or neurogenic etiology are characterized by lower urinary tract symptoms (LUTS).1 LUTS can develop at any age and occurs in both females and males.2 LUTS have a significant impact on the quality of life.3
Diagnosing the bladder disease and assessing its severity as well as monitoring its progress are all difficult and are typically based on the lower urinary tract symptoms. The data show that LUTS are nonspecific for age, gender or underlying pathology.4,5 A cystoscopy with biopsy is often performed. The method is invasive, with a potential for complications and does not always reflect the severity of the diseases.6 A more objective and noninvasive method is needed to diagnose these conditions.
We know that, when bladder disorders develop, the following patho-morphologic characteristics of bladder wall changes include: chronic inflammation, loss of urothelium, mucosal granulation tissue and development of mucosal ulcerations, detrusor hypertrophy, bladder wall thickening, formation of perivesical infiltrates, intrafascicular fibrosis, scarring and stiffening of the bladder, with progressive reduction in bladder capacity.7–10 There have also been reports of decreased microcirculation with development of ischemia due to continuous changes in venules and capillaries.11 However, in these patients, patho-morphologic findings are variably present, non-specific and overlap with other etiologies.12
We hypothesized that these changes, and perhaps others, could be identified and quantified using the high-resolution ultrasound methods. We applied a new approach to investigate structural, biomechanical and hemodynamic characteristics of the bladder wall and evaluated the following three applications:
- High-frequency Ultrasound
- Shear Wave Elastography and
- Duplex Doppler
We used a combination of quantifiable noninvasive methods that allow us to detect bladder wall changes and decreased wall function before obvious fibrotic changes develop. Ultrasound techniques may also enable us to monitor the effect of conservative therapy and can be used as a predictive tool for determining which patients will respond to conservative treatment or provide early indications for surgical intervention. The data collected in this study can be used as reference points and baseline for future bladder studies.
Methods
The Human Research Ethics Committee at Sir Charles Gairdner Hospital (HREC SCGH, 2015–2016) in Perth, Australia, approved this research protocol. The study was performed in accordance with the last revised version of the Helsinki Declaration. All participants provided written informed consent.
Our study involved conducting bladder ultrasound scans on 218 participants. Only 116 healthy control adult volunteer participants were included: 58 males and 58 females, age ranging between 19 and 79 years old, with ~10 participants in each decade age group.
Patient assessment
On entry into the study, a thorough review of the questionnaire responses was performed and the subjects’ weight, height and BMI were recorded.
Prior to ultrasound scanning, samples of morning mid-stream urine were collected for routine urine analysis, urine culture and sensitivity to exclude participants with asymptomatic hematuria or pyuria.
One hundred and two participants were excluded from the study:
- Fourteen participants were excluded due to abnormal urine analysis;
- Fifty-six participants – due to previous history of urinary tract infection, lower urinary tract and pelvic pain, injury or surgery, bladder outlet obstruction, stone disease, genitourinary malignancies and prolapse, chronic conditions including irritable bowel syndrome, endometriosis, hypertension, arrhythmias and diabetes;
- Seven participants – due to abnormal findings during explorative pelvic ultrasound examination (focal bladder wall thickening, cysts and diverticula);
- Thirteen participants – due to suprapubic abdominal wall thickness >4.0 cm;
- Twelve participants with post-void residual (PVR) >50 mL.
Patient preparation
Participants were asked to hydrate before and during the assessment as a way of controlling the bladder volumes. It was recommended to drink approximately two liters of water in two hours before the appointment.
Transducer and applications selection
Participants were examined using a high-frequency B mode ultrasound scanner with a 1–6 MHz convex abdominal probe and a high-resolution 9 MHz linear probe. High-frequency ultrasound, real-time tissue Elastography using 2D Shear Wave (2D-SWE) application and Duplex Doppler was performed using an ultrasound system – LOGIQ E9 XDclear 2.0 (GE Healthcare, Wauwatosa, WI, USA).
Scanning technique
The examination was performed in supine position, using a transabdominal, suprapubic approach. Measurements of each parameter were obtained within the anterior bladder wall. We selected anterior bladder wall for this study as a representative location for bladder wall measurement. The thicknesses of the anterior bladder wall are comparable and identical to the thickness of all other parts of the bladder at the same bladder volume in adults13,14,15 and in children.57
We started the scanning with a 1–6 MHz convex probe. A pre- and post-micturition bladder volume was measured in three dimensions and estimated automatically by GE LOGIQ E9’s system.
Scanning was then performed on the bladder at three volume levels:
- V0 – post void residual (PVR) ~20–50 mL;
- V2 ~180–200 mL and
- V4 ~380–400 mL
Procedure for bladder wall measurement was as follows:
- If PVR V0 >20 mL and <50 mL, V2 >180 mL and <200 mL; V4 >380 mL and <400 mL – proceed with BWT measurement.
- If PVR V0 >50 mL, V2 >200 mL, V4 >400 mL – ask patient to revoid (to reach 20 mL, 180 mL, 380 mL volume).
- If PVR V0 <20 mL, V2 <180 mL, V4 <380 mL – keep taking measurements of the bladder volume until it reached V0=20 mL, V2=180 mL, V4=380 mL.
- If PVR was >50 mL – exclude the participant from the study.
- If the bladder capacity were below the targeted volumes (200 mL or 400 mL) – the participants were excluded from the study.
At each bladder volume, 10 ultrasound images with 10 consecutive measurements were recorded for each of the parameters listed below:
- Full bladder wall thickness (BWT in mm),
- Shear Wave Velocity (SWV) measurements (m/s) of the full bladder wall thickness and
- Resistive index (RI) of the bladder wall vessels.
To minimize examination time, the layers of bladder wall (BWLT) – serosal thickness (SWT, mm), detrusor thickness (DWT, mm) and mucosal thickness (MWT, mm) were measured offline after completing the participant ultrasound examination, using DICOM software and digital image enlargement.
Measuring the bladder wall and bladder wall layers (mucosa, detrusor and serosa) thickness
BWT was measured from the interior mucosal layer and outer part of serosal layer of the bladder with exclusion of posterior rectus muscle fascia (Figure 1). Ten measurements of BWT and BWLT (five on each side of the midline) measured along the anterior bladder wall at each studied bladder volume – V0, V2 and V4.
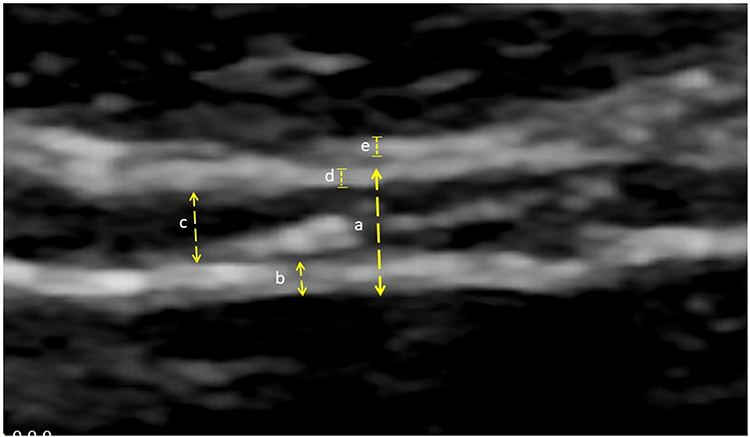 |
Figure 1 Bladder wall and layers thickness measurements image. The main structures identified and measured on the image: (a) bladder wall thickness, (b) mucosal layer thickness, (c) detrusor thickness, (d) serosal thickness, (e) posterior rectus muscle fascia. |
Since these variables may be affected by the degree of bladder volume changes, that may vary from one patient to another, the detrusor-to-bladder wall thickness, mucosa- and serosa-to-bladder wall thickness ratios were also calculated.
To evaluate the relationship between BWT and different bladder volumes, three newly derived urinary indexes (UI) were also proposed, using the full BWT measurements at V0, V2 and V4.
Real-time bladder wall elastography using two-dimensional (2D) shear wave application
Ultrasound Shear Wave Elastography is an imaging technique that assesses the mechanical properties of soft tissue.16 Shear Wave Elastography is an application for noninvasive quantification of tissue stiffness and useful in the diagnosis, staging and management of diseases associated with changes in tissue elasticity.17,18
SWE is currently used to monitor fibrotic tissue changes in liver, spleen, breast, thyroid gland.19–22 This method is also used for qualitative and quantitative measurement of tissue elasticity in the evaluation of various musculoskeletal tissues including tendons, muscles, nerves and ligaments.23 SWE measures the propagation speed of induced shear wave at right angles to the main ultrasound beam, in the layer of interest and measured in meters/second (m/s).24
Bladder wall evaluation by 2D-SWE in our study was performed by transabdominal, suprapubic approach and using a 9 MHz linear probe. We used a transverse probe orientation, 90° to the bladder wall, with strong parallel alignment of the three bladder wall layers. Each participant, at three different volumes, had a series of 10 separate shear wave velocity measurements, obtained from the region of interest (ROI) defined on 10 images of anterior bladder wall. Mean SWV and inter-quartile ranges (IQR) were calculated automatically by ultrasound system. We evaluated SWE to assess bladder wall changes associated with increase of a bladder filling volume (V0, V2, V4) in both gender and each age decade (Figure 2). We also analyzed the effect of structural (bladder wall thickness) changes on SWV due to increasing of bladder volume.
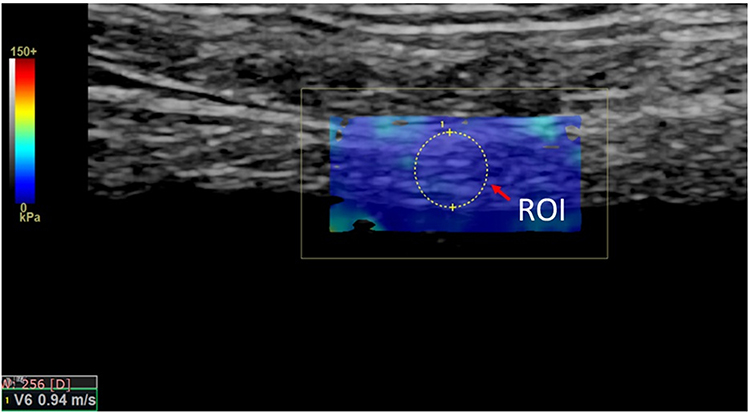 |
Figure 2 Bladder wall 2D Shear Wave Elastography image. SWV measurement of the bladder wall: Blue square – SWE map. Yellow circle – ROI (region of interest) – represents the bladder wall with SWV measurement within the SWE map. Abbreviations: SWV, shear wave velocity; SWE, shear wave elastography. |
Bladder wall blood circulation – measuring the resistive index
Bladder wall has a unique vascular architecture.25 The lamina propria contains two blood vessel plexa – the sub-urothelial capillary plexus and the mucosal plexus. The adventitia contains the adventitia plexus. The muscular layer contains the spiraled arteries.26
To evaluate the bladder wall blood circulation, to determine the influence of bladder filling volume on bladder blood flow and to investigate whether perfusion of the bladder is affected by the age or different in male and female, we investigated the same group of participants. The examination was performed in supine position, by suprapubic approach using linear probe with 9 MHz transducer frequency. Arterial blood flow was measured in randomly identified intramural arteries of anterior bladder wall. At least three arteries alongside of anterior bladder wall (middle and two laterals) were chosen. Scanning was performed on V0 (20–50 mL), V2 (180–200 mL) and V4 (380–400 mL) bladder volumes.
All healthy volunteers (116) underwent comparative measurements of blood flow in anterior bladder wall intramural arteries using Duplex Doppler. Intramural arteries were located using Color Doppler, and blood flow was measured using Pulsed Doppler (Figure 3). Peak systolic (PS) blood flow velocity and end-diastolic (ED) flow velocity were measured.
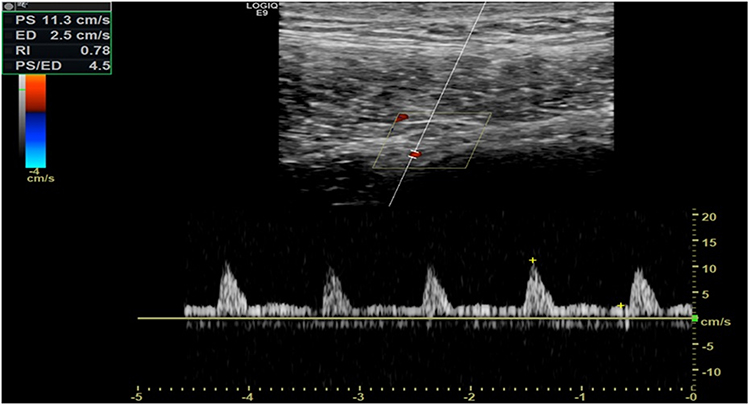 |
Figure 3 Bladder wall RI measurement image. The image shows color flow and spectral appearance of the bladder wall vessel with calculation of resistive index. Abbreviation: RI, resistive index. |
A velocity measurement alone does not provide any information about changes over the cardiac cycle. Use of a ratio as the descriptor overcomes this problem. Several ratios are used in vascular ultrasound. One of them is a resistive index. RI is a measure of the resistance to flow – the greater the resistance to flow, the less diastolic flow, the larger the RI value. The resistive index [RI = (PS-ED)/PS] was automatically determined by ultrasound system GE Logic E9, XDclear 2D.
For each patient, at each of three different bladder volumes, the average of the ten RIs was defined as the detrusor RI. A correlation coefficient was calculated between age, gender and in three different volumes to define predictive value of the RI.
Standardized approach
In our study, all participants, regardless of BMI, had anterior abdominal wall thickness (AWT) within suprapubic area of less than 4.0 cm. AWT of less than 4 cm is strongly recommended for bladder ultrasound. Abdominal wall thicknesses >5 cm are associated with increased risk of unreliable measurements that may affect the diagnostic value of ultrasound reference data.27 Depth of penetration of 4.0 cm is a primary limitation of SWE. SWV measurements may not be possible in patients with AWT >4 cm (GE Logic E9 Shear wave Elastography recommendations. JB3848US1).
Measurements with PVR bladder volume <20 mL were excluded. Transabdominal measurement of post-void BWT needs higher bladder volume of around 20–50 mL, which is leading to stretching of the bladder wall. In transabdominal ultrasound when the bladder is not adequately distended (<20 mL):
- bladder wall outlines are difficult to visualize and not clear enough for more precise measurements of bladder wall structures;
- it is difficult to exclude artifact – collapsed bladder;
- it is difficult to differentiate between diffuse and focal thickening.13
Participants with PVR >50 mL were not included due to possible pre-existing bladder outlet obstruction. PVR >50 mL is a sign of bladder damage.28,29 PVR >50 mL is considered abnormal in clinical routine.28 Men with PVR values >50 mL have a 3-fold increased risk of acute urinary retention during a follow-up period of 3–4 years compared to men with lower PVR values.30
Statistical analysis
Statistical data of all the recorded ultrasound measurement were calculated: mean, sample standard deviations (SD), medians, inter-quartile ranges (IQR) of the measured parameters at the 3 bladder volumes V0, V2 and V4.
Some calculated indexes were proposed in an attempt to identify simple parameters that might be suitable to be used as simple guides to identify abnormal bladder changes in different conditions in future bladder research:
- Bladder layers' thickness as ratios of the full wall thicknesses (BWT) were calculated for the 3 bladder volume measurements for all individuals in male/female age groups:
- Detrusor/BWT ratios (DBR);
- Mucosa/BWT ratios (MBR); and
- Serosa/BWT ratios (SBR).
- “Urinary Indexes” (UI) were also proposed, using the full bladder wall thickness measurements W0, W2, W4 at V0, V2, V4 volume, respectively.
W0 – represents BWT for volume V0 (20–50 mL),
W2 – represents BWT for volume V2 (180–200 mL);
W4 – represents BWT for volume V4 (380–400 mL).
UI are defined as follows:
- UI1= (W0 – W4)/W0
- UI2= (W0 – W2)/W0
- UI3= (W2 – W4)/W2
Pearson correlation coefficients (R) of the measurements of each parameter were computed to identify whether there were significant correlations between the various measurements and derived parameters across gender-age groups.
Analyses of variances (ANOVA) single-factor were also performed between the age groups to test whether there were significant differences (p<0.05) in the bladder measurements between the age groups of each gender.
X–y scatter plots and box plots were generated for the male and female groups. The plots also showed trend lines and regression coefficients for the significant parameters of interests.
Results
Participants
This study, with the primary objective to gather control group reference data for future bladder studies, involved 218 healthy male and female healthy adult participants, ages 19–79. One hundred and two participants were excluded from the study due to strict exclusion criteria, abnormal urine test and standardization. As a result, 116 volunteers (58 males and 58 females) were selected for further research (See Table 1).
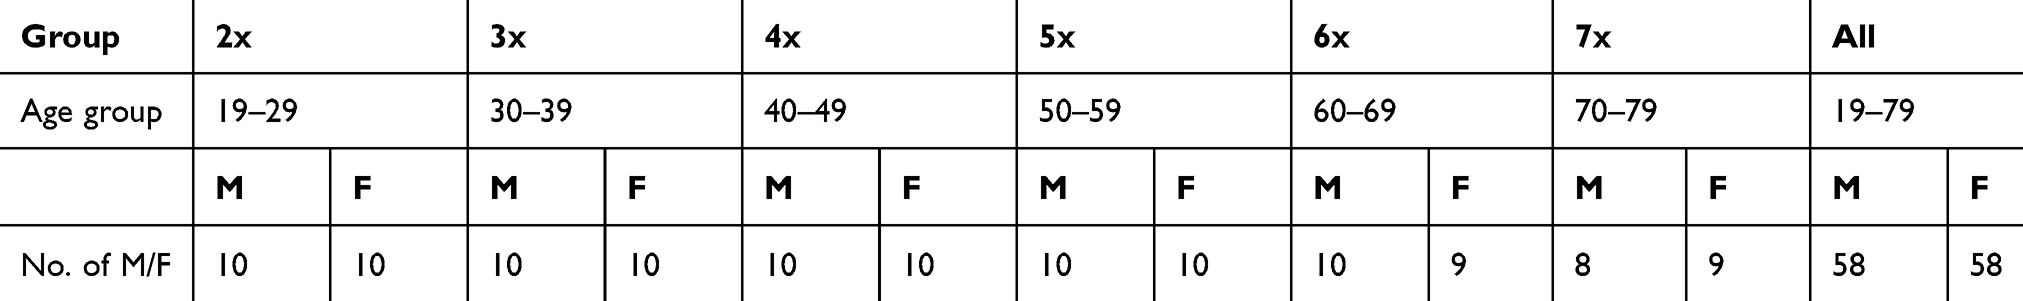 |
Table 1 Demographic data |
The following significant observations were noted from the ultrasound measurement data gathered during the bladder study.
BWT and BWLT measurement data
Key bladder parameter measurements gathered in this study are summarized in Table 2. For more comprehensive bladder measurements data collected in this study, please refer to Tab. S1M, S1F in Supplementary (S).
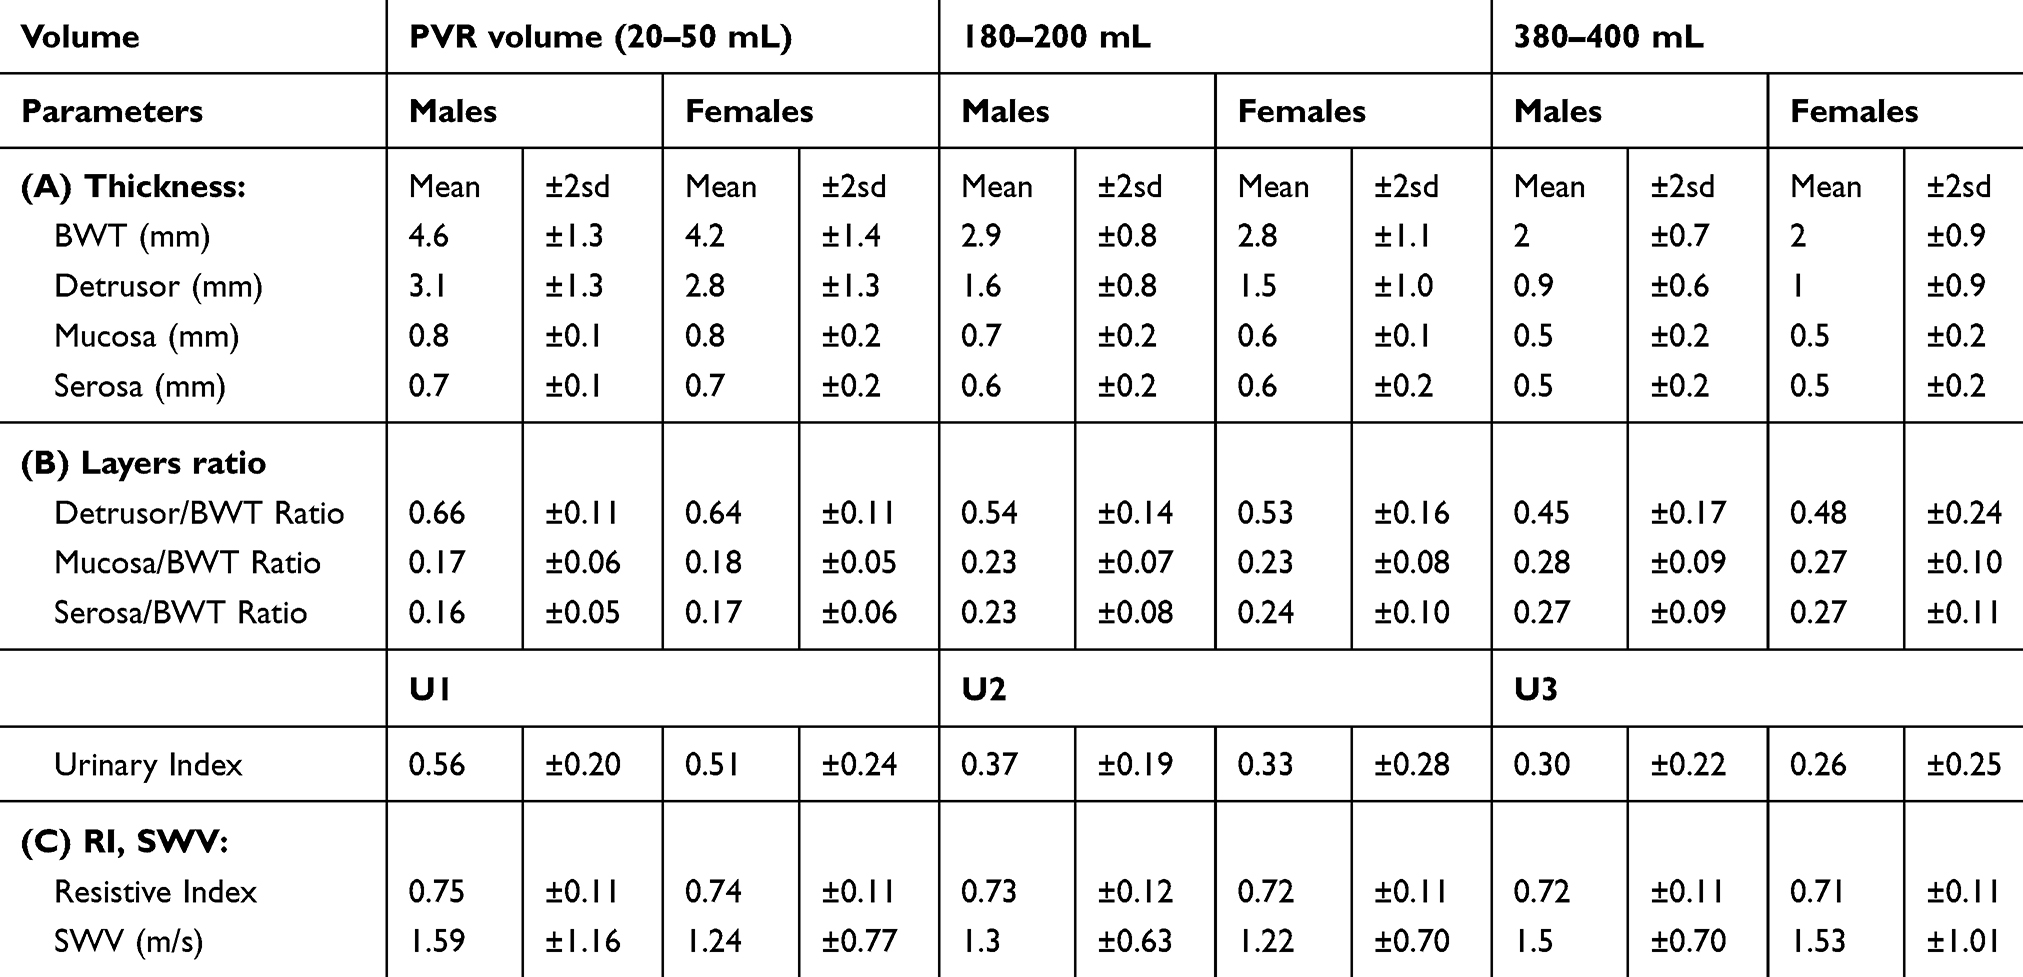 |
Table 2 Summary of bladder wall measurements. (A) Bladder wall and bladder wall layers thickness measurements. (B) Derived parameters – bladder layers ratio and urinary indexes. (C) SWV and RI measurements |
- Bladder Wall Thickness (mm):
BWT was measured in males and females at three different bladder volumes: V0, V2 and V4. In relation to BWT and gender, we found that mean bladder wall thickness was significantly thicker in males than in females (4.6±1.3 mm vs 4.2±1.5 mm, p<0.002) at volume V0. No statistical difference in BWT were revealed between males and females at volumes V2 and V4.
Age has a statistically significant impact on male BWT at volume V0 (p<0.02). In females with age, BWT remains unchanged at V0. BWT between age groups of men and women at V2 and V4 did not show any significant difference (See Figure S1, S2).
- Detrusor thickness (mm):
Male bladder had significantly thicker detrusor layers (3.1±1.3 mm) compared with females (2.8±1.3 mm) at volume V0 (p<0.004). DWT measurements were similar in males and females at volumes V2 and V4.
Age, similar to BWT, had a statistically significant impact on male DWT at volume V0 (p<0.004). No changes in DWT were seen with age in males at volumes V2 and V4 and in females at volumes V0, V2, V4.
- Mucosal and serosal thickness (mm):
From the observations, it appears that neither gender nor age had any impact on recorded mucosal and serosal thickness.
We found BWT and BWLT decreasing with increasing bladder volume. BWT and DWT decreased rapidly from volume V0 to V2 of bladder filling and decreased slower at V2–V4 bladder filling. Mean BWT and mean DWT reduced with increasing volume non-linearly for both genders and each age group, similar to the parabolic curve found by Oelke et al 200631 (See Figure S3, S4).
Derived parameters – bladder layer ratios and UIs
The results of the analysis of the bladder layer ratios and urinary indices in male/female participants are summarized in Table 2.
It was revealed that neither gender nor age had any significant impact on the:
- Detrusor/BWT ratio;
- Mucosal/BWT ratio;
- Serosal/BWT ratio;
- Urinary Indexes
Based on the ANOVA data, there was a weak negative correlation between bladder volume and:
- Detrusor/BWT ratio
We revealed that the higher the bladder volume, the lower the Detrusor/BWT ratio. At V0, percentage detrusor thickness was equal to approximately 66% (2/3) of the bladder wall thickness (0.66 for males and 0.64 for females); at V2 volume – 53–54% (0.54 for males and 0.53 for females), and at V4 – decreased to less than 50% (M 0.45 – F 0.48) of the bladder wall.
There was a weak positive correlation between bladder volume and:
- Mucosal/BWT Ratio; and
- Serosa/BWT ratio
The sum of the Mucosal/BWT ratio and Serosa/BWT ratio (0.33 for male and 0.35 for female) at V0 was equal to approximately 34%, ~1/3 of the bladder wall thickness. At V2, the sum of this ratio in percentage was approximately 46–47%. At bladder volume V4, the sum of Mucosal/BWT and Serosa/BWT ratio in percentage exceeded 50% (0.55 for male and 0.54 for female) of bladder wall thickness.
There was a weak negative correlation between bladder volume (Table 2) and:
- Urinary Indices UI1, UI2, UI3.
We revealed – the higher the difference between the volumes the higher the Urinary Index.
Shear wave velocity measurements
The measurements of SWV in m/s are presented in Table 2. Logic E9 XDclear 2D automatically calculated the median value and an interquartile range interval (IQR) of the valid SWV measurements. A valid bladder wall assessment was considered as the median value of ten measurements acquired in a homogenous area within anterior bladder wall with an IQR <30%. (GE Healthcare LOGIC E9 Shear Wave Elastography White paper recommendations. Available at: http://www3.gehealthcare.com.)
Observation revealed that mean SWV in males (1.59±1.16 m/s) appeared to be significantly higher than in females (1.24±0.77 m/s) at post-void residual volume V0 (p<0.0002). Age did not have a significant impact on SWV in males and females. Statistical analysis showed positive correlation of higher SWV with higher BWT in males at V0 (See Figure S5, S6).
The SWV measurements appeared to be very similar for all age and gender groups at V2 and V4 bladder volumes measured, allowing for measurement precision and expected data variability.
SWV in males and females appeared to increase by circa 25% (p<0.04) as the bladder volume built up to V4 for all age groups. We noticed that the ratio of serosal and mucosal layer (predominantly connective tissue) to detrusor (smooth muscle) within the bladder wall at this volume exceeded 50% of BWT.
Resistive index
The results of the RI measurements in female/male participants in each decade and each bladder volume are summarized in Table 2. The values of RI obtained from the bladder wall arteries at each measuring point in each patient appeared to be very similar at each of the three bladder volumes measured, across all male and female age groups and thus statistical data. The RI was within 0.71–0.75 range in all groups, ie, RI appeared to change only minimally or remain practically unchanged as the bladder volume built up for all males and females age groups (See Figure S7, S8).
Discussion
In this study with the primary objective to gather reference data for future bladder studies, we obtained reference sonomorphologic parameters of the urinary bladder. We used a combination of high-frequency ultrasound, SWE and Duplex Doppler to define structural, biomechanical and microcirculatory changes in dynamics at three filling bladder volumes in 116 participants with healthy bladder.
In essence, it was a range of potential tests, ratio and indexes conducted in healthy people to define the normal values, ie, the range of values in people with healthy bladder and to examine the influence of gender, age and volume.
The exclusion of individuals with minor health issues (eg, bladder, pelvic and somatic conditions) and standardized approach have made our data more reliable than other studies for establishing a baseline.
BWT and BWLT
Bladder wall pathology affects bladder wall structure. Structural changes of the bladder wall due to pathological processes can be revealed by measurements of layers thickness.
Past studies32–40 that involved measuring the bladder wall using ultrasound were primarily focused on bladder disorders with detrusor hypertrophy. Our study is the first known study to examine the bladder using high-frequency ultrasound at all three layers, ie, serosa, detrusor and mucosa, measured in both genders, in six decades age groups and at multiple filling volumes.
Published research data of BWT and DWT in healthy controls32–36,38,39,40–43 vary widely according to anatomical approach, sites of measurement, ultrasound frequency and bladder volume. Normal values for BWT, BWLT using high-frequency ultrasound in males and females, age-related changes at different bladder volumes, have not been established. Subsequently, no points of reference are available in clinical practice for bladder disorders.
Relationship between BWT, BWLT and age & gender
Our study found BWT and DWT in healthy participants are significantly thicker in males than in females at volume V0 (~20–50 mL). This aligns with the results reported by Hekenbery O et al 2000 and Oelke M et al 200744,45 who reported greater BWT in men than women.44,45 Birang S, et al,46 Blatt et al41 and Kanyilmaz et al47 reported no difference in BWT between gender and different ages. DWT did not differ among healthy controls reported by Kuo et al.48 Positive correlation between BWT and age was found by M. Ali et al,49 but in their study it was found in both gender groups. Comparison of actual measurements of BWT and BWLT between different studies cannot be used, due to variable approach, variable site of measurement, variable volumes and variable standards they are measured at.
Relationship between BWT, BWLT and bladder volume
We found that the BWT and DWT reduced with increasing volume non-linearly for both genders. (See charts BWT and DWT vs bladder volume in males and females, Figure S1–2). The measured mean BWT and DWT decreased significantly from the V0 to V2 and then decreased slowly to V4 volume, similar to the parabolic curve for the detrusor thickness measurement data reported by Oelke, 2006; Blatt, 2008; and Ke, 2011.31,41,50 In their studies, DWT decreased rapidly with increasing the volume from emptied bladder to 250 mL bladder filling and then decreased slowly to bladder capacity.
Bladder layer ratios
The analysis of the bladder layers ratios revealed that Detrusor/BWT ratio decreases with increasing bladder filling volume. Since the mucosal and serosal thicknesses do not vary substantially over the bladder volume changes, the mucosal/BWT ratio and serosal/BWT ratio therefore increase with increasing volume. At the 400 mL bladder volume, combined ratio of mucosal and serosal layers reach more than >50% of BWT – a proportional increase in the connective tissue/smooth muscle ratio.
We have not come across other research studies using derived parameters similar to our proposed bladder layers ratios at different bladder volumes for comparison.
Urinary indexes
In our study, we found a negative correlation between bladder volume and
- Urinary Indexes UI1, UI2, UI3
Bladder wall thickness is variable and changing with volume: the higher the degree of change of the bladder volume (difference between measured filling volumes), the higher the Urinary Index.
Other researchers, eg, Yeung et al51 and Hooman et al,52 had proposed a Bladder Volume Wall Index based on bladder volume index and wall thickness, which claimed to be useful in children.
Shear wave elastography
Bladder wall elasticity is physiological biomechanical characteristic and can change due to different pathological processes of various diseases.53 It is known that bladder dysfunction secondary to inflammation, obstructive or neurogenic etiologies are associated with hypertrophy of smooth muscle cells, hyperplasia of fibroblasts and deposition of collagen fibers between muscle cell bundles of the detrusor.54 These changes may affect bladder elasticity due to an increase in ratio of connective tissue to smooth muscle present within the bladder wall.53,55
In the present study, we used a latest ultrasound-based technique, 2D–Shear Wave Elastography, to assess and quantify the bladder wall stiffness. Using this method, we measured the propagation speed of induced shear wave in the layer of interest – bladder wall – marked in the ultrasound window. We noticed at V0 mean SWV in males appeared to be higher than in females (1.59±1.16 m/s vs 1.24±0.77 m/s). This correlates with the BWT data: from our observation at V0, male mean BWT and DWT were higher than females. This difference becomes significant in males with age (p<0.007). Increase in BWT in males with age could be related to detrusor hypertrophy or secondary to increased interstitial collagen deposition.56 This association in elderly males may be attributed to pre-existing bladder outlet obstruction (BOO), and is an early sign of bladder damage.29
We observed no significant variations in SWV between gender and age groups at volume V2 and V4. Our data showed a statistically significant increment in SWV from 1.2 m/s (V2) to 1.5 m/s, at bladder volume V4 (p<0.04). This correlates with the bladder layers ratio data. From our observations, the sum of Mucosal and Serosal ratio to BWT at V4 reached 0.55 in males and 0.54 in females, ie,>50% of full BWT. Since Mucosa and Serosa consist of, predominantly, fibrous connective tissue, this influences the SWV and was reflected in the increase from 1.2 m/s to 1.5 m/s.
We believe that the ratio of fibrous connective tissue to smooth muscles is a factor that plays a role in the SWV and SWE and is a sensitive method to detect small changes of bladder wall viscoelasticity. This may have been an especially useful parameter for diagnosis of early fibrotic changes within the bladder wall in patients with urinary bladder disorders.
Our SWV vs volume data are in general agreement with Sturm et al57 at 0%, 25%, 75% and 100% bladder filling volumes. However, our results differ from the research data published by Liao and Schaefer 200758 who mentioned that there were ample difference in viscoelasticity between gender and age.
Resistive index
Experimental and clinical studies suggest that prolonged bladder ischemia leads to morphological and functional changes in the bladder.59 Ischemic processes damages the urothelium first, causes pain and loss of bladder compliance.26,60 Due to ischemia, bladder wall changes may result in irreversible fibrotic changes in patients with non-Hunner-type interstitial cystitis.10 Several clinical studies suggest ischemia induce marked bladder wall fibrosis and loss of bladder compliance.60,61
A few studies have examined the microcirculation in the bladder wall predominantly using a Laser Doppler flowmetry, transabdominal and transvaginal ultrasound.10,61,62 Lack of standardized methodology has resulted in significant discrepancies among studies and reproducible diagnostic ranges. Resistive Index and normal values of urinary bladder blood flow in a control group with relationship between age, gender and different bladder volume measured by high-frequency ultrasound has not been assessed previously.
To determine the influence of bladder filling volume on blood flow in the healthy bladder and to investigate whether perfusion of the bladder is affected by the age or different in male and female, we performed comparative measurements of blood flow using Duplex Doppler ultrasound on the same group of volunteers.
In our study, we found that with increasing bladder volume from PVR 20–50 mL to 180–200 mL and 380–400 mL, the RI remain unchanged. Further, the resistive index was within the range RI =0.71–0.75 in all age and gender groups. Statistical analysis showed that there were no significant differences in bladder wall perfusion between the all age and gender groups, independently of changes in the volume. Our data correlate with other studies,63,64 which showed that with increasing distension of the bladder in healthy population, the RI do not change.
Conclusions
In this preliminary study, we provided a structural, biomechanical and hemodynamic assessment of the bladder wall of a healthy population using high-frequency ultrasound. We obtained baseline normal control data of BWT, BWLT, SWV and bladder vessels RI using three ultrasound applications: HFUS, SWE and Duplex Doppler.
This project is designed to obtain control reference data as a precursor to further research into the diagnosis, causes and control of treatment of bladder diseases. Ultrasound obtained measurements are potential noninvasive clinical tools in identifying individuals at high risk of developing bladder pathology and is an important step in a poorly understood area.
Ultrasound has shown potential in delivering cost-effective and non-invasive methods for assessing bladder wall changes and further unbiased large-scale studies will be conducted on healthy control groups and bladder sufferers to extend and support our results.
Ethics approval
This research protocol was approved by the Human Research Ethics Committee at Sir Charles Gairdner Hospital (HREC SCGH, 2015-2016) in Perth, Australia. All participants provided written informed consent.
Abbreviations
IC/BPS, Interstitial Cystitis/Bladder Pain Syndrome; BMI, body mass index; BWT, bladder wall thickness; BWLT, bladder wall layer thickness; DWT, detrusor wall thickness; SWT, serosa wall thickness; MWT, mucosa wall thickness; PVR, post-void residual volume; ROI, region of interest; RI, Resistive Index; SWE, Shear Wave Elastography; SWV, Shear Wave Velocity; HFUS, high-frequency ultrasound; US, ultrasound; DD, Duplex Doppler; UI, urinary index.
Acknowledgment
The assistance and technical advice and contributions provided by the following organization/persons are gratefully acknowledged: GE Healthcare (Wauwatosa, WI, USA) – for the initial loan of a LOGIQ E9 XDclear 2.0 ultrasound machine. Dr David Smith, Director of Path West, WA – for providing results of the Urinary tests. Dr Alfred Tay and Dr Marry Webberley – for proof reading the manuscript. Hayden Morton (student) – for assisting in the development of the Access database. This project is funded by an anonymous donor who played no role in study design or analysis.
Disclosure
The authors report no conflicts of interest in this work.
References
1. Abrams P, Cardozo L, Fall M, et al. The standardisation of terminology of lower urinary tract function: report from the standardisation sub-committee of the International Continence Society. Neurourol Urodyn. 2002;21:167. doi:10.1002/nau.10052
2. Maserejian NN, Chen S, Chiu GR, et al. Incidence of lower urinary tract symptoms in a population-based study of men and women. Urology. 2013;82:560. doi:10.1016/j.urology.2013.05.009
3. Kupelian V, Wei JT, O’Leary MP, et al. Prevalence of lower urinary tract symptoms and effect on quality of life in a racially and ethnically diverse random sample: the Boston Area Community Health (BACH) survey. Arch Intern Med. 2006;166:2381. doi:10.1001/archinte.166.17.1863
4. Lepor H, Machi G, Barry MJ. Comparison of AUA symptom index in unselected males and females between 55 and 79 years of age. Urology. 1993;42:36. doi:10.1016/j.juro.2008.01.118
5. Chancellor MB, Rivas DA. American Urological Association symptom index for women with voiding symptoms: lack of index specificity for benign prostate hyperplasia. J Urol. 1993;150:1706. doi:10.1016/S0022-5347(17)35872-X
6. Denson MA, Griebling TL, Cohen MB, et al. Comparison of cystoscopic and histological findings in patients with suspected interstitial cystitis. J Urol. 2000;164:1908. doi:10.1016/S0022-5347(05)66915-7
7. Maeda D, Akiyama Y, Morikawa T, et al. Hunner-type (classic) interstitial cystitis: a distinct inflammatory disorder characterized by pancystitis, with frequent expansion of clonal b-cells and epithelial denudation. PLoS One. 2015;10:e0143316. doi:10.1371/journal.pone.0143316
8. Kim A, Han JY, Ryu CM, et al. Histopathological characteristics of interstitial cystitis/bladder pain syndrome without hunner lesion. Histopathology. 2017;71:415. doi:10.1111/his.13235
9. Jhang JF, Kuo HC. Pathomechanism of interstitial cystitis/bladder pain syndrome and mapping the heterogeneity of disease. Int Neurourol J. 2016;20:95. doi:10.5213/inj.1632712.356
10. Kershen RT, Azadzoi KM, Siroky MB. Blood flow, pressure and compliance in the male human bladder. J Urol. 2002;168:121. doi:10.1016/S0022-5347(05)64843-4
11. ElDin KE, Kiemeney LALM, deWildt MJAM, et al. The correlation between bladder outlet obstruction and lower urinary tract symptoms as measured by the international prostate symptom score. J Urol. 1996;156:1020. doi:10.1097/00005392-199608000-00076
12. Elbadawi AE, Light JK. Distinctive ultrastructural pathology of nonulcerative interstitial cystitis: new observations and their potential significance in pathogenesis. Urol Int. 1996;56:137. doi:10.1159/000282832
13. Kojima M, Inui E, Ochiai A, et al. Ultrasonic estimation of bladder weight as a measure of bladder hypertrophy in men with infravesical obstruction: a preliminary report. Urology. 1996;47:942. doi:10.1016/S0090-4295(96)00059-3
14. Chancellor MB, Rivas DA, Keeley FX, et al. Similarity of the American Urological Association symptom index among men with benign prostate hyperplasia (BPH), urethral obstruction not due to BPH and detrusor hyperreflexia without outlet obstruction. Br J Urol. 1994;74:200. doi:10.1111/j.1464-410X.1994.tb16586.x
15. McConnell JD, Barry MJ, Bruskewitz RC. Benign prostatic hyperplasia: diagnosis and treatment. Agency for health care policy and research. Clin Pract Guidel Quick Ref Guide Clin. 1994;8:1–17.
16. Zaleska-Dorobisz U, Kaczorowski K, Pawlus A, et al. Ultrasound elastography – review of techniques and its clinical applications. Adv Clin Exp Med. 2014;23:645. doi:10.17219/acem/26301
17. James F, Greenleaf MF, Insana M. Selected methods for imaging elastic properties of biological tissues. Annu Rev Biomed Eng. 2003;5:57. doi:10.1146/annurev.bioeng.5.040202.121623
18. Arda K, Ciledag N, Aktas E, et al. Quantitative assessment of normal soft-tissue elasticity using shear-wave ultrasound elastography. Am J Roentgenol. 2011;197:532. doi:10.2214/AJR.10.5449
19. Park HS, Kim YJ, Yu MH, et al. Shear wave elastography of focal liver lesion: intraobserver reproducibility and elasticity characterization. Ultrasound Q. 2015;31:262. doi:10.1097/RUQ.0000000000000175
20. Pawluś A, Inglot MS, Szymańska K, et al. Shear wave elastography of the spleen: evaluation of spleen stiffness in healthy volunteers. Abdom Radiol (NY). 2016;41:2169. doi:10.1007/s00261-016-0834-4
21. Athanasiou A, Latorre-Ossa H, Criton A, et al. Feasibility of imaging and treatment monitoring of breast lesions with three-dimensional shear wave elastography. Ultraschall Med. 2017;38:51.
22. Duan SB, Yu J, Li X, et al. Diagnostic value of two-dimensional shear wave elastography in papillary thyroid microcarcinoma. Onco Targets Ther. 2016;9:1311.
23. Taljanovic MS, Gimber LH, Becker GW, et al. Shear-wave elastography: basic physics and musculoskeletal applications. RadioGraphics. 2017;37:855. doi:10.1148/rg.2017164012
24. Li Y, Snedeker JG. Elastography: modality-specific approaches, clinical applications, and research horizons. Skeletal Radiol. 2011;40:389. doi:10.1007/s00256-011-1247-7
25. Brading AF, Greenland JE, Mills IW, et al. Blood supply to the bladder during filling. Scand J Urol Nephrol Suppl. 1999;201:25.
26. Miodonski AJ, Litwin JA. Microvascular architecture of the human urinary bladder wall: a corrosion casting study. Anat Rec. 1999;254:375. doi:10.1002/(SICI)1097-0185(19990301)254:3<375::AID-AR8>3.0.CO;2-R
27. Kwon JK, Trexler N, Reisch J, et al. Correlating abdominal wall thickness and body mass index to predict usefulness of right lower quadrant ultrasound for evaluation of pediatric appendicitis. Pediatr Emerg Care. 2017. doi:10.1097/PEC.0000000000001313
28. Koyanagi T, Artibani W, Correa R, et al. Initial Diagnostic Evakuation of Men with Lower Urinary Tract Symptoms. Presented at the 4th Consultation on Benigh Prostatic Hyperplasia (BPH). Plymouth: Plymbridge Distributors Ltd; 1998.
29. Galosi AB, Mazzaferro D, Lacetera V, et al. Modifications of the bladder wall (organ damage) in patients with bladder outlet obstruction: ultrasound parameters. Arch Ital Urol Androl. 2012;84:263.
30. Kolman C, Girman CJ, Jacobsen SJ, et al. Distribution of post-void residual urine volume in randomly selected men. J Urol. 1999;161:122. doi:10.1016/S0022-5347(01)62081-0
31. Oelke M, Hofner K, Jonas U, et al. Ultrasound measurement of detrusor wall thickness in healthy adults. Neurourol Urodyn. 2006;25:308. doi:10.1002/nau.20242
32. Chung SD, Chiu B, Kuo HC, et al. Transabdominal ultrasonography of detrusor wall thickness in women with overactive bladder. BJU Int. 2010;105:668. doi:10.1111/j.1464-410X.2009.08927.x
33. Minardi D, Piloni V, Amadi A, et al. Correlation between urodynamics and perineal ultrasound in female patients with urinary incontinence. Neurourol Urodyn. 2007;26:176. doi:10.1002/nau.20327
34. Ibrahim S: Measuring bladder wall thickness in cases of detrusor instability using transvaginal ultrasound.
35. Kuo HC. Measurement of detrusor wall thickness in women with overactive bladder by transvaginal and transabdominal sonography. Int Urogynecol J Pelvic Floor Dysfunct. 2009;20:1293. doi:10.1007/s00192-009-0946-2
36. Ozturk H, Aydur E, Irkilata H, et al. UP-03.161 the diagnostic role of transabdominal ultrasonographic bladder wall thickness in the female urinary incontinence. Urology. 2011;78:S397. doi:10.1016/j.urology.2011.06.050
37. Soligo M, Salvatore S, Khullar V et al. Overactive bladder definition and ultrasound measurement of bladder wall thickness: the right way without urodynamics.
38. Yang JM, Huang WC. Discrimination of bladder disorders in female lower urinary tract symptoms on ultrasonographic cystourethrography. J Ultrasound Med. 2002;21:1249. doi:10.7863/jum.2002.21.11.1249
39. Chan L, The S, Titus J, et al. P14.02: the value of bladder wall thickness measurement in the assessment of overactive bladder syndrome. Ultrasound Obstr Gynecol. 2005;26:460. doi:10.1002/uog.2546
40. Parsons M, Vella M. Does bladder wall thickness discriminate detrusor overactivity from overactive bladder and normality?
41. Blatt AH, Titus J, Chan L. Ultrasound measurement of bladder wall thickness in the assessment of voiding dysfunction. J Urol. 2008;179:2275. doi:10.1016/j.juro.2008.01.118
42. Silva JA, Gonsalves Mde C, de Melo RT, et al. Association between the bladder wall thickness and urodynamic findings in patients with spinal cord injury. World J Urol. 2015;33:131. doi:10.1007/s00345-014-1265-x
43. Serati M, Salvatore S, Cattoni E, et al. Ultrasound measurement of bladder wall thickness in different forms of detrusor overactivity. Int Urogynecol J. 2010;21:1405. doi:10.1007/s00192-010-1194-1
44. Hakenberg OW, Linne C, Manseck A, et al. Bladder wall thickness in normal adults and men with mild lower urinary tract symptoms and benign prostatic enlargement. Neurourol Urodyn. 2000;19:585. doi:10.1002/1520-6777(2000)19:5<585::AID-NAU5>3.0.CO;2-U
45. Oelke M, Hofner K, Jonas U, et al. Diagnostic accuracy of noninvasive tests to evaluate bladder outlet obstruction in men: detrusor wall thickness, uroflowmetry, postvoid residual urine, and prostate volume. Eur Urol. 2007;52:827. doi:10.1016/j.eururo.2006.12.023
46. Birang S, Kafaee Z, SaneeiTaheri M, et al. Normal values of mucosal thickness of bladder. J Army Univ Med Sci Ir. 2006;4:781–784.
47. Kanyilmaz S, Calis FA, Cinar Y, et al. Bladder wall thickness and ultrasound estimated bladder weight in healthy adults with portative ultrasound device. J Res Med Sci. 2013;18:103.
48. Kuo H-C, Chen Y-C, Chen C-Y, et al. Transabdominal ultrasound measurement of detrusor wall thickness in patients with overactive bladder. Tzu Chi Med J. 2009;21:129. doi:10.1016/S1016-3190(09)60024-0
49. Ali MM, Ahmed AF, Khaled SM, et al. Accuracy of ultrasound-measured bladder wall thickness for the diagnosis of detrusor overactivity. Afr J Urol. 2015;21:25. doi:10.1016/j.afju.2014.11.005
50. Ke Q-S, Kuo H-C. The promise of bladder wall thickness as a useful biomarker for objective diagnosis of lower urinary tract dysfunction. Tzu Chi Med J. 2011;23:1. doi:10.1016/j.tcmj.2011.03.005
51. Yeung CK, Sreedhar B, Leung VT, et al. Ultrasound bladder measurements in patients with primary nocturnal enuresis: a urodynamic and treatment outcome correlation. J Urol. 2004;171:2589. doi:10.1097/01.ju.0000124929.05706.6b
52. Hooman N, Mostafavi SH, Hallaji F, et al. Bladder volume wall index in children with urinary tract infection. Pediatr Nephrol. 2011;26:1685.
53. Landau EH, Jayanthi VR, Churchill BM, et al. Loss of elasticity in dysfunctional bladders: urodynamic and histochemical correlation. J Urol. 1994;152:702. doi:10.1016/S0022-5347(17)32685-X
54. Uvelius B, Persson L, Mattiasson A. Smooth muscle cell hypertrophy and hyperplasia in the rat detrusor after short-time infravesical outflow obstruction. J Urol. 1984;131:173. doi:10.1016/S0022-5347(17)50253-0
55. Sturm RM, Cheng EY. The management of the pediatric neurogenic bladder. Curr Bladder Dysfunct Rep. 2016;11:225. doi:10.1007/s11884-016-0371-6
56. Elbadawi A, Diokno AC, Millard RJ. The aging bladder: morphology and urodynamics. World J Urol. 1998;16(Suppl 1):S10. doi:10.1007/PL00014134
57. Sturm RM, Yerkes EB, Nicholas JL, et al. Ultrasound shear wave elastography: a novel method to evaluate bladder pressure. J Urol. 2017. doi:10.1016/j.juro.2017.03.127
58. Liao LM, Schaefer W. Cross-sectional and longitudinal studies on interaction between bladder compliance and outflow obstruction in men with benign prostatic hyperplasia. Asian J Androl. 2007;9:51. doi:10.1111/j.1745-7262.2007.00221.x
59. Andersson KE, Nomiya M, Yamaguchi O. Chronic pelvic ischemia: contribution to the pathogenesis of Lower Urinary Tract Symptoms (LUTS): a new target for pharmacological treatment? Low Urin Tract Symptoms. 2015;7:1. doi:10.1111/luts.12084
60. Siroky MB. The aging bladder. Rev Urol. 2004;6:S3.
61. Pinggera GM, Mitterberger M, Steiner E, et al. Association of lower urinary tract symptoms and chronic ischaemia of the lower urinary tract in elderly women and men: assessment using colour doppler ultrasonography. BJU Int. 2008;102:470. doi:10.1111/j.1464-410X.2008.07587.x
62. Batista JE, Wagner JR, Azadzoi KM, et al. Direct measurement of blood flow in the human bladder. J Urol. 1996;155:630. doi:10.1016/S0022-5347(01)66471-1
63. Hohlbrugger G, Frauscher F, Strasser H, et al. Evidence for the autoregulation of vesical circulation by intravesical potassium chloride and distension in the normal human bladder. BJU Int. 2000;85:412. doi:10.1046/j.1464-410x.2000.00519.x
64. Farag FF, Heesakkers J. Imaging assessments of lower urinary tract dysfunctions: future steps. Turk J Urol. 2014;40:78. doi:10.5152/tud.2014.43650
 © 2019 The Author(s). This work is published and licensed by Dove Medical Press Limited. The full terms of this license are available at https://www.dovepress.com/terms.php and incorporate the Creative Commons Attribution - Non Commercial (unported, v3.0) License.
By accessing the work you hereby accept the Terms. Non-commercial uses of the work are permitted without any further permission from Dove Medical Press Limited, provided the work is properly attributed. For permission for commercial use of this work, please see paragraphs 4.2 and 5 of our Terms.
© 2019 The Author(s). This work is published and licensed by Dove Medical Press Limited. The full terms of this license are available at https://www.dovepress.com/terms.php and incorporate the Creative Commons Attribution - Non Commercial (unported, v3.0) License.
By accessing the work you hereby accept the Terms. Non-commercial uses of the work are permitted without any further permission from Dove Medical Press Limited, provided the work is properly attributed. For permission for commercial use of this work, please see paragraphs 4.2 and 5 of our Terms.