")
Back to Journals » Biologics: Targets and Therapy » Volume 12
Structural and functional comparability study of anti-CD20 monoclonal antibody with reference product
Authors Singh SK, Pokalwar S, Bose S, Gupta S, Almal S, Ranbhor RS
Received 16 September 2018
Accepted for publication 17 October 2018
Published 23 November 2018 Volume 2018:12 Pages 159—170
DOI https://doi.org/10.2147/BTT.S187744
Checked for plagiarism Yes
Review by Single anonymous peer review
Peer reviewer comments 2
Editor who approved publication: Dr Doris Benbrook
Sanjay Kumar Singh, Santosh Pokalwar, Sandip Bose, Shivika Gupta, Suhani Almal, Ranjit Sudhakar Ranbhor
Sun Pharmaceutical Industries Limited, Tandalja, Vadodara 390 012, India
Background: Cell surface protein, CD20, is extensively expressed on the surface of B cells. Antibodies targeting CD20 protein are being used to treat B-cell malignancies and B-cell mediated autoimmune diseases. Considering the cost of therapy with innovator monoclonal antibodies for these diseases, development of biosimilar products for the treatment of such diseases provides affordable solution to rising healthcare costs.
Materials and Methods: Reference products of rituximab (six batches) were procured and stored as per manufacturer's instructions. Cell lines used in bioassay were procured from American Type Culture Collection and all other reagents used for analysis were of analytical grade. Primary structure was studied by intact mass analysis, peptide fingerprinting, peptide mass fingerprinting and sequence coverage analysis. Higher order structure was studied by circular dichroism, ultraviolet-visible spectroscopy, fluorescence spectroscopy, and disulfide bridge analysis. Different isoforms of reference product and SB-02 were identified using capillary isoelectric focusing and capillary zone electrophoresis. Glycosylation was studied by N-glycan mapping using LC-ESI-MS, point of glycosylation, released glycan analysis using ultra performance liquid chromatography (UPLC). Product related impurities such as oligomer content analysis and oxidized impurities were studied using size exclusion chromatography and reverse phase high performance liquid chromatography, respectively.
Results and Conclusion: Here, we report physicochemical and biological characterizations of Sun Pharma’s proposed biosimilar (SB-02) to rituximab, a monoclonal anti-CD20 antibody approved for the treatment of non-Hodgkin’s lymphoma and chronic lymphocytic leukemia. SB-02 and rituximab exhibited indistinguishable primary as well as higher-order structure upon analyzing with the array of analytical and extended characterization methods according to statistical methods. The molecule also displayed comparability to reference product in post-translational modifications and charge heterogeneity. In functional bioassays, SB-02 demonstrated comparable potency with respect to reference product. Our results indicate highly similar quality profile between SB-02 and rituximab.
Keywords: biosimilar, rituximab, CD20, monoclonal antibody, Biosimilarity, ADCC, CDC
Introduction
With the advent of recombinant DNA technology and monoclonal antibody technology, it is possible to design and produce highly targeted and tailor-made biological medicines. However, these recombinant therapeutic biologics are complex in nature made up of several long chain amino acids and complex sugar moieties attached to it. Moreover, these complex biologics are produced by living cells (bacteria, yeast, or mammalian cell lines). To be approved as medicines by health authorities, biologics need to undergo extensive preclinical and clinical studies to show the safety and efficacy of the molecule. Thus, compared to conventional medicines (small molecules), biologics are expensive. In order to reduce the cost of biological medicines, Obama Administration, USA, signed The Patient Protection and Affordable Care Act on March 23, 2010. The affordable care act allowed the US Food and Drug Administration (FDA) to accelerate the approval process for biosimilars.1 A biosimilar is an almost identical copy of an FDA-approved reference product.2,3
Rituximab is a genetically engineered chimeric monoclonal antibody against CD20 antigen, which was approved by the FDA on November 26, 1997, for the indication of relapsed or refractory, CD20-positive, B-cell, low-grade, or follicular non-Hodgkin’s lymphoma (NHL). The European Agency for the Evaluation of Medicinal Products on June 2, 1998, approved rituximab for the therapy of patients with stage III/IV, follicular, chemoresistant, or relapsed NHL. Rituximab binds to CD20 present on B-cell surface and destroys them. Rituximab molecule is formed by two heavy chains of 451 amino acids and two light chains of 231 amino acids. There are several biosimilars approved by various regulatory agencies.4–8
Regulatory agencies (USFDA, European Medical Agency [EMA], Central Drug Standard Control Organization, and so on) released biosimilar application pathway criteria to establish similarity between the reference product and the biosimilar product. For the assessment of similarity, USFDA recommended tiered approach to evaluate analytical similarity between proposed biosimilar and reference products in which the quality attributes (QAs) are divided by their impact on product quality and clinical outcome.9 As per the tiered approach, QAs are divided into three tiers based on their criticality. Critical QAs n Tier I are analyzed with test for equivalence, establishment of range is required for QAs in Tier II, and side-by-side graphical comparison approach is used for QAs in Tier III. The biosimilar pathway requires step-by-step approach wherein detailed in-depth physicochemical and functional characterizations are required. The USFDA released draft guidance on “statistical approaches to analytical similarity” on September 21, 2017. The released guidance required that the final analytical similarity report, which should include the analytical similarity assessment plant, should be included when a 351(k) biologics license application is submitted. However, FDA announced withdrawal of the analytical similarity draft guidance on June 21, 2018.10 FDA intends to issue future draft guidance that will reflect state-of-the-art techniques in the evaluation of analytical data and to address the potential challenges faced by biosimilar sponsors in designing studies including the consideration of appropriate methods to analyze analytical data to account for potential lot-to-lot variability of the reference product. Various biosimilar analytical studies with respect to rituximab have been published elsewhere.11–19 With reference to available statistical methods, here, we demonstrate the biosimilarity assessment of SB-02 (biosimilar candidate) with respect to the reference product (rituximab) available in US (Rituxan), EU (MabThera), and Indian (Ristova) markets. We performed physicochemical and biological characterizations of SB-02 and reference products using state-of-the-art instruments. Our results show that the SB-02 has a very highly similar quality profile and the differences are within the acceptable ranges of biosimilarity.
Materials and methods
Materials
Reference products of rituximab (two different batches of each US reference product and EU reference product and four different batches of Indian reference product [100 mg/10 mL injection for intravenous infusion]) were procured and stored according to the manufacturer’s specifications. The data of all batches of reference products from US, EU, and Indian markets were taken together to calculate the SD and range calculations. SB-02 (rituximab biosimilar candidate) was produced using Chinese hamster ovary (CHO) cell line in-house at Sun Pharmaceuticals Industries Limited (Vadodara, India). Cell lines used in bioassay were procured from American Type Culture Collection (ATCC; Manassas, VA, USA), and all other chemicals used for analysis were of analytical grade.
Methods
SDS-PAGE
The electrophoretic mobility of SB-02 and reference products was determined by SDS-PAGE under reducing (12% gel) and nonreducing (8% gel) conditions. Equated concentrations (3 µg) of SB-02 and reference products were loaded on gel, and the gel is run at the constant electric current of 15 mA. The molecular weight ladder (molecular weight range 10–250 kDa) was loaded into the first lane of the gel. The gels were developed using the Coomassie brilliant blue R-250 stain (cat no B0149-100G; Sigma-Aldrich Co., St Louis, MO, USA). Gel pictures were scanned using the HP scanner.
Sequence coverage analysis
This study demonstrates a systematic approach for obtaining extensive sequence information over the whole length of a protein using tandem mass spectrometry. Diafiltered protein sample (50 µg) of SB-02 and reference products were denatured with 8 M urea, followed by disulfide bond reduction with 10 mM DTT and alkylation with 40 mM iodoacetamide (IAM). The protein samples were then digested with trypsin (enzyme:protein=1:20, w/w) (cat no T6567; Sigma-Aldrich Co.) and further deglycosylated with enzyme PNGase-F (P0705L; New England Biolabs, Ipswich, MA, USA) in ammonium bicarbonate buffer. The samples were analyzed by mass spectrometer (TripleTOF 5600+; AB SCIEX, Framingham, MA, USA), and the acquired data were processed using the ProteinPilot (AB SCIEX) to get sequence coverage.
Intact mass analysis
The intact mass of SB-02 and reference products was determined by TripleTOF mass spectrometer (TripleTOF 5600+). Intact protein sample (10 µg) was separated based on size by size exclusion chromatography (SEC) column and was further injected in Time-of-flight mass spectrometry (TOF-MS), and the resulting data were analyzed. The acquired spectra were deconvoluted using the bio-tool kit of Analyst TF 1.7 software (AB SCIEX). The masses of isoforms observed in the deconvoluted spectrum of SB-02 were compared with those of reference product.
Subunit mass analysis
The subunit mass analysis of SB-02 and reference products was performed with 40 µg of diafiltered samples. Samples were incubated with 40 mM DTT at 80°C for 15 minutes. The reduced samples were separated by reversed-phase chromatography in Ultra Performance Liquid Chromatography (UPLC) system (Waters, Milford, MA, USA) and injected into mass spectrometer. The acquired spectra of light and heavy chains were deconvoluted using the bio-tool kit (Analyst TF 1.7 software), and observed masses of heavy and light chains of SB-02 and reference products were compared.
Subunit deglycosylated heavy chain mass analysis
SB-02 and reference products were incubated with 50 mM DTT at 55°C for 10 minutes followed by treatment with PNGase enzyme (P0705L) to remove N-linked oligosaccharides. The samples were then separated by reversed-phase chromatography in UPLC system, and detection was carried out using the time-of-flight mass spectrometer (TripleTOF 5600+). The acquired spectrum was deconvoluted, and the observed mass of SB-02 heavy chains was compared with that of reference product.
Peptide mass fingerprinting
The samples were denatured with 8 M urea and incubated with IAM. Trypsin (cat no T6567) was used to generate peptides, and the samples were further incubated with enzyme PNGase-F (P0705L). The peptide mixture was analyzed by liquid chromatography-electronspray ionisation mass spectrometry (LC-ESI-MS) (TripleTOF 5600+).
Peptide fingerprinting
The primary structure of the SB-02 and reference products was compared using the peptide fingerprinting method. The SB-02 and reference products were denatured, reduced, alkylated, and digested separately with endopeptidase trypsin (cat no T6567) and Lys-C (cat no P3428; Sigma-Aldrich Co.) for 20 hours, and the peptide mixtures were separated on reversed-phase liquid chromatography using the ACQUITY UPLC.
UV/Vis spectroscopy
The conformational integrity of SB-02 and reference products was determined using the UV/Vis spectroscopy (SpectraMax M3; Molecular Devices LLC, Sunnyvale, CA, USA). The samples at the concentration of 0.1 mg/mL were subjected to a spectral scan from 200 to 800 nm.
Circular dichroism (CD) spectroscopy
CD experiments were performed on spectropolarimeter (J-815; Jasco, Easton, MD, USA). Samples (0.1 mg/mL) were analyzed using quartz cell with the path length of 0.1 cm at a scanning speed of 50 nm/minute at 20°C. Near-UV CD spectra were recorded from 240 to 350 nm, and data pitch and bandwidth were 1 nm. Far-UV CD spectra were recorded from 190 to 240 nm, and data pitch and bandwidth were 1 nm. Each sample was scanned thrice followed by base line correction.
Fluorescence (FLR) spectroscopy
The conformational state of the SB-02 and reference products was compared using the FLR spectroscopy. SB-02 and reference products (0.1 mg/mL concentration) were excited at 280 nm, and the emission spectra were scanned from 300 to 800 nm. The samples were analyzed on the multi-mode microplate reader (SpectraMax M3) using quartz cuvette with the path length of 1 cm at room temperature. The intrinsic FLR spectroscopic profiles of SB-02 and reference products were recorded and compared.
Fourier transform infra-red (FTIR) spectroscopy
The structural dynamics of SB-02 and rituximab reference products were determined by FTIR spectroscopy. SB-02 and reference products (1 mg) were subjected to IR using the KBr reference method. Spectral scan was performed at 4,000–400/cm (Spectrum One; PerkinElmer Inc., Waltham, MA, USA).
Disulfide bridge analysis
Diafiltered protein (50 µg) of SB-02 and reference products was digested with trypsin followed by incubation with chymotrypsin in nonreducing condition. The disulfide-linked peptides were analyzed by LC–ESI-MS (TripleTOF 5600+).
Nucleic magnetic resonance (NMR)
Higher-order structure was analyzed by 1D proton NMR. The SB-02 and reference products at a concentration of 10 mg/mL were analyzed using the Bruker Advance III 500 MHz NMR system, and spectra were recorded.
Free thiol group estimation
The free thiol groups present in the SB-02 and reference products were determined by Ellman’s assay. The working standard solution of glutathione (MAK151C; Sigma-Aldrich Co.) from 10 to 0.014 µM was prepared in assay buffer (MAK151B; Sigma-Aldrich Co.). Then, 50 µL (100 µg) of test solution and standard solution were mixed with 50 µL of Ellman’s solution (MAK151A; Sigma-Aldrich Co.) in each well of 96-well plate. Plate was incubated at 25±2°C for 60 minutes. Postincubation, FLR emission and excitation were determined at 490 and 535 nm, respectively.
Differential scanning calorimetry (DSC)
The thermodynamic stabilities of SB-02 and reference products were compared by using DSC (Microcal VP-DSC microcalorimeter). The samples were diluted to 1 mg/mL with reference formulation buffer and scanned from 20 to 100°C at a rate of 60°C/h.
Capillary isoelectro focusing (cIEF)
The SB-02 and reference products were diluted to 5.0 mg/mL in water, and 10 µL of each sample was mixed with 200 µL of 3 M urea cIEF gel mix, 12 µL of pharmalyte (pH 3–10), 20 µL of cathodic stabilizer, 2 µL of anodic stabilizer, and 2 µL of each pI standard (pI=10, 5.5, and 4.1). The charge variants were focused by ampholytic pH gradient through an applied electric field using the capillary electrophoresis system (PA 800 Plus; Beckman Coulter, Inc., Brea, CA, USA). Chemical mobilization was applied to mobilize the pH gradient across the detection window, and separated isoforms were detected at 280 nm.
Charge variant analysis by cationic exchange chromatography
The SB-02 and reference products were diluted to 1 mg/mL concentration and were separated on the Pro-Pac™ WCX-10 column (cat no 054993; Thermo Fisher Scientific, Waltham, MA, USA).
Capillary zone electrophoresis (CZE)
The SB-02 and reference products were diluted to 5 mg/mL and separated in 50 µm×50.0 cm dynamically coated bare fused-silica capillary (effective length: 40.2 cm; AB SCIEX). The wavelength for the detector was set at 214 nm.
N-Glycan mapping by LC–ESI-MS
SB-02 and reference product samples were diafiltered with water to remove the buffer and concentrated by centrifugation. A total of 400 µg of protein was treated with PNGase-F enzyme at 37°C for 20 hours to release N-glycans. Deglycosylated protein was precipitated by adding precooled ethanol, and supernatant containing glycan moieties was collected by centrifugation. Extracted glycans were labeled with a fluorescent 2-anthranillic acid (2-AA) dye, and excess amounts of dye were removed from the mixture using the GlycoClean “S” cartridges (GKI-4726; Prozyme, Hayward, CA, USA). Purified glycans were injected and separated on the BEH glycan column (P/N: 186004742; Waters) using the UPLC system, which was linked to the ESI-MS system (Triple TOF 5600). LC gradient was optimized to 135 minutes. A spray voltage of 2.3 kV was applied, and the analysis was performed in negative ion mode. The mass of all glycan species was extracted using the extracted ion chromatogram (XIC) manager of the PeakView software (AB SCIEX). Structural confirmation was carried out using the SimGlycan (PREMIER Biosoft, Palo Alto, CA,) database.
Point of glycosylation
The N-glycosylated site in SB-02 and reference products was identified by tandem mass spectrometry (MS/MS). The samples were digested with trypsin, and glycopeptides were analyzed by LC–ESI-MS. The LC–MS/MS system includes C18 column (4.6 mm id×150 mm hour), and reverse phase (RP) gradient was optimized to 135 minutes. A spray voltage of 2.3 kV was applied, and the instrument was operated in the information-dependent acquisition mode. The mass of glycopeptides was extracted using the XIC manager of the PeakView software, and eventually, the data were processed using SimGlycan (PREMIER Biosoft) to confirm the site of glycosylation.
Released N-glycan analysis
SB-02 and reference product samples were diafiltered against water and concentrated by the ultracentrifugation method. A total of 100 µg of protein was treated with PNGase-F enzyme at 37°C for 20 hours to release N-glycans. Deglycosylated protein was precipitated by adding precooled ethanol, and supernatant containing the glycan moieties was collected by centrifugation. Extracted glycans were labeled with 2-AA dye (GKK-402; Prozyme). The excess amounts of dye were removed from the mixture by using the GlycoClean “S” cartridges (GKI-4726). Purified glycans were injected and separated on the BEH glycan column using the UPLC system (P/N: 186004742).
Impurity profiling using Capillary electrophoresis sodium dodecyl sulfate (CE-SDS)
SB-02 and reference products were analyzed in nonreducing and reducing conditions to determine the low molecular weight (LMW) and nonglycosylated heavy chain impurities, respectively. Antibody samples were diluted to 3.0 mg/mL and mixed with sodium dodecyl sulfate (SDS) sample buffer, and then, samples were heated at 70°C for 10 minutes before injection into a bare fused-silica capillary (effective length: 20.2 cm) at 5 kV for 20 seconds. The PA 800 plus capillary electrophoresis system (PA 800 Plus) separated proteins in an electric field (15.0 kV for 35 minutes), and protein bands were detected at 220 nm.
Oxidized impurity profiling using reversed-phase chromatography
The protein samples were desalted, diluted to 1 mg/mL, and injected on UPLC system with a photo diode array detector, using the EMPOWER software (Waters) for system control and data acquisition. Chromatographic separation was obtained using the XB-C18 column (250 mm×4.6 mm; 3.6 µm; Phenomenex). The mobile phase was composed of 0.1% TFA in water (Solvent A) and 0.1% trifluoroacetic acid (TFA) in acetonitrile (Solvent B) in a gradient elution, with a flow rate of 0.4 mL/min. The gradient elution was programmed as time/percentage of Solvent B – 0/25, 2/50, 20/00, and 30/100, with an equilibrium time of 4 minutes. The injection volume was 10 µL, and the eluents were monitored at 280 nm.
Oligomer content analysis by size exclusion chromatography
SB-02 and reference products injected at a concentration of 1 mg/mL on a HPLC system (Waters), with UV detection at 280 nm. For aggregate determinations, TSKgel G3000SWXL (Tosoh Biosciences, South San Francisco, CA, USA) column was used. Separation was performed at 30°C with a flow rate of 0.5 mL/min using 20 mM phosphate buffer (pH 6.8) as the eluent.
Oligomer content analysis using Size Exclusion Chromatography with Multi-Angle Light Scattering analysis (SEC–MALLS)
The samples (at a concentration of 1 mg/mL) were separated using the isocratic flow of phosphate buffer on a TSK G3000 SWXL column connected to HPLC system. Aggregates were detected using the SEC–MALS–RI multiangle light scattering (MALS) detector (Wyatt Technology Santa Barbara, CA, USA).
Glycation analysis
The samples were analyzed on UHPLC (Dionex Ultimate 3000; Thermo Fisher Scientific) using TSKgel Boronate-5PW, 7.5 mm id×7.5 cm L column, bonded with m-aminophenyl boronate ligand system at a flow rate of 1.0 mL/min using 100 mM HEPES, 200 mM NaCl, and 25 mM Tris buffer, pH 8.6, as binding buffer and 500 mM sorbitol for elution.
Receptor-binding kinetics by surface plasmon resonance (SPR)
The binding affinity of SB-02 and reference products to recombinant human Fc (FcγRI, FcγRIIa, FcγRIIb, FcγRIIIa [V176V], FcγRIIIa [V176F], FcγRIIIb), C1q, and CD20 receptors were determined by SPR (Biacore T100). The receptors were immobilized covalently on respective carboxymethyl dextran-coated CM5 sensor chips (p/n-BR-1000-12; GE Healthcare Bio-Sciences Corp., Piscataway, NJ, USA) using the standard amine coupling chemistry. The equilibrium dissociation rate (KD) constant was determined by injecting different concentrations of SB-02 and reference product solutions at a flow rate of 30 µL/min onto immobilized VEGF receptor at 25°C.
CD20-binding assay by FLR-activated cell sorting (FACS)
WIL2-S (ATCC) cells (1×10⁶) were mixed with different concentrations of reference and SB-02 products, and then, cells were incubated at 37 °C for 2 hours. Postincubation, cells were pelleted and washed with phosphate buffer saline, and the pellets were suspended in medium containing 100 ng/mL of the FITC-labeled anti-human IgG. After incubation, cells were washed and analyzed using the flow cytometry (FACSAria™ III; BD Biosciences, San Jose, CA, USA).
Complement-dependent cytotoxicity (CDC) assay
Daudi cells (ATCC) expressing the CD20 were plated at a density of 1×10⁵ cells/well in a 96-well plate. A dilution of reference product and SB-02 were prepared, added to the plate, and allowed to bind to the target cells at 37°C for 30 minutes. Human serum (10%) was added to cells and incubated at 37°C for 2 hours. Postincubation, presto blue cell viability reagent (cat no A13261; Thermo Fisher Scientific) was added and incubated at 37°C for 60 minutes. The response observed for test sample was compared to the response of the reference standard using the parallel line assay, and the potency of the samples was determined.
Antibody-dependent cell-mediated cytotoxicity (ADCC)
WIL-2 cells (ATCC) expressing the CD20 receptor was plated at a density of 2.5×10⁴ cells/well in 96-well plate. Dilutions of reference product and SB-02 were prepared, added to the plate, and allowed to bind to the target cells at 37°C for 90 minutes. A total of 2.5×10⁴ NK-92MI cells were added in each well of 96-well plate and incubated at 37°C for 24 hours. Postincubation, freshly prepared 25 µL of CytoTox-Glo™ Cytotoxicity Assay Kit substrate (p/n G9291; Promega Corporation, Fitchburg, WI, USA) was added and incubated at room temperature for 10 minutes. Sigmoidal plot using the 4PL parameter of mean relative light units (RLU) of each dose on the Y-axis vs the corresponding concentration of the standards on the X-axis was generated, and the potency of samples was estimated taking standard potency to be 100%.
Results
SB-02 is produced by widely used genetically modified CHO cell line. A production clone giving genetic stability, productivity, and highest QA profile was selected after extensive analysis. Subsequently, upstream and downstream processes were optimized to develop state-of-the-art manufacturing process to obtain QA profile of SB-02 as close as possible to reference product.
Comparability of physicochemical and biological attributes is primary requirement to establish a product as a biosimilar of reference product. A wide array of analytical tools was used to demonstrate SB-02 analytical biosimilarity to reference product. To assess similarity between two molecules, we divided attributes based on the risk to clinical outcome and used statistical approach suggested by USFDA. As per USFDA recommendations, we used equivalence test for Tier I tests, quality range for Tier II tests, and side-by-side graphical comparison for Tier III tests for comparability analysis. Binding of SB-02 and reference products with CD20 receptor is considered as high-risk critical attribute and may affect clinical outcome so CD20 receptor binding was analyzed by equivalence test for similarity assessment. Change in glycan content, oligomer content, and charge variants were analyzed by the Tier II approach by calculating quality range. Analysis done with methods such as near and far UV CD, FTIR, intact and reduced mass, peptide map, and DSC was compared by Tier III approach by graphical similarity.
Protein identity
SDS-PAGE was performed to compare the electrophoretic mobility of SB-02 with reference product. On SDS-PAGE under reducing condition (Figure S1A), SB-02 and reference showed two bands at the size of ~49 and 23 kDa, which correspond to the size of heavy chain and light chain, respectively. Both products showed similar mobility on SDS-PAGE run under nonreducing condition (Figure S1B). Tandem mass spectrometry confirmed the presence of identical amino acid sequence for both products (Figures S2 and S3).
Primary structure
Intact and subunit mass were analyzed to demonstrate similarity in primary structure. Similar glycoforms in the mass range of 147,000–147,700 Da were observed in SB-02 and reference products in intact mass analysis (Figure S4). Spectra of subunit mass confirmed the presence of N-linked glycoforms in heavy chain of both products (Figure S5). Molecular mass 23,035.82 Da was observed for light chain (Figure S6) of SB-02 and reference products, which matches with the theoretical mass. Spectra of deglycosylated heavy chain (Figure S7) for both products showed the presence of major molecular mass of 49,069.11 Da, which confirms with theoretical mass of deglycosyled heavy chain of the protein.
Peptides generated after trypsin digestion of SB-02 and reference products were separated by reversed-phase liquid chromatography and further analyzed for peptide content in mass spectrometry. Peptide mass fingerprinting analysis showed the presence of peptides with identical masses in both products (Figure S8). Mass values obtained in the peptide map were comparable between theoretical mass calculated from amino acid sequence of each peptide and experimental mass. After trypsin digestion, peptide map profile was also analyzed by reverse phase-ultra performance liquid chromatography (RP-UPLC) (Figure S9). Both products showed identical chromatograms. Similarly, peptide map was studied after Lys-C digestion of the products (Figure S10). The observed profiles of SB-02 and reference products were found to be similar. This result supports the identical amino acid sequence of the products as determined in the peptide mapping analysis.
Higher-order structure
Secondary structure and higher-order structure were studied using multiple spectroscopic techniques, including far UV and near UV CD, UV/Vis spectroscopy, FTIR spectroscopy, and intrinsic FLR.
UV/Vis spectrum in the range of 200–800 nm obtained for SB-02 showed matching profile with reference product (Figure S11). Changes in secondary and tertiary structure were studied by far UV and near UV CD. Far UV CD spectrum for SB-02 showed characteristic minima at 218 nm (Figure S12), which is a signature pattern for the presence of β-sheet in structure. Far UV CD spectra of SB-02 and reference products did not show any difference in terms of maxima and minima wavelengths in spectra signal. Changes in the tertiary structure of SB-02, with respect to aromatic amino acid side chains and disulfide bonds, were analyzed by near UV CD spectroscopy. SB-02 and reference products showed overlapping near UV CD spectra (Figure S13). SB-02 and reference products also showed similar intrinsic FLR (Figure S14) profile confirming similarity in conformation. For further confirmation of secondary structure, IR vibrations of backbone amide groups were studied using the FTIR spectroscopy. Both the molecules showed overlapping spectra showing similar vibrations of amide I and amide II bands (1,500–1,700 cm–1) confirming the similarity in secondary structure (Figure S15). Thus, spectroscopic analysis of SB-02 and reference products established conformational similarity between molecules.
Higher-order structure was further explored by orthogonal techniques such as disulfide bridge and free thiol analysis. Presence of disulfide bond positions in SB-02 was analyzed in the peptide map (under reduced and nonreduced conditions) analysis by LC–MS. XIC revealed eight distinguished peaks (Figure S16) containing peptides having disulfide linkage, which confirms the presence of 16 disulfide linkages (four interchain and 12 intrachain disulfide bonds). Estimation of free thiol groups was performed using the Ellman’s assay, and Tier II approach (mean ±2 SD) was used for the calculation of range for free thiol groups. Free thiols groups in SB-02 were found within statistical range (mean±2 SD of reference product) established for moles of –SH per moles of protein, which was calculated from the data of reference product (Figure S17). Temperature-induced changes in the conformation of SB-02 were further analyzed by measuring thermal unfolding with DSC. The thermal transition temperature (Tm), an indicator of thermal stability, was analyzed, and three transition temperatures (Tm) values 71, 75, and 83°C linked to the unfolding of CH2, Fab, and CH3 domains were examined. DSC thermograms showed superimposable profile (not shown) with three transitions with similar Tm values for SB-02 and reference products (Table 1).
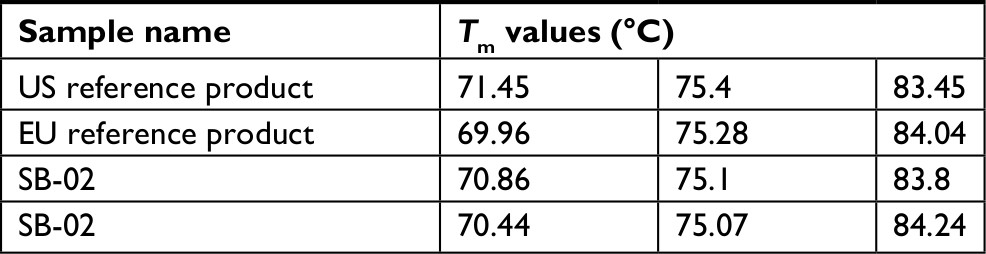 | Table 1 Comparison of the thermal transition temperatures (Tm) values of SB-02, US reference, and EU reference products |
Additionally, 1D 1H NMR spectroscopy was performed to further explore three-dimensional structure of SB-02. Both products showed superimposed NMR spectrum in amide (Figure 1A) and aliphatic (Figure 1B) regions.
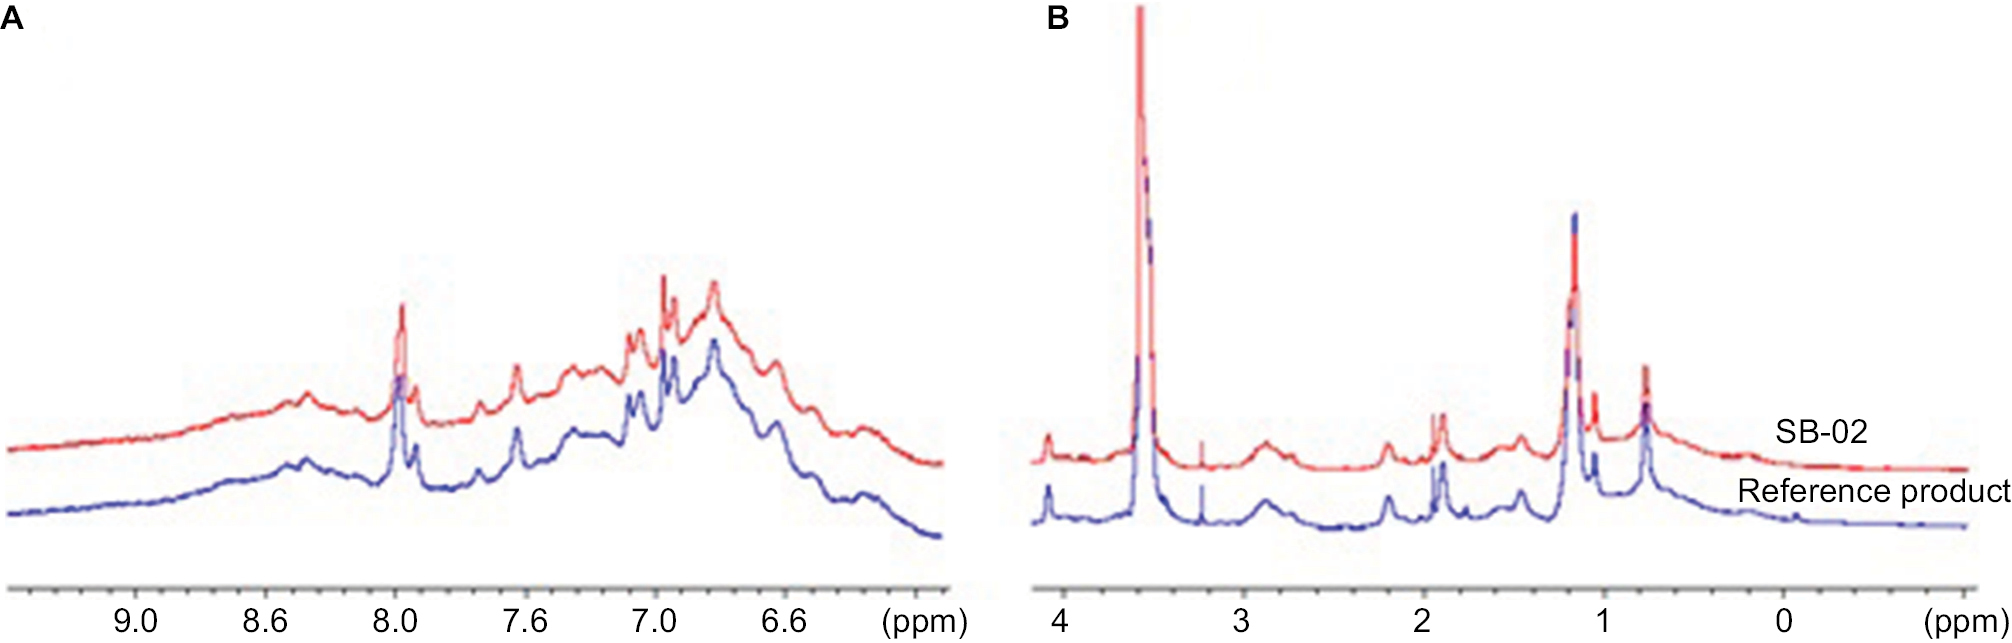 | Figure 1 Representative 1D 1H NMR spectra of reference product and SB-02. Notes: (A) Zoom comparative NMR spectra representing amide region. (B) Zoom comparative NMR spectra representing aliphatic region. Abbreviation: 1H NMR, hydrogen nucleic magnetic resonance. |
Charge heterogeneity
Variations in charged species significantly affect in vivo and in vitro activities of the molecule. To analyze charge variants present in SB-02, we used highly sensitive and high-resolution methods such as cation exchange chromatography (CEX) and cIEF. cIEF profile of SB-02 and reference products (Figure S18) displayed similar profile showing four different isoforms each having pI value similar to reference products, as shown in Table 2. CZE and CEX, as orthogonal methods, were done for further characterization of charge heterogeneity. Cationic exchange chromatography showed similar charge isoform profile in SB-02 and reference products, as shown in Figure S19. CZE analysis of SB-02 (Figure S20) displayed similar electropherogram to reference product.
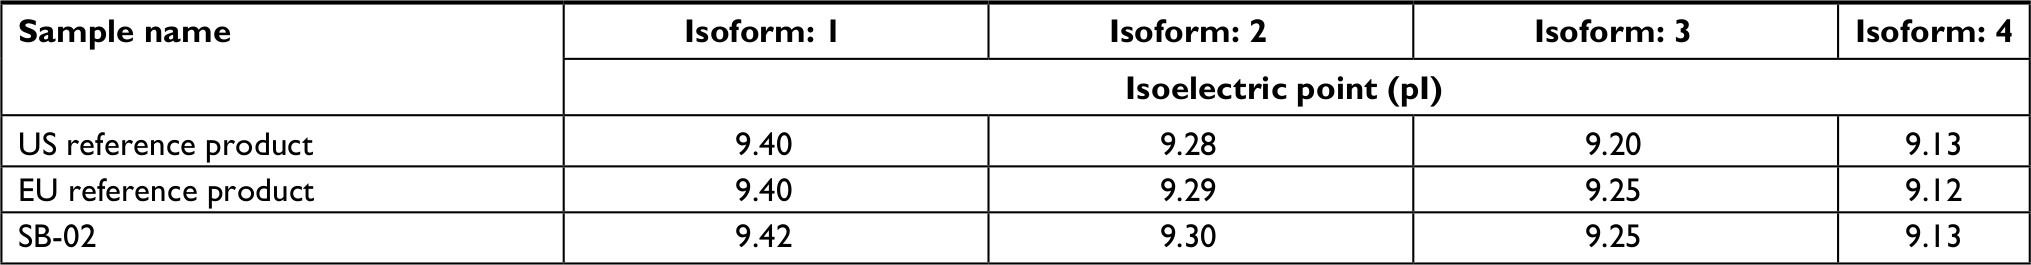 | Table 2 Comparison of pI values of SB-02, US reference, and EU reference products |
Glycosylation
The site of glycosylation in SB-02 was identified by tryptic–chymotryptic digestion followed by the MS/MS analysis. The peptide map data confirmed glycosylation site at asparagine position 301 in heavy chains of SB-02 and reference products (data not shown).
The N-glycans were released by treatment with PNGase-F and characterized using UPLC with FLR detector. The profile observed for SB-02 was found similar to that of reference product (data not shown). The individual peak profile was integrated, and total percentage of fucosylation was calculated as the sum of all glycan structures having core fucose. The total percentage of galactosylated glycans was calculated as the sum of all glycan species having galactose, and the percentage of sialylation was calculated as the sum of all glycan structures having at least one terminal sialic acid. Ranges for different glycan species were established by Tier II approach as recommended earlier by USFDA for the assessment of similarity. Fucosylated species in SB-02 were found to be 93.5%–94.5% (Figure 2A) that is within range of percentage of fucosylation content (mean±2 SD of reference product). Galactosylated glycans found in SB-02 were within range except one batch, which showed slight reduction in the percentage of galactosylated species (Figure 2B). Sialylated species in SB-02 were in the range of 3.3%–3.85%, which is within the range of percentage of sialylated species found in reference product (Figure 2C). Subsequently, released glycans were characterized by LC–ESI-MS to understand the structure of the glycan species present in SB-02 and reference products.
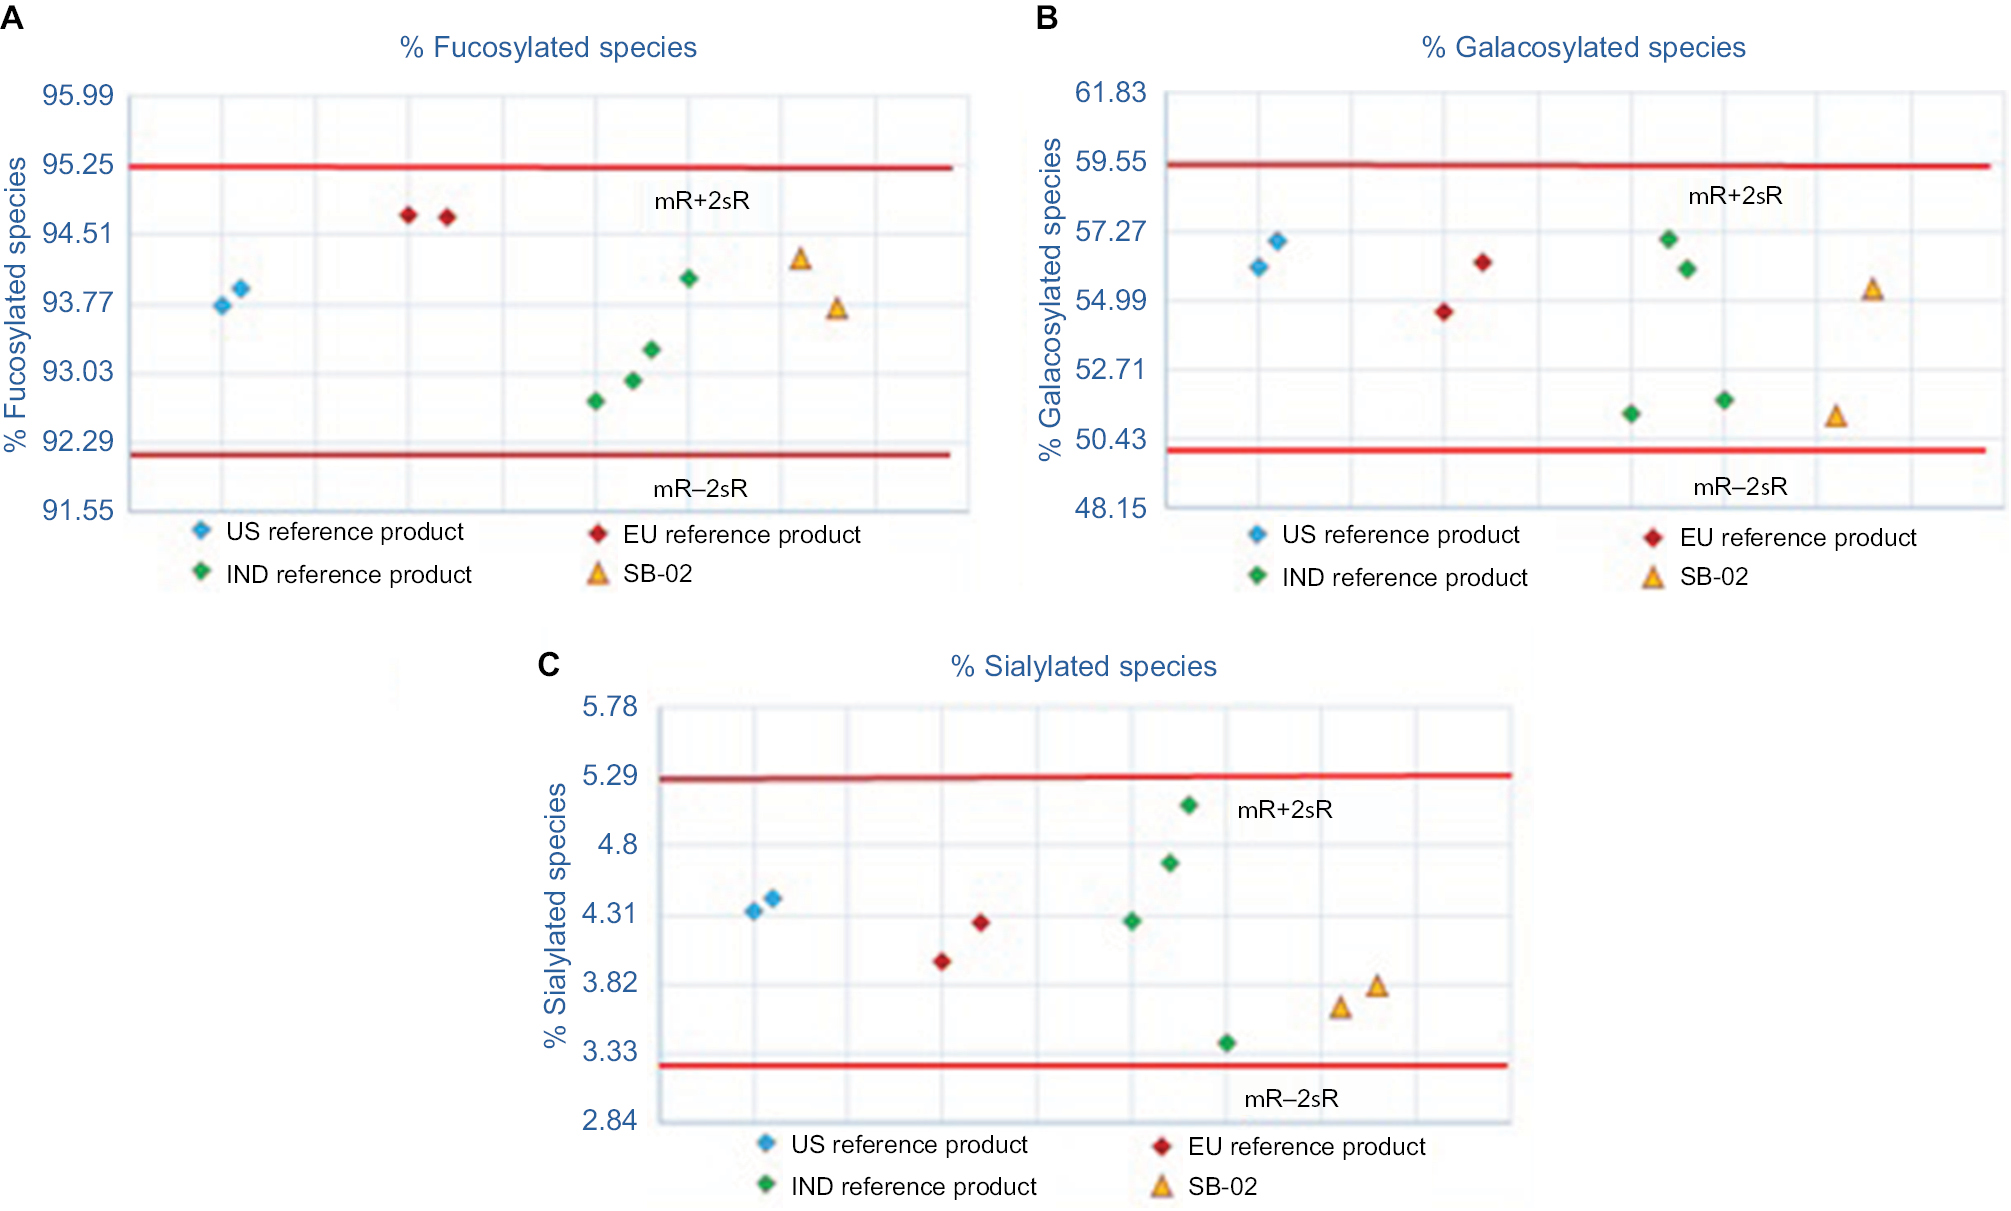 | Figure 2 Comparison of glycan profiles for SB-02, US reference, and EU reference products: (A) fucosylated species, (B) galactosylated species, and (C) sialylated species. Abbreviation: IND, India. |
Product-related impurities
Here, we analyzed product-related impurities such as oligomer content, low molecular impurities, oxidized impurities, nonglycosylated heavy chain, and glycated species using multiple analytical techniques. High molecular weight (HMW) species including oligomers were studied for SB-02 and reference products by SEC–HPLC (data not shown) and SEC–MALS (Figure S24). Both products showed minor difference in the quantitation of HMW, and HMW content was found to be less than 2% in both the cases. Similar profile obtained in multi-angle light scattering-refractive index (MALS–RI) for SB-02 and reference products indicates comparable size of monomer and oligomer for both products. LMW and nonglycosylated heavy chain impurities were separated and measured by CE-SDS in nonreducing and reducing conditions, respectively. The results showed slightly lower percentage of LMW impurities in SB-02 (Figure S21) when compared with reference product. Content of oxidized species (Figure S23) in SB-02 and reference products was found nearly 1%, which was comparable to the reference product. Level of nonglycosylated heavy chain impurities was observed less than 0.5% in SB-02 and was comparable to the reference product (Figure S22).
Amount of glycated species present in SB-02 and reference products was measured using the boronate affinity chromatography. SB-02 showed relatively lower amount of glycation (less than 4%), whereas glycation in different lots of reference product was found in the range of 6%–8% (Figure S25).
Biological characterization
Binding of SB-02 with receptors significantly contributes to the activity of the molecule. We studied the biological activity of SB-02 by different functional assays. SPR was used to assess the functional comparability of SB-02 and reference products in terms of binding with different receptors, and results obtained were statistically compared. Relative affinity of all Fc receptors (FcγRI, FcγRIIa, FcγRIIb, FcγRIIIa [176V], FcγRIIIa [176F], and FcγRIIIb) to SB-02 and reference products were found similar and within range established by Tier II approach (mean±2 SD values of reference product). The binding affinity of both products with CD20 and C1q (Table S1) receptors was also studied. The binding affinity of SB-02 was found within the equivalent range of reference product, as shown in Figure 3.
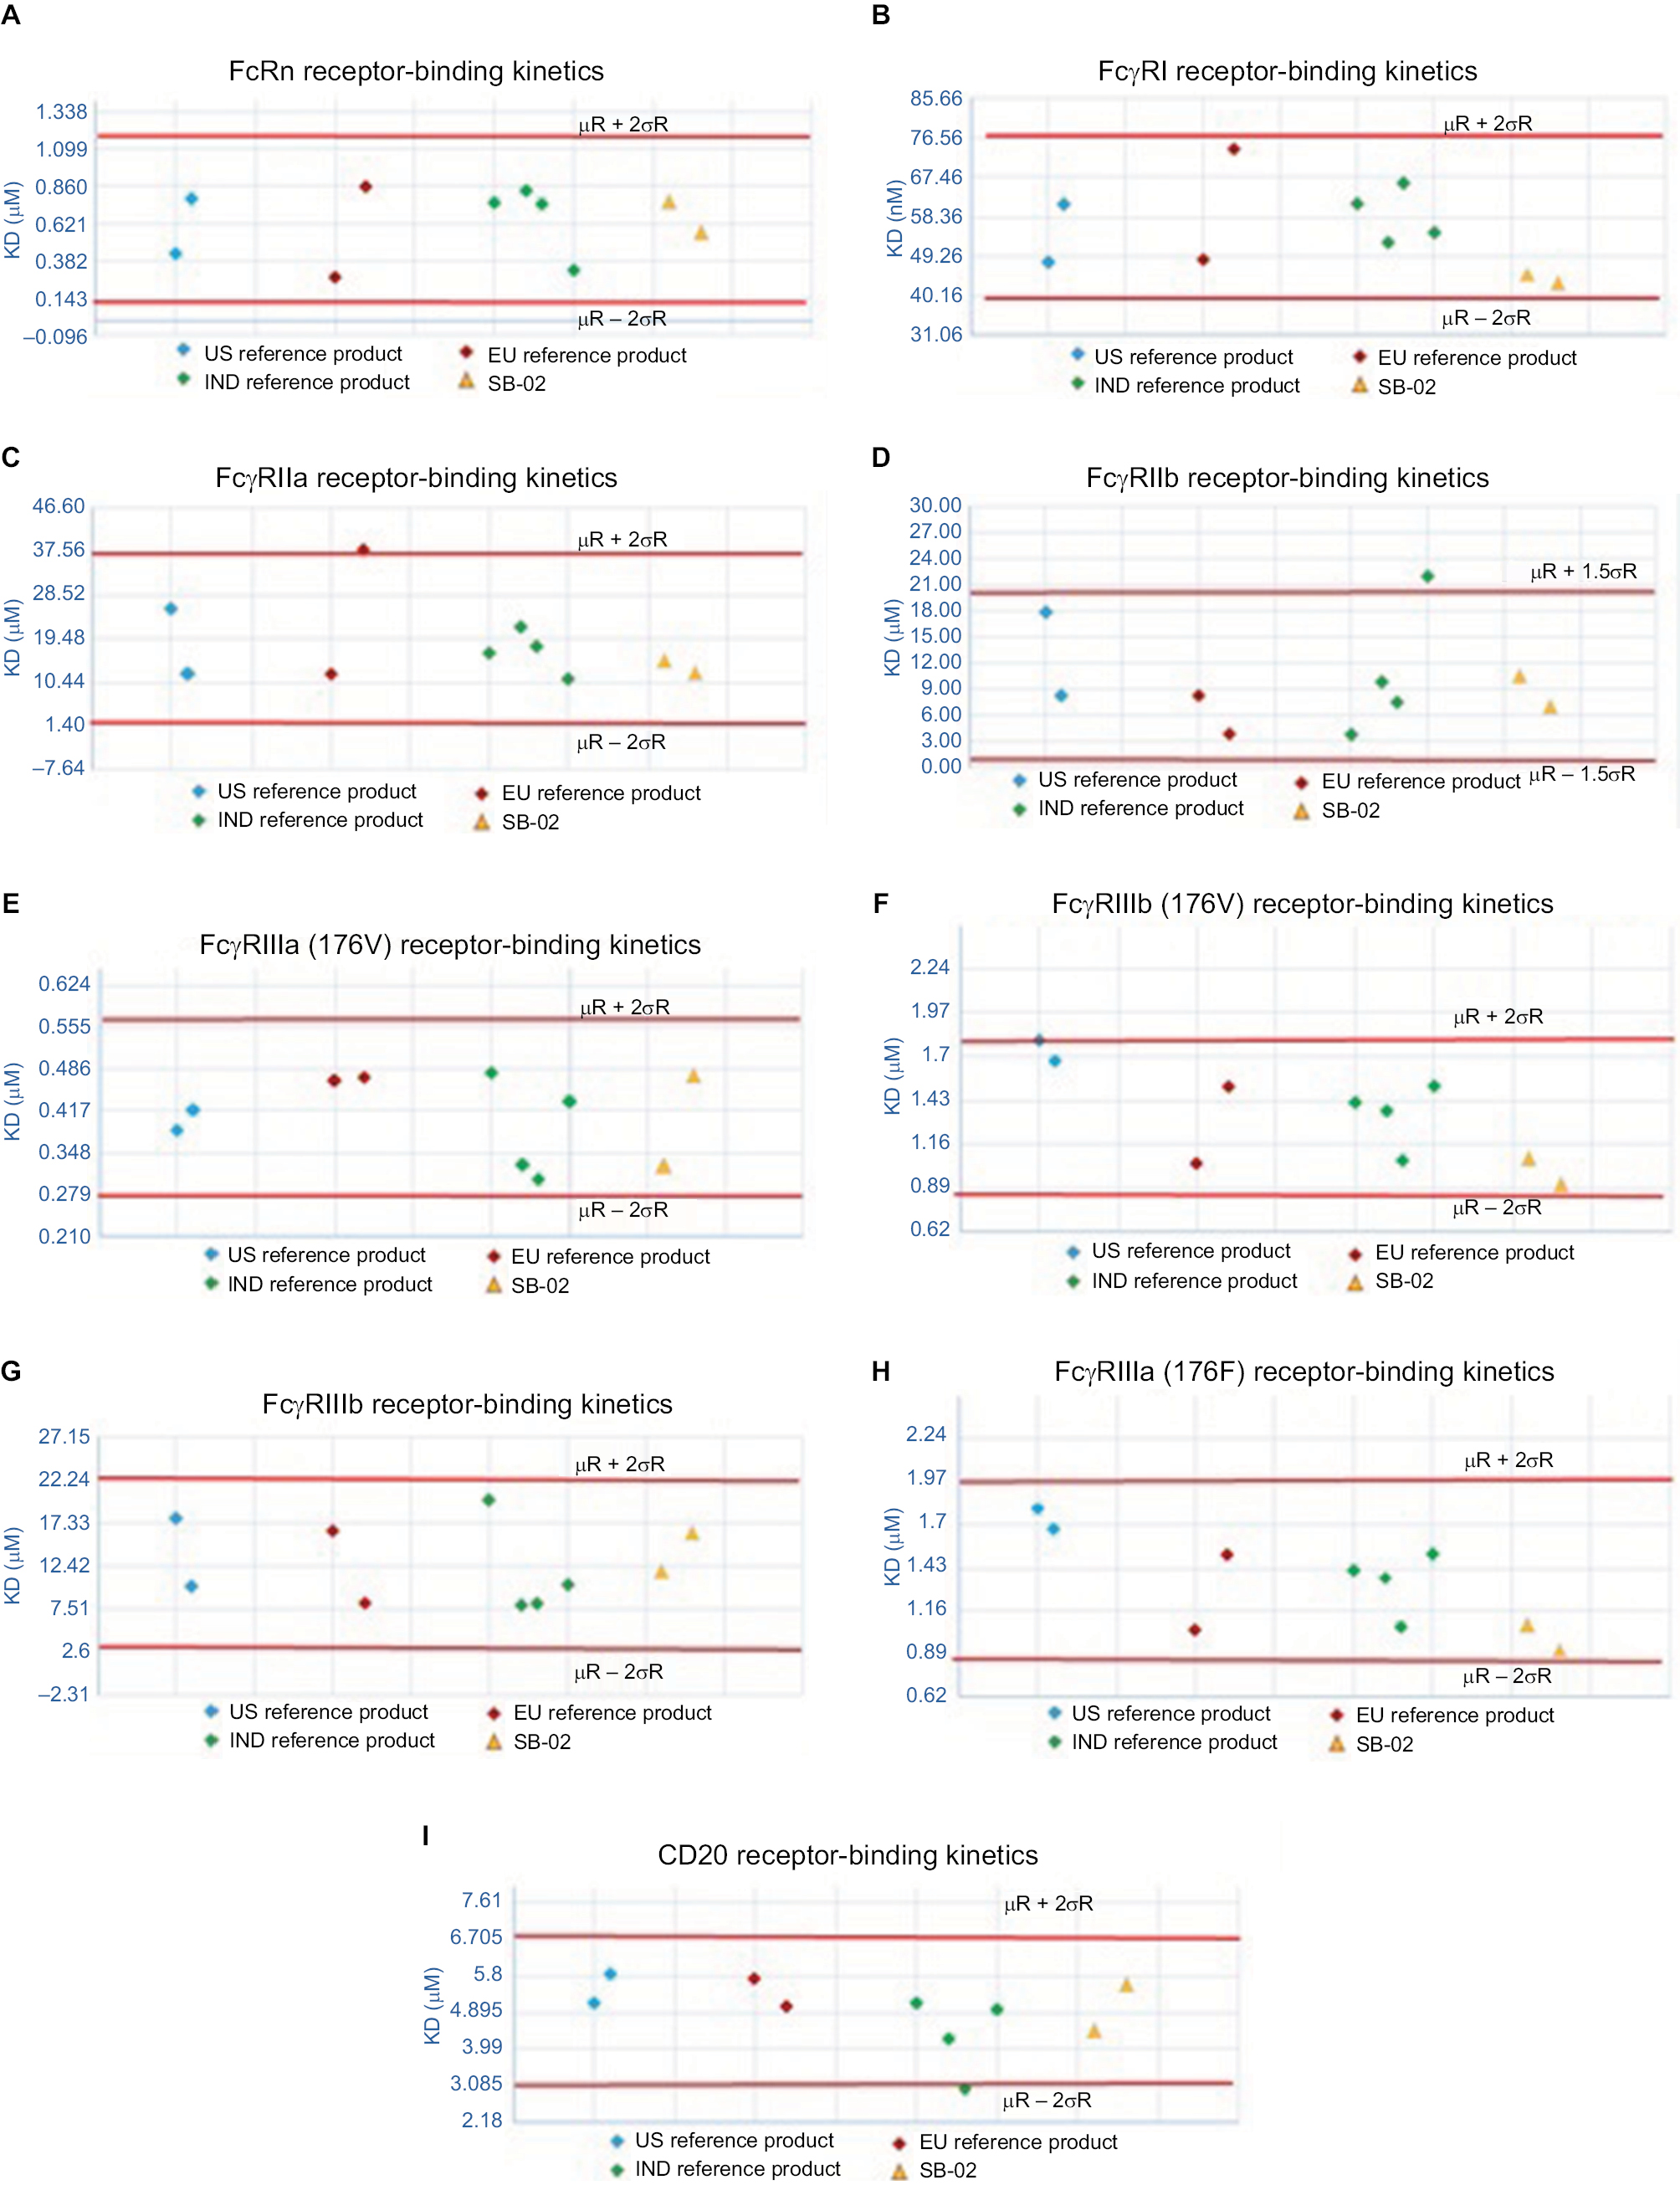 | Figure 3 Comparison of binding affinity of SB-02, US reference, and EU reference products with the Fcγ, and CD20 receptors. (A) FcRn receptor-binding kinetics, (B) FcRI receptor-binding kinetics, (C) FcRIIa receptor-binding kinetics, (D) FcRIIb receptor-binding kinetics, (E) FcRIIIa (176V) receptor-binding kinetics, (F) FcRIIIb (176V) receptor-binding kinetics, (G) FcRIIIb receptor-binding kinetics, (H) FcRIIIa (176F) receptor-binding kinetics, (I) CD20 receptor-binding kinetics. Abbreviation: IND, India. |
A cell-based antiproliferation bioassay was performed to evaluate the ADCC (Figure 5) and CDC (Figure 4) activities of SB-02 and reference products. To demonstrate similarity, we applied Tier II approach for the calculation of potency range for ADCC and CDC activities of SB-02 with respect to reference product. SB-02 and reference products showed almost similar activity in ADCC and CDC assays, and relative potency of SB-02 was observed within range. Thus, results with both the assays demonstrate that both products have the similar potency. Additionally, binding of SB-02 with CD20 receptors present on WILL-2S cells was analyzed by FACS and SB-02 showed binding response similar to reference product at all the concentrations used (Figure S26).
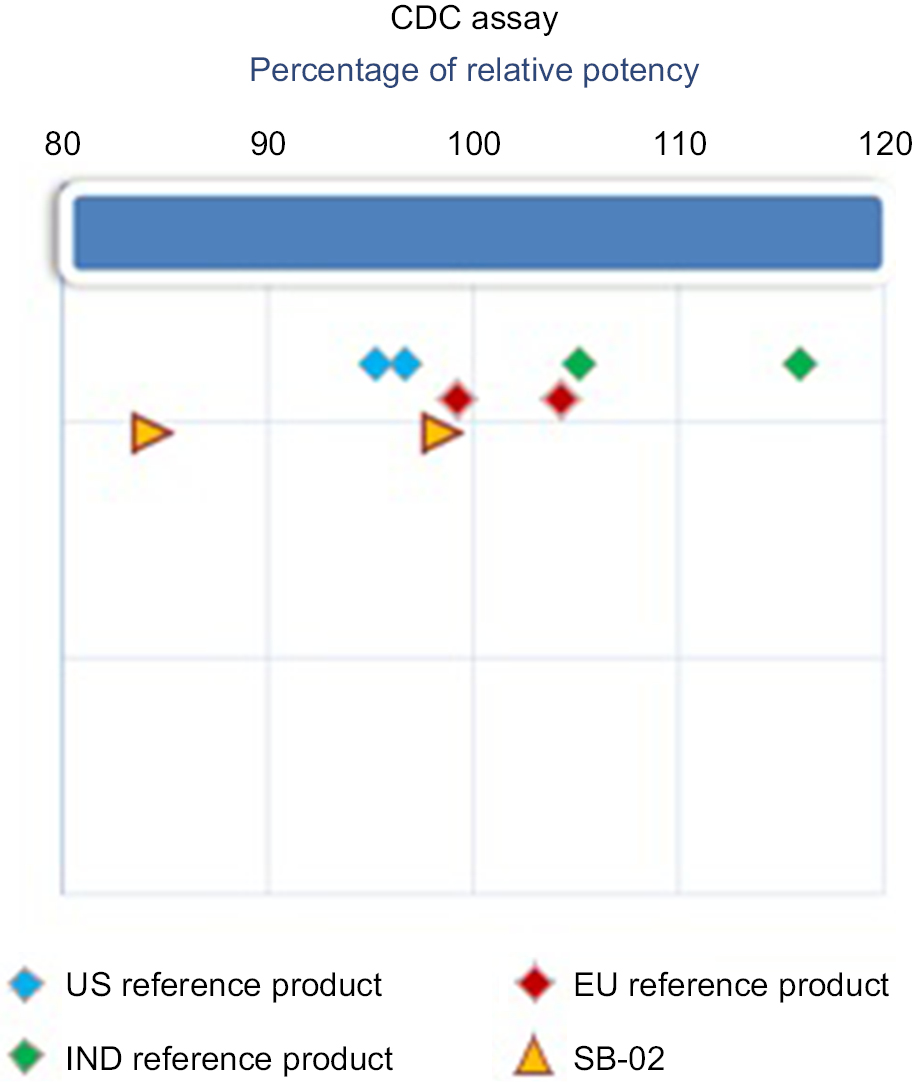 | Figure 4 Comparison of CDC activity of SB-02, US reference, and EU reference products. Abbreviation: CDC, complement-dependent cytotoxicity; IND, India. |
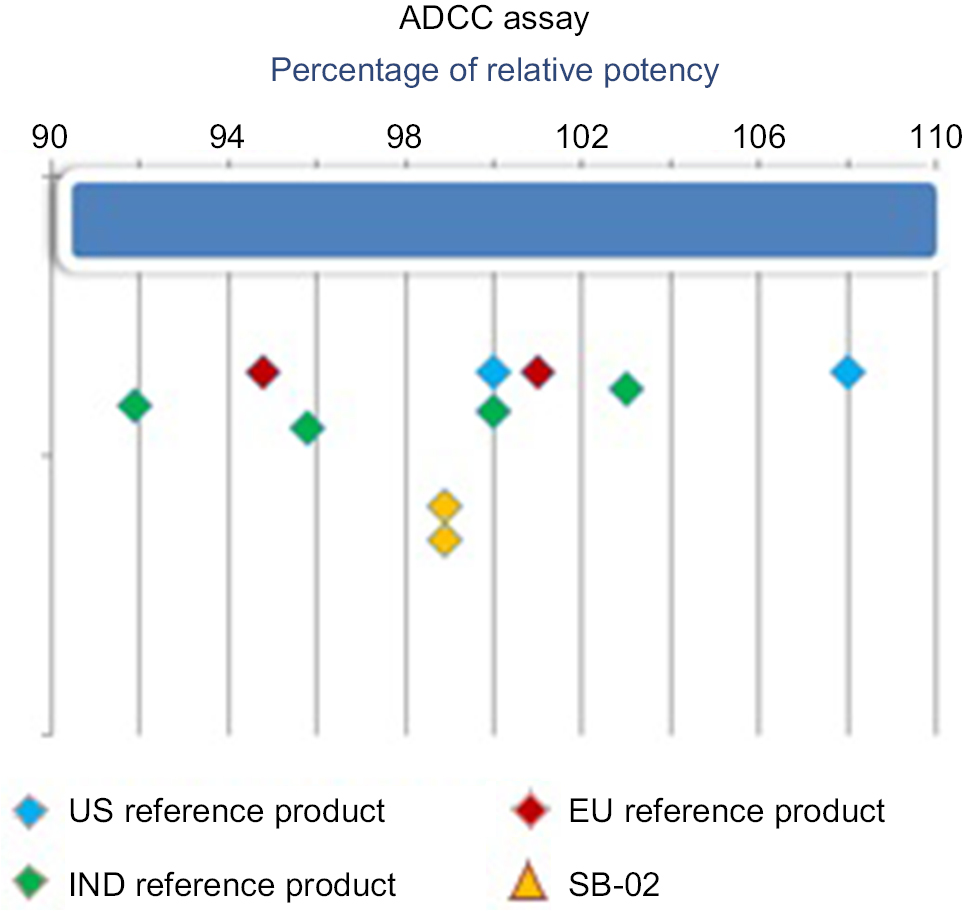 | Figure 5 Comparison of ADCC activity of SB-02, US reference, and EU reference products. Abbreviation: ADCC, antibody-dependent cell-mediated cytotoxicity; IND, India. |
Discussion
Since 2006 (EMA) and 2015 (USFDA) have published several guidelines on the development of biosimilar products wherein the analytical similarity has been given a paramount importance to establish biosimilarity. As suggested by various regulatory agencies, the stepwise approach includes physicochemical characteristics and biological activities followed by pharmacokinetic and pharmacodynamics with immunogenicity assessments.
Here, we analyzed in-house developed anti-CD20 antibody (SB-02) with reference product in terms of its amino acid composition, posttranslational modifications, higher-order structure, purity, and biological activity. It is imperative that there should not be any difference in the amino acid sequence as per the regulatory guidelines while demonstrating that the product is biosimilar. Amino acid sequence coverage analysis demonstrated that SB-02 and reference products have identical amino acid sequence confirming the similarity in primary structure. Using the array of physicochemical analysis methods, more specifically analysis of intact mass, subunit mass, peptide mass fingerprinting, and various spectroscopic methods including UV/Vis, FTIR, CD, and FLR, SB-02 was analyzed for changes in secondary and higher-order structures. We observed β-sheet-specific characteristic minima at 218 nm in far UV CD with overlapping spectra between SB-02 and reference products, which confirm similarity in secondary structure. Near UV CD profile of aromatic amino acids revealed similarity in higher-order structure between SB-02 and reference products.
The absorption of infrared radiation excites vibrational transitions of molecules. The strength of absorption increases with increasing polarity of the vibrating bonds. All polar bonds contribute to the infrared absorption. The infrared spectrum is plotted against the inverse of the wavelength, which is proportional to the transition energy (Figure S15). The results of SB-02 are in agreement with the reference product. Intrinsic FLR spectroscopy also showed similarity in tertiary structure of the SB-02 and reference products. The higher-order structure is also profiled for 1D NMR. Amide and aliphatic regions of the 1D NMR spectra were found to be congruent for the SB-02 and reference products showing that there is similarity in the three-dimensional structures. Based on these results, we conclude that the higher-order structure of SB-02 and reference products is similar. Because of the heterogeneity and complexity of monoclonal antibodies, manufacturing process or degradation (oxidation, deamidation, isomerization, and so on) may cause variations in the charge distribution of monoclonal antibodies. Variation in charge heterogeneity may show difference in pharmacokinetic and pharmacodynamic profiles of molecule. We analyzed charge variants in SB-02 and reference products by CEX. The average main peak, acidic peak, and basic peak were found to be 85.44%, 8.29%, and 6.28% for SB-02 and 85.76%, 9.10%, and 5.14% for the reference product, respectively. There could be differences in biological activities despite similarities in size and structures. We used a panel of bioassays including CD20 affinity, Fc receptor assays, and cell-based assays; the results show comparable affinity toward CD20 and the activity of SB-02 against reference product.
Conclusion
Monoclonal antibodies are large polypeptide molecules consisting of about 1,300 amino acids covalently bound together forming large folded structures having size of nearly 150 KDa. With such a complex molecule, there is inherent variation between the molecules due to post-translation modifications. This variability is a major challenge in developing a biosimilar product. Any structural changes in the reference product and the biosimilar product must be characterized and evaluated for the evaluation of biological function. We measured the key attributes such as sequence analysis, intact mass, posttranslation modifications, and biological activity of the reference product and SB-02 with the help of state-of-the-art analytical techniques. Our results show that the SB-02 has a very highly similar quality profile and the differences are within the acceptable ranges of biosimilarity.
Abbreviations
EMA, European Medical Agency; CDSCO, Central Drug Standard Control Organization; FDA, Food and Drug Administration
Disclosure
Authors of this article are employed at Sun Pharmaceutical Industries Limited, Vadodara, India. The authors report no other conflicts of interest in this work.
References
Harvey RD. Science of Biosimilars. J Oncol Pract. 2017;13(Suppl 9):S17–S23. | ||
Buske C, Ogura M, Kwon HC, Yoon SW. An introduction to biosimilar cancer therapeutics: definitions, rationale for development and regulatory requirements. Future Oncol. 2017;13(15s):5–16. | ||
Kay J. Biosimilars: a regulatory perspective from America. Arthritis Res Ther. 2011;13(3):112. | ||
Beck A, Reichert JM. Approval of the first biosimilar antibodies in Europe: a major landmark for the biopharmaceutical industry. MAbs. 2013;5(5):621–623. | ||
Blair HA. GP2013: a rituximab biosimilar. BioDrugs. 2017;31(5):465–468. | ||
Deeks ED. CT-P10 (Truxima™): a rituximab biosimilar. BioDrugs. 2017;31(3):275–278. | ||
Greenwald M, Tesser J, Sewell KL. Biosimilars have arrived: rituximab. Arthritis. 2018;2018:p. 3762864-6. | ||
Ledford H. ‘Biosimilar’ drugs poised to penetrate market. Nature. 2010;468(7320):18–19. | ||
Sullivan T. FDA Releases Draft Guidance for Industry: Statistical Approaches to Evaluate Analytical Similarity; 2018. Available from: https://www.policymed.com/2017/10/fda-releases-draft-guidance-for-industry-statistical-approaches-to-evaluate-analytical-similarity.html. Accessed October 20, 2018. | ||
U.S. Food & Drug Administration [webpage on the Internet]. FDA withdraws draft guidance for industry: statistical approaches to evaluate analytical similarity: 2018. Available from: https://www.fda.gov/Drugs/DrugSafety/ucm611398.htm. Accessed October 30, 2018. | ||
Cuello HA, Segatori VI, Alberto M, Pesce A, Alonso DF, Gabri MR. Comparability of antibody-mediated cell killing activity between a proposed biosimilar RTXM83 and the originator rituximab. BioDrugs. 2016;30(3):225–231. | ||
da Silva A, Kronthaler U, Koppenburg V, et al. Target-directed development and preclinical characterization of the proposed biosimilar rituximab GP2013. Leuk Lymphoma. 2014;55(7):1609–1617. | ||
Dorvignit D, Palacios JL, Merino M, et al. Expression and biological characterization of an anti-CD20 biosimilar candidate antibody: a case study. MAbs. 2012;4(4):488–496. | ||
Lee KH, Lee J, Bae JS, et al. Analytical similarity assessment of rituximab biosimilar CT-P10 to reference medicinal product. MAbs. 2018;10(3):380–396. | ||
Montacir O, Montacir H, Eravci M, et al. Comparability study of Rituximab originator and follow-on biopharmaceutical. J Pharm Biomed Anal. 2017;140:239–251. | ||
Nupur N, Chhabra N, Dash R, Rathore AS. Assessment of structural and functional similarity of biosimilar products: rituximab as a case study. MAbs. 2018;10(1):143–158. | ||
Ryan AM, Sokolowski SA, Ng CK, et al. Comparative nonclinical assessments of the proposed biosimilar PF-05280586 and rituximab (MabThera®). Toxicol Pathol. 2014;42(7):1069–1081. | ||
Visser J, Feuerstein I, Stangler T, Schmiederer T, Fritsch C, Schiestl M. Physicochemical and functional comparability between the proposed biosimilar rituximab GP2013 and originator rituximab. BioDrugs. 2013;27(5):495–507. | ||
Williams JH, Hutmacher MM, Zierhut ML, et al. Comparative assessment of clinical response in patients with rheumatoid arthritis between PF-05280586, a proposed rituximab biosimilar, and rituximab. Br J Clin Pharmacol. 2016;82(6):1568–1579. |
 © 2018 The Author(s). This work is published and licensed by Dove Medical Press Limited. The full terms of this license are available at https://www.dovepress.com/terms.php and incorporate the Creative Commons Attribution - Non Commercial (unported, v3.0) License.
By accessing the work you hereby accept the Terms. Non-commercial uses of the work are permitted without any further permission from Dove Medical Press Limited, provided the work is properly attributed. For permission for commercial use of this work, please see paragraphs 4.2 and 5 of our Terms.
© 2018 The Author(s). This work is published and licensed by Dove Medical Press Limited. The full terms of this license are available at https://www.dovepress.com/terms.php and incorporate the Creative Commons Attribution - Non Commercial (unported, v3.0) License.
By accessing the work you hereby accept the Terms. Non-commercial uses of the work are permitted without any further permission from Dove Medical Press Limited, provided the work is properly attributed. For permission for commercial use of this work, please see paragraphs 4.2 and 5 of our Terms.