")
Back to Journals » International Journal of General Medicine » Volume 14
Stroke Risk Factors in United States: An Analysis of the 2013–2018 National Health and Nutrition Examination Survey
Received 29 June 2021
Accepted for publication 9 September 2021
Published 28 September 2021 Volume 2021:14 Pages 6135—6147
DOI https://doi.org/10.2147/IJGM.S327075
Checked for plagiarism Yes
Review by Single anonymous peer review
Peer reviewer comments 2
Editor who approved publication: Dr Scott Fraser
Zhouming Ren, Xinzheng Fu
Department of Neurology, Haining People’s Hospital, Haining, Zhejiang, People’s Republic of China
Correspondence: Xinzheng Fu
Department of Neurology, Haining People’s Hospital, No. 2 Qianjiang West Road, Haining, Zhejiang, People’s Republic of China
Tel +86-15325739220
Email [email protected]
Purpose: This research intended to identify significant risk factors of stroke among the elderly population in the United States using the k-means clustering method.
Patients and Methods: In this cross-sectional study, we analyzed data of 4346 subjects aged ≥ 60 years using the National Health and Nutrition Examination Survey (NHANES) 2013– 2018 datasets. Questionnaire data, dietary data, and laboratory data were accessed to acquire measurements of the potential risk factors. A pre-defined classification method was used based on the Medical Condition Questionnaire to define the stroke group. K-means clustering analysis used all potential risk factors for differentiating both groups. A stepwise logistic regression analysis examined the association between significant risk factors and the odds of stroke.
Results: Age (OR:1.053, 95% CI:1.029– 1.077), diabetes (OR: 28.019, 95% CI: 19.139– 41.020), glycohemoglobin (OR: 2.309, 95% CI: 1.818– 2.934), plasma fasting glucose (OR: 1.017, 95% CI: 1.010– 1.024), hypertension (OR: 2.343, 95% CI: 1.602– 3.426), dietary fiber consumption (OR:0.980, 95% CI:0.964– 0.995), and education level (OR:0.541, 95% CI: 0.411– 0.713) were identified as significant risk factor for stroke among the elderly population in the k-means clustering method. In the pre-defined grouping method, age (OR:1.093, 95% CI:1.054– 1.132), diabetes (OR:2.228, 95% CI: 1.432– 3.466), hypertension (OR:2.295, 95% CI:1.338– 3.938), and dietary fiber consumption (OR: 0.966, 95CI%:0.947– 0.985) were found to influence to the risk of stroke.
Conclusion: Age, hypertension, dietary fiber consumption, and education level are the significant risk factors of stroke among elders aged > 60 years. Among all the risk factors, diabetes is the strongest predictor of stroke. Glycohemoglobin and plasma fasting glucose are also associated with stroke risks, implying that glycemic control is particularly crucial in stroke prevention and management among older adults.
Keywords: diabetes, hyperglycemia, k-means clustering method
Introduction
Stroke is the second leading cause of death worldwide, resulting in 15.2 million deaths in 2015.1 Besides high mortality rate, disability is a significant component of the disease burden of stroke. As the third leading cause of disability adjusted life year (DALYs), stroke costs $35.8 billion annually.2,3 The American Heart Association (AHA) estimates 7.6 million (2.7%) Americans aged ≥20 years having had a stroke.4 The evidence of high occurrence rate and substantial burden of stroke has led to a vast research endeavor. As population ages, stroke risk is expected to go up.5 Therefore, precisely identifying the risk factors of the disease is pivotal to reduce the impact of stroke.
Current studies on stroke risk factor are mainly review studies, analyzing previous research that uses pre-defined stroke outcomes. The pre-defined stroke group may categorize borderline or undiagnosed individuals as not having a stroke.6 However, these borderline cases may possess shares similar characteristics with the stroke patients. Therefore, this research aims to examine prominent risk factors of stroke using a clustering method.
The k-means clustering is an unsupervised learning that groups the non-explicitly labeled data while maximizing the heterogeneity among groups.7 The method can be used to reveal similarities of unknown groups in a complex dataset. Unlike classification by the pre-defined outcomes, k-means clustering uses vector quantization for grouping elements. Thus, the k-means clustering identifies the potential stroke risk factors based on the characteristics of the study participants, ignoring any pre-defined criteria.
In this research, we intend to examine potential significant risk factors proposed in previous studies3,8–12 by a k-means clustering method and compare it with the analysis using a pre-defined stroke group, aiming to provide more accurate identification.
Materials and Methods
Study Design
The current study is a cross-sectional research, retrieving data from 2013–2014, 2015–2016, and 2017–2018 National Health and Nutrition Examination Survey (NHANES) year. The NHANES is a continuous nation-wide health program conducted by the National Center for Health Statistics (NCHS).13 Approximately 5000 people were sampled each year. These people distributed in counties across the country, and 15 counties were visited every year. The data collection process consisted of two parts, an in-person interview, and a physical examination performed in the Mobile Examination Center (MEC). All collected data was de-identified and released for public use, available on the NHANES official website (https://www.cdc.gov/nchs/nhanes/index.htm). NHANES was conducted in agreement with the Helsinki Declaration, the protocols of which were approved by the National Center for Health Statistics Ethics Review Board.14
Study Participants
In the NHANES 2013–2018 dataset, elders aged 60 years or older with complete medical condition information were eligible for the study (n=5261). Participants with missing data in dietary and baseline characteristics were excluded (n=915). In total, 4346 participants were included in the final analyses. The detailed selection of eligible participants was presented in Figure 1.
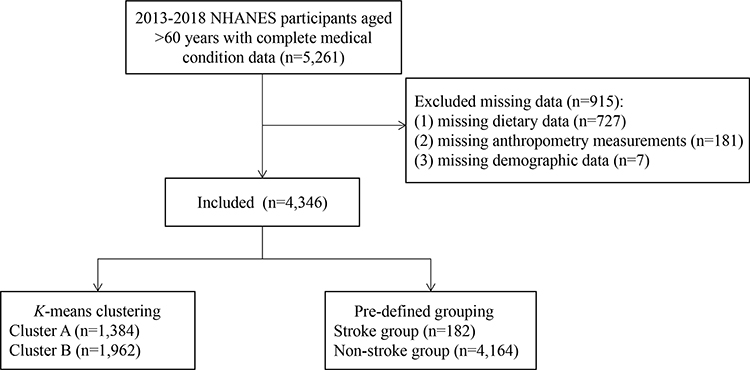 |
Figure 1 Flow chart of selecting eligible participants. |
Stroke Assessment
The pre-defined stroke groups were determined based on the Medical Condition Questionnaire (MCQ). During the in-person interview, question MCQ 160f “Has a doctor or other health professional ever told {you/SP} that {you/s/he} had a stroke?” was asked by trained interviewers. Participants who answered “Yes” were identified as having had a stroke and classified in the stroke group in the analysis using pre-defined outcomes.
Risk Factors Measurements
Risk factors were assessed using the questionnaire data, examination data, and laboratory data. During the MEC interview, NHANES questionnaires were administered by trained interviewers using the Audio computer assisted personal self interview (ACASI) Computer-Assisted Personal Interview (CAPI) system.15 The NHANES examination was performed in the MEC where participants underwent the anthropometry examination under a controlled environment.16 The data was collected through a computerized data collection process with a built-in data entry quality control checks. Biospecimens, including blood, urine, oral rinse, and vaginal/penile swabs, were collected during the MEC examination to provide a detailed evaluation of the participants’ health conditions and nutritional status.17 Collected data were entered directly into a computerized database and underwent internal and external quality assurance and quality control.
Demographic Characteristics
Demographic variables were retrieved from the Demographic Variables and Sample Weights file (DEMO). Information regarding age, gender, race, education level, marital status, physical activity, and poverty income ratio (PIR) was extracted from the DEMO data files.
Weight
Bodyweight was measured by a calibrated digital weight scale, and height was measured using a stadiometer. Body mass index (BMI) was calculated and rounded to one decimal place. The BMI data of the study participants was available in the exanimation dataset Body Measures datafile.
Hypertension
Blood Pressure & Cholesterol Questionnaire (BPQ) question BPQ020 asked, “{Have you/Has SP} ever been told by a doctor or other health professional that {you/s/he} had hypertension, also called high blood pressure?” Participants who answered “yes” were considered as having hypertension.
Diabetes
Diabetes Questionnaire (DIQ) question DIQ010 asked, “The next questions are about specific medical conditions. {Other than during pregnancy, {have you/has SP}/{Have you/Has SP}} ever been told by a doctor or health professional that {you have/{he/she/SP} has} diabetes or sugar diabetes?” Participants who answered “yes” were considered diabetic.
Cardiovascular Disease
If the participant answered “Yes” to any of the following questions in the MCQ, the individual was considered as having cardiovascular disease.
- MCQ160b: “Has a doctor or other health professional ever told {you/SP} that {you/s/he} had congestive heart failure (CHF)?”
- MCQ160c Has a doctor or other health professional ever told {you/SP} that {you/s/he} had coronary heart disease (CHD)?
- MCQ160d: “Has a doctor or other health professional ever told {you/SP} that {you/s/he} had angina, also called angina pectoris?”
- MCQ160e: “Has a doctor or other health professional ever told {you/SP} that {you/s/he} had a heart attack (HA), also called myocardial infarction)?”
Smoking
Smokers were defined using the Smoking-Cigarette Use Questionnaire (SMQ). Participants who answered “yes” to question SMQ020 “{Have you/Has SP} smoked at least 100 cigarettes in {your/his/her} entire life?” were classified as smokers.
Dietary Intake
Dietary intake was estimated by 24-hour dietary recall, a validated USDA Automated Multiple-Pass Method.18 The specific intake of each nutrient was available in the Dietary Interview-Total Nutrients Intakes. Consumptions of dietary fiber, vitamin A, vitamin E, vitamin C, vitamin D, polyunsaturated fatty acids (PUFA), and alcohol were retrieved from the dietary data. Alcohol consumers were identified if the alcohol consumption was >0 mg/day. PUFA was categorized into six groups on a 5 g incremental basis.
Laboratory Assessment
Laboratory data was accessed to acquire plasma biomarkers and indicators of lipid profile and glycemic control. Cholesterol-High-Density Lipoprotein, Cholesterol-Low-Density Lipoproteins & Triglycerides, Cholesterol-Total, Glycohemoglobin, and Plasma Fasting Glucose data files were used to extract high-density lipoprotein (HDL), low-density lipoproteins (LDL), triglycerides (TG), total cholesterol (TC), glycohemoglobin (GHb), and plasma fasting glucose (GLU) levels.
Statistical Analysis
Data extraction was performed by R 4.0.2. The SPSS Statistics 23.0 (IBM Corporation. Armonk, NY, USA) was used for clustering. The SAS 9.4 (SAS Institute, inc. Cary, NC, USA) was used to identify risk factors. A p value of less than 0.05 was defined as significant. Sample weights (WTINT2YR) were applied to all analyses to ensure the representativeness of the study sample.
Continuous variables were examined for normality by the Shapiro normality test. Normally distributed continuous variables were presented in mean and standard deviation (mean±SD) and compared using the independent t-test. Non-normally distributed variables, displayed in median and interquartile range [M(Q1–Q3)], were compared by the Mann–Whitney U-test. Categorical variables were expressed in frequencies and proportions (n%) and compared using the Pearson’s chi-square test (χ2) and Fisher’s exact test when appropriate.
K-means clustering method was implemented to define subgroups of stroke. All risk factors were applied as clustering variables in this research. Each clustering variable served as an axis to cluster the observations. The observations were assigned to the nearest centroid. The grouping process was completed when all centroids had become static, and all observations had been positioned. Once the stroke subgroups were developed, intergroup comparisons were made to identify variables that were significantly different. Multivariate stepwise regression was implemented to investigate the potential stroke risk factors and obtain the odds ratio (OR), 95% confidence interval (95% CI), and p values. Receiver Operator Characteristic (ROC) curves were applied to evaluate and compare the performance of classification.
Results
Study Population
Characteristics of the study population were summarized in Table 1. Of the included 4346 people, the median age was 68 years, with more female participants than male participants (54.15% vs 45.85%). Most participants were non-Hispanic whites (78.09%), followed by non-Hispanic blacks (8.24%), others (9.69%), and Mexican Americans (3.98%). A total of two-thirds of the populations were observed to be overweight (38.32%) and obese (33.14%). There were more married (64.72%) participants than widowed (16.24%), divorced or separated (14.92%), and single participants (4.11%). Most participants were non-smokers (79.25%), and alcohol consumption was noted in 22.18% of population. Most people were not diagnosed with CHF, CHD, angina, and HA, corresponding to 94.65%, 89.85%, 94.91%, and 92.16% of the overall population. The study population consisted of 21.75% diabetic patients. More than half of the study participants (57.39%) were diagnosed with hypertension. The median of HDL, TG, LDL, and TC level was 54.00 mg/dL, 107.00 mg/dL, 101.00 mg/dL, and 189.00 mg/dL, respectively. The median GHb and GLU level was 5.70% and 107.00 mg/dL, respectively. The median dietary fiber, vitamin A, vitamin E, vitamin C, and vitamin D intake was 14.90 mg, 524.00 mcg, 7.37mg, 55.60 mg, 3.20 mcg, respectively.
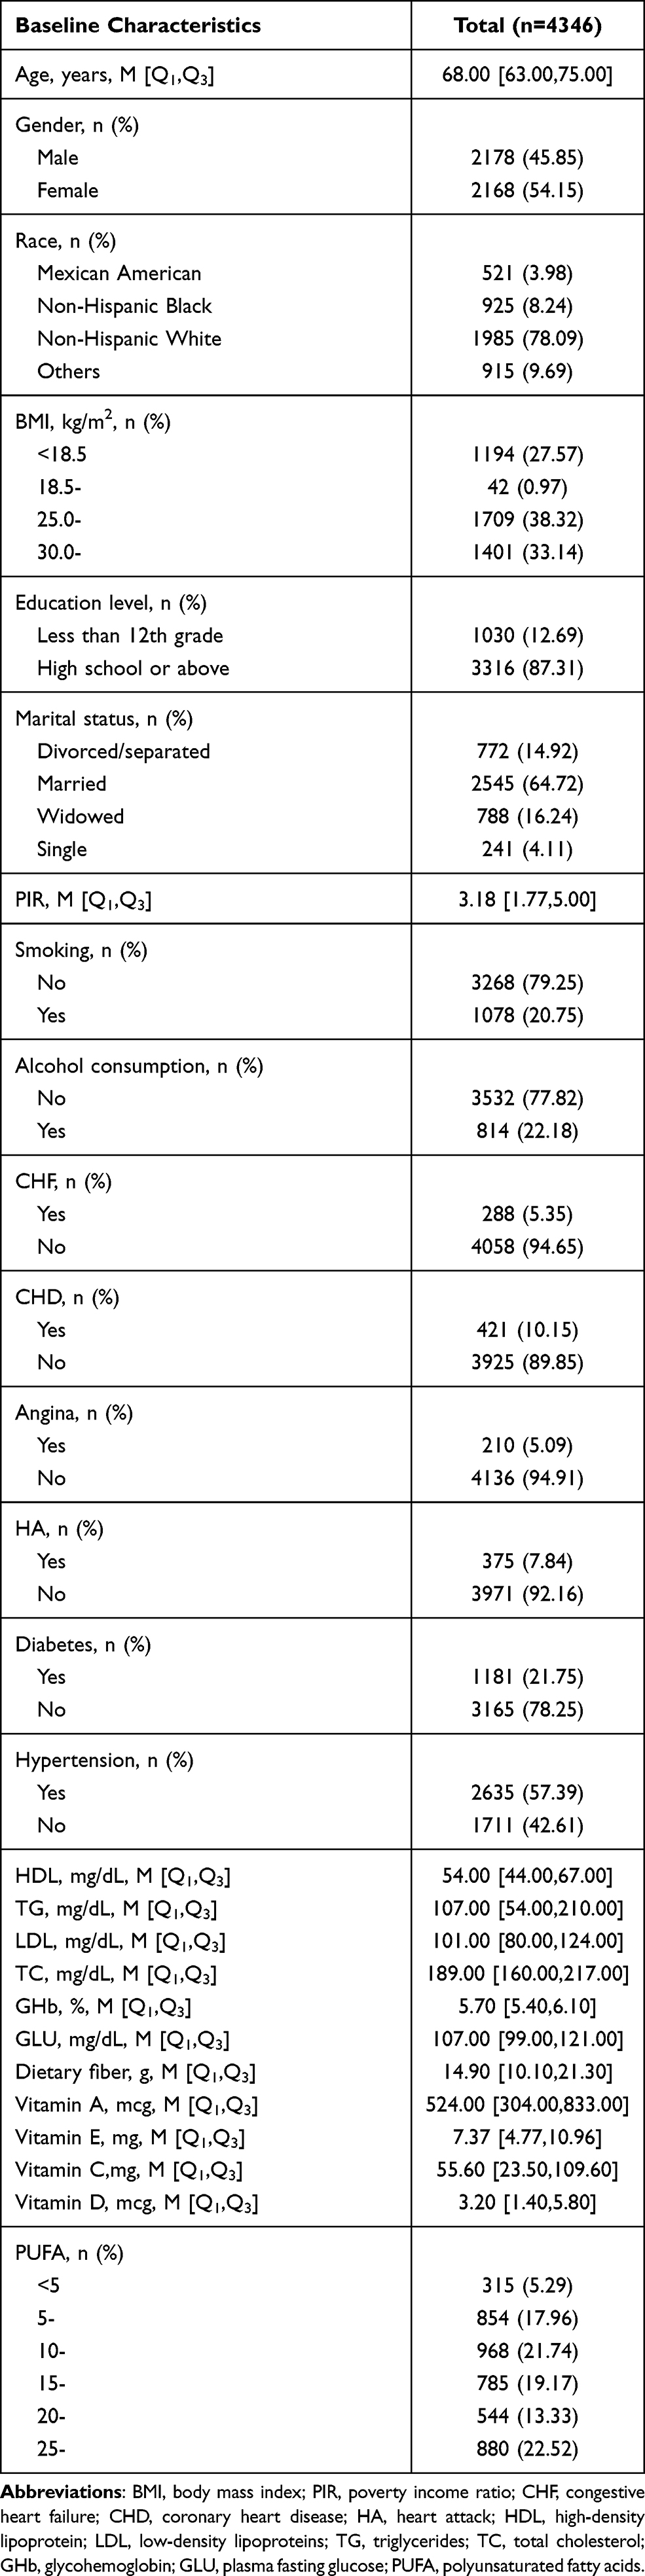 |
Table 1 Baseline Characteristics of the Overall Study Participants, NHANES 2013–2018 (n=4346) |
K-Means Clustering
When applying the k-means clustering analysis, the study population was grouped into two clusters, Cluster A and Cluster B. There were 1384 participants in Cluster A and 1962 participants in Cluster B. The final clustering centers, as known as the centroids, were presented in Figure 2. The overall risk of stroke was 4.19%. The risk of stroke in Cluster A was 7.56% (Figure 3), while the risk of stroke in Cluster B was 2.60%. A significant difference in the stroke incidence was detected (χ2=57.965, P<0.001) between Cluster A, 7.56%, and Cluster B, 2.60%.
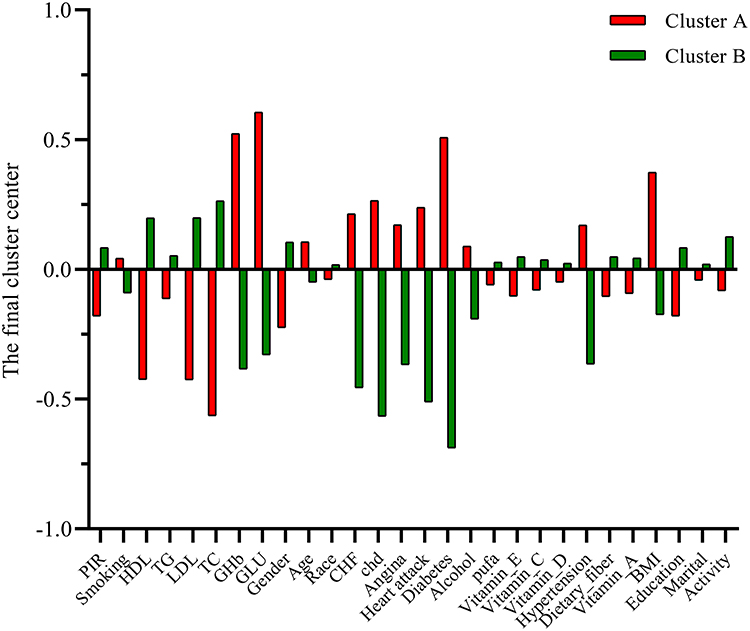 |
Figure 2 K-means clustering: centroids of each cluster. Abbreviations: PIR, poverty income ratio; HDL, high-density lipoprotein; TG, triglycerides; LDL, low-density lipoproteins; TC, total cholesterol; GHb, glycohemoglobin; GLU, plasma fasting glucose; CHF, congestive heart failure; CHD, coronary heart disease; HA, heart attack; PUFA, polyunsaturated fatty acids; BMI, body mass index. |
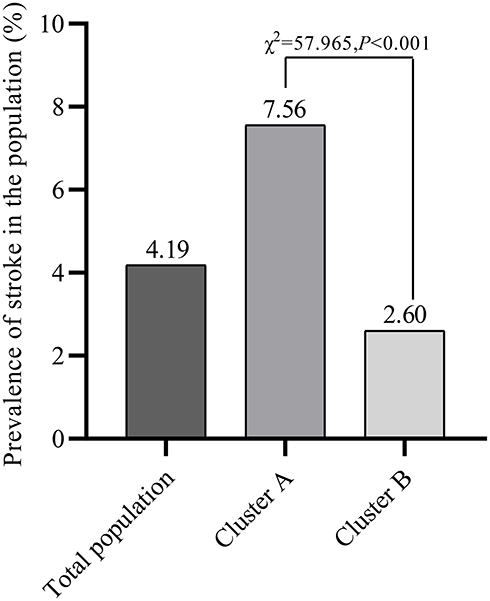 |
Figure 3 K-means clustering: the risk of stroke of each cluster. |
When comparing the demographic characteristics (Table 2), age (Z=667.598, P<0.001), gender (χ2=46.793, P<0.001), race (χ2=43.418, P<0.001), education level (χ2=38.397, P<0.001), and PIR (Z=−999.692, P<0.001) were significantly different between Cluster A and Cluster B. The proportion of physical activity (χ2=434.774, P<0.001), alcohol consumers (χ2=60.299, P<0.001), CHF patients (χ2=91.344, P<0.001), CHD patients (χ2=126.416, P<0.001), angina patients (χ2=60.128, P<0.001), HA patients (χ2=124.904, P<0.001), diabetic patients (χ2=461.741, P<0.001), and hypertension patients (χ2=91.259, P<0.001) were also significantly between Cluster A and Cluster B. Additionally, disparities were observed in the following: BMI (χ2=3.123, P<0.001), HDL (Z=−2490.96, P<0.001), TG (Z=−230.891, P<0.001), LDL (Z=−2183.04, P<0.001), TC (Z=−2921.49, P<0.001), GHb (Z=3940.41, P<0.001), GLU (Z=3081.21, P<0.001), Dietary fiber (Z=−472.144, P<0.001), vitamin A (Z=−450.076, P<0.001), vitamin E (Z=−556.366, P<0.001), vitamin C (Z=−570.544, P<0.001), vitamin D (Z=−202.439, P<0.001), PUFA (χ2=9.001, P=0.109).
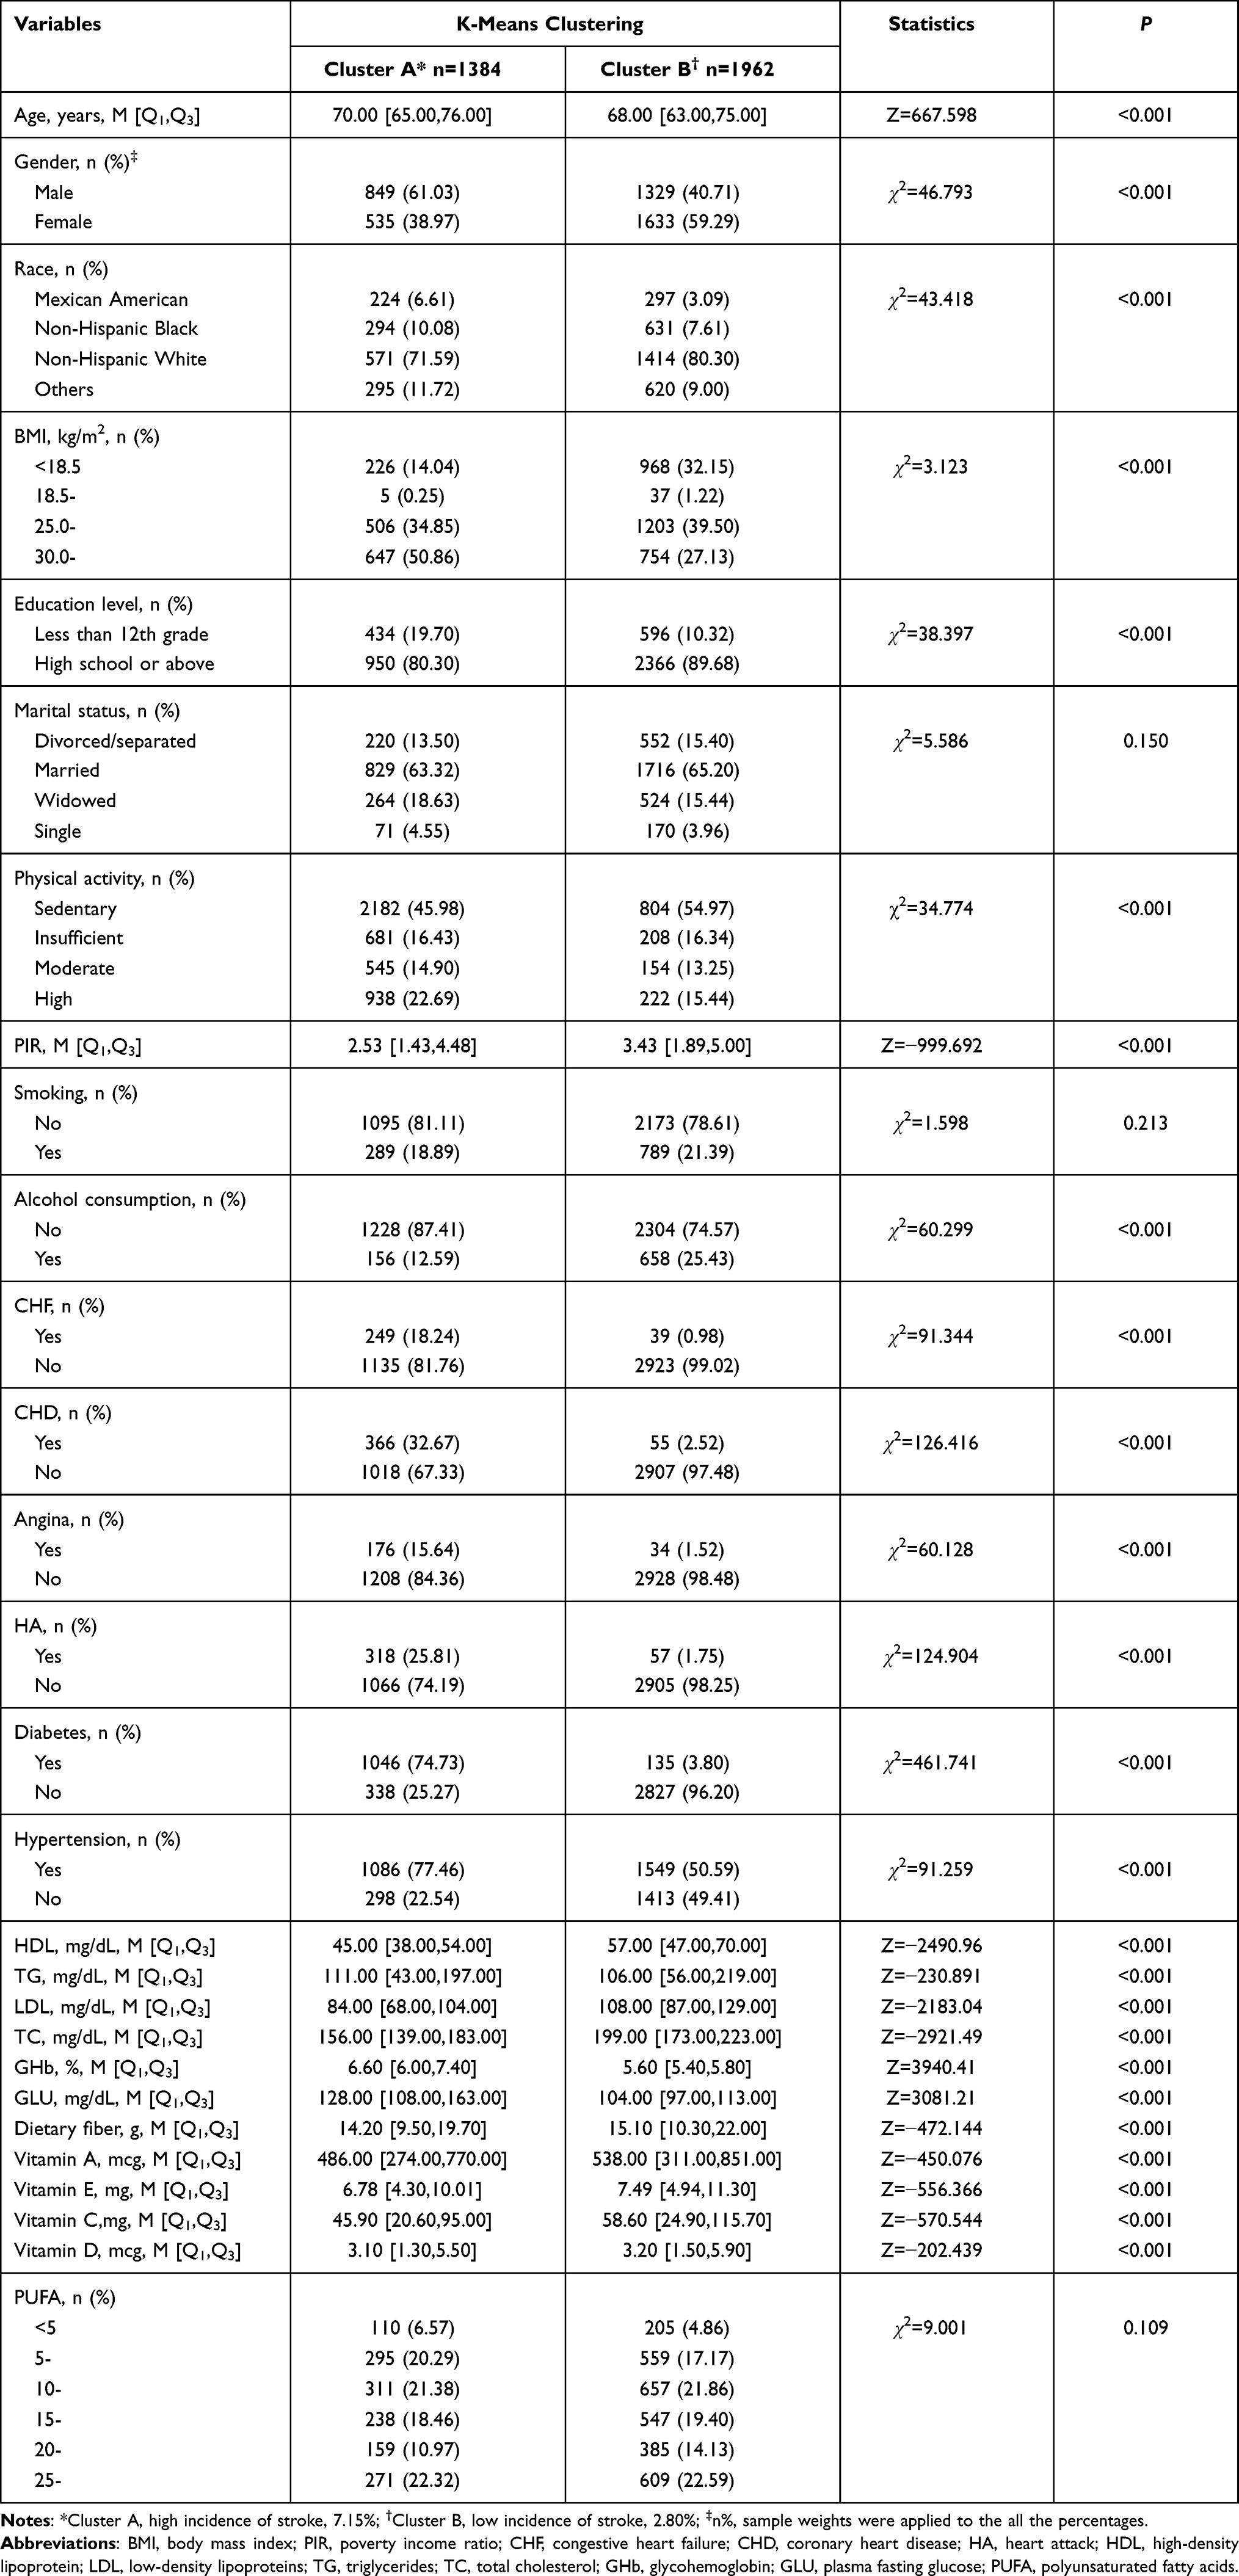 |
Table 2 Baseline Characteristics According to the Risk of Stroke, k-Means Clustering Method |
Pre-Defined Stroke Group
When defining the stroke subgroups based on the MCQ, the stroke group included 182 participants, and the non-stroke group contained 4164 people. As summarized in Table 3, the demographic comparison discovered significant differences in age (Z=958.729, P<0.001), race (χ2=8.974, P=0.048), education level (χ2=7.614, P=0.008), physical activity (χ2=11.529, P=0.009), and PIR (Z=−473.070, P<0.001) between the stroke and non-stroke group. In terms of cardiovascular diseases, only the prevalence of CHF was significantly different between the stroke and non-stroke groups (χ2=4.236, P=0.045). The stroke group consisted of a higher proportion of diabetic participants than the non-stroke patients (χ2=13.591, P=0.001). A larger percentage of the hypertension patients was in the stroke group than the non-stroke group (χ2=19.385, P <0.001). The HDL (Z=−358.113, P<0.001), TG (Z=−143.048, P<0.001), LDL (Z=−457.960, P<0.001), TC (Z=−559.595, P<0.001), GHb (Z=299.764, P<0.001), and GLU (Z=370.373, P<0.001) levels were also significantly different between the stroke and non-stroke group. Dietary intakes of fiber (Z=−455.767, P<0.001), vitamin A (Z=−112.521, P<0.001), vitamin E (Z=−313.950, P<0.001), vitamin C (Z=−138.531, P<0.001), and vitamin D (Z=−82.555, P<0.001) were significantly different between the stroke and non-stroke group.
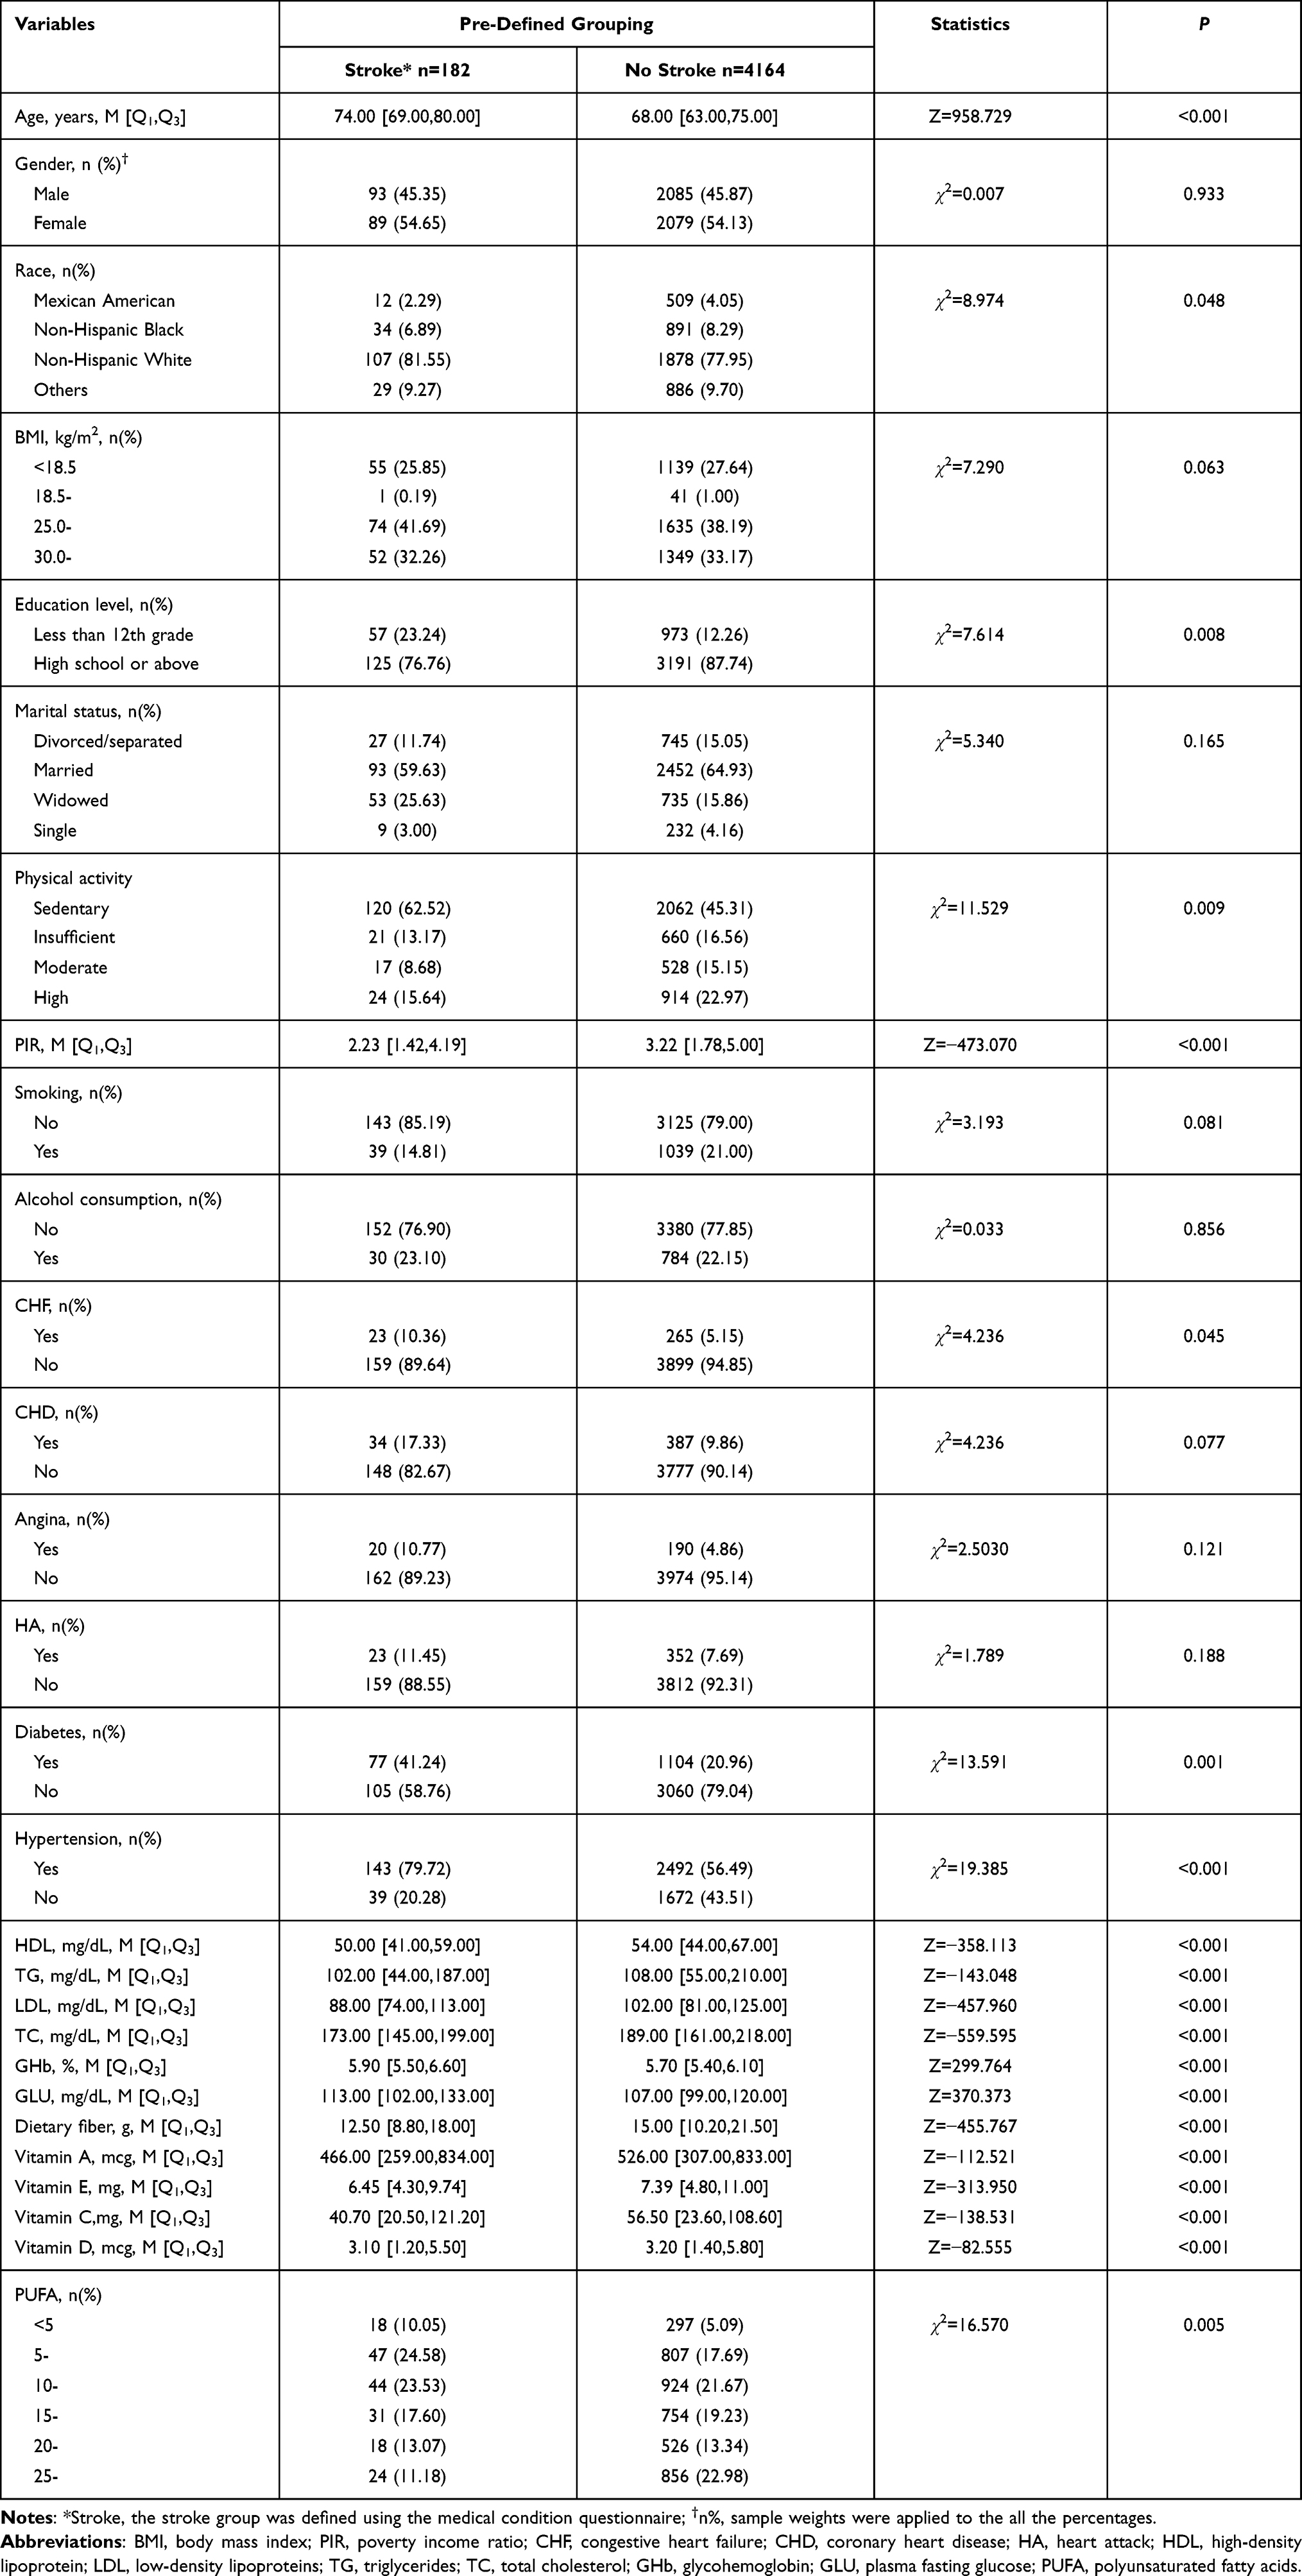 |
Table 3 Baseline Characteristics According to the Risk of Stroke, Pre-Defined Grouping Method |
Stepwise Logistic Regression Analysis
After stepwise logistic regression analysis, age, diabetes, hypertension, dietary fiber consumption, education level, GHb, and GLU were identified as risk factors in the k-means clustering analysis (Table 4). The most prominent risk factor was diabetes, associated with a 28.02 times increased risk of stroke (OR: 28.019, 95% CI: 19.139–41.020, P<0.001). The analysis of biomarkers yielded similar results, with a 1% increase in GHb showing a 1.31 increase in the risk of stroke (OR: 2.309, 95% CI: 1.818–2.934, P<0.001). As the level of GLU increased by 1 mg/dL, the risk of stroke elevated 0.017 (OR: 1.017, 95% CI: 1.010–1.024, P<0.001). Hypertension was associated with 2.34 times higher risk of stroke (OR: 2.343, 95% CI: 1.602–3.426, P<0.001). The risk of stroke increased 0.05 in each 1-year increase in age (OR:1.053, 95% CI:1.029–1.077, P<0.001). Every 1 g increase in dietary fiber intake was linked with a 0.02 decrease in the stroke risk (OR:0.980, 95% CI:0.964–0.995, P=0.016). Higher education level also had a protective effect (OR:0.541, 95% CI: 0.411–0.713, P<0.001).
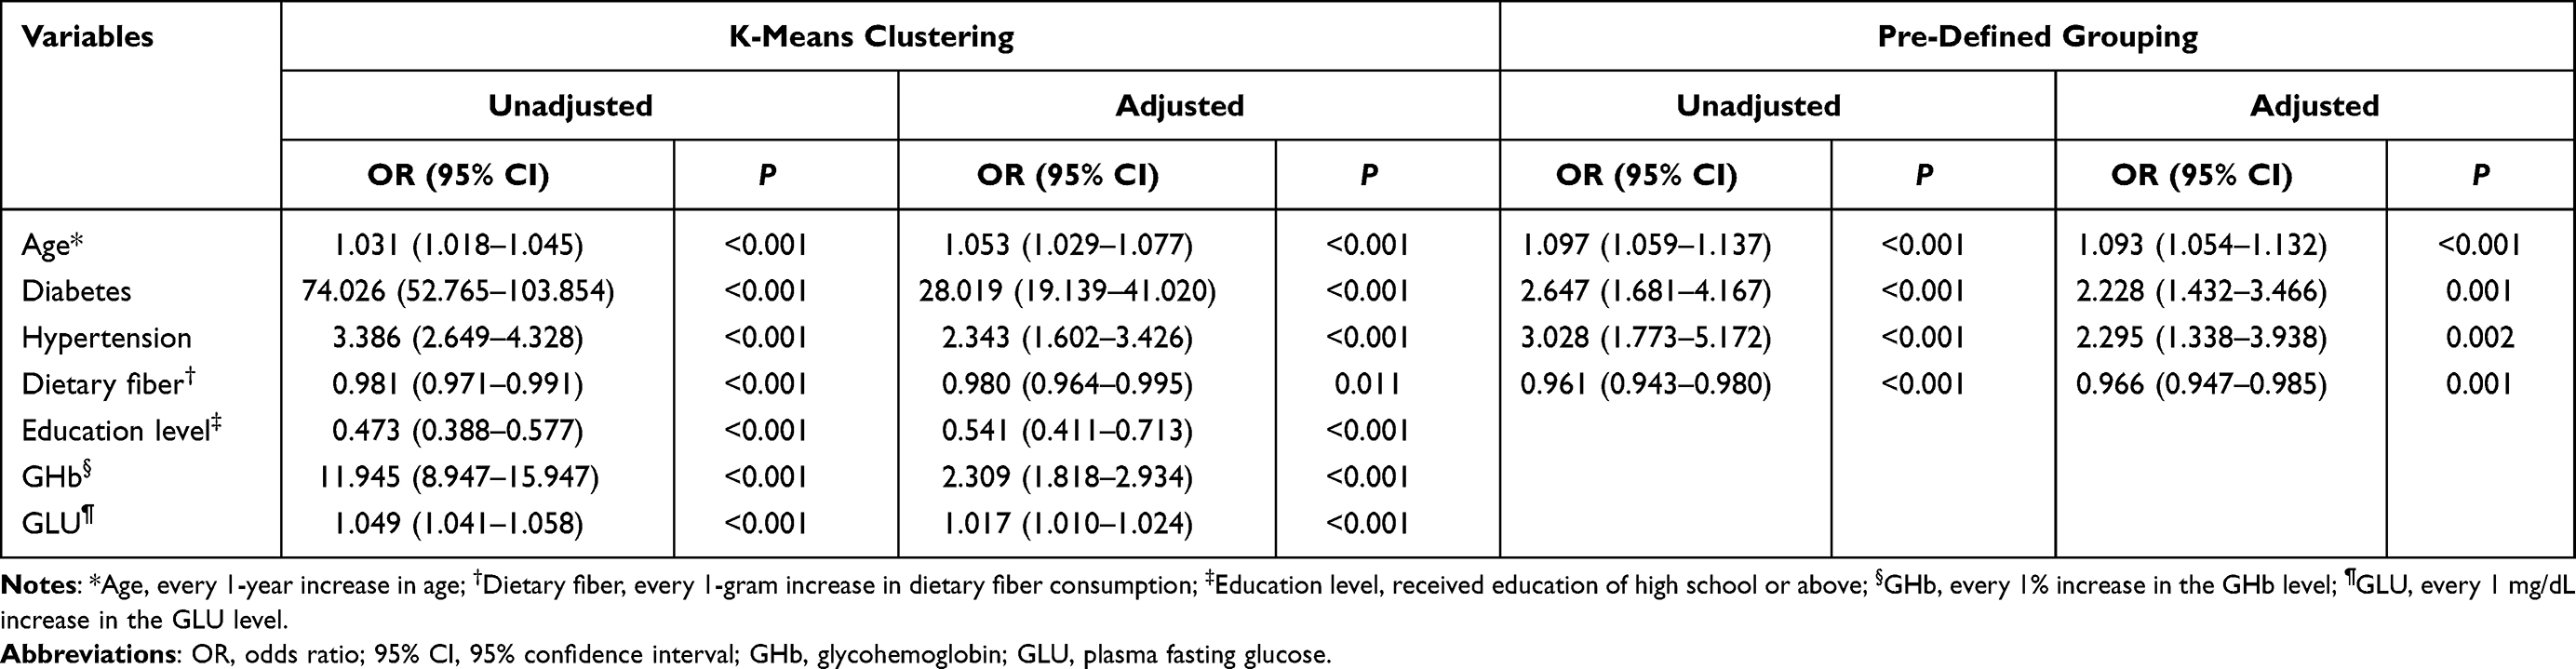 |
Table 4 Logistic Regression Analysis of Stroke Risk Factors, Comparing the k-Means Clustering Method and the Pre-Defined Grouping Method |
Fewer risk factors were identified when using the pre-defined stroke groups, including age, diabetes, hypertension, and dietary fiber consumption. The effect of hypertension (OR:2.295, 95% CI:1.338–3.938, P=0.002) was more significant than diabetes (OR:2.228, 95% CI: 1.432–3.466, P<0.001) on the risk of stroke. Each 1-year increase in age was associated with 0.093 higher risk of stroke (OR:1.093, 95% CI:1.054–1.132, P<0.001). Dietary fiber illustrated a protective effect on stroke, each 1 g increase consumption of which was associated with 0.034 times lower risk of stroke (OR: 0.966, 95CI%:0.947–0.985, P<0.001).
Since a significant effect of diabetes was detect, ROC curves were plotted to interpret the performance of each group method, as presented in Figure 4. The sensitivity and specificity of the k-means clustering analysis were significantly better than that of the pre-defined grouping method. The area under curve (AUC) of the k-means clustering was 0.854 (95% CI:0.842–0.866), while the AUC of the pre-defined grouping method was 0.579 (95% CI:0.542–0.616). The AUCs of the two classification methods were significantly different (Z=13.934, P<0.001).
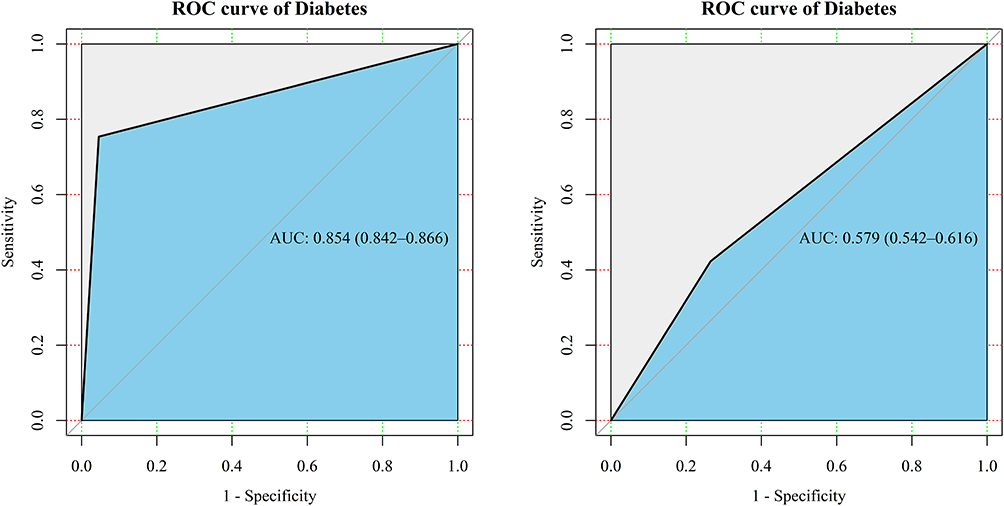 |
Figure 4 ROC curves evaluating the classification of diabetes. Abbreviations: ROC, Receiver Operator Characteristic; AUC, area under curve. |
Discussion
As a deadly and debilitating disease, stroke poses profound physiological, psychological, and economic effects on patients’ life, particularly among the aging population. Accurately identifying the risk factor is crucial in minimizing the burdens of stroke. Using the k-means clustering, we identified seven significant risk factors associated with the risk of stroke in the elderly population. Age, diabetes, hypertension, GHb, and GLU were positively associated with stroke incidence, while dietary fiber and educational attainment were inversely correlated with the risk of stroke.
The pre-defined grouping method yielded a smaller sample size of the stroke group when compared with the k-means clustering (182 vs 1384). Furthermore, certain risk factors were not detected using the pre-defined stroke group, including gender, BMI, marital status, smoking, alcohol consumption, CHD, angina, and HA, which were established risk factors.11,19–21 Additionally, the ROC reflects a significantly superior specificity and sensitivity of the k-means clustering methods. Therefore, the k-means clustering analysis can detect potential significant risk factors that are ignored using the pre-defined criteria.
Hypertension was proposed as the most potent risk factor.22 In the present research, hypertension is also linked with stroke occurrence. However, we observed diabetes as the strongest predictor of stroke, increasing the risk of stroke by 27 times using the k-means clustering methods. The elevation of GHb and GLU level predicted the increased risk of stroke, ascertaining the effect of diabetes on stroke incidence. In contrast, diabetes was linked with a less significant impact on stroke occurrence using the pre-defined classification method, and the biomarkers were not associated with the odds of stroke. Several studies suggested that physical activity was associated with a reduced risk of stroke.23,24 In our study, there was a statistical difference in physical activity between the stoke and non-stroke groups. However, physical activity was not related to the risk of stroke in the Logistic regression analysis. The possible explanation was that the physical activity level of the included population was unevenly distributed, and more people were distributed in sedentary and insufficient physical activity levels. Evidence suggested that the level of physical activity was associated with the risk of stroke, and light physical activity may not be related to the risk of stroke.25–27
The putative mechanism of diabetes’s influence involves several aspects. The nitric oxide (NO)-mediated vasodilation is compromised among diabetic patients, resulting in endothelial dysfunction and a cascade reaction of atherosclerosis.28 The reduced arterial elasticity and elevated inflammatory biomarkers among diabetic patients, such as C-reactive protein, interleukin-1, interleukin-6, and tumor necrosis factor-α, may also contribute to the higher risk of stroke. Furthermore, hyperglycemia may increase the vulnerability of vertebrobasilar arteries in diabetic patients by sympathetic denervation, elevating the risk of thrombotic infarction in the posterior cerebral circulation.29
Although diabetes has been established as a risk factor of stroke in previous studies,28,30,31 the influence is not as potent as that in the current study. The significantly higher risk detected in this research may suggest the vital role of glycemic control among the elderly population and imply the accurate classification of k-means clustering methods, which discerns borderline stroke patients and reveals the critical role of diabetes in affecting the risk of stroke. The superiority of the clustering analysis has also been confirmed in previous risk factor studies analyzing the NHANES dataset.32,33 Other strengths of the current study are the use of nationally representative sample and adequate sample size.
The shortcomings of our study are mainly the study design. The cross-sectional design limits the interpretation of the bidirectional relationship between stroke and the risk factors. Moreover, we were unable to separate ischemic stroke patients from hemorrhagic stroke patient since the NHANES questionnaire did not specify the stroke types. Thus, the impact of each risk factor on different types of stroke was uncertain. Yet, findings of previous studies suggest similar risk factors of ischemic stroke and hemorrhagic stroke,28,34 possibly due to the overlapping pathophysiology of the two stroke types. Additionally, of the 101.5 million global incidences of stroke, ischemic stroke accounts for 76.1% (77.2 million) cases. Therefore, the results of this research may provide general information regarding the primary prevention and secondary management of stroke.
Besides maintaining normal blood pressure and adopting a healthy diet and lifestyle, the findings of this research underscore the importance of glycemic control in stroke prevention in the aging population. Future research examining the risk factor of stroke may specify the stroke types to obtain a more comprehensive understanding. When examining risk factors of other diseases, the k-means clustering method used in this method may achieve a more objective appraisal.
Conclusion
In summary, age, diabetes, GHb, GLU, hypertension, dietary fiber consumption, and education level are the risk factors of stroke among populations aged >60 years. Interestingly, diabetes, a modifiable risk factor, is associated with an approximately 27 times higher risk of stroke when using the k-means clustering. This research elucidates the significance of diabetes to the risk of stroke. Future studies are required to investigate the impact of each risk factor on stroke subtypes.
Disclosure
The authors report no conflicts of interest in this work.
References
1. Katan M, Luft A. Global burden of stroke. Semin Neurol. 2018;38(2):208–211. doi:10.1055/s-0038-1649503
2. Kim J, Thayabaranathan T, Donnan GA, et al. Global stroke statistics 2019. Int J Stroke. 2020;15(8):819–838. doi:10.1177/1747493020909545
3. Yan LL, Li C, Chen Jet al. Stroke. The International Bank for Reconstruction and Development/The World Bank; 2017.
4. Virani Salim S, Alvaro A, Benjamin Emelia J, et al. Heart disease and stroke statistics—2020 update: a report from the American Heart Association. Circulation. 2020;141(9):e139–e596. doi:10.1161/CIR.0000000000000757
5. World Health Orgnization. Ageing and health. Available from: https://www.who.int/news-room/fact-sheets/detail/ageing-and-health.
6. Mai X, Liang X. Risk factors for stroke based on the national health and nutrition examination survey. J Nutr Health Aging. 2020;24(7):791–795. doi:10.1007/s12603-020-1430-4
7. Hennig C, Meila M, Murtagh F, Rocci R. Handbook of Cluster Analysis.
8. Guzik A, Bushnell C. Stroke epidemiology and risk factor management. Continuum (Minneap Minn). 2017;23(1):15–39. doi:10.1212/CON.0000000000000416
9. Feigin VL, Norrving B, George MG, Foltz JL, Roth GA, Mensah GA. Prevention of stroke: a strategic global imperative. Nat Rev Neurol. 2016;12(9):501–512. doi:10.1038/nrneurol.2016.107
10. Caprio FZ, Sorond FA. Cerebrovascular disease: primary and secondary stroke prevention. Med Clin North Am. 2019;103(2):295–308. doi:10.1016/j.mcna.2018.10.001
11. Virani Salim S, Alvaro A, Aparicio Hugo J, et al. Heart disease and stroke statistics—2021 update. Circulation. 2021;143(8):e254–e743. doi:10.1161/CIR.0000000000000950
12. Gillum R. Education, poverty, and stroke incidence in whites and blacks The NHANES I Epidemiologic Follow-up Study. J Clin Epidemiol. 2003;56(2):188–195. doi:10.1016/S0895-4356(02)00535-8
13. Centers for Disease Control and Prevention. NHANES - National Health and Nutrition Examination Survey Homepage; January 3, 2019. Available from: https://www.cdc.gov/nchs/nhanes/index.htm.
14. National Center for Health Statistics. NHANES - NCHS research ethics review board approval. May 8, 2019. Available from: https://www.cdc.gov/nchs/nhanes/irba98.htm.
15. National Center for Health Statistics. NHANES 2017–2018 questionnaire instruments. Available from: https://wwwn.cdc.gov/nchs/nhanes/continuousnhanes/questionnaires.aspx?BeginYear=2017.
16. National Center for Health Statistics. NHANES 2017–2018 examination data overview. Available from: https://wwwn.cdc.gov/nchs/nhanes/continuousnhanes/overviewexam.aspx?BeginYear=2017.
17. National Center for Health Statistics. NHANES 2017–2018 laboratory data overview. Available from: https://wwwn.cdc.gov/nchs/nhanes/continuousnhanes/overviewlab.aspx?BeginYear=2017.
18. Blanton CA, Moshfegh AJ, Baer DJ, Kretsch MJ. The USDA automated multiple-pass method accurately estimates group total energy and nutrient intake; 2006. Available from: https://pubag.nal.usda.gov/catalog/10039.
19. Roy-O’Reilly M, McCullough LD. Age and sex are critical factors in ischemic stroke pathology. Endocrinology. 2018;159(8):3120–3131. doi:10.1210/en.2018-00465
20. Andersen KK, Olsen TS. Stroke case-fatality and marital status. Acta Neurol Scand. 2018;138(4):377–383. doi:10.1111/ane.12975
21. Howard VJ, Madsen TE, Kleindorfer DO, et al. Sex and race differences in the association of incident ischemic stroke with risk factors. JAMA Neurol. 2019;76(2):179–186. doi:10.1001/jamaneurol.2018.3862
22. Fryar CD, Ostchega Y, Hales CM, Zhang G, Kruszon-Moran D. Hypertension prevalence and control among adults: United States, 2015–2016. NCHS Data Brief. 2017;289:1–8.
23. Soares-Miranda L, Siscovick DS, Psaty BM, et al. Physical activity and risk of coronary heart disease and stroke in older adults: the cardiovascular health study. Circulation. 2016;133(2):147–155. doi:10.1161/circulationaha.115.018323
24. Saunders DH, Sanderson M, Hayes S, et al. Physical fitness training for stroke patients. Cochrane Database Syst Rev. 2020;3(3):Cd003316. doi:10.1002/14651858.CD003316.pub7
25. Yang D, Bian Y, Zeng Z, et al. Associations between intensity, frequency, duration, and volume of physical activity and the risk of stroke in middle- and older-aged Chinese people: a cross-sectional study. Int J Environ Res Public Health. 2020;17(22):8628. doi:10.3390/ijerph17228628
26. Kyu HH, Bachman VF, Alexander LT, et al. Physical activity and risk of breast cancer, colon cancer, diabetes, ischemic heart disease, and ischemic stroke events: systematic review and dose-response meta-analysis for the Global Burden of Disease Study 2013. BMJ. 2016;354:i3857. doi:10.1136/bmj.i3857
27. Kramer SF, Hung SH, Brodtmann A. The impact of physical activity before and after stroke on stroke risk and recovery: a narrative review. Curr Neurol Neurosci Rep. 2019;19(6):28. doi:10.1007/s11910-019-0949-4
28. Chen R, Ovbiagele B, Feng W. Diabetes and stroke: epidemiology, pathophysiology, pharmaceuticals and outcomes. Am J Med Sci. 2016;351(4):380–386. doi:10.1016/j.amjms.2016.01.011
29. Kuroda J, Matsuo R, Yamaguchi Y, et al. Poor glycemic control and posterior circulation ischemic stroke. Neurol Clin Pract. 2019;9(2):129–139. doi:10.1212/CPJ.0000000000000608
30. O’Donnell MJ, Chin SL, Rangarajan S, et al. Global and regional effects of potentially modifiable risk factors associated with acute stroke in 32 countries (INTERSTROKE): a case-control study. Lancet Lond Engl. 2016;388(10046):761–775. doi:10.1016/S0140-6736(16)30506-2
31. Lau L, Lew J, Borschmann K, Thijs V, Ekinci EI. Prevalence of diabetes and its effects on stroke outcomes: a meta‐analysis and literature review. J Diabetes Investig. 2019;10(3):780–792. doi:10.1111/jdi.12932
32. Ghassib IH, Batarseh FA, Wang H, Borgnakke WS. Clustering by periodontitis‐associated factors—A novel application to NHANES data. J Periodontol. 2021;92:1136–1150. doi:10.1002/JPER.20-0489
33. Bancks MP, Casanova R, Gregg EW, Bertoni AG. Epidemiology of diabetes phenotypes and prevalent cardiovascular risk factors and diabetes complications in the National Health and Nutrition Examination Survey 2003–2014. Diabetes Res Clin Pract. 2019;158:107915. doi:10.1016/j.diabres.2019.107915
34. Boehme AK, Esenwa C, Elkind MSV. Stroke risk factors, genetics, and prevention. Circ Res. 2017;120(3):472–495. doi:10.1161/CIRCRESAHA.116.308398
 © 2021 The Author(s). This work is published and licensed by Dove Medical Press Limited. The full terms of this license are available at https://www.dovepress.com/terms.php and incorporate the Creative Commons Attribution - Non Commercial (unported, v3.0) License.
By accessing the work you hereby accept the Terms. Non-commercial uses of the work are permitted without any further permission from Dove Medical Press Limited, provided the work is properly attributed. For permission for commercial use of this work, please see paragraphs 4.2 and 5 of our Terms.
© 2021 The Author(s). This work is published and licensed by Dove Medical Press Limited. The full terms of this license are available at https://www.dovepress.com/terms.php and incorporate the Creative Commons Attribution - Non Commercial (unported, v3.0) License.
By accessing the work you hereby accept the Terms. Non-commercial uses of the work are permitted without any further permission from Dove Medical Press Limited, provided the work is properly attributed. For permission for commercial use of this work, please see paragraphs 4.2 and 5 of our Terms.