")
Back to Journals » International Journal of Nanomedicine » Volume 13
Stearyl polyethylenimine complexed with plasmids as the core of human serum albumin nanoparticles noncovalently bound to CRISPR/Cas9 plasmids or siRNA for disrupting or silencing PD-L1 expression for immunotherapy
Authors Cheng WJ, Chen LC, Ho HO , Lin HL, Sheu MT
Received 26 July 2018
Accepted for publication 27 September 2018
Published 2 November 2018 Volume 2018:13 Pages 7079—7094
DOI https://doi.org/10.2147/IJN.S181440
Checked for plagiarism Yes
Review by Single anonymous peer review
Peer reviewer comments 2
Editor who approved publication: Professor Lei Yang
Wei-Jie Cheng,1,* Ling-Chun Chen,2,* Hsiu-O Ho,1 Hong-Liang Lin,3 Ming-Thau Sheu1
1School of Pharmacy, College of Pharmacy, Taipei Medical University, Taipei, Taiwan; 2Department of Biotechnology and Pharmaceutical Technology, Yuanpei University of Medical Technology, Hsinchu, Taiwan; 3School of Pharmacy, College of Pharmacy, Kaohsiung Medical University, Kaohsiung, Taiwan
*These authors contributed equally to this work
Purpose: In this study, a double emulsion method for complexing plasmids with stearyl polyethylenimine (stPEI) as the core to form human serum albumin (HSA) (plasmid/stPEI/HSA) nanoparticles (NPs) was developed for gene delivery by non-covalently binding onto plasmid/stPEI/HSA nanoparticles with CRISPR/Cas9 or siRNA, which disrupts or silences the expression of programmed cell death ligand-1 (PD-L1) for immunotherapy.
Materials and methods: Chemically synthesized stearyl-polyethyenimine (stPEI)/ plasmids /HSA nanoparticles were maded by double emulsion method. They were characterized by dynamic light scattering (DLS), transmission electron microscope and also evaluated by in vitro study on CT 26 cells.
Results: stPEI was synthesized by an N-(3-dimethylaminopropyl)-N-ethylcarbodiimide hydrochloride (EDC)–N-hydroxysuccinimide (NHS) reaction, and we found that the degree of substitution was ~1.0 when the ratio of PEI to stearic acid was 1:7 in the reaction. Then, two sgRNA sequences were selected and evaluated for their ability to knock out PD-L1 by decreasing its expression by about 20%. Based on the trend of particle size/zeta potential values as a function of ratio, F25P1 containing 25 µg of plasmid/stPEI/HSA NPs noncovalently bound to 1 µg plasmids via charge–charge interactions was found to be optimal. Its particle size was about 202.7±4.5 nm, and zeta potential was 12.60±0.15 mV. In an in vitro study, these NPs showed little cytotoxicity but high cellular uptake. Moreover, they revealed the potential for transfection and PD-L1 knockout in an in vitro cell model. Furthermore, F25P1S0.5 containing 25 µg of plasmid/stPEI/HSA NPs noncovalently bound to 1 µg of plasmids and 0.5 µg siRNA was prepared to simultaneously deliver plasmids and siRNA. An in vitro study demonstrated that the siRNA did not interfere with the transfection of plasmids and showed a high-transfection efficiency with a synergistic effect on inhibition of PD-L1 expression by 21.95%.
Conclusion: The plasmids/stPEI/HSA NPs could be a promising tool for gene delivery and improved immunotherapy.
Keywords: stearyl polyethylenimine, human serum albumin nanoparticles, PD-L1, CRISPR, Cas9, siRNA, gene delivery
Introduction
With rapid developments in genetic science, especially next-generation sequencing (NGS), high-throughput sequencing technologies were developed. Recently, more than 3,000 human genes related to Mendelian diseases have been identified; 500 of them are associated with complex diseases or infections.1 The numbers of pathogenic genes keep growing, and it is predicted that about 4,000–7,000 genes will be identified by 2020.2 Although there have been major breakthroughs in pathogenic genes, most of these diseases still cannot really be cured. In addition, no more than 5% of them have effective treatments.3 Moreover, for most rare diseases, the only treatment is protein replacement therapy, which supplies proteins or antibodies that are deficient or absent in patients.
In 2017, the US Food and Drug Administration approved three gene therapies: KYMRIAH, YESCARTA, and LUXTURNA. The indication for the first two is for lymphomas, and they are chimeric antigen receptor T-cell (CAR-T) immune therapy, and the last is for Leber’s congenital amaurosis, a retinal gene-deficiency disease, which delivers the RPE65 plasmid into the retina. Hence, gene therapies have become promising treatments to directly repair gene deficiencies. The clustered, regularly interspaced, short palindromic repeat (CRISPR)/CRISPR-associated protein 9 (Cas9) system has emerged as a transforming genome-editing tool.4–7 Cas9:sgRNA recognizes the protospacer-adjacent motif (PAM) sequence and a complementary 20-nucleotide genomic sequence and induces dsDNA breaks, which are repaired by error-prone nonhomologous end joining (NHEJ) or precise homology-directed repair (HDR).5,8 This targeted genome-editing technology can be used to edit a specific genomic locus for genetic knockout or correction.9–11 The target of genome-editing therapeutics is genomic DNA rather than a kinase (protein) of a targeted kinase inhibitor or antigen of an antibody.12–14 Consequently, therapeutics based on genome-editing technology directly target the root causes of many diseases, rather than the secondary effects.15–17 Moreover, some previously undruggable targets can now be treated by targeted genome-editing technology, making this system important in the targeted therapy field.17–19 However, improvements in CRISPR delivery methods and HDR efficiency are required for therapeutic applications of genome editing for disease gene correction.20
Nowadays, strategies of gene delivery are classified into three categories: viral vectors, nonviral vectors, and physical methods. Viral vectors can be divided into three categories: adenoviral vectors (AdVs), lentiviral vectors (LVs), and adeno-associated viral vectors (AAVs). Although viral vectors have high gene delivery efficiencies, they have complicated production, high costs, and safety concerns; they are not rational gene delivery vectors. For now, mainstream nonviral vectors can be divided into two parts: lipid-based and polymer-based vectors. Compared to viral vectors, advantages of polymer-based vectors are low immunogenicity, nonintegration, easy production, and low costs, but their efficiency is lower than that of viral vectors, which is the greatest barrier. In addition, liposomes were the first nonviral vectors for clinical trials, but their low efficiency still needs much improvement.
Polymer-based vectors are mainly made of cationic polymers, eg, polyethylenimine (PEI), poly(L-lysine) (PLL), poly-(2-(dimethylamino)-ethyl methacrylate) (PDMAM), and polyamidoamine (PAMAM). These prevalent polymer materials mostly have amino groups and have certain advantages, eg, lower immunogenicity, easy production, and low costs.21 Moreover, PEI in particular is very widely used in gene delivery.22 When PEI is added to lysosomes, it makes lots of protons enter the lysosomes; then, the osmotic pressure can break up the lysosomes, releasing the encapsulated material. This theory explains the reason for the high transfection efficiency. In addition, some research showed that with the higher molecular weight (MW) of PEI the transfection efficiency increases but with a concomitant increase in the cytotoxicity and with a lower MW the transfection efficiency decreases but the cytotoxicity also decreases.23 Therefore, balancing cytotoxicity and transfection is a critical point when choosing a proper MW. In recent years, some research showed that the alkyl reaction with PEI can increase the transfection efficiency and cellular uptake and promote better stability.24–26
As a potential alternative for gene delivery, advantages of human serum albumin (HSA) as nanocarriers are that it has high biocompatibility, low immunogenicity, biodegradability, nontoxicity, and high solubility.27 Further, when HSA nanoparticles (NPs) enter the blood circulation, they can passively accumulate in tumor tissues, called an enhanced permeability and retention (EPR) effect.28 In addition, due to the increasing nutrient needs of tumor cells, they usually express high levels of Gp60 and SPARC, which are albumin receptors, and which can facilitate cellular uptake of HSA via transcytosis.29 This mechanism creates an active tumor target. The success of an albumin-based NP formulation of paclitaxel (PTX) using NP albumin-binding (Nab®) technology (Abraxane®; Celegene Corp., Summit NJ, USA), which utilizes binding forces between albumin and hydrophobic chemotherapeutics under high-pressure homogenization, has expanded the clinical uses and therapeutic applications of albumin.29 Its usefulness was also demonstrated by various recent studies utilizing the efficacy of albumin to improve the delivery of siRNA in different disease models.30 Work to date using albumin as a carrier for gene delivery has focused on covalent modifications of the albumin molecule to synthesize cationized albumin (CA) or on complexation of cationic polymer-coated HSA NPs to enhance DNA complexation and cell transfection. HSA-branched PEI (bPEI)–siRNA ternary complexes formed with native unmodified HSA were reported to significantly improve the internalization and silencing efficiency, compared to bPEI–siRNA polyplexes.31 Further, a new NP formulation composed of HSA for codelivery of doxorubicin (DOX)32 or PTX33 and the tumor necrosis factor (TNF)-related apoptosis-inducing ligand (TRAIL) by employing Nab technology was developed to demonstrate the potential of complexing ligands with albumin via charge interactions between the positive surface charge of the TRAIL and the negative surface charge of HSA in a neutral condition to encapsulate anticancer drugs, such as DOX and PTX. Based on this concept, when adjusting HSA to an acidic condition lower than its isoelectric point of about 5, the positive charge of HSA is able to complex with the negative charge of siRNA, and then NPs are formed by Nab technology enabling the codelivery of chemotherapeutic drugs and siRNA.
Currently, an immune checkpoint blockade is prevalent in cancer therapies. Immune checkpoints are regulators of the immune system, associated with T cell recognition of cells and T cell cytotoxicity. However, tumor cells usually highly express these proteins to escape from elimination by the immune system. Among these, cytotoxic T-lymphocyte antigen 4 (CTLA-4), programmed cell death (PD)-1, and programmed cell death ligand-1 (PD-L1) are most important. PD-L1 plays a key role in tumor evasion. Tumor cells often highly express PD-L1 on their surfaces to inhibit immune responses, such that patients with tumors with high PD-L1 expression exhibit poor prognoses.34 As a result, disruption or silencing of the PD-L1 expression on tumor cells can enhance the immune system in attacking cancer cells, leading to growth inhibition of tumors.
CRISPR/Cas9 is the predominant gene-editing technique, and gene repair or knockout can easily be accomplished with a simple design. However, its main problem in clinical use is the barrier of gene delivery. In spite of the high efficiency of viral vectors, they are highly immunogenic and carcinogenic. Therefore, we wanted to develop nonviral vectors, which are easy to produce, have low immunogenicity, and mostly important are actively targetable. As described earlier, HSA NPs possess characteristics of passive and active targeting accumulation, ie, they easily accumulate in tumor cells. Hence, in this study, a double emulsion method for complexing plasmids with stearyl PEI (stPEI) as the core for forming HSA NPs without cross-linkers was developed for gene delivery by noncovalently binding to the PD-L1 plasmid (CRISPR/Cas9) or siRNA onto plasmid/stPEI/HSA NPs to knock out or silence PD-L1 expression for immunotherapy. The aim of this study was to evaluate the safety and transfection efficiency of HSA NPs and ultimately to develop a new process for preparing biocompatible HSA NPs to deliver targeted gene-editing plasmids or siRNA for gene therapies.
Materials and methods
pSpCas9(BB)-2A-green fluorescent protein (GFP; PX458) was a gift from Feng Zhang (Addgene plasmid no 48138). BbsI-HF® and T4 DNA ligase were purchased from New England Biolabs (Ipswich, MA, USA). DH5alpha competent cells were supplied by Bio-Protech (Taipei, Taiwan). Oligonucleotide was provided by Genomics (New Taipei City, Taiwan). The Plasmid DNA Mini Kit and Gel/PCR DNA Purification Mini Kit were purchased from Novelgene (Taipei, Taiwan). The EasyPure Plasmid Midi Advanced Kit, PCR-related agents, and agarose were supplied by Bioman (Taipei, Taiwan). Anti-mouse CD274 and Luria–Bertani (LB) broth were purchased from BD Biosciences (San Jose, CA, USA). An albumin solution (20%) was supplied by Taiwan Blood Services Foundation (Taipei, Taiwan). bPEI (MW 600) was delivered by Alfa Aesar (Ward Hill, MA, USA). Lipofectamine 3000, Hoechst 33342, FBS, and mouse interferon (IFN)-γ recombinant protein were provided by Thermo Fisher Scientific (Waltham, MA, USA). Ethidium bromide (EtBr) solution (10 mg/mL), N-(3-dimethylaminopropyl)-N-ethylcarbodiimide hydrochloride (EDC), N-hydroxysuccinimide (NHS), 3,3′-dioctadecyloxacarbocyanine perchlorate (DIO), and stearic acid were obtained from Sigma-Aldrich Co. (St Louis, MO, USA). RPMI-1640 medium and penicillin–streptomycin solution were supplied by Corning Incorporated (Corning, NY, USA). An Amicon Centrifugal Filter was purchased from Merck Millipore (Billerica, MA, USA). Mouse colon carcinoma CT26.WT (BCRC 60447) was purchased from Bioresource Collection and Research Center (Hsinchu, Taiwan). Other materials were of analytical grade unless otherwise specified.
Preparation and identification of
A simple previously reported preparation method of stPEI was followed.25 First, stearic acid (1.4 mmol) was dissolved in chloroform; then, EDC (1.4 mmol) dissolved in chloroform in advance was added to this. After 30 minutes, NHS (1.4 mmol) dissolved in methanol was added to the solution. After 30 minutes, the former activated solution was added to the PEI chloroform (0.2 mmol) solution under continuous stirring. After being kept from light at room temperature for 24 hours, the product was purified by sedimentation in cold ether and centrifuged at 1,380 ×g for 10 minutes; this process was repeated three times. The final product was dried under a vacuum for 48 hours and stored at −20°C until used.
stPEI was identified using Fourier transform infrared (FT-IR) and 1H-nuclear magnetic resonance (NMR) analyses. For the FT-IR analysis, the stPEI sample was dissolved in chloroform to 10 mg/mL and dropped onto a KBr disk. After scanning with an L160000 FT-IR spectrometer (PerkinElmer Inc., Waltham, MA, USA), the FT-IR spectrum was analyzed to identify the functional group of the stPEI sample. For the 1H-NMR analysis and calculation of the degree of substitution, stPEI was dissolved in D2O to 10 mg/mL. After scanning with 500 MHz NMR (Bruker Corporation, Billerica, MA, USA), the NMR spectrum was obtained. Then, the ratio of the signal area of hydrogens of PEI (around 2.5–3.5 ppm) to the signal area of hydrogens of the terminal methyl group of stearic acid (around 0.8 ppm.) was calculated to obtain the degree of substitution.
Preparation of the PD-L1 knockout plasmid
Bacterial culture, storage, and plasmid purification
To amplify the plasmid, the following simple introduction to bacterial culture and plasmid purification is given. Liquid lysogeny broth (LB) was 25 g of LB added to 1 L of double-distilled water (ddH2O) and sterilized in an autoclave for 30 minutes at 121°C. After this was cooled down, 100 μg/mL ampicillin was added. LB agar was 25 g of LB and 15 g of agarose added to 1 L of ddH2O and sterilized in an autoclave for 30 minutes at 121°C. After this was cooled down, 100 μg/mL ampicillin was added. LB agar was poured into a plate and stored at −4°C.
Bacterial culture used sterilized tips to pick up a little bacteria from the LB broth and incubate it for 12–16 hours at 150 rpm at 37°C. Bacteria were stored as a mixture of 0.5 mL of a bacteria solution and 0.5 mL of 50% sterilized glycerol at −80°C. Plasmid purification followed the protocol of the plasmid purification kit, with storage at −20°C. The concentration was evaluated by Cytation 3 (BioTek Instruments, Winooski, VT, USA) by measuring the absorbance at 260 and 280 nm. The ratio of OD260/OD280 was around 1.9, which was an acceptable purity.
Design of the PD-L1 knockout sequence of sgRNA
Initially, the NCBI gene database was used to acquire the sequence of PD-L1 (CD274) of the mouse genome. Next, the exon sequence of the target gene was put into CRISPOR,35 and we chose the target species and the PAM corresponding to Cas9. Afterward, according to an evaluation of the thermodynamics, specificity score, predicted efficiency, and out of frame, the software recommended several candidates. Then, some better sequences were chosen for the following experiments.
Vector construction
Digestion of the plasmid
The plasmid (1 μg) was digested in a total volume of a 50 μL solution composed of 1 μL BbsI-HF restriction enzyme, 5 μL NEBuffer™ (×10), and 43 μL nuclease-free water for 1 hour at 37°C. Next, the plasmid was purified by gel electrophoresis and cut from the agarose. The digested plasmid in the gel was purified with a gel extraction kit and stored at −20°C.
Annealing and ligation of oligos and plasmids
The oligo was dissolved in sterilized ddH2O to 100 μM. The oligos were annealed in T4 ligation buffer on a PCR machine. The thermal program was 37°C for 30 minutes, 95°C for 5 minutes, and cooling down at 5°C/min to 25°C. Next, 1 μL of annealed oligos (1:200 dilution) was mixed with 5 μL BbsI digested plasmid (50 ng), 2 μL T4 DNA ligase buffer (10×), 1 μL T4 DNA ligase, and 11 μL nuclease-free water and incubated at room temperature for 2 hours. The final product was stored at −20°C until used.
Transformation
DH5α competent cells were used to amplify the plasmid in this study. First, competent cells were taken from −80°C storage and put it onto an ice bath. The bacterial solution was mixed with the plasmid at a ratio of 10:1 in a total volume of 40 μL. Then, the mixture was placed on ice for 45 minutes, heat-shocked at 42°C for 45 seconds, and immediately placed back to ice for 2~3 minutes. LB broth (500 μL) was added and incubated at 37°C and 150 rpm for 1 hour. This was centrifuged at 865 ×g for 3 minutes, the supernatant was removed, and around 100 μL remained. This was poured onto an LB agar plate and incubated for 12–16 hours. A sterilized tip was used to pick up a colony and move it to 10 μL LB broth and take 1 μL of the bacteria solution and U6 promoter sequence as the primer to perform a PCR to confirm the transformation. After confirmation by the PCR, it was placed in 6 mL of LB broth and incubated at 37°C for 12~16 hours, and a plasmid extraction kit was used to purify the plasmid. The plasmid was then sent off for DNA sequencing. After confirmation of the sequence, we amplified the plasmid and stored it at −20°C for the following experiments.
Evaluation of the PD-L1 knockout efficacy of the CRISPR/Cas9 plasmid
The CT26 cell line, which is from mouse colon carcinoma cells and is able to highly express PD-L1 following stimulation with IFN-γ, was selected as the cell model for the disruption of PD-L1 expression.36 CT26 cells were seeded in triplicate onto 12-well plates at a density of 105 cells/well. After incubation overnight, the medium was replaced with fresh serum-free medium containing plasmids (1 μg/well) or siRNA (AGACGUAAGCAGUGUUGAA; 33 nM) as the positive control group with Lipofectamine 3000.37 The next day, the medium was replaced with fresh 10% FBS medium, and 24 hours later, the medium was replaced with fresh FBS medium with INF-γ (150 ng/mL) to stimulate cells. After 24 hours, cells were collected with trypsin and stained with a PD-L1 fluorescent antibody. By a flow cytometric antibody protocol, stained cells were analyzed for PD-L1 antibody fluorescence by flow cytometry (SA3800; Sony, Tokyo, Japan).
Preparation and characterization of plasmid/
Due to the presence of fatty acids as stabilizers in the HSA commercial product, they were expected to interfere with the preparation of HSA NPs that were bound to stPEI. Hence, the following removal procedure was carried out. A 10% HSA solution was prepared using an HSA commercial product, and the pH value of the resulting HSA solution was adjusted to pH 2.7 by adding 1N HCl. Activated charcoal (5 g) was then added to the HSA solution followed by continuous stirring at 300 rpm for 2 hours at 4°C. Finally, the HSA/charcoal solution was centrifuged at 7,370 ×g for 10 minutes at 4°C to remove the charcoal. The supernatant was placed under suction filtration with a 0.45 μm filter. After adjusting the pH of the HSA solution back to pH 7, it was freeze-dried and stored at 4°C until being used.
After several trials, it was found that it was necessary to complex the stPEI with the plasmid to form a core for the formation of HSA NPs. The detailed process is described as follows. stPEI (100 mg) was dissolved in 5 mL chloroform as the oil phase; 1 mg of plasmid was dissolved in 1 mL ddH2O as the aqueous phase. Using an ultrasonicator probe (VCX 750; Sonics & Materials, Newtown, CT, USA) set to 150 W and three pulses for 10 seconds, the water phase was emulsified into the oil phase to form the first emulsion. This crude emulsion was rapidly added to 25 mL of the 1% HSA solution with an ultrasonicator probe set to 150 W and six pulses for 10 seconds. The final emulsion was stirred at 500 rpm for 2 hours and evaporated in a rotary evaporator (R-114; Buchi, Flawil, Switzerland) to remove the chloroform. An Amicon centrifugal filter (MW cutoff [MWCO] 10 kDa) was used to remove the free stPEI, and then the plasmid/stPEI/HSA NPs were concentrated. After freeze-drying, the plasmid/stPEI/HSA NPs were obtained and could be reconstituted with ddH2O to form plasmid/stPEI/HSA NPs with a positive zeta potential. For the so-obtained plasmid/stPEI/HSA NPs with a positive charge, the negative charge of the plasmid or siRNA could be further noncovalently bound to them via charge–charge interactions simply by adding the plasmid or siRNA. We then evaluated the following formulations. F25P0 contained only plasmid/stPEI/HSA NPs, whereas F25P0.5, F25P1, F25P2, F25P5, and F25P10 contained 25 μg plasmid/stPEI/HSA NPs noncovalently bound to 0.5, 1, 2, 5, and 10 μg plasmids, respectively, via charge–charge interactions. F25P0S0.5 and F25P1S0.5 contained 25 μg of plasmid/stPEI/HSA NPs noncovalently bound to 0.0 and 1.0 μg of the plasmid, respectively, and 0.5 μg siRNA.
Plasmid/stPEI/HSA NPs noncovalently bound to the plasmid or siRNA were characterized by measuring the particle size and its distribution, zeta potential, and morphology. The particle size and its distribution and zeta potential were measured with Zetasizer ZSP (Malvern Instruments, Malvern, UK) by adding 1 mL of the NP solution to a desired concentration of particle number into a folded capillary zeta cell. For morphology, a plasmid/stPEI/HSA NP solution was dropped onto a carbon film on a nickel grid. After a while, 0.5% uranyl acetate was dropped onto the film for 3 minutes. Next, the remains were dried with tissue paper. The film was washed with ddH2O and dried at room temperature. Then, the film was mounted in a transmission electron microscope (HT7700; Hitachi Ltd, Tokyo, Japan) to observe the morphology of the NPs.
Gel retarding assay of plasmid/stPEI/HSA NPs noncovalently bound to the plasmid or siRNA
Agarose (0.75 g) was added to 100 mL of tris-borate-EDTA (TBE) buffer, and the solution was put into a microwave to dissolve the agarose. The agarose solution (30 mL) and 3 μL of EtBr (10 mg/mL) were mixed together and poured into a gel mold with combs. After the gel solidified, it was taken out and sunk into an electrophoresis cell filled with TBE buffer. Various samples (20 μL) of plasmid/stPEI/HSA NPs were noncovalently bound to the plasmid mixed with 4 μL of 6× loading dye, and the mixture was added to the well with the gel. Gel electrophoresis was run for 60 minutes at 100 V. Finally, the gel was imaged at 254 nm with a gel imaging system (ChampGel 5000; Sagecreation, Beijing, China).
In vitro cytotoxicity study of plasmid/stPEI/HSA NPs noncovalently bound to the plasmid or siRNA
The in vitro cytotoxicity of the plasmid/stPEI/HSA NPs noncovalently bound to the plasmid or siRNA against the CT26 cell line was evaluated. CT26 cells were seeded in triplicate into 96-well plates at a density of 104 cells/well and were cultured in RPMI-1640 with 10% FBS, 1% penicillin, and 1% streptomycin in 5% CO2 at 37°C. After incubation overnight, the medium was replaced with fresh serum-free medium containing the plasmid/stPEI/HSA NPs noncovalently bound to the plasmid with/without siRNA. Four hours later, the medium was supplemented with fresh FBS. After 20 hours, 5 mg/mL of MTT was added to each well. Cells were incubated for more than 2 hours, and the medium was replaced with 200 μL of dimethyl sulfoxide to dissolve the formazan crystals. The absorbance was measured at 550 nm with an ELISA reader (Cytation 3; BioTek Instruments).
Cellular uptake of plasmid/stPEI/HSA NPs noncovalently bound to the plasmid or siRNA
The plasmid/stPEI/HSA NPs with the fluorescent dye, DIO, were prepared as described earlier with the addition of 0.5 mg DIO to the stPEI chloroform solution. Plasmid/stPEI/DIO/HSA NPs noncovalently bound to various amounts of plasmid were prepared as described earlier. The uptake of those various formulations by CT26 cells was evaluated. CT26 cells were seeded in triplicate in 12-well plates at a density of 105 cells/well. After incubation overnight, the medium was replaced with fresh serum-free medium containing the plasmid/stPEI/DIO/HSA NPs noncovalently bound to various amounts of the plasmid. After 2 or 24 hours, cells were washed with PBS, and then nuclei were stained with Hoechst 33342 for 5 minutes. DIO fluorescence that was entrapped in the plasmid/stPEI/HSA NPs was observed with a fluorescence microscope (Cytation 3; BioTek Instruments) as an indicator of cellular uptake.
Transfection efficiency of plasmid/
CT26 cells were seeded in triplicate in 12-well plates at a density of 105 cells/well. After incubation overnight, the medium was replaced with fresh serum-free medium containing the plasmid/stPEI/HSA NPs noncovalently bound to various amounts of the plasmid and siRNA. After 4 hours, the medium was supplied with fresh FBS; 20 hours later, the medium was washed with PBS, and nuclei were stained with Hoechst 33342 for 5 minutes. Stained cells were observed with fluorescence microscopy (Cytation 3; BioTek Instruments) or analyzed by flow cytometry (SA3800; Sony). Due to the plasmid encoding a GFP as a reporter gene, the transfection efficiency of CRISPR/Cas9 for disrupting PD-L1 expression in CT26 cells was determined by the green fluorescence of the GFP.
Gene disruption efficiency of plasmid/
CT26 cells were seeded in triplicate in 12-well plates at a density of 105 cells/well. After incubation overnight, the medium was replaced with fresh serum-free medium containing the plasmid/stPEI/HSA NPs noncovalently bound to various amounts of the plasmid and siRNA. After 4 hours, the medium was supplied with fresh FBS. More than 20 hours later, the medium was replaced with fresh 10% FBS-containing medium. After 24 hours, the medium was replaced with fresh 10% FBS medium containing INF-γ (150 ng/mL) to stimulate PD-L1 expression by CT26 cells. After 24 hours, cells were collected with trypsin and stained with a PD-L1 fluorescent antibody. According to the flow cytometric antibody protocol, stained cells were analyzed by flow cytometry (SA3800; Sony) for the negative expression of PD-L1.
Statistical analyses
Results are presented as mean ± SD of three different replicates. A one-way ANOVA with Tukey’s multiple comparisons was used for the analysis of statistical significance.
Results and discussion
To strengthen the binding efficiency of HSA to the negative charge of the plasmid or siRNA, stPEI with a long-chain alkyl group attached was selected for incorporation into HSA via its binding domain for fatty acids.38 stPEI was synthesized according to a simple previously reported method.25 In brief, to ligate PEI and alkyl groups, EDC was reacted with the carboxylic acid groups of stearic acid to form an active intermediate. This was reacted with NHS to form a more stable amine-reactive intermediate, which improved the binding efficiency. Primary amines of PEI reacted with intermediates of the carboxyl groups to form amide bonds, which became an amphiphilic polymer with stearyl groups as the hydrophobic part and the PEI portion as the hydrophilic part. Based on an FT-IR analysis as shown in Figure 1A, 1,648 cm−1 indicated the carbonyl stretching of amide groups, 2,900 cm−1 indicated C−H stretching of alkenes, and 3,370 cm−1 indicated N−H stretching of amines. The results demonstrated the formation of amide bonds between carboxylic groups of stearic acid and amine groups of PEI without modification of any other functional groups.
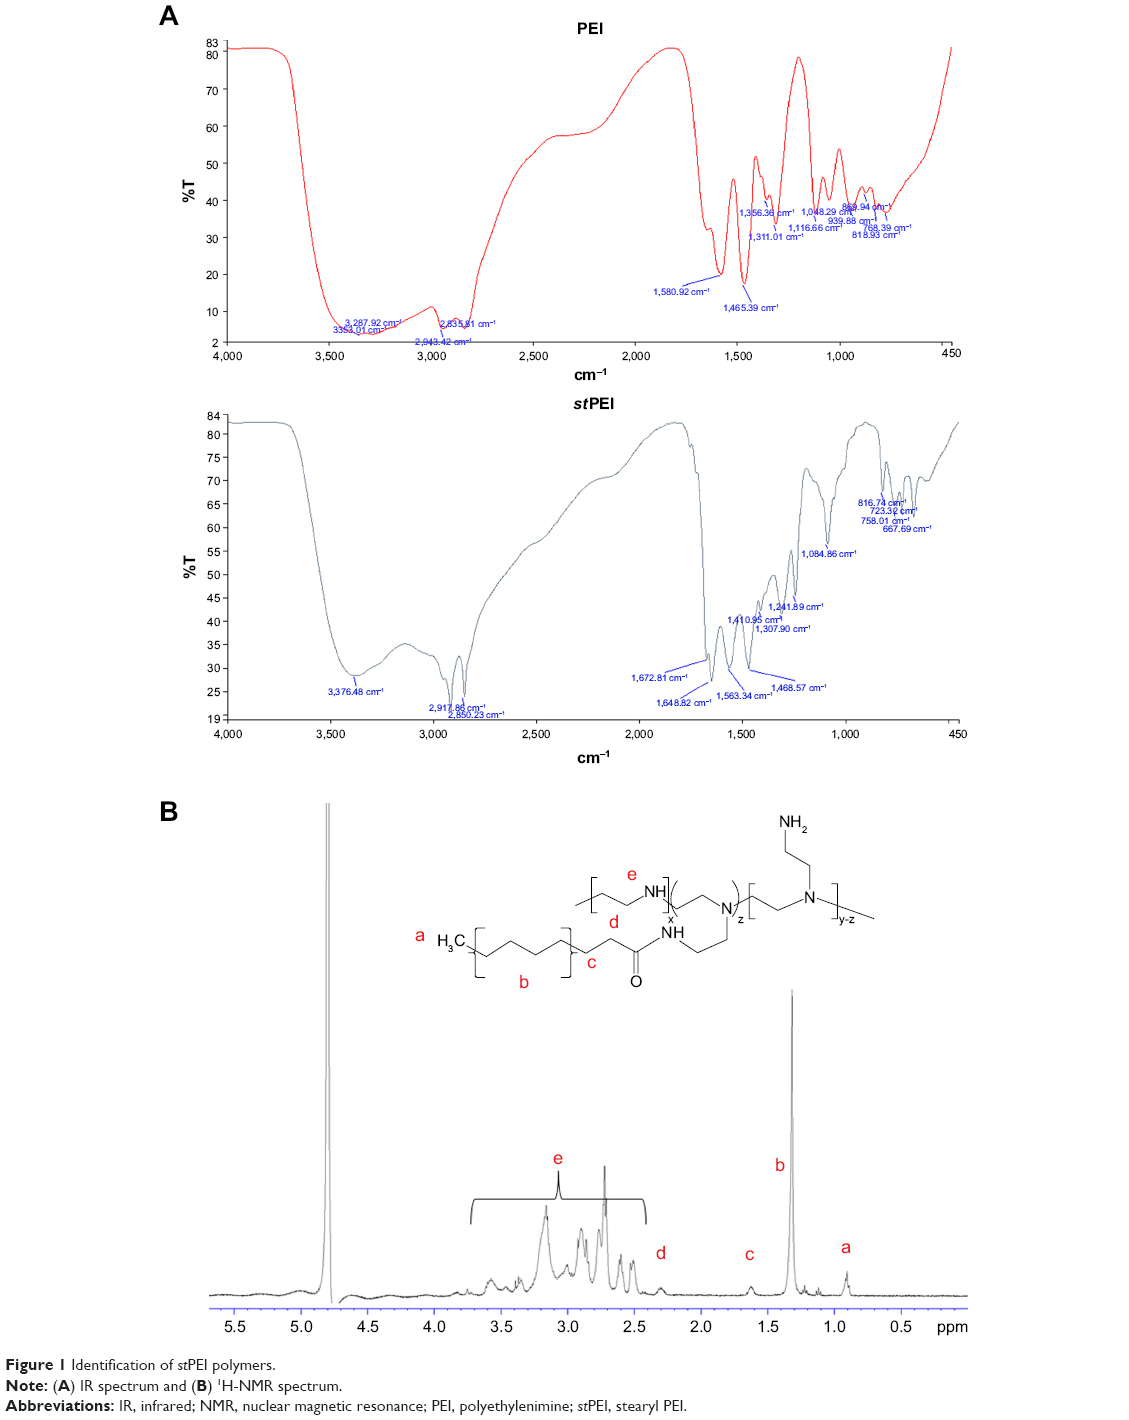 | Figure 1 Identification of stPEI polymers. |
The 1H-NMR spectrum for stPEI is illustrated in Figure 1B. The chemical shift at δ0.90 indicates the terminal −CH3 of stearyl groups, that at δ1.33 indicates the −CH2− of stearyl groups, that at δ1.63 indicates the second to last −CH2− of stearyl groups, that at δ2.33 indicates the last −CH2− of stearyl groups, and that at δ2.50–3.60 indicates the −CH2− of PEI. The spectrum demonstrates the successful grafting of stearyl groups onto the PEI backbone. The degree of substitution was calculated by the following equation:
|
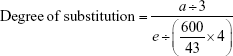
where a is the peak area of terminal −CH3 groups and e is the peak area of PEI. Table 1 summarizes the results of the synthesis with various ratios of acid to PEI. When the ratio of acid to PEI was 7, it demonstrated that the grafting ratio was 1. Hence, stPEI with a grafting ratio of 1 was chosen for complexing with plasmid.
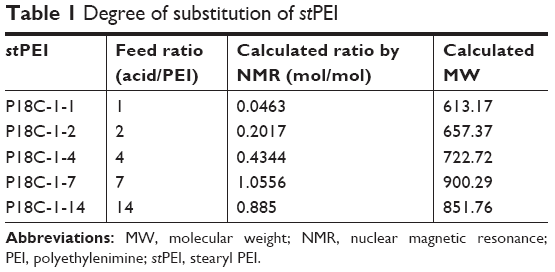 | Table 1 Degree of substitution of stPEI |
PD-L1 knockout of the CRISPR/Cas9 plasmid
After several processes, eg, digestion of the plasmid, annealing of the oligos and plasmid, and amplification, the final plasmids were confirmed by Sanger sequencing for their integrity and accuracy (data not shown). After screening of several candidates, sgRNA-A (GTATGGCAGCAACGTCACGA) and sgRNA-B (GCTTGCGTTAGTGGTGTACT) were selected. After transfecting cells with Lipofectamine 3000 loaded with sgRNA-A or sgRNA-B, the expression of PD-L1 by CT26 cells was evaluated by flow cytometry in comparison to that silenced with siRNA, and the results are shown in Figure 2. It showed that the two sgRNAs really did decrease PD-L1 expression by 20%, and the siRNA group decreased it by 35%. The reason why siRNA was better at silencing PD-L1 expression might have been due to the MW and size of siRNA being small and the plasmid needed to be translated and transcribed. However, gene editing by CRISPR/Cas9 represents permanent gene disruption of PD-L1; therefore, sgRNA-A was selected for constructing CRISPR/Cas9 plasmid.
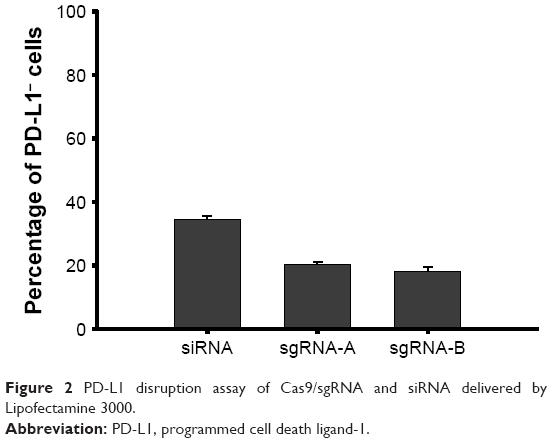 | Figure 2 PD-L1 disruption assay of Cas9/sgRNA and siRNA delivered by Lipofectamine 3000. |
Characterization of plasmid/stPEI/HSA NPs noncovalently bound to the plasmid or siRNA
Physical characteristics, including the mean particle size, polydispersity index (PDI; distribution), and zeta potential, of the plasmid/stPEI/HSA NPs noncovalently bound to various amounts of the plasmid were measured, and the results are listed in Table 2. It showed that the mean particle size for HSA NPs simply loaded with the plasmid/stPEI (F25P0) was around 250 nm, with a PDI of 0.322 and the highest positive zeta potential of 46 mV. With the noncovalent binding of an extra amount of 0.5 μg of plasmid onto plasmid/stPEI/HSA NPs (F25P0.5), the mean particle size decreased to 176.6 nm with a PDI of 0.282 but with a significantly less-positive zeta potential of 19.0 mV. The decrease in the mean particle size for F25P0.5 might have been due to partial neutralization of the positive charge with the negative charge of the adsorbed plasmid, resulting in a smaller extent of repulsion, in turn decreasing the mean particle size. When an increasing amount of plasmid was added for adsorption, the mean particle size gradually increased with a similar PDI value and with a decrease in the zeta potential. Adding an increasing amount of plasmids for adsorption was expected to increase the amount adsorbed, leading to an increase in the mean particle size and a corresponding decrease in the zeta potential. It obviously demonstrated that at an added amount of plasmid of 2 μg per 25 μg of plasmid/stPEI/HSA NPs for absorption, the zeta potential of F25P2, became neutral to around 0.285 mV and aggregated to form microparticles. This phenomenon probably occurred because the zeta potential of F25P2 reached electrical neutrality, allowing particles to aggregate to form microparticles. Following this, an increasing added amount of plasmid for noncovalent binding caused the zeta potential of plasmid/stPEI/HSA NPs to become negative as a result of the negative charge of the adsorbed plasmid. Finally, the absorption of plasmids reached the limit at F25P10, and the particle size of which did not change. Transmission electron microscopy images as shown in Figure 3 reveal that all conformed to similar NP sizes as measured by dynamic light scattering (DLS).
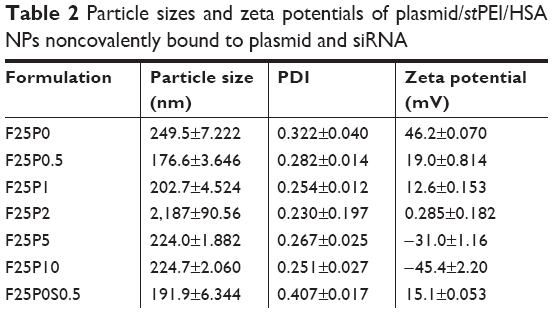 | Table 2 Particle sizes and zeta potentials of plasmid/stPEI/HSA NPs noncovalently bound to plasmid and siRNA |
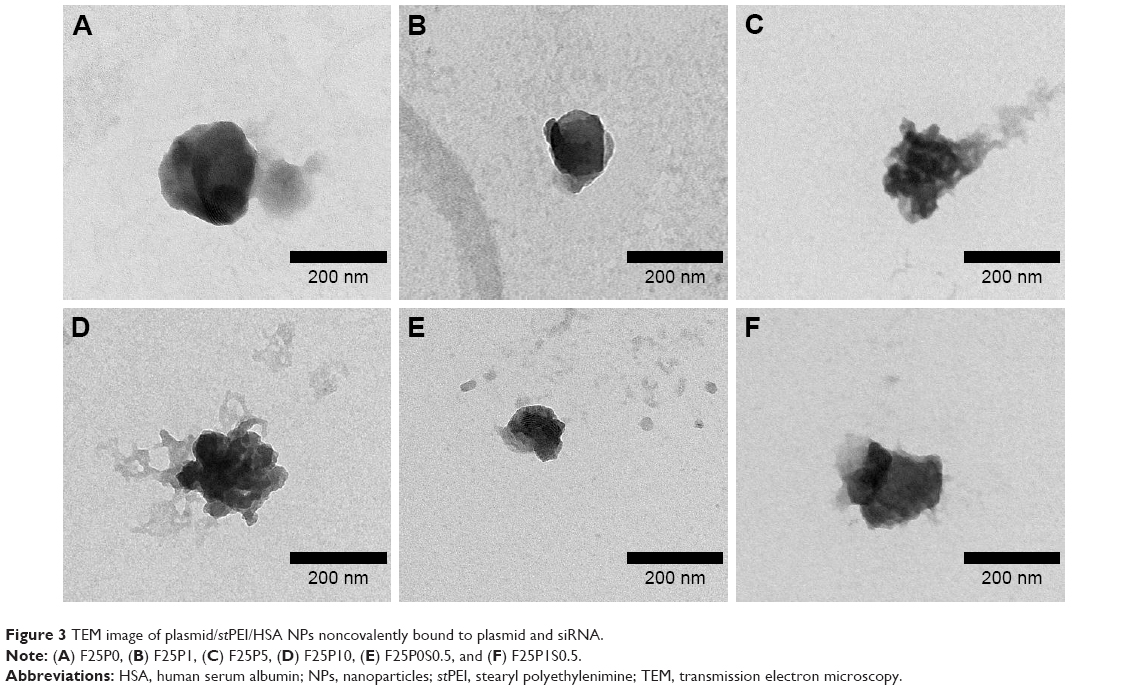 | Figure 3 TEM image of plasmid/stPEI/HSA NPs noncovalently bound to plasmid and siRNA. |
Gel retardation assay of plasmid/stPEI/HSA NPs noncovalently bound to the plasmid or siRNA
The binding affinity of the plasmid that was noncovalently bound to plasmid/stPEI/HSA NPs was evaluated by a gel retardation assay. The results as shown in Figure 4 revealed that plasmids complexed with stPEI as the core were tightly encapsulated in HSA NPs (lane 3), and the plasmid showed no migration under electrophoresis. Further as shown in lanes 4–8, those plasmids noncovalently bound to plasmid/stPEI/HSA NPs could migrate under the influence of electrophoresis, and the corresponding band width increased with an increasing amount of the plasmid added for adsorption. This indicates that the plasmid did noncovalently bind to the plasmid/stPEI/HSA NPs, and it could be released by the disruption of charge–charge interactions.
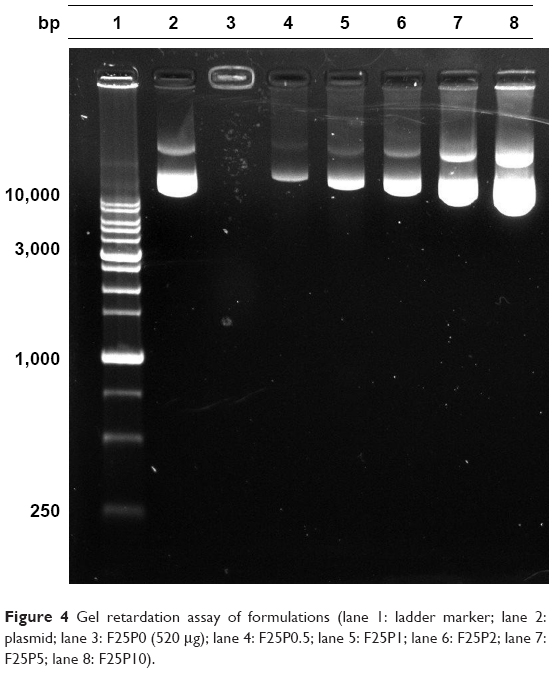 | Figure 4 Gel retardation assay of formulations (lane 1: ladder marker; lane 2: plasmid; lane 3: F25P0 (520 μg); lane 4: F25P0.5; lane 5: F25P1; lane 6: F25P2; lane 7: F25P5; lane 8: F25P10). |
In vitro cytotoxicity studies of plasmid/stPEI/HSA NPs noncovalently bound to the plasmid or siRNA
The cytotoxicity of plasmid/stPEI/HSA NPs noncovalently bound to the plasmid against CT26 cells was analyzed by an MTT assay, and the results are shown in Figure 5. The cytotoxicity of plasmid/stPEI/HSA NPs noncovalently bound to the plasmid was expected to come from the positive charge of stPEI. With an increasing amount of plasmid added for noncovalent binding, the cytotoxicity of plasmid/stPEI/HSA NPs noncovalently bound to the plasmid was observed to decrease with a decreasing positive charge of the plasmid/stPEI/HSA NPs due to increasing neutralization of the positive charge by the negative charge of the noncovalently bound plasmid. Previous research showed that the small MW of PEI with lipid grafting increased the cellular cytotoxicity due to enhancement of polymer interactions with cell membranes.25,26,39,40 As a result, the cytotoxicity of F25P1 and F25P5 decreased, probably due to this neutralization of the positive charge with noncovalent binding of the plasmid, which in turn further reduced membrane insertion by free stPEI. Compared to Lipofectamine, all plasmid/stPEI/HSA NP samples were observed to be slightly less or significantly less toxic.
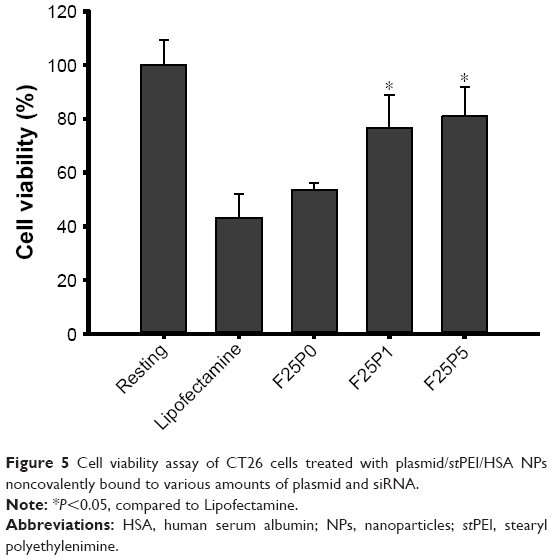 | Figure 5 Cell viability assay of CT26 cells treated with plasmid/stPEI/HSA NPs noncovalently bound to various amounts of plasmid and siRNA. |
Cellular uptake of plasmid/stPEI/HSA NPs noncovalently bound to the plasmid or siRNA
To evaluate cellular uptake, DIO-loaded plasmid/stPEI/HSA NPs bound to various amounts of plasmid were prepared and utilized. After incubation for 2 and 24 hours, the cellular uptake of DIO-loaded plasmid/stPEI/HSA NPs noncovalently bound to various amounts of plasmid (F25P0, F25P1, F25P5, and F25P10) was visualized and quantified by fluorescence microscopy and flow cytometry, and the results are illustrated in Figure 6A and B, respectively, for incubation of 2 and 24 hours. It showed that cellular uptake was in the order of F25P0 > F25P1 > F25P5 > F25P10 with 2 hours of incubation, whereas it was in the order of F25P1 > F25P0 ~ F25P5 > F25 P10 with 24 hours of incubation. The DIO fluorescence intensity was quantified by flow cytometry, and the results as shown in Figure 6A and B also demonstrate similar tendency for both incubation times. It reveals that with the highest positive zeta potential F25P0 was highly taken up by cells even with a short incubation time of 2 hours. This might have been due to the negative charge of cell membranes which promoted binding of the plasmid/stPEI/HSA NPs with a positive charge to cell membranes leading to an increased extent of uptake. On the other hand, those plasmid/stPEI/HSA NPs bearing a decreasing positive charge (F25P1) or with a negative charge (F25P5 and F25P10) were expected to have less cell membrane absorption via charge–charge interactions leading to decreased cellular uptake. Further, when the incubation time increased to 24 hours, the cellular uptake of all plasmid/stPEI/HSA NPs noncovalently bound to various amounts of plasmid appeared to have significantly increased. However, the cellular uptake of F25P0 with 24 hours of incubation time seemed to decrease in comparison to that for F25P1, but was approximately equal to that for F25P5 and greater than that for F25P10. This might be attributed to the higher cytotoxicity of F25P0 against CT26 resulting in a smaller number of cells surviving to engage in cellular uptake of F25P0.
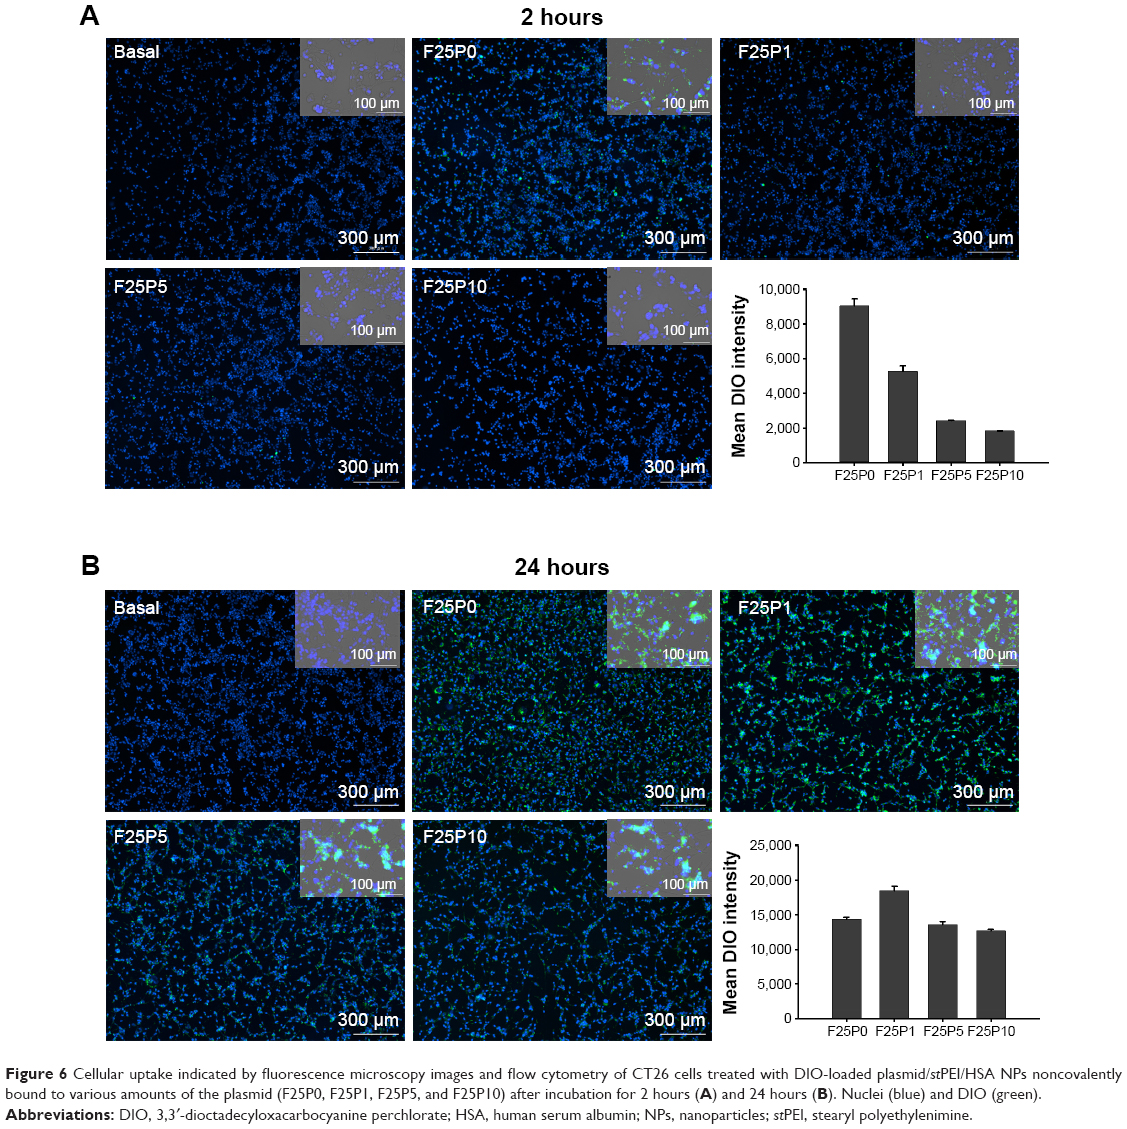 | Figure 6 Cellular uptake indicated by fluorescence microscopy images and flow cytometry of CT26 cells treated with DIO-loaded plasmid/stPEI/HSA NPs noncovalently bound to various amounts of the plasmid (F25P0, F25P1, F25P5, and F25P10) after incubation for 2 hours (A) and 24 hours (B). Nuclei (blue) and DIO (green). |
Transfection efficiency of plasmid/stPEI/HSA NPs noncovalently bound to the plasmid
Due to the plasmid encoding the GFP as a reporter gene, the transfection efficiency of CRISPR/Cas9 for the disruption of PD-L1 expression in CT26 cells could be determined by the fluorescence of the GFP. As shown in Figure 7, F25P1 was able to deliver plasmids into cells, and those released plasmids were translated and transcribed to produce the GFP-Cas9. It also indicated that the endosomal escaping of those NPs after uptake by CT-26 was possible resulting in its transfection.41,42 However, F25P5 failed to deliver plasmids and showed no production of the GFP-Cas9. This might be explained by the negative charge of its zeta potential resulting in lesser amounts of F25P5 being taken up by cells. Further, it was also probably due to the negative charge of F25P5 that was taken up inefficiently releasing the noncovalently bound plasmids for transfection. In addition, F25P0 also failed to transfect plasmids, which revealed that those plasmids complexed at the core of plasmid/stPEI/HSA NPs were unable to be released for functionalization. The gel retardation assay of F25P0 as shown in Figure 4 also showed that plasmids complexed at the core of the plasmid/stPEI/HSA NPs were unable to be released under electrophoresis resulting in no transfection being observed.
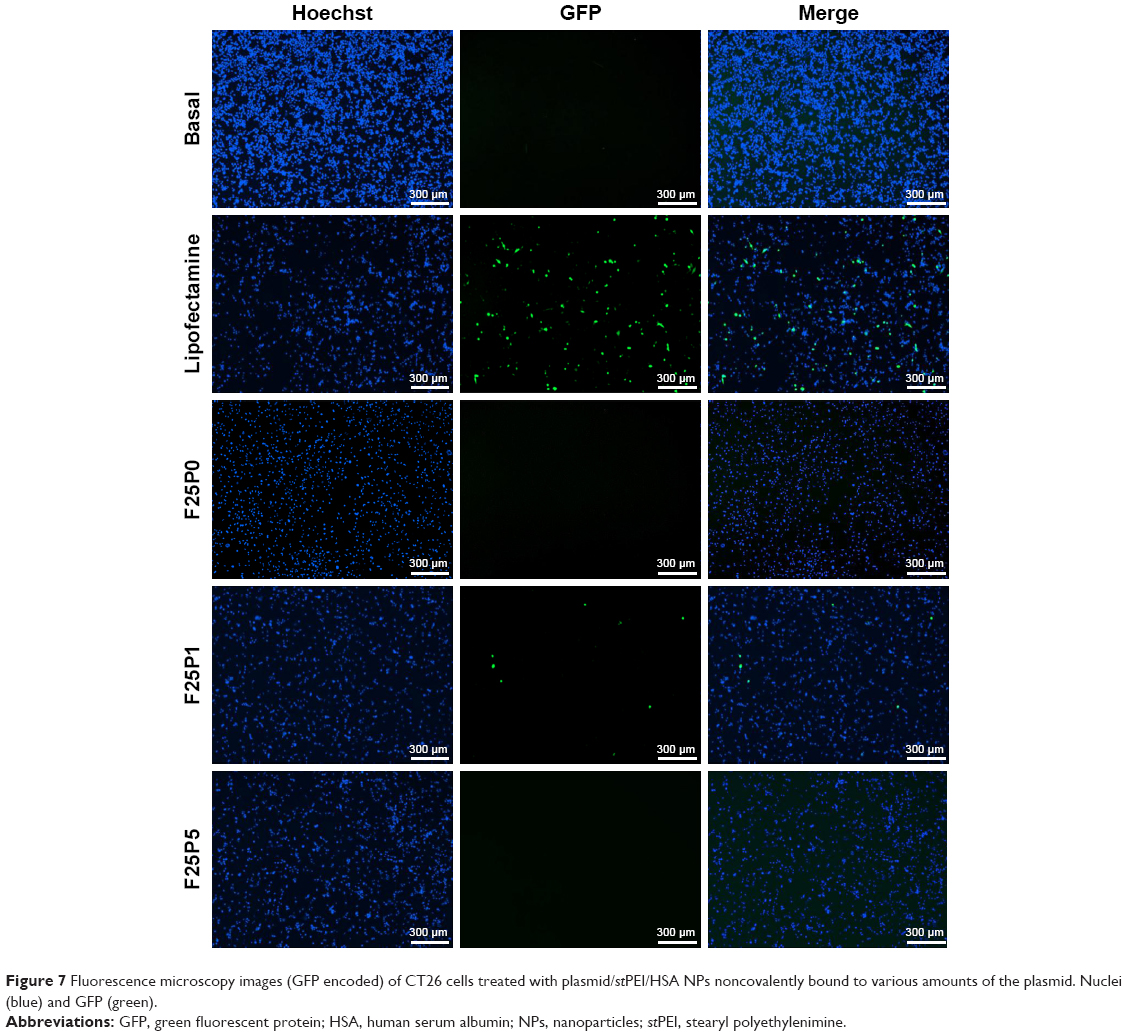 | Figure 7 Fluorescence microscopy images (GFP encoded) of CT26 cells treated with plasmid/stPEI/HSA NPs noncovalently bound to various amounts of the plasmid. Nuclei (blue) and GFP (green). |
Gene disruption efficiency of plasmid/stPEI/HSA NPs noncovalently bound to the plasmid
After delivering plasmids into CT26 cells, the targeted PD-L1 gene was knocked out by the CRISPR/Cas9 complex, and cells could not express the PD-L1 protein. As shown in Figure 8, F25P1 and F25P5 only knocked out about 2% and 0%, respectively, of the cell expression, whereas it was about 13% for plasmid-loaded Lipofectamine. These gene disruption efficiencies were similar to those for transfection efficiencies. This might have resulted from the lower amount of plasmids delivered or released with F25P1 and F25P5.
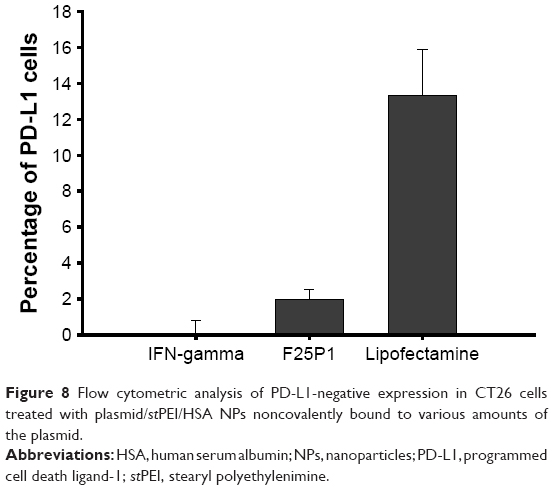 | Figure 8 Flow cytometric analysis of PD-L1-negative expression in CT26 cells treated with plasmid/stPEI/HSA NPs noncovalently bound to various amounts of the plasmid. |
Evaluation of the codelivery of the CRISPR/Cas9 plasmid and siRNA noncovalently bound to plasmid/stPEI/HSA NPs
To increase the PD-L1 disruption efficiency, plasmid/stPEI/HSA NPs were used to simultaneously deliver the CRISPR/Cas9 plasmid and siRNA, which was a combination of long-term and short-term gene disruption, respectively. Two formulations of F25P0S0.5, supplemented with 0.5 μg siRNA, and F25P1S0.5, supplemented with 0.5 μg siRNA and 1 μg of the plasmid, were prepared. As shown in Figure 9, the cytotoxicity study demonstrated an insignificant difference between F25P0S0.5 and F25P1S0.5. However, the cytotoxicity of 2xF25P1S0.5 was 50%, but less toxic than that for 2xF25P1. This was probably due to the greater adsorption of nucleotides which neutralized the positive charge and which decreased the cytotoxicity. Compared to F25P1, the group with twofold concentration, ie, 2xF25P1, revealed higher cytotoxicity, which was close to that for Lipofectamine. Moreover, all plasmid/stPEI/HSA NPs noncovalently bound to siRNA groups exhibited significantly better cell viability than that for Lipofectamine.
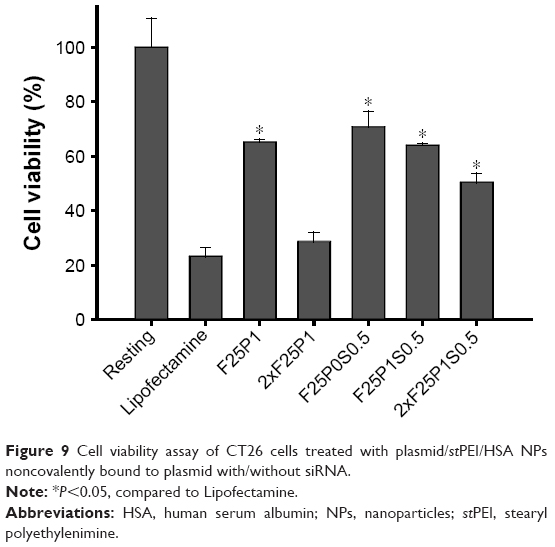 | Figure 9 Cell viability assay of CT26 cells treated with plasmid/stPEI/HSA NPs noncovalently bound to plasmid with/without siRNA. |
As shown in Figure 10A, the transfection efficiencies indicated by the production of the GFP-Cas9 for F25P1 and F25P1S0.5 were similar, but with less extents of transfection efficiency than that for Lipofectamine. This demonstrated that successful delivery of plasmids into cells was observed, and the addition of siRNA did not interfere with the transfection of plasmids. These results were further confirmed by flow cytometry as shown in Figure 10B, which indicates the production of GFP-Cas9. The mean fluorescence intensity produced by GFP-Cas9 showed an insignificant difference between F25P1 and F25P1S0.5.
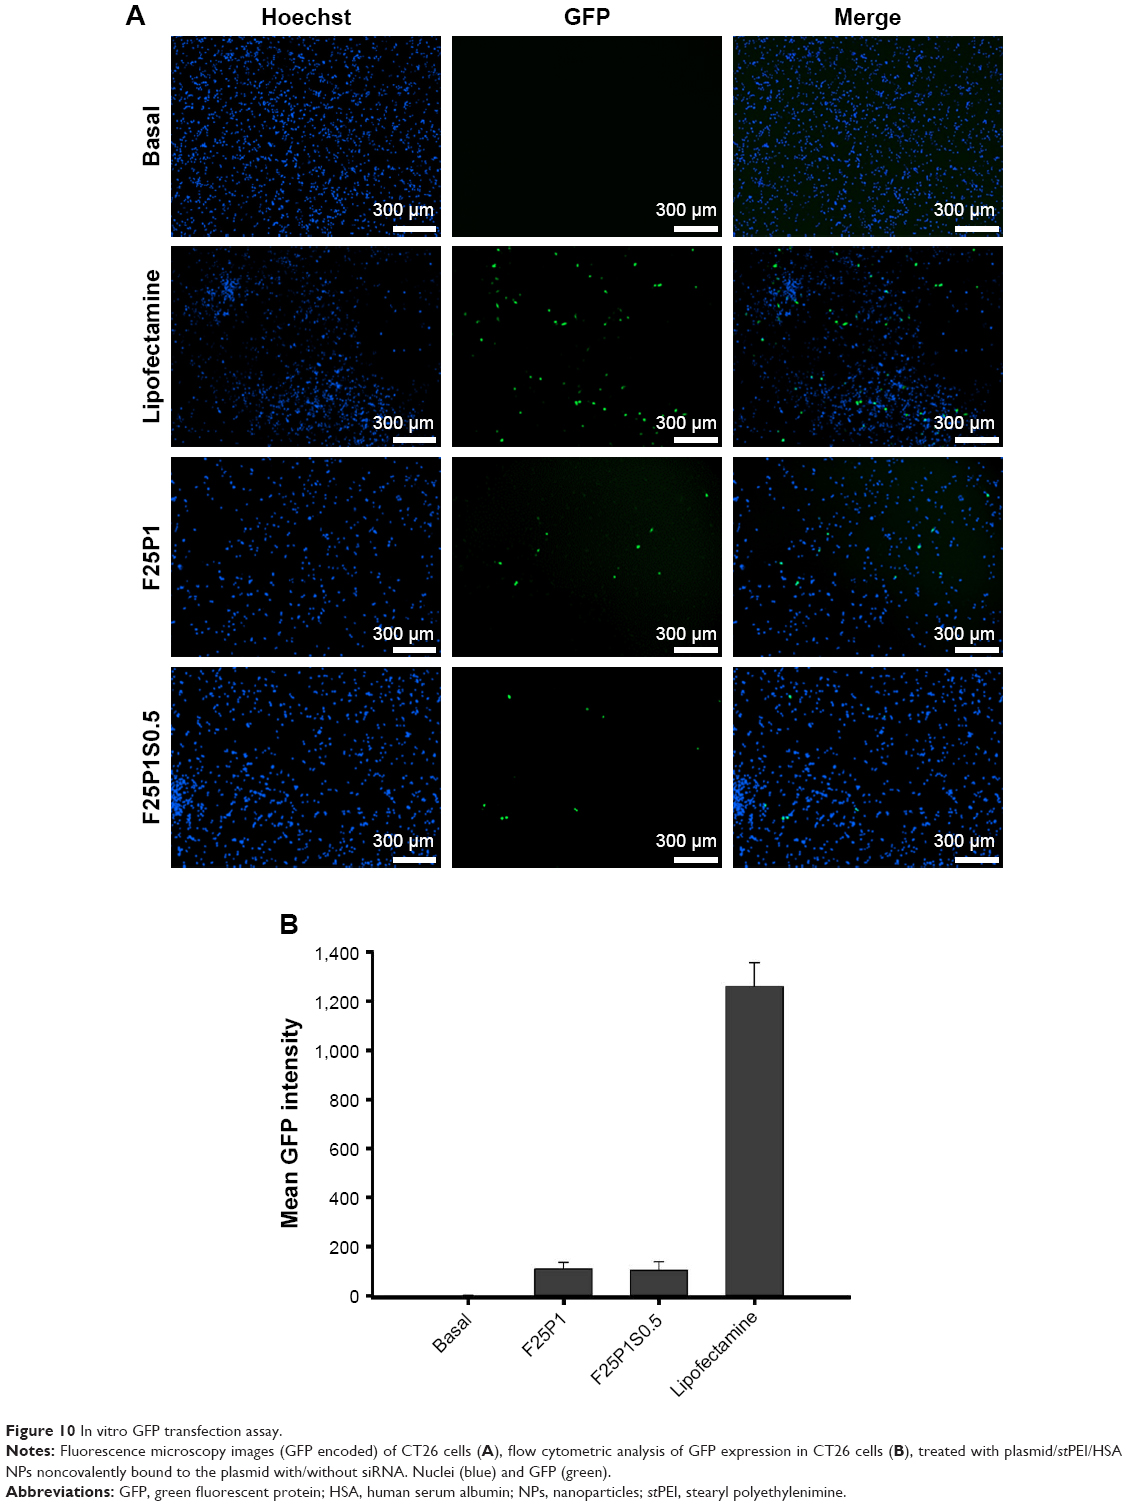 | Figure 10 In vitro GFP transfection assay. |
After the delivery of siRNA and the CRISPR/Cas9 plasmid, those cells that negatively expressed PD-L1 were measured by flow cytometry using PD-L1 antibody fluorescence (Figure 11). Compared to F25P1, F25P0S0.5 with the addition of siRNA alone showed higher suppression of PD-L1 by 11.9%, which was close to the suppression of PD-L1 by plasmids delivered by Lipofectamine. Moreover, the codelivery of CRISPR/Cas9 and siRNA by F25P1S0.5 was found to inhibit PD-L1 expression by 21.2% with a synergistic effect, but 2xF25P1S0.5 did not show better suppression, which might have been due to saturation of the NPs. Overall, those plasmid/stPEI/HSA NPs noncovalently bound to the plasmid and siRNA efficiently delivered the CRISPR/Cas9 plasmid and also siRNA into cells and showed a synergistic effect with the combination.
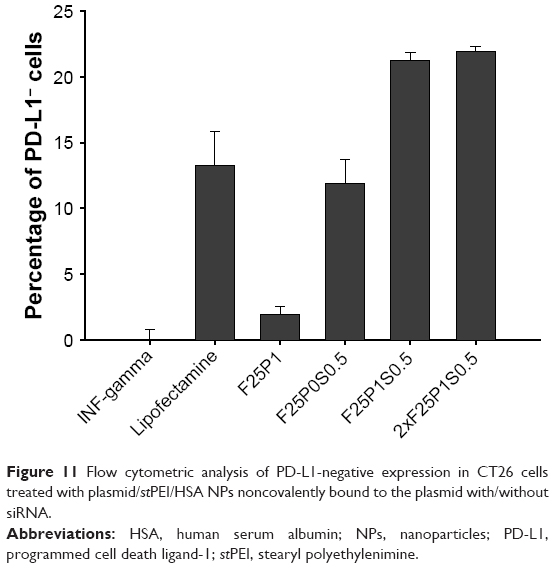 | Figure 11 Flow cytometric analysis of PD-L1-negative expression in CT26 cells treated with plasmid/stPEI/HSA NPs noncovalently bound to the plasmid with/without siRNA. |
Conclusion
stPEI was optimally synthesized by reacting PEI with stearyl groups for binding to the HSA domain to strengthen its noncovalent binding efficiency with plasmids via charge–charge interactions. Two effective PD-L1 knockout sgRNAs were screened and were found to disrupt PD-L1 expression. Taking the abovementioned materials and HSA, the plasmid/stPEI/HSA NPs were optimally prepared with a double emulsion method to deliver plasmids and siRNA with noncovalent binding. The noncovalent binding of either plasmid or siRNA resulted in a significant decrease in the cytotoxicity of stPEI. Optimally, the combination of plasmids and siRNA noncovalently bound to plasmid/stPEI/HSA NPs synergistically disrupted PD-L1 expression. In the future, stPEI/HSA NPs can be a promising carrier to deliver CRISPR/Cas9 and siRNA for other gene targets.
Acknowledgment
This work was supported by the Ministry of Science and Technology, Taiwan, ROC, under grant no 106-2320-B-038-014-MY3.
Disclosure
The authors report no conflicts of interest in this work.
References
Yin H, Kauffman KJ, Anderson DG. Delivery technologies for genome editing. Nat Rev Drug Discov. 2017;16(6):387–399. | ||
Boycott KM, Vanstone MR, Bulman DE, Mackenzie AE. Rare-disease genetics in the era of next-generation sequencing: discovery to translation. Nat Rev Genet. 2013;14(10):681–691. | ||
America PRaMo. Medicines In Development. Rare Diseases: A Report On Orphan Drugs In The Pipeline Presented By America’s Biopharmaceutical Research Companies; 2013. Available from: PhRMAorg http://phrma-docsphrmaorg/sites/default/files/pdf/Rare_Diseases_2013pdf | ||
Cong L, Ran FA, Cox D, et al. Multiplex genome engineering using CRISPR/Cas systems. Science. 2013;339(6121):819–823. | ||
Doudna JA, Charpentier E. Genome editing. The new frontier of genome engineering with CRISPR-Cas9. Science. 2014;346(6213):1258096. | ||
Mali P, Yang L, Esvelt KM, et al. RNA-guided human genome engineering via Cas9. Science. 2013;339(6121):823–826. | ||
Mali P, Esvelt KM, Church GM. Cas9 as a versatile tool for engineering biology. Nat Methods. 2013;10(10):957–963. | ||
Sander JD, Joung JK. CRISPR-Cas systems for editing, regulating and targeting genomes. Nat Biotechnol. 2014;32(4):347–355. | ||
Urnov FD, Rebar EJ, Holmes MC, Zhang HS, Gregory PD. Genome editing with engineered zinc finger nucleases. Nat Rev Genet. 2010;11(9):636–646. | ||
Chen Y, Wang Z, Ni H, Xu Y, Chen Q, Jiang L. CRISPR/Cas9-mediated base-editing system efficiently generates gain-of-function mutations in Arabidopsis. Sci China Life Sci. 2017;60(5):520–523. | ||
Joung JK, Sander JD. TALENs: a widely applicable technology for targeted genome editing. Nat Rev Mol Cell Biol. 2013;14(1):49–55. | ||
He ZY, Deng F, Wei XW, et al. Ovarian cancer treatment with a tumor-targeting and gene expression-controllable lipoplex. Sci Rep. 2016;6:23764. | ||
Osakabe Y, Watanabe T, Sugano SS, et al. Optimization of CRISPR/Cas9 genome editing to modify abiotic stress responses in plants. Sci Rep. 2016;6:26685. | ||
Topalian SL, Hodi FS, Brahmer JR, et al. Safety, activity, and immune correlates of anti-PD-1 antibody in cancer. N Engl J Med. 2012;366(26):2443–2454. | ||
Gaj T, Gersbach CA, Barbas CF. ZFN, TALEN, and CRISPR/Cas-based methods for genome engineering. Trends Biotechnol. 2013;31(7):397–405. | ||
Hille F, Charpentier E. CRISPR-Cas: biology, mechanisms and relevance. Philos Trans R Soc Lond B Biol Sci. 2016;371(1707):20150496. | ||
Savić N, Schwank G. Advances in therapeutic CRISPR/Cas9 genome editing. Transl Res. 2016;168:15–21. | ||
Cox DB, Platt RJ, Zhang F. Therapeutic genome editing: prospects and challenges. Nat Med. 2015;21(2):121–131. | ||
He ZY, Men K, Qin Z, Yang Y, Xu T, Wei YQ. Non-viral and viral delivery systems for CRISPR-Cas9 technology in the biomedical field. Sci China Life Sci. 2017;60(5):458–467. | ||
Yin H, Song CQ, Dorkin JR, et al. Therapeutic genome editing by combined viral and non-viral delivery of CRISPR system components in vivo. Nat Biotechnol. 2016;34(3):328–333. | ||
Li L, He ZY, Wei XW, Gao GP, Wei YQ. Challenges in CRISPR/CAS9 Delivery: potential roles of nonviral vectors. Hum Gene Ther. 2015;26(7):452–462. | ||
Boussif O, Lezoualc’h F, Zanta MA, et al. A versatile vector for gene and oligonucleotide transfer into cells in culture and in vivo: polyethylenimine. Proc Natl Acad Sci U S A. 1995;92(16):7297–7301. | ||
Kunath K, von Harpe A, Fischer D, et al. Low-molecular-weight polyethylenimine as a non-viral vector for DNA delivery: comparison of physicochemical properties, transfection efficiency and in vivo distribution with high-molecular-weight polyethylenimine. J Control Release. 2003;89(1):113–125. | ||
Guo G, Zhou L, Chen Z, et al. Alkane-modified low-molecular-weight polyethylenimine with enhanced gene silencing for siRNA delivery. Int J Pharm. 2013;450(1–2):44–52. | ||
Thapa B, Plianwong S, Remant Bahadur KC, Rutherford B, Uludağ H. Small hydrophobe substitution on polyethylenimine for plasmid DNA delivery: Optimal substitution is critical for effective delivery. Acta Biomater. 2016;33:213–224. | ||
Liu S, Huang W, Jin MJ, et al. High gene delivery efficiency of alkylated low-molecular-weight polyethylenimine through gemini surfactant-like effect. Int J Nanomedicine. 2014;9:3567–3581. | ||
Kratz F. Albumin as a drug carrier: design of prodrugs, drug conjugates and nanoparticles. J Control Release. 2008;132(3):171–183. | ||
Stehle G, Sinn H, Wunder A, et al. Plasma protein (albumin) catabolism by the tumor itself – implications for tumor metabolism and the genesis of cachexia. Crit Rev Oncol Hematol. 1997;26(2):77–100. | ||
Elsadek B, Kratz F. Impact of albumin on drug delivery – new applications on the horizon. J Control Release. 2012;157(1):4–28. | ||
Malhotra A, Mittal BR. SiRNA gene therapy using albumin as a carrier. Pharmacogenet Genomics. 2014;24(12):582–587. | ||
Nicolì E, Syga MI, Bosetti M, Shastri VP. Enhanced gene silencing through human serum albumin-mediated delivery of polyethylenimine-siRNA polyplexes. PLoS One. 2015;10(4):e0122581. | ||
Thao LeQ, Byeon HJ, Lee C, et al. Doxorubicin-bound albumin nanoparticles containing a TRAIL protein for targeted treatment of colon cancer. Pharm Res. 2016;33(3):615–626. | ||
Min SY, Byeon HJ, Lee C, et al. Facile one-pot formulation of TRAIL-embedded paclitaxel-bound albumin nanoparticles for the treatment of pancreatic cancer. Int J Pharm. 2015;494(1):506–515. | ||
Wang X, Teng F, Kong L, Yu J. PD-L1 expression in human cancers and its association with clinical outcomes. Onco Targets Ther. 2016;9:5023–5039. | ||
Haeussler M, Schönig K, Eckert H, et al. Evaluation of off-target and on-target scoring algorithms and integration into the guide RNA selection tool CRISPOR. Genome Biol. 2016;17(1):148. | ||
Kleinovink JW, Marijt KA, Schoonderwoerd MJA, van Hall T, Ossendorp F, Fransen MF. PD-L1 expression on malignant cells is no prerequisite for checkpoint therapy. Oncoimmunology. 2017;6(4):e1294299. | ||
Wu Y, Gu W, Tang J, Xu ZP, Zp X. Devising new lipid-coated calcium phosphate/carbonate hybrid nanoparticles for controlled release in endosomes for efficient gene delivery. J Mater Chem B. 2017;5(34):7194–7203. | ||
Choi JK, Ho J, Curry S, Qin D, Bittman R, Hamilton JA. Interactions of very long-chain saturated fatty acids with serum albumin. J Lipid Res. 2002;43(7):1000–1010. | ||
Neamnark A, Suwantong O, Bahadur RK, Hsu CY, Supaphol P, Uludağ H. Aliphatic lipid substitution on 2 kDa polyethylenimine improves plasmid delivery and transgene expression. Mol Pharm. 2009;6(6):1798–1815. | ||
Bahadur KC, Landry B, Aliabadi HM, Lavasanifar A, Uludağ H. Lipid substitution on low molecular weight (0.6–2.0 kDa) polyethylenimine leads to a higher zeta potential of plasmid DNA and enhances transgene expression. Acta Biomater. 2011;7(5):2209–2217. | ||
Li J, Liang H, Liu J, Wang Z. Poly (amidoamine) (PAMAM) dendrimer mediated delivery of drug and pDNA/siRNA for cancer therapy. Int J Pharm. 2018;546(1–2):215–225. | ||
Liu J, Li J, Liu N, et al. In vitro studies of phospholipid-modified PAMAM-siMDR1 complexes for the reversal of multidrug resistance in human breast cancer cells. Int J Pharm. 2017;530(1–2):291–299. |
 © 2018 The Author(s). This work is published and licensed by Dove Medical Press Limited. The full terms of this license are available at https://www.dovepress.com/terms.php and incorporate the Creative Commons Attribution - Non Commercial (unported, v3.0) License.
By accessing the work you hereby accept the Terms. Non-commercial uses of the work are permitted without any further permission from Dove Medical Press Limited, provided the work is properly attributed. For permission for commercial use of this work, please see paragraphs 4.2 and 5 of our Terms.
© 2018 The Author(s). This work is published and licensed by Dove Medical Press Limited. The full terms of this license are available at https://www.dovepress.com/terms.php and incorporate the Creative Commons Attribution - Non Commercial (unported, v3.0) License.
By accessing the work you hereby accept the Terms. Non-commercial uses of the work are permitted without any further permission from Dove Medical Press Limited, provided the work is properly attributed. For permission for commercial use of this work, please see paragraphs 4.2 and 5 of our Terms.