")
Back to Journals » Drug Design, Development and Therapy » Volume 15
Starch Nanoparticles for Enhancement of Oral Bioavailability of a Newly Synthesized Thienopyrimidine Derivative with Anti-Proliferative Activity Against Pancreatic Cancer
Authors Gardouh AR , Srag El-Din AS , Salem MSH , Moustafa Y, Gad S
Received 28 May 2021
Accepted for publication 8 July 2021
Published 16 July 2021 Volume 2021:15 Pages 3071—3093
DOI https://doi.org/10.2147/DDDT.S321962
Checked for plagiarism Yes
Review by Single anonymous peer review
Peer reviewer comments 2
Editor who approved publication: Dr Tuo Deng
Ahmed R Gardouh,1,2 Ahmed SG Srag El-Din,3 Mohamed SH Salem,4,5 Yasser Moustafa,6,7 Shadeed Gad1
1Department of Pharmaceutics and Industrial Pharmacy, Faculty of Pharmacy, Suez Canal University, Ismailia, Egypt; 2Department of Pharmaceutical Sciences, Faculty of Pharmacy, Jadara University, Irbid, 21110, Jordan; 3Department of Pharmaceutics, Faculty of Pharmacy, Delta University for Science & Technology, Gamasa City, Egypt; 4Pharmaceutical Organic Chemistry Department, Faculty of Pharmacy, Suez Canal University, Ismailia, 41522, Egypt; 5The Institute of Scientific and Industrial Research (ISIR), Osaka University, Ibaraki-shi, Osaka, 567-0047, Japan; 6Department of Pharmacology and Toxicology, Faculty of Pharmacy, Suez Canal University, Ismailia, Egypt; 7Department of Pharmacology and Toxicology, Faculty of Pharmacy, Badr University in Cairo, Badr City, Cairo, Egypt
Correspondence: Ahmed SG Srag El-Din
Department of Pharmaceutics, Faculty of Pharmacy, Delta University for Science & Technology, International Coastal Road, Gamasa City, Mansoura, Dakhliya, 35712, Egypt
Tel +201008966506
Email [email protected]
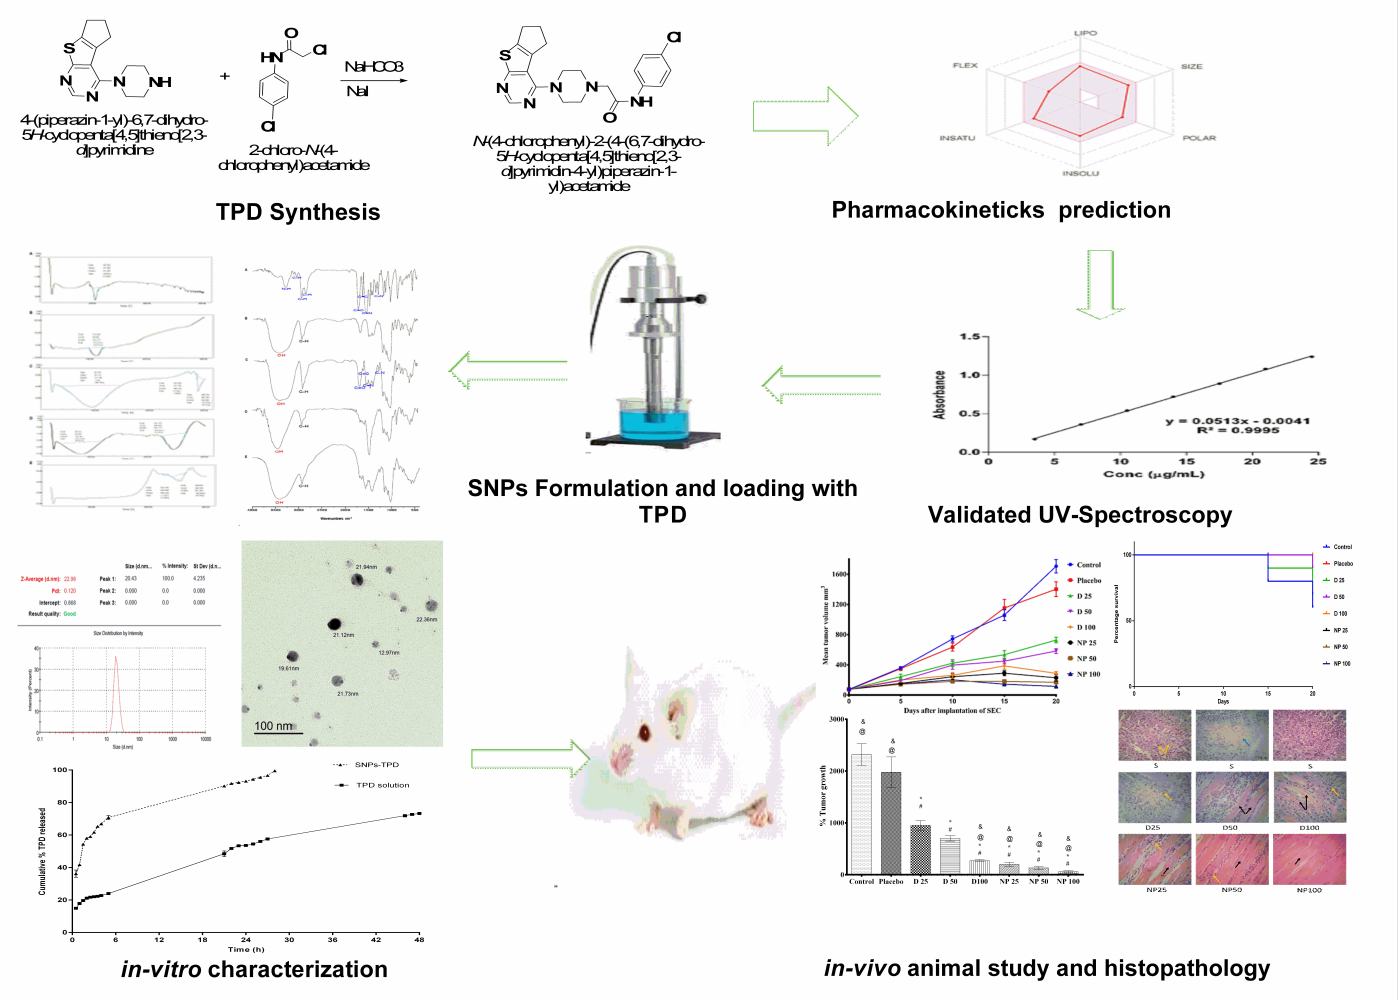
Purpose: This research aimed to improve water solubility and oral bioavailability of a newly synthesized thienopyrimidine derivative (TPD) with anti-pancreatic cancer activity by loading on starch nanoparticles (SNPs).
Methods: TPD was synthesized, purified and its ADME behavior was predicted using Swiss ADME software. A UV spectroscopy method was developed and validated to measure TPD concentration at various dosage forms. SNPs loaded with TPD (SNPs-TPD) were prepared, characterized for particle size, polydispersity index, zeta potential, transmission electron microscopy, Fourier transform infrared spectroscopy (FT-IR), differential scanning calorimetry (DSC), entrapment efficiency, in-vitro release, and in-vivo animal study.
Results: The Swiss ADME results showed that TPD can be administered orally; however, it has low oral bioavailability (0.55) and poor water solubility. The significant regression coefficient of the calibration curve (r2 = 0.9995), the precision (%RSD < 0.5%) and the accuracy (99.46− 101.72%) confirmed the efficacy of the developed UV method. SNPs-TPD had a spherical monodispersed (PDI= 0.12) shape, nanoparticle size (22.98 ± 4.23) and good stability (− 21 ± 4.72 mV). Moreover, FT-IR and DSC revealed changes in the physicochemical structure of starch resulting in SNPs formation. The entrapment efficiency was 97% ± 0.45%, and the in-vitro release showed that the SNPs enhanced the solubility of the TPD. The in-vivo animal study and histopathology showed that SNPs enhanced the oral bioavailability of TPD against solid Ehrlich carcinoma.
Conclusion: SNPs-TPD were superior in drug solubility and oral bioavailability than those obtained from TPD suspension.
Keywords: thienopyrimidine derivative, starch nanoparticles, pancreatic cancer, solid Ehrlich carcinoma
Graphical Abstract:
Introduction
Pancreatic cancer is the world’s seventh leading cause of cancer death, leading to more than 432,000 deaths each year according to the Global Cancer Observatory (GLOBOCAN) 2020 statistics.1 It is expected that pancreatic cancer becomes the third-largest cause of death occurred by cancer in the European Union. This could be attributed to its low 5-year survival rate.2,3 Despite the survival rate of ten to 25 percentage, surgery is the only curative treatment.4 Recently, The European Study Group for Pancreatic Cancer (ESPAC) concluded that the combination of fluorouracil and folinic acid (leucovorin) did not improve the median survival time after surgery.5 Furthermore, a recent study concluded that six months of nanoparticle albumin-bound paclitaxel and gemcitabine did not improve the survival rate compared to gemcitabine alone for surgically resected pancreatic adenocarcinoma (APACT) study.6 Over the last years, no significant advances in pancreatic cancer therapies have been achieved. The challenges related to the low impact and severe toxicity of traditional drugs are still alarming. Hence, there is an increasing need to develop new strategies and choices for combating pancreatic cancer.
N-(4-Chlorophenyl)-2- [4-(6,7-dihydro-5H-cyclopenta [4,5] thieno[2,3-d] pyrimidin-4-yl) piperazin-1-yl] acetamide is a thienopyrimidine derivative (TPD) like the first-generation antitumor protein tyrosine kinase (imatinib), which showed anti-proliferative activity against the cell line of pancreatic carcinoma (PANC-1). TPD showed high cytotoxicity (IC50 = 5.4 μM) compared to imatinib (IC50= 46.31 μM). Additionally, TPD showed an excellent inhibitory effect on platelet-derived growth factor receptors.7 TPD was compared to imatinib because imatinib is an FDA-approved tyrosine kinase inhibitor that shows high activity towards different kinases, including PDGFR-alpha. Moreover, it was investigated in clinical trials Phase II as anti-pancreatic cancer. As TPD has the same mechanism of action (PDGFR-alpha kinase inhibitor) and shows a similar structural design, imatinib was suggested as an optimum reference drug to compare the cytotoxicity of TPD against it.8–10
Despite their high potency, TPD showed poor solubility and poor bioavailability, as predicted by the Swiss ADME online tool,11 which hinders its pharmaceutical application. However, delivery systems can improve TPD solubility and bioavailability.
As a new drug candidate, TPD requires a validated analytical method to determine its concentration in various delivery systems. Therefore, one of our objectives in this study is to develop a simple UV spectrophotometric method to determine TPD’s concentration in the delivery system that will be used. UV spectrophotometry is still the most common method due to its related advantageous features; simple, precise, cost-effective, rapid, and easily controllable. Analytical parameters involving linearity, accuracy, specificity, robustness, precision, the detection limit, and the quantification limit were evaluated according to the International Conference of Harmonization (ICH) guidelines.12
In order to enhance the water solubility and bioavailability of TPD, starch nanoparticles (SNPs) have been utilized.13,14 The SNPs were chosen because of their distinctive properties that are dissimilar to their bulk ingredients. SNPs are prepared from starch, a renewable, biodegradable polymer created by many plants.15,16 Another fascinating feature of SNPs is their ability to encapsulate various bioactive compounds.17 SNPs were reported to enhance the water solubility and bioavailability of several poorly water-soluble drugs14 like silibinin,18 itraconazole,19 lovastatin,20 and curcumin.21 This role can be understood in the light of the hydrophilic nature of SNPs, their nano-porous structure, and small PS that provide a large surface area which allows for more significant interaction with the water. Furthermore, the high number of hydroxyl groups on the starch surface facilitates binding with other functional groups. All the previous properties are desirable for a carrier to enhance water solubility and bioavailability of poorly water-soluble drugs like TPD.
Several methods were reported to prepare SNPs including; high-pressure homogenization,22–24 ultra-sonication,25–27 extrusion,28 gamma radiation,29 dialysis technique,30 acid hydrolysis,31–33 and nanoprecipitation.34–40 Recently, it was reported that the combination of these methods afforded nanoparticles with more desirable properties.41 A study prepared SNPs by combining ultra-sonication and nanoprecipitation at ambient temperature produced SNPs with a high percentage of entrapment efficiency (EE%) and low cost.42 At the current study, SNPs were prepared by an in-situ combination of ultrasound, nanoprecipitation, and alkali hydrolysis. SNPs loaded with TPD (SNPs-TPD) were characterized for particle size (PS) analysis, polydispersity index (PDI), zeta potential analysis, differential scanning calorimetry (DSC), Fourier transform infrared spectroscopy (FT-IR), Transmission electron microscopy (TEM), EE%, in-vitro release, and in-vivo animal studies.
Materials and Methods
Materials
Reagents for TPD synthesis were purchased from Sigma-Aldrich, Merck, Alfa Aesar and used without any further purification. Native maize starch was procured from Biotech for Laboratory Chemicals, Cairo, Egypt. Tween 80, sodium bicarbonate, and sodium iodide were procured from Sigma-Aldrich Chemical Co., USA. Absolute ethanol, Isopropyl alcohol, and sodium hydroxide were of analytical grade. The dialysis membrane was procured from SERVA electrophoresis GmbH, Germany. Dibasic sodium phosphate (Na2HPO4), potassium dihydrogen orthophosphate (KH2PO4), and triethanolamine were all of the pharmaceutical grades and were used as obtained.
Synthesis and Purification of TPD
TPD was synthesized based on the mentioned procedure by Salem et al.7 In Brief, sodium bicarbonate (0.2 g, 2.36 mmol), and sodium iodide (0.51 g, 2.36 mmol) were added to a solution of 4-(piperazin-1-yl)-6,7-dihydro-5H-cyclopenta [4,5] thieno[2,3-d] pyrimidine (2.36 mmol) and 2-chloro-N-(4-chlorophenyl) acetamide (2.36 mmol) in 30 mL of dimethylformamide. The reaction mixture was stirred up for 36 h at room temperature and then added to 50 mL distilled water to afford a yellow precipitate. The precipitate was filtered and left to dry in vacuo. The resultant solid was extra purified on silica-gel column chromatography (n-hexane/IPA = 9/1 as eluent) to afford TPD as pure yellow crystals in a 95% yield. The structure was confirmed via 1H NMR and 13C NMR spectral analysis, FT-IR, and HRMS. The purity of the compound was confirmed with CHN elemental analysis (for further details; Results and Discussion section and Figures S1 and S2).
Swiss ADME
Swiss ADME software (http://www.swissadme.ch) of the Swiss Institute of bioinformatics (http://www.sib.swiss) was accessed on the webserver to estimate individual ADME behavior of TPD.11,43
Development and Validation of UV Spectrophotometric Method for TPD Determination
Instrumentation
All spectrophotometric measurements were conducted using a UV–Vis spectrophotometer (Acculab UVS, USA). 1-cm paired quartz cells were used for absorbance measurements. An analytical balance (KERN – ABJ-NM/ABSN) was used to measure the samples. Analytical parameters were evaluated according to ICH guidelines.12
Determination of the Maximum Absorption Wavelength
A stock standard solution holding 350 µg/mL of TPD was prepared in a solvent solution containing phosphate buffer pH = 6.8 and isopropyl alcohol at a ratio of 50:50 v/v. Samples prepared from the stock solution and UV spectroscopy scanning (200–600 nm) were conducted using the solvent solution as a blank to determine the λmax of TPD. The peak with the maximum absorption was observed at λmax = 236 nm.
Linearity
The linearity of the analytical method was accomplished for seven different concentrations (3.5, 7, 10.5, 14, 17.5, 21, and 24.5 µg/mL) of TPD in solvent solution (phosphate buffer pH=6.8 and isopropyl alcohol at a ratio of 50:50 v/v). The test was conducted three times over the day in triplicate (total n = 9). The data were collected to trace the linearity curve, regression equation, and correlation coefficient determination. The limit of detection (LOD) and Limit of Quantification (LOQ) of the suggested UV method were determined. The LOD and LOQ were calculated using the following equations.44

Precision
Intra-day and inter-day disparities were measured to judge the precision of the method. Precision was determined for three different well-known concentrations of TPD (7, 10.5, and 17.5 g/mL), which were prepared from the stock solutions. The absorbance of the three concentrations was measured three times per day in triplicate (n =9) to determine intraday disparities, and three times daily for three days in triplicate (n =27) to determine inter-day. The linearity curve was used to measure the percentage relative standard deviation (% RSD) for the chosen concentrations.45
Accuracy and Repeatability
The accuracy of the proposed method was evaluated by calculating the mean percentage recovery of TPD at three different concentrations levels 7, 10.5, and 17.5 µg/mL. The repeatability of the UV method was figured out by finding the absorbance of the three different concentrations and the percentage was computed using the linearity curve. Sample concentrations were calculated in triplicate.
Starch Nanoparticles Preparation
SNPs were formulated using in-situ combinations of ultrasound, nanoprecipitation, and alkali hydrolysis. Briefly, at ambient temperature, 50 mg of native maize starch was dissolved in 10 mL of 0.1 N sodium hydroxide as the dissolving medium and sonicated for 10 min at (AMP 80% - Pulse 02/02) using an ultrasonicator (Q125 Sonicator, Qsonica, USA). A clear solution was obtained. Next, 600 µL of Tween 80 was added and sonicated for 10 min, and then 10 mL absolute ethanol was added dropwise under sonication for another 10 min. The preparation was then placed in a closed glass tube until the powder was completely precipitated. The precipitated powder was filtered through Whatman 1 filter paper to obtain SNPs. The obtained SNPs were left to dry at room temperature before further characterization. A power of 80% was chosen because it was reported that above 80% of power, heavy cavitation causes bubbles to coalesce, reducing the effectiveness of chemical and physical impacts.27
SNPs-TPD Preparation
The SNPs-TPD were prepared by ultrasonication. First, TPD (10 mg) was dissolved in 1 mL isopropyl alcohol and added to 10 mL deionized water containing 50 mg SNPs and sonicated for 10 min at (AMP 80% - Pulse 02/02) using an ultrasonicator (Q125 Sonicator, Qsonica, USA).
Characterization of SNPs-TPD
Particle Size and Polydispersity Index Determination
The SNPs-TPD were diluted with deionized water (0.01%, w/v), and the PS and PDI were estimated using a Malvern size distribution analyzer (Zeta-sizer, Malvern Instruments, UK) at 25°C.46
Zeta Potential
The SNPs-TPD were diluted with deionized water (0.01%, w/v), and the electrical charge of SNPs-TPD was measured using a Malvern size distribution analyzer (Zeta-sizer, Malvern Instruments, UK) at 25°C.46
Transmission Electron Microscopy
The morphology of the SNPs-TPD was visualized using transmission electron microscopy (TEM) (JEM-2100, Jeol, Japan). A dry carbon-coated copper grid with a droplet of SNPs suspension was stained with 1% phosphotungstic acid and allowed to dry again. Subsequently, it was examined and photographed using TEM.47–49
Fourier Transform Infrared Spectroscopy
The chemical modifications of TPD, native starch, physical mixture (TPD and native starch), SNPs, and SNPs-TPD were investigated using Fourier transform infrared spectroscopy (FT-IR) (BRUKER, I FS 66, Germany). Samples (1–2 mg) were ground, mixed with potassium bromide, compressed into disks, and FT-IR spectra were recorded. The scanning range was 4000–400 cm−1.50
Differential Scanning Calorimetry
Thermal analysis of TPD, native starch, physical mixture (TPD and native starch), SNPs, and SNPs-TPD were performed using (Shimadzu DSC-50, Japan). The instrument was calibrated using indium, samples (1–1.5 mg) were accurately measured, placed in an aluminum pan, heated at a temperature of 10°C/min from 25 to 300°C, and nitrogen was used as a purging gas at a flow rate of 15 mL/min.26
Entrapment Efficiency
Entrapment efficiency (EE%) was determined according to the following. First, TPD was dissolved in isopropyl alcohol, added to SNPs suspended in a phosphate buffer pH= 6.8, and sonicated for 10 min at (AMP 80% - Pulse 02/02) via ultrasonicator (Q125 Sonicator, Qsonica, USA) to obtain SNPs-TPD. After that, the prepared formulation was subjected to centrifugation at 4 °C and 10,000 rpm for 10 min using a refrigerated microcentrifuge (SIGMA 1–14 K, Osterode, Germany),46 the unentrapped free TPD was filtered through a 0.22 mm filter and diluted with isopropyl alcohol and the EE% was measured using the developed UV method. Samples were measured in triplicate and the EE% was computed using the following equation.
Where DT is the theoretical TPD quantity, and DS is the detected TPD quantity.
In vitro Release Study
An in-vitro release study was implemented by the dialysis method described by Bongiovì, Fiorica et al with modifications.51 Briefly, an aliquot of TPD solution (TPD in isopropyl alcohol) and SNPs-TPD (equivalent to 0.55 mg of TPD) were placed in dialysis bags (MW CO 12 kDa), previously hydrated overnight in phosphate buffer pH=6.8 as a release media to certify complete swelling and fixed pore diameter throughout the experiment.52 The ratio between the internal and external phases was 1:40 (v/v). The study was conducted for 48 h at 37 ± 0.5°C. To determine the amount of TPD released, 2 mL of the samples were collected at different time intervals and replaced with the same volume of fresh buffer. The concentration of TPD released in the collected solutions was assayed using a UV-Vis spectrophotometer at 236 nm. The percentage of TPD released was calculated using the following equation:

In vivo Animal Study
Animals
Eighty adult female Swiss albino mice weighing 22–25 g were obtained from the animal house of pharmacology and experimental oncology unit, national cancer institute, Cairo University, Egypt. Animals were fed standard pellet chow (EL-Nasr Chemical Company, Cairo, Egypt) and provided access to water ad libitum. The animals were kept in polycarbonate cages under standard laboratory conditions (24± 1°C, 12-h light: 12-h dark cycle). For adaptation, the animals were housed under identical conditions for 1 week before the experiment. The institution’s research ethics committee approved the experimental work described in this study at the Faculty of Pharmacy, Suez Canal University, Ismailia, Egypt (Approval number of 201809PHDA2). The ethical guidelines of the National Institutes of Health Guide for the Care and Use of Laboratory Animals (eighth edition) were strictly followed. Qualified personnel handled mice feeding, handling, and drug delivery throughout the study, and any contaminated food and feces were handled regularly.
Ehrlich Ascites Carcinoma Cells
Ehrlich ascites carcinoma (EAC) cells were obtained from the national cancer institute’s pharmacology and experimental oncology unit, Cairo University, Egypt.53 Female Swiss albino tumor-bearing mice were euthanized under aseptic conditions. The ascites fluid was collected from tumor-bearing mice by needle aspiration from the peritoneal cavity and washed three times with normal saline followed by centrifugation to obtain EAC cells. Tumor cell counts were determined using the trypan blue dye exclusion method. The cells were judged microscopically using a hemocytometer, suspended in normal saline so that every 0.1 mL contained 5×10⁵ viable EAC cells.54
Solid Ehrlich Carcinoma Model
The solid Ehrlich carcinoma (SEC) model was conducted by inoculating all mice with 0.1 mL containing 5×10⁵ viable EAC cells/mice in the right hind limb (thigh) subcutaneously. When the primary tumor reached a size of 50–100 mm3 was assigned as day “zero”. On day one, mice were randomized and divided into 8 groups (n =10) and classified as shown in Table 1. The study was conducted for 21 days, and a feeding tube was used to give the different suspensions orally.
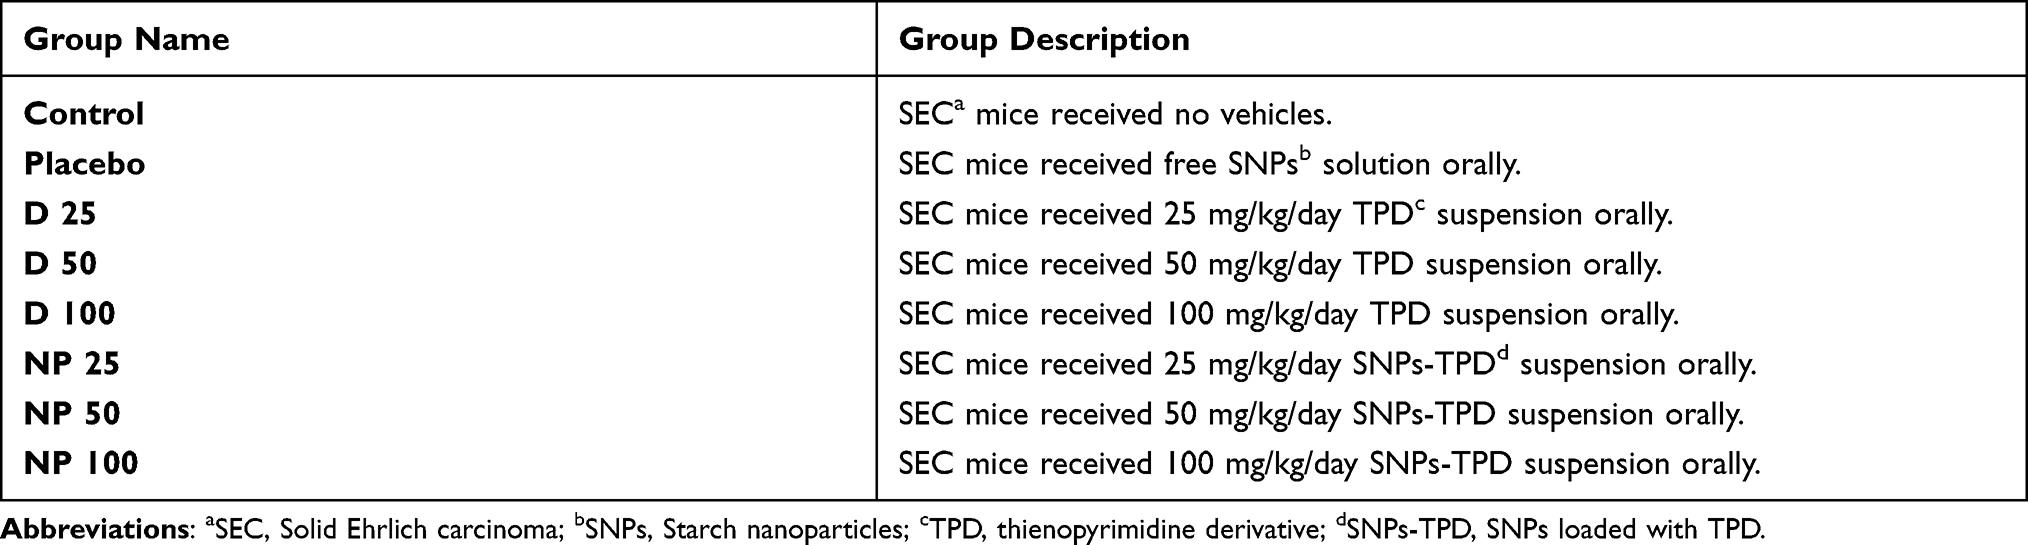 |
Table 1 Experimental Design of the in-vivo Study |
Assessment of Tumor Volume
The change in tumor volume was measured every 5 days using a digital caliper for 20 days. Tumor volume was calculated using the following formula:

where A is the largest diameter and B is its perpendicular.
Histopathological Examination of SEC Sections in Mice
The tumor masses were excised at the end of the experiment, cleaned with saline, and sectioned for histopathological examination. These sections were directly set in 10% neutral buffered formalin for 24 h and then subjected to a series of alcohol and xylene treatments. After that, the sections were fixed in paraffin wax and serially sectioned before being stained with hematoxylin and eosin. The inspection was performed using a light microscope (Olympus BX 51, Olympus America, Melville, NY) and photographed with Olympus DP11 digital camera connected to the microscope.55
Statistical Analysis
GraphPad Prism 5.0 (Graph pad software, San Diego, CA) was used for statistical analysis of diverse groups. Statistical analysis was conducted using a one-way analysis of variance (ANOVA) followed by a Tukey post hoc test for multiple comparisons between different groups. A significant difference was assumed when p < 0.05.
Results and Discussion
Synthesis, Purification, and Structure Validation of TPD
TPD was synthesized according to the described method as illustrated in Figure 1. Thin-layer chromatography (TLC) was used to check reactions accomplishment using different solvent systems as mobile phases and silica gel Merck 60 (F254) as the stationary phase. The spots were examined under UV light illumination (254 and 366 nm). The structure validation of TPD was conducted by 1H NMR (Figure S1) (400 MHz, CDCl3) δ 9.12 (s, 1H, NH D2O exchangeable), 8.48 (s, 1H, pyrimidine H), 7.51 (d, J = 6.85 Hz, 2H, ArH), 7.28 (d, J = 6.85 Hz, 2H, ArH), 3.62 (m, 4H, piperazine), 3.21 (s, 2H, -CH2CO-), 3.01 (m, 4H, -CH2-CH2-CH2-), 2.79 (m, 4H, piperazine), 2.44 (m, 2H, -CH2-CH2-CH2-). 13C NMR (Figure S2) also confirmed TPD structure validity (101 MHz, CDCl3) δ 173.81, 167.59, 160.51, 151.51, 140.62, 136.05, 135.42, 129.43, 129.11, 120.69, 117.66, 61.89, 53.29, 49.39, 31.52, 29.88, 28.21. HRMS (ESI): calcd for C21H23ClN5OS: m/z 428.9585 [M + H]+, found 428.9581. Furthermore, Elemental analysis was conducted to confirm the purity of TPD which showed that - Anal. Calc for C21H22ClN5OS: Calculated: C, 58.94; H, 5.18; N, 16.36; Found: C, 58.60; H, 5.00; N, 16.25.
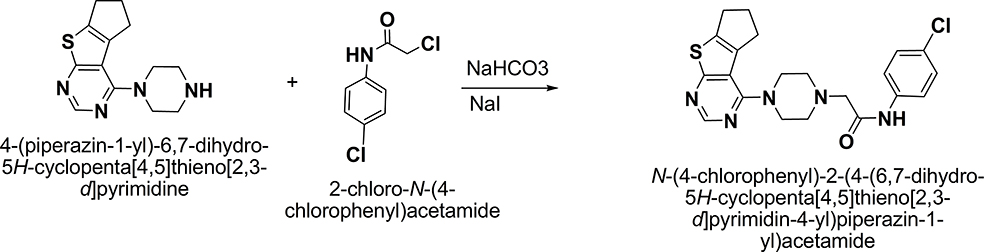 |
Figure 1 Synthesis of TPD. Yellow crystals, 95% yield; m.p. 76–77 °C; 1H NMR (400 MHz, CDCl3) δ 9.12 (s, 1H, NH D2O exchangeable), 8.48 (s, 1H, pyrimidine H), 7.51 (d, J = 6.85 Hz, 2H, ArH), 7.28 (d, J = 6.85 Hz, 2H, ArH), 3.62 (m, 4H, piperazine), 3.21 (s, 2H, -CH2CO-), 3.01 (m, 4H, -CH2-CH2-CH2-), 2.79 (m, 4H, piperazine), 2.44 (m, 2H, -CH2-CH2-CH2-); 13C NMR (101 MHz, CDCl3) δ 173.81, 167.59, 160.51, 151.51, 140.62, 136.05, 135.42, 129.43, 129.11, 120.69, 117.66, 61.89, 53.29, 49.39, 31.52, 29.88, 28.21; MS: (Mw: 427.95): m/z, 427.8 [M+, (100%)]; Anal. Calcd for C21H22ClN5OS: C, 58.94; H, 5.18; N, 16.36; Found: C, 58.60; H, 5.00; N, 16.25. |
Swiss ADME
The bioavailability radar in Figure 2 shows that TPD filled the colored zone, indicating a suitable physicochemical space for oral bioavailability. In the current study, TPD lipophilicity and water solubility were predicted based on the partition coefficient values between n-octanol and water (log Po/w), and Log S SILICOS-IT.56 Log S SILICOS-IT is a hybrid method relying on 27 fragments and 7 topological descriptors used for the solubility prediction. From the consensus Log Po/w value (3.46) and the Log S SILICOS-IT value (−6.64) of TPD, it can be concluded that TPD has a highly lipophilic character and belongs to a poorly water-soluble class.
 |
Figure 2 The bioavailability radar of TPD using Swiss ADME predictor. The colored zone is a suitable physicochemical space for oral bioavailability. LIPO (Lipophility): −0.7 < XLOGP3 < 5.0; SIZE: 150 g/mol < MW < 500 g/mol; POLAR (Polarity): 20 Å2 < TPSA < 130 Å2; INSOLU (Insolubility): 0 < Log S (ESOL) < 6; INSATU (Insaturation): 0.25 < Fraction Csp3 < 1; FLEX (Flexibility): 0 < Num. rotatable bonds < 9. All results have been obtained from the SwissADME web server. |
Topological polar surface area (TPSA) is a term that is frequently used to describe a drug’s ability to penetrate cells.57 This has proved to be a helpful descriptor in many models and rules for fast estimating various ADME features, particularly biological barrier crossing properties like absorption and brain access.58,59 The TPSA was 89.6 Å2 indicating that TPD can be passively absorbed by the gastrointestinal tract without permeating through the blood-brain barrier.
Swiss ADME enables the estimation of a chemical to be a substrate of P-glycoprotein or an inhibitor of the essential CYP isoenzymes. It applies the support vector machine algorithm60 to meticulously cleansed large datasets of known substrates/non-substrates or inhibitors/non-inhibitors. Knowledge about compounds being a substrate or non-substrate of the P-glycoprotein is critical to appraise active efflux through biological membranes from the gastrointestinal wall to the lumen or from the brain.61 One major role of P-glycoprotein is being overexpressed in some tumor cells, leading to multidrug-resistant cancers.62 Results showed that TPD is a P-glycoprotein inhibited by all CYP enzymes and was expected to be effluated from the central nervous system by P-glycoprotein.
The drug-likeness data qualitatively assesses the chance for a molecule to become an oral drug concerning its bioavailability. It showed that the TPD predicted bioavailability score was 0.55, and obeyed Lipinski’s rule without any violation. Lipinski’s rule, sometimes known as Pfizer’s rule, is a rule of thumb for determining if a chemical molecule with a particular pharmacological or biological activity possesses chemical and physical characteristics that would make it a potential orally active drug in humans.63,64 These results show that TPD can be administered orally; however, it has low oral bioavailability.
Development and Validation of UV Spectrophotometric Method for TPD Determination
Method Development and Validation
TPD was found to be poorly water-soluble and freely soluble in Isopropyl alcohol. Based on solubility, stability, and application in formulation characterization, the method was developed in phosphate buffer pH= 6.8 and isopropyl alcohol at a ratio of 50:50 v/v. The maximum absorption wavelength in the solvent system was 236 nm (Figure S3).
Linearity
The linearity of the proposed method was established by least-squares linear regression analysis of the calibration curve (Figure 3). The regression equation for TPD was obtained by plotting absorbance (A) versus concentration of TPD in the range of 3.5–24.5 μg/mL. The regression equation is y = 0.0513 x - 0.0041. The regression coefficient (R2 = 0.9995) was found to be significant. The calibration curve obtained was evaluated using the correlation coefficient (R2 = 9998). The LOD and LOQ of the proposed method were found to be 0.1742 and 0.5280 µg/mL, respectively.
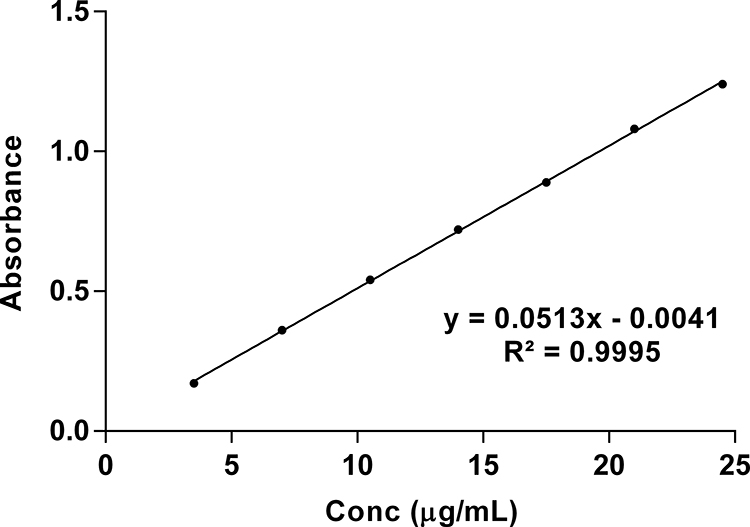 |
Figure 3 Linearity plot of TPD in phosphate buffer pH= 6.8: isopropyl alcohol (50:50 v/v). |
Intraday and Interday Precision
Precision was determined in a series of measurements obtained from multiple sampling of the same sample under the prescribed conditions. The intraday and interday precision results are shown in Table 2, and the results confirmed the reliability and stability of the developed method where all %RSD values were <0.5%.
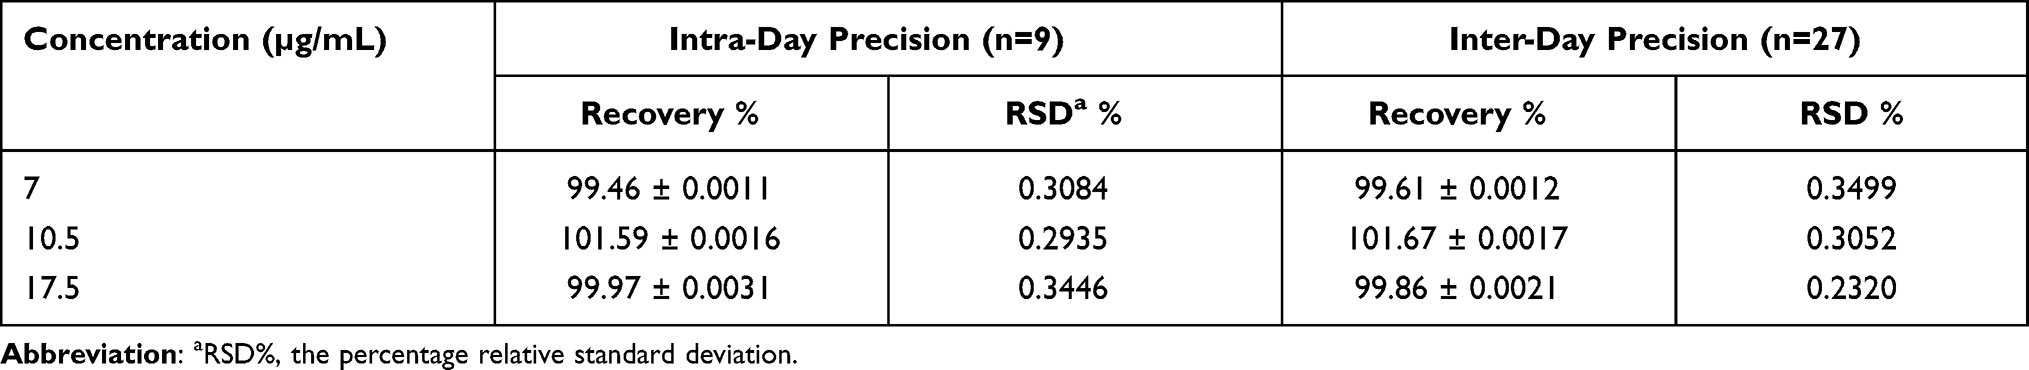 |
Table 2 Precision of the TPD in the Solvent Solution (Phosphate Buffer pH= 6.8: Isopropyl Alcohol in a Ratio of 50:50 v/v) |
Accuracy and Repeatability
The mean percentage recovery was in the range of 99.46–101.72%, with an RSD % of 0.1127–0.4450. The results are summarized in Table 3. The excellent mean percentage recovery values and their %RSD values revealed that TPD concentration could be accurately determined using the proposed method.
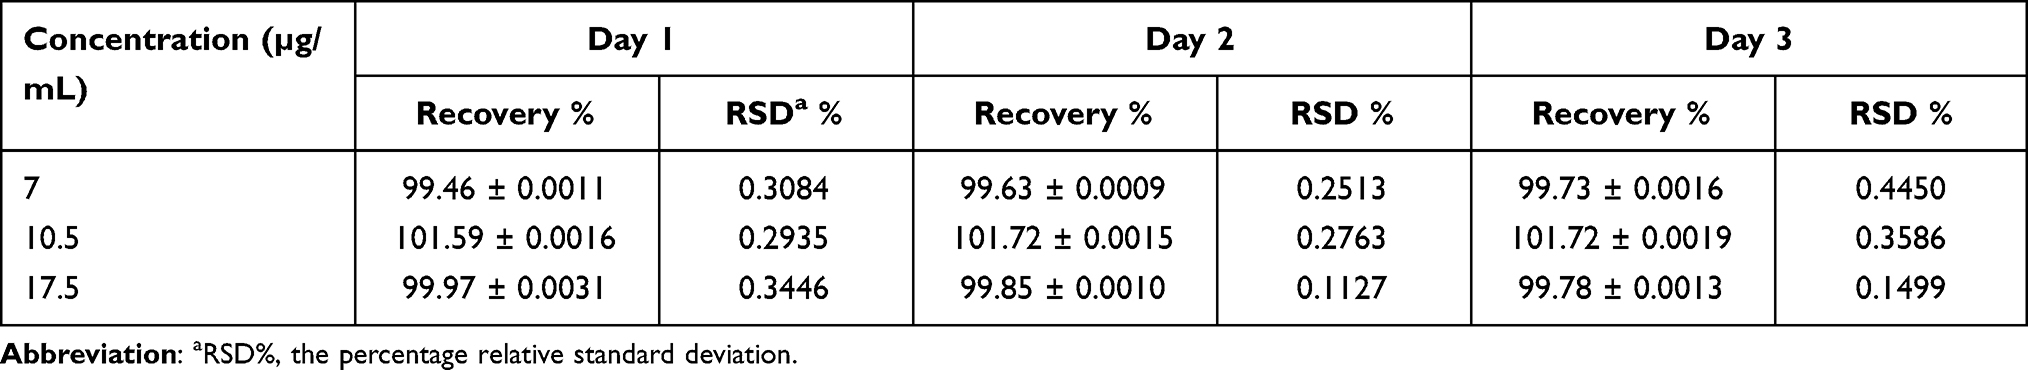 |
Table 3 Accuracy and Repeatability of the TPD in Solvent Solution (Phosphate Buffer pH= 6.8: Isopropyl Alcohol in a Ratio of 50:50 v/v) |
Characterization of SNPs-TPD
The nanoparticle size plays a crucial role in increasing the therapeutic efficacy of anticancer drugs. Several researchers have reported that nanoparticles with PS less than 200 nm are likely to accumulate in the tumor through enhanced permeability and retention effects. In contrast, particles larger than 300 nm are easily caught by the reticuloendothelial system in the liver and spleen thus quickly clear from the body of mice.65,66 Furthermore, SNPs have demonstrated the ability to protect various bioactive molecules from the stomach’s low pH, enzymatic conditions and facilitate the drug release in the small intestine.67–72
The results of PS and PDI for the prepared SNPs-TPD were 22.98 ± 4.23 nm and 0.12 (Figure S4), respectively. The small PS and low PDI obtained could be attributed to the preparation method used. The process is based on the slow addition of ethanol to the gelatinized starch in the presence of Tween under the ultrasonication effect. These steps can be explained as follows: once ethanol is added to the gelatinized starch, changes in interfacial tension occur, and nucleation starts allowing the formation of SNPs controlled by Tween.
Starch gelatinization is a process of transformation of semicrystalline granules into the amorphous state.73,74 At the current study, starch gelatinization was conducted by sodium hydroxide and ultrasonication treatment. It has been reported that sodium hydroxide breaks the interaction bonds between starch molecules and affects the swelling and gelatinization of starch.75,76 A study conducted by Roberts and Cameron concluded that the addition of sodium hydroxide solution to potato starch dispersion at room temperature resulted in immediate and rapid swelling of the starch granules at lower temperatures.77 Also, the effect of ultrasonication on breaking the intermolecular bonds between starch molecules has been reported to increase starch swelling and solubility.78,79 Furthermore, the presence of Tween during precipitation limits the growth of SNPs and the use of ethanol which increases the number of hydrogen bonds, thus increasing the number of SNPs.75 Several studies proved that Tween can decrease the PS and the PDI of SNPs due to its hydrophilic nature that promotes its interaction with starch molecules.39,80
The results of PS and PDI agreed with those obtained from TEM (Figure 4) which showed spherical monodispersed nanoparticles. The monodispersed SNPs observed could be attributed to the role of ultrasonication in generating influential repulsive forces between SNPs.75,81 It has been reported that ultrasound waves break down the powerful van der Waals and electrostatic forces between the surfaces of the starch and decrease SNPs agglomeration.41 Also, the surface charge directly influences the aggregation behavior of SNPs; therefore, zeta potential is a crucial property for them. It plays a role in the stability of the SNPs in the circulation and accumulation of SNPs at the site of interest. The result of the zeta potential of SNPs-TPD was −21 ± 4.72 mV, indicating good stability. The negative zeta value could be attributed to the presence of the hydroxyl group on the surface of the SNPs,82 which was confirmed by the results obtained from FT-IR analysis.
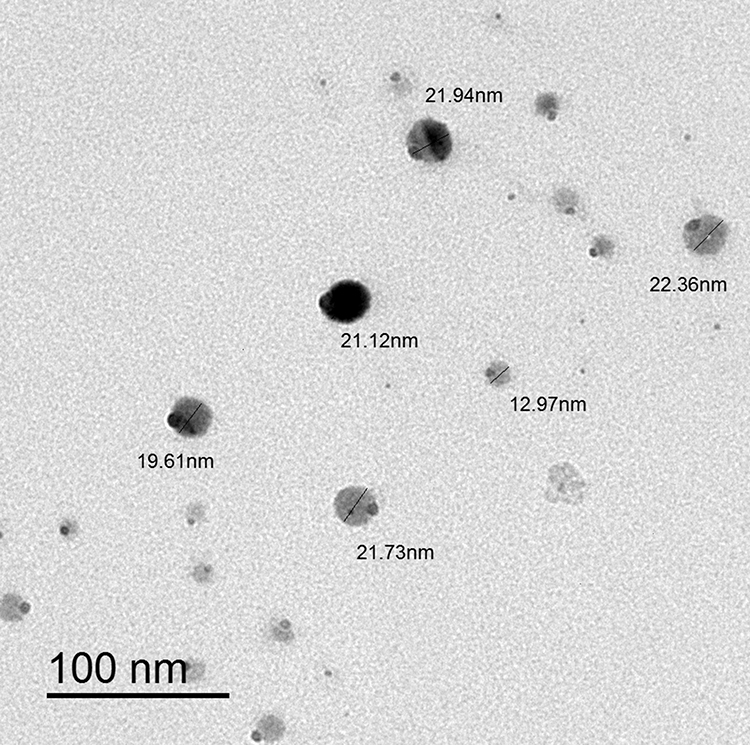 |
Figure 4 Transmission electron microscopy photograph of SNPs-TPD. |
The FT-IR spectra of each sample are displayed in Figure 5. The free TPD (Figure 5A) demonstrated some characteristic bands at 3279 cm−1 indicating the stretching vibration of N-H bond, 3037 cm−1 assigned to aromatic C-H stretching vibrations, and 2932 and 2837 cm−1 assigned to aliphatic C-H stretching vibrations. Moreover, the band at 1692 cm−1 can be set to C=O stretching vibration. The 1593 cm−1 band was assigned to the aromatic C=C ring stretching vibrations, while the 1528 cm−1 band was assigned to the aromatic C=N pyrimidine ring stretching vibration.
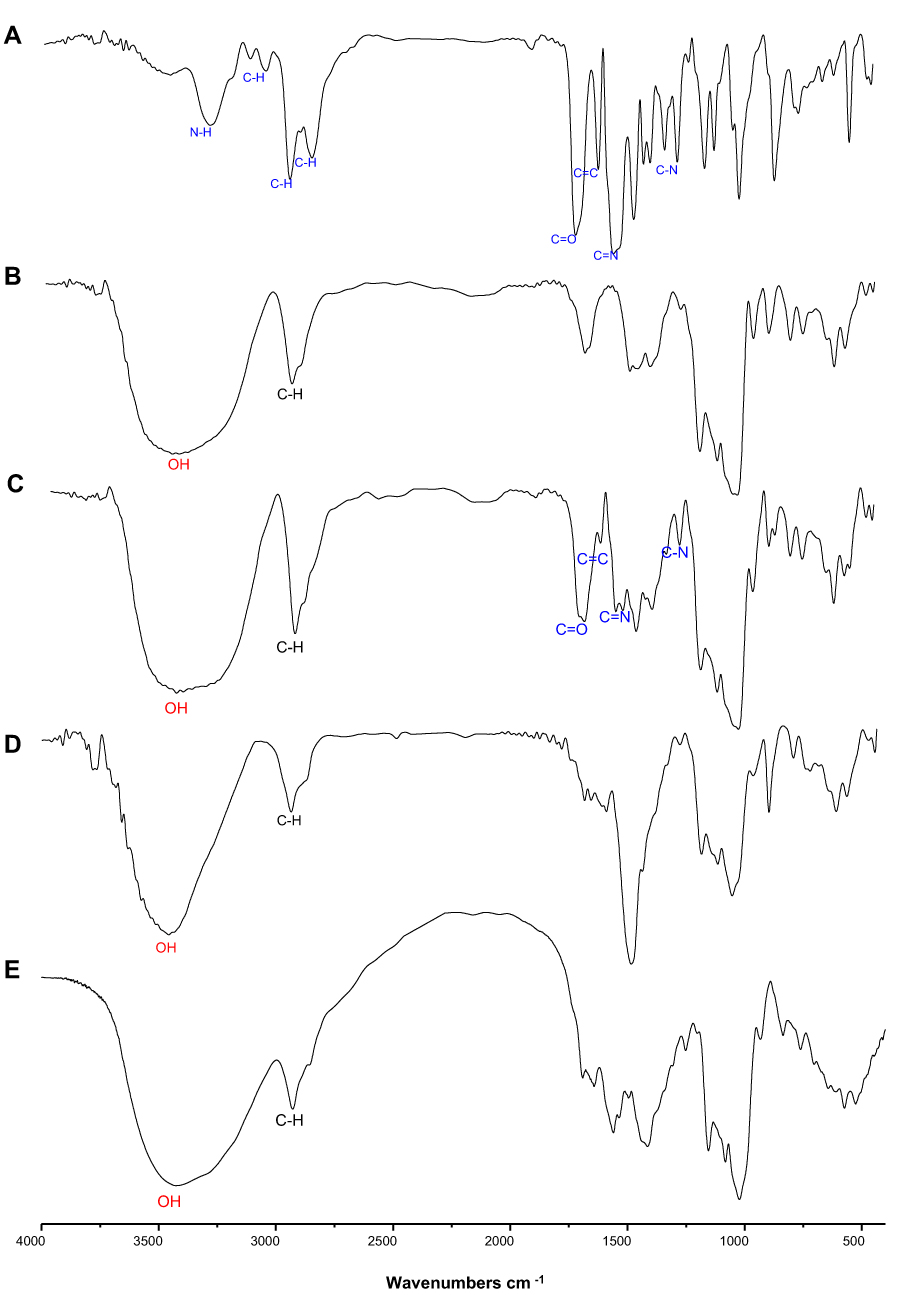 |
Figure 5 FT-IR spectrum of (A) TPD, (B) native starch, (C) physical mixture of starch and TPD (1:1), (D) SNPs, and (E) SNPs-TPD. |
The spectrum of native starch (Figure 5B) was principally characterized by the intense bands at 3449 cm−1 caused by the overlapping of stretching bands of the different -OH groups and its breadth indicated the extent of formation of inter- and intramolecular hydrogen bonding. In SNPs (Figure 5D), the peaks of the-OH stretching shifted to a higher wavelength (3453 cm−1). Other researchers stated similar results.16,83,84 The peaks of OH– stretching changed to a higher wavelength range for SNPs produced by alkalization and sonication procedures, according to Ahmad et al,83 which was ascribed to the loss of the crystalline structure and exposure of the starch molecule’s –OH groups to the preparation process.85,86 Furthermore, the intensity of the absorption peaks inside that wavelength is considerably less prominent for the SNPs in the FT-IR spectrums acquired in that study. SNPs found from our investigation showed a similar pattern. By evaluating the variations in the semi-crystalline and amorphous domains inside starch granules, FT-IR spectroscopy may be used to assess starch crystallinity.16,83 The high peak intensity at 995 cm−1 with shoulders at 1018 cm−1 and 1047 cm−1 suggested amorphous and crystalline order of starch. SNPs showed a less pronounced peak compared to native starch signifying the loss of starch’s crystalline structure and the formation of its amorphous phase. Thus, it is clear from the FT-IR result that the method of preparation selected could produce changes in the physicochemical structure of the starch resulting in SNPs formation.
The FT-IR was used to detect the structural changes on the molecular level after the physical mixing of TPD with native starch (Figure 5C). Most of the characteristic bands of TPD either hidden or overlapped with the intense bands of native starch, for example, bands at 3279, 2932, 2837, and 1692 cm −1. However, we still can detect the characteristic bands of aromatic C=C ring and C=N pyrimidine ring stretching vibrations at 1595 and 1528 cm 1, respectively. Finally, the SNPs-TPD (Figure 5E) displayed some spectral changes as -OH intense band at 3300–3600 cm−1 became broader due to the dynamic vibrational stretching of free inter- and intramolecular H-bonded hydroxyl groups.23,87 The characteristic bands of TPD were entirely overlapped by the spectra of SNPs. Similar results were reported by Acevedo-Guevara et al,84 who studied the encapsulation of curcumin in SNPs. Acevedo attributed the overlap of curcumin bands with those of SNPs to the fact that most of the curcumin molecules were associated with SNPs via H-bonding to various glucose units.
The use of power compensation DSC results in endothermic reactions, which are displayed as negative events. The DSC of TPD (Figure 6A) showed one prominent characteristic endothermic melting peak at 105.55°C with an enthalpy (ΔH) of −9.33 j/g. The DSC of native starch (Figure 6B) showed one prominent peak at 112.28°C with an enthalpy (ΔH) of −122.67 j/g which is characterized for the helix-coil transition temperature of starch and gelation point of amylopectin.26,88
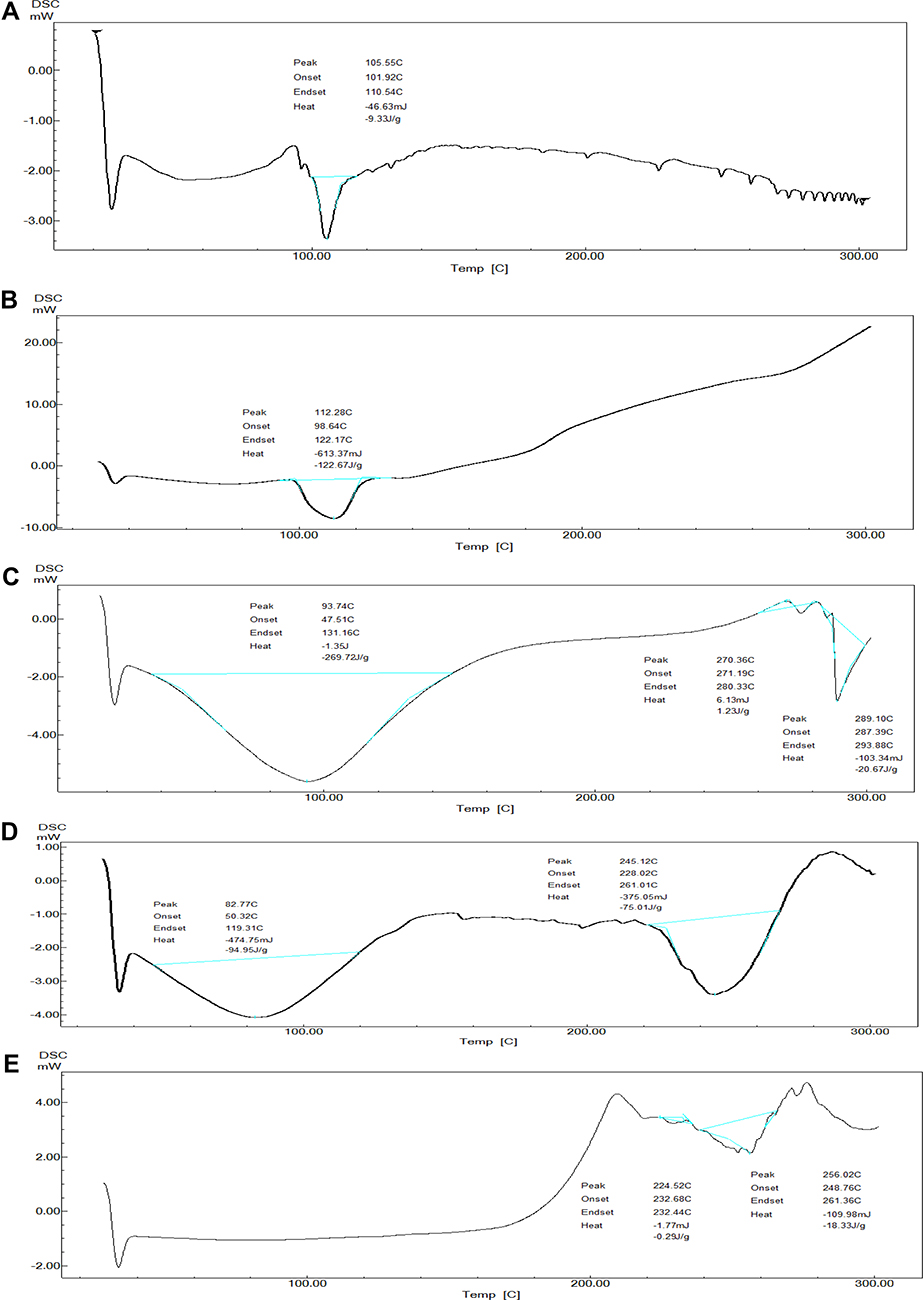 |
Figure 6 The thermograms of (A) TPD, (B) native starch, (C) physical mixture of starch and TPD (1:1), (D) SNPs, and (E) SNPs-TPD. |
The DSC of TPD and native starch physical mixture (1:1) (Figure 6C) showed two endothermic peaks at 93.74°C and 289.10°C. The broad endothermic peak at 93.74°C with an enthalpy (ΔH) −269.72 j/g was assigned for the overlapping of the helix-coil transition temperature of starch, gelation point of amylopectin, and melting point of TPD. While the second endothermic peak at 289.10°C with an enthalpy (ΔH) of −20.67 j/g was corresponding to the native starch degradation temperature. It was observed that the two endothermic peaks of the physical mixture sample showed significant inconsistency with samples before the mixing. Such broadening observed in the physical mixture spectrum may be due to the interactions between the hydrogen bonding between OH (hydrogen donor) of starch, and hydrogen bond acceptors in the pyrimidine and piperazine rings of the TPD,89,90 which in turn increase moisture content. It was reported that increasing moisture content results in decreasing the peak temperature of the starch.91,92 Another reported explanation is the chemical dehydration and thermal deposition of starch molecules that encourage the degradation reactions to begin at the lower temperature near 280°C.93,94
The DSC of SNPs (Figure 6D) showed two endothermic peaks at 82.77°C and 245.17°C. The broad endothermic peak at 82.77°C with an enthalpy (ΔH) of −94.95 j/g was assigned to the amorphous structure of SNPs and the overlapping of endothermic events at the gelation point of amylopectin.95 The peak at 245.15°C with an enthalpy (ΔH) of −75.01 j/g was assigned to the degradation temperature of the SNPs. The observed decrease in SNPs’ enthalpy and gelation temperature compared to native starch was due to the compact semi-crystalline structure of native starch compared to SNPs. This was in agreement with previously reported findings that ascribed it because SNPs’ single-helix structure is more easily disrupted than natural starch’s double-helix structure, resulting in lower gelation temperature.37,96
The DSC of SNPs-TPD (Figure 6E) showed one endothermic peak at 256.02°C with an enthalpy (ΔH) −18.33 j/g corresponding to the melting temperature of SNPs. The observed increase in melting temperature of SNPs-TPD compared to free SNPs was expected as it was reported that thermal resistance increases with increasing ultrasonication duration.97,98 Another explanation may be the increase in the hydrocarbon chain of SNPs because of ultrasonication treatment, resulting in increased hydrogen bond formation between TPD and SNPs. Similar results were obtained by Abral et al.25 Additionally, the absence of helix coil transition temperature and TPD could be due to the complete destruction of starch helices and appropriate entrapment of TPD. These findings agree with those reported by Hasanvand et al for Vitamin D and SNPs.26
SNPs are usually selected for bioactive molecules’ entrapment due to their amorphous structure and high-water solubility. The molecules can be entrapped in the hydrophobic interior of SNPs. The results obtained from the EE% and in-vitro release study indicated that the UV-spectrophotometry method was appropriate for quantifying the amount of TPD released in the presence of dissolution medium and can quantify TPD at early release points to maximum TPD release during in-vitro TPD release studies as shown in (Figure 7A). The EE% and in-vitro release of TPD were analyzed and calculated in triplicate for three different formulations. The samples were diluted with isopropyl alcohol before analysis to reach the ratio (50 phosphate buffer pH= 6.8: 50 isopropyl alcohol v/v). The EE% result was 97 ± 0.45% indicating good EE%. The observed high EE% could be explained by the hydrophobic nature of TPD which has a low tendency to diffuse out SNPs and the presence of the hydroxyl group that permits hydrogen bonding between the SNPs and TPD.21,99 In addition, the ultrasound treatment allows smaller particle sizes and the increase of drug EE%.41,100 Similarly, Chin et al reported that using Tween increases the EE% of curcumin onto SNPs.21
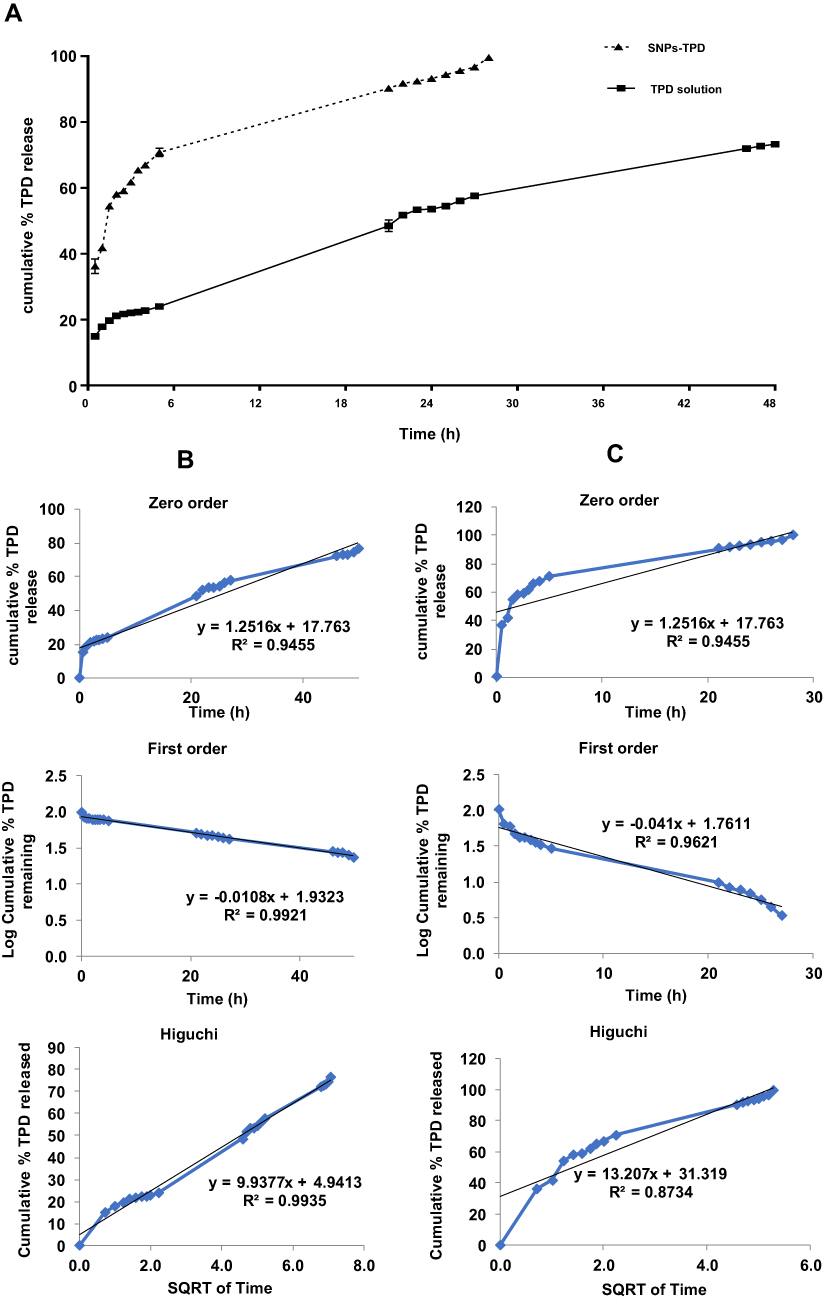 |
Figure 7 (A) in-vitro release of TPD in dissolution medium phosphate buffer pH =6.8 from TPD solution and SNPs-TPD, (B) and release kinetics of TPD from TPD solution, and (C) SNPs-TPD. |
The in-vitro drug release study represents an essential parameter in the prediction of TPD bioavailability. The observed TPD dissolution rate from the SNPs was higher than that of the solution confirming the efficacy of SNPs in enhancing the dissolution rate of TPD. The cumulative amount of TPD released from the solution was found to be 73.48% ± 0.366 in 48 h, while the cumulative amount of TPD released from SNPs-TPD was found to be 99.40% ± 0.337 in 28 h. The in-vitro release of TPD from SNPs was characterized by an initial fast release followed by a slower gradual release. The burst release phase within the first 2.5 h was mainly caused by desorption of the surface-bound or adsorbed TPD.101 The second phase was a relatively slow release up to 28 h, attributed to TPD diffusion through the pores, channels of the polymeric nanoparticles, and nanoparticle matrix erosion or degradation. The water molecules could swell SNPs and make the pores smaller and more closely combined with the TPD, thus effectively reducing the TPD diffusion.18 Therefore, it could be concluded that the SNPs not only enhanced TPD dissolution characteristics but also achieved a particular sustained-release effect.
As indicated in Figure 7A, approximately 60% of TPD released from SNPs-TPD in 2.5 h compared to nearly 21% released from TPD solution. The enhancement of the dissolution rate of TPD from the SNPs could be attributed to the increased surface area of the nano-sized preparation. The decrease in PS is accompanied by a high energy state, increasing the extent to which the particle can dissolve due to the increase in dissolution pressure. These parameters increase the hydrophilicity and improve the wettability of TPD.101 Data obtained from in-vitro release studies were used for kinetic analysis. The kinetic analysis of the release data (Figure 7B and C) showed that TPD release from the TPD solution followed the Higuchi model. In contrast, TPD release from SNPs-TPD followed the first order which confirms that SNPs improved TPD solubility and dissolution rate as illustrated by the values of regression coefficients (R2).102
In-vivo Animal Study
The anticancer activity of TPD alone and SNPs-TPD on SEC was investigated after 21 days of treatment. The effects of TPD and SNPs-TPD treatment on the growth and proliferation of SEC are presented in Figure 8. It was noticed that SEC responded significantly to TPD and SNPs-TPD, confirming the anti-proliferative effect of TPD as reported by Salem et al.7 A marked decrease in the average tumor volume was observed with D 100 and NP 25 after 15 days of treatment. Additionally, NP 50, and NP 100 showed a similar response after 10 days. This decrease could be explained by the dose-dependent response of TPD and the ability of SNPs to enhance the bioavailability of TPD and increase TPD residence time at tumor mass. Furthermore, the observed decrease with D 100 could be attributed to the large amount used that blocks the P-glycoprotein pump from the efflux of TPD because of P-glycoprotein saturation.103–106 As such, TPD could escape from P- glycoprotein, resulting in a reasonable concentration able to inhibit tumor growth much close to that of nanoparticles. Thus, it can be inferred that 100 mg/kg of TPD suspension is the set limit for tumor growth inhibition.
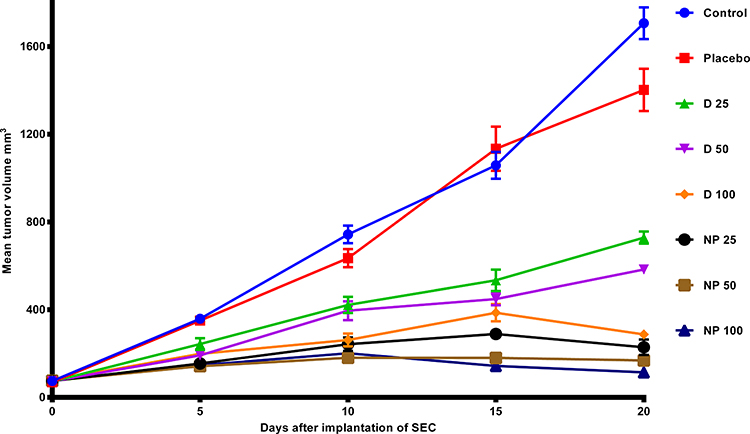 |
Figure 8 In-vivo analysis of TPD and SNPs-TPD effect on tumor volume in SEC induced mice. In which mean ± SEM, Control: Solid Ehrlich carcinoma (SEC) mice received no vehicles, Placebo: SEC mice received free SNPs solution orally, D 25: SEC mice received 25 mg/kg/day TPD suspension orally, D 50: SEC mice received 50 mg/kg/day TPD suspension orally, D 100: SEC mice received 100 mg/kg/day TPD suspension orally, NP 25: SEC mice received 25 mg/kg/day SNPs-TPD suspension orally, NP 50: SEC mice received 50 mg/kg/day SNPs-TPD suspension orally, NP 100: SEC mice received 100 mg/kg/day SNPs-TPD suspension orally. |
The percentage of tumor growth (% tumor growth) for each group was calculated using the following equation:
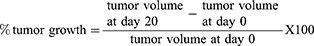
Statistical analysis showed no significant difference between the control and placebo groups, excluding any possible suppression of tumor growth by SNPs alone. Moreover, all treated groups showed a significant difference compared to either the control or placebo groups as illustrated in (Figure 9).
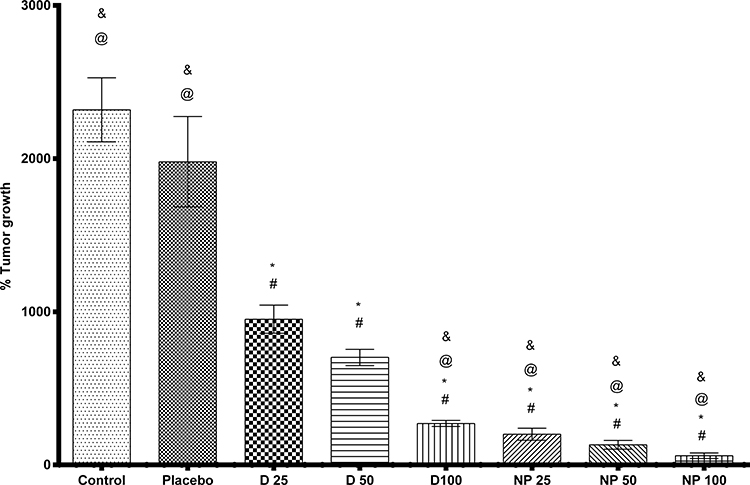 |
Figure 9 Percentage tumor growth effect of TPD and SNPs-TPD on SEC induced mice. Where: *significant difference with control, #significant difference with placebo, @significant difference with D 25, and &significant difference with D 50. Each point represents the mean value ± SEM where, Control: Solid Ehrlich carcinoma (SEC) mice received no vehicles, Placebo: SEC mice received free SNPs solution orally, D 25: SEC mice received 25 mg/kg/day TPD suspension orally, D 50: SEC mice received 50 mg/kg/day TPD suspension orally, D 100: SEC mice received 100 mg/kg/day TPD suspension orally, NP 25: SEC mice received 25 mg/kg/day SNPs-TPD suspension orally, NP 50: SEC mice received 50 mg/kg/day SNPs-TPD suspension orally, and NP 100: SEC mice received 100 mg/kg/day SNPs-TPD suspension orally. |
It was observed that the groups treated with SNPs-TPD had a significant difference compared to their analog of the same dose of TPD suspension. This is in line with the fact that nano-encapsulation enhances the drug’s anticancer efficacy by increasing the drug’s sensitivity to tumor cells.70–72 This significant difference could be explained by the hydrophilic surface properties, zeta potential, and small PS (22.98 ± 4.23 nm) of SNPs that are previously discussed. The non-significant difference between NP 100 and D 100 may be attributed to the high dose use of TPD.
Although it was seen that the % tumor growth was decreased by increasing TPD amount (Figure 9), SNPs formulations, regardless of the dose, did not show any remarkable significant difference when compared to each other, suggesting that the nanoparticle formulations masked the dose-dependent response of TPD on tumor growth. The reason for this observation may be the saturation of tumor cells with TPD at the low dose used in the current study and the ability of SNPs to enter tumor cells by endocytosis and therefore bypassing p-glycoprotein.107–110 Additionally, the small PS of the nanoparticles gives them a chance to escape from the reticuloendothelial system which increases TPD accumulation in the tumor mass.65–69 Another explanation could be the polysaccharide nature of the SNPs and the use of Tween during the SNPs preparation which was reported to inhibit the P-glycoprotein efflux pump.108,111–115
The Kaplan–Meier survival curve (Figure 10) showed TPD treatment markedly increased the survival of SEC-bearing mice compared to control and placebo groups. The survival rate of nanoparticle formulations was expected as it is well known that nanoparticles enhance drug delivery and prolong drug confinement in tumors, consequently improve antitumor activity,116,117 and increase the lifetime of the tumor-bearing animals.118,119 From the above findings, it can be concluded that the SNPs had increased the bioavailability of TPD, and the daily dose of 25 mg/kg can be used as the lowest amount in the treatment.
 |
Figure 10 The Kaplan–Meier survival curve shows the censored cases of each studied group reported by the 20th day. Where, Control: Solid Ehrlich carcinoma (SEC) mice received no vehicles, Placebo: SEC mice received free SNPs solution orally, D 25: SEC mice received 25 mg/kg/day TPD suspension orally, D 50: SEC mice received 50 mg/kg/day TPD suspension orally, D 100: SEC mice received 100 mg/kg/day TPD suspension orally, NP 25: SEC mice received 25 mg/kg/day SNPs-TPD suspension orally, NP 50: SEC mice received 50 mg/kg/day SNPs-TPD suspension orally, and NP 100: SEC mice received 100 mg/kg/day SNPs-TPD suspension orally. |
The histopathological examination of SEC (Figure 11) in untreated mice showed marked infiltration of tumor cells with subcutaneous tissue. Newly formed capillaries were formed with high infiltration of inflammatory cells. Tumor cells showed a disarray of tissue architecture with marked cellular anaplasia and mitoses. The glandular-like appearance was differentiated in some tumor tissue, and extensive necrosis was observed mainly in the central area of the tumor. Treatment with D 25 revealed minimal infiltration of tumor cells and increased necrosis compared to the untreated group. However, increasing the administered dose in D 50 and D 100 markedly reduced the infiltration of tumor cells and increased the expression of fibrotic tissue. Regarding NP-treated mice, subcutaneous muscles were normal, and the other regions showed fibrous connective tissue proliferation. The infiltration of cancer cells and necrosis in NP 50 and NP 100-treated mice was minimal compared to other groups.
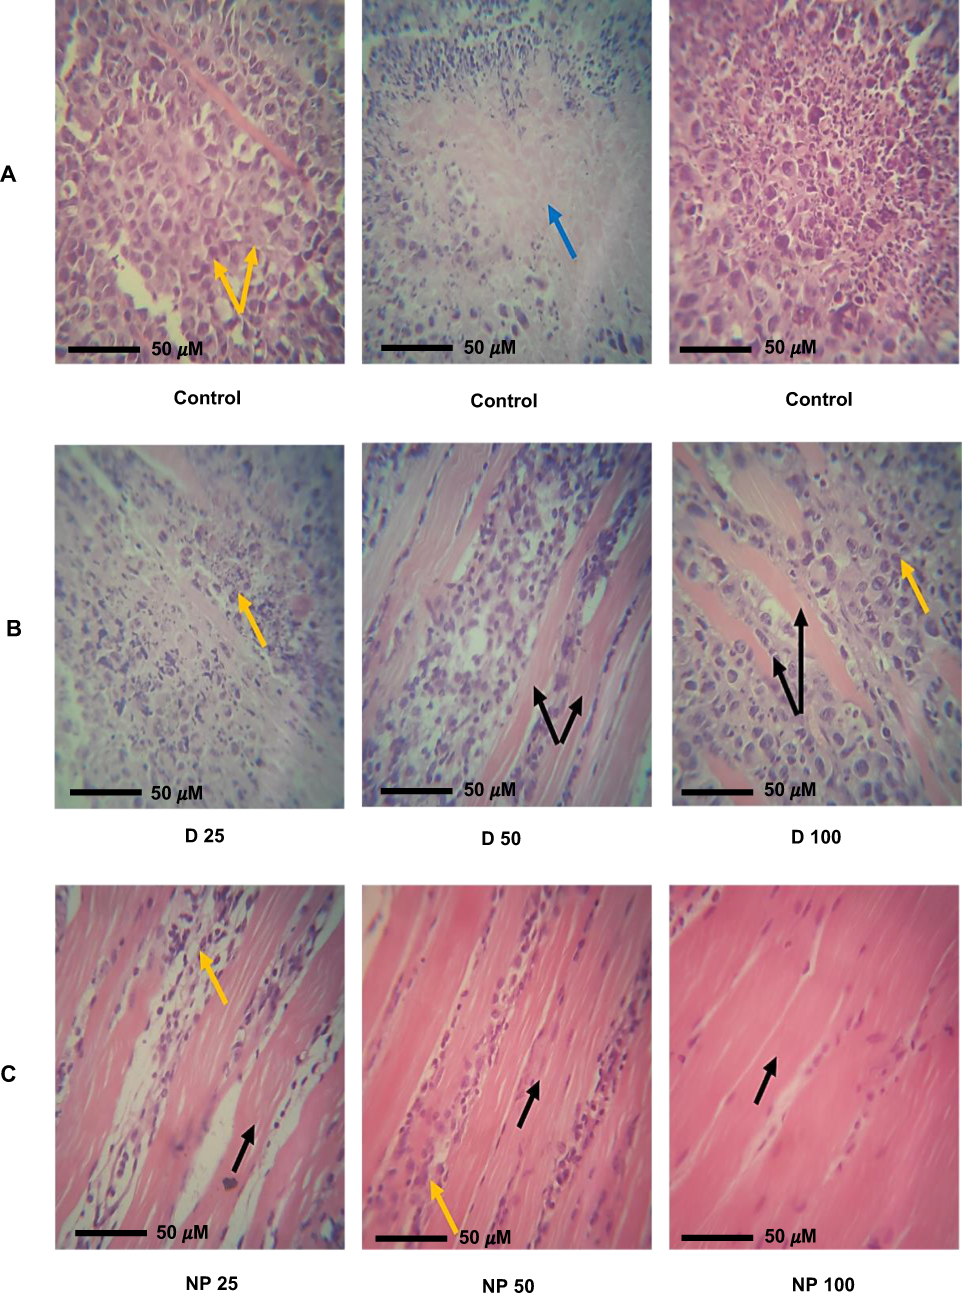 |
Figure 11 Histopathological examination. Representative sections were obtained from (A) Control: Solid Ehrlich carcinoma (SEC) mice received no vehicles. Mice showing high infiltration of tumor cells (yellow arrow) and the formation of necrotic area (blue arrow) surrounded by infiltrated inflammatory cells. (B) SEC tumor-bearing mice treated with D 25, D 50, and D 100 showing minimal infiltration of tumor cells (yellow arrow) and the appearance of subcutaneous fibrotic tissue (black arrow). (C) SEC tumor-bearing mice treated with NP 25, NP 50, and NP 100 showing very low infiltration of tumor cells (yellow arrow) and normal architecture of subcutaneous skeletal muscles. Sections were stained with hematoxylin and eosin dyes. |
Conclusion
The results obtained showed that the validated UV method was reliable with %RSD less than 0.5% and can estimate TPD concentration. The SNPs-TPD showed small PS, good zeta potential, and spherical shape as observed by the TEM investigation. The DSC and FT-IR concluded that the method of preparation selected could produce changes in the physicochemical structure of the starch resulting in SNPs formation. Moreover, the characteristic FT-IR bands of TPD are entirely overlapped by the SNPs bands in the SNPs-TPD spectrum, confirming the high EE% estimated. From in-vitro release data, it was concluded that SNPs enhanced solubility and bioavailability of TPD. The in-vivo animal study concluded the efficacy of TPD against SEC mice, also; the SNPs enhanced anticancer activity and bioavailability of TPD. These findings concluded the effectiveness of SNPs on enhancing solubility and oral bioavailability of poorly water-soluble drugs like TPD. This investigation would be promising in the field of exploring effective anticancer agents with high bioavailability.
Disclosure
The authors have no conflicts of interest to declare.
References
1. Sung H, Ferlay J, Siegel RL, et al. Global cancer statistics 2020: GLOBOCAN estimates of incidence and mortality worldwide for 36 cancers in 185 countries. CA Cancer J Clin. 2021;71(3):209–249. doi:10.3322/caac.21660
2. Bray F, Ferlay J, Soerjomataram I, Siegel R, Torre L, Jemal A. Erratum: global cancer statistics 2018: globocan estimates of incidence and mortality worldwide for 36 cancers in 185 countries. CA Cancer J Clin. 2020;70:313.
3. Mizrahi JD, Surana R, Valle JW, Shroff RT. Pancreatic cancer. Lancet. 2020;395(10242):2008–2020. doi:10.1016/S0140-6736(20)30974-0
4. Okasha H, Elkholy S, El-Sayed R, et al. Real time endoscopic ultrasound elastography and strain ratio in the diagnosis of solid pancreatic lesions. World J Gastroenterol. 2017;23(32):5962. doi:10.3748/wjg.v23.i32.5962
5. Neoptolemos J, Dunn J, Stocken D, et al. Adjuvant chemoradiotherapy and chemotherapy in resectable pancreatic cancer: a randomised controlled trial. Lancet. 2001;358(9293):1576–1585. doi:10.1016/S0140-6736(01)06651-X
6. Tempero MA, Reni M, Riess H, et al. APACT: Phase III, multicenter, international, open-label, randomized trial of adjuvant nab-paclitaxel plus gemcitabine (nab-P/G) vs gemcitabine (G) for surgically resected pancreatic adenocarcinoma. Am Soc Clin Oncol. 2019;37(15_suppl):4000. doi:10.1200/JCO.2019.37.15_suppl.4000
7. Salem MS, Aziz YMA, Elgawish MS, Said MM, Abouzid KA. Design, synthesis, biological evaluation and molecular modeling study of new thieno [2, 3-d] pyrimidines with anti-proliferative activity on pancreatic cancer cell lines. Bioorg Chem. 2019;94:103472. doi:10.1016/j.bioorg.2019.103472
8. Dagher R, Cohen M, Williams G, et al. Approval summary: imatinib mesylate in the treatment of metastatic and/or unresectable malignant gastrointestinal stromal tumors. Clin Cancer Res. 2002;8(10):3034–3038.
9. Johnson JR, Bross P, Cohen M, et al. Approval summary: imatinib mesylate capsules for treatment of adult patients with newly diagnosed Philadelphia chromosome-positive chronic myelogenous leukemia in chronic phase. Clin Cancer Res. 2003;9(6):1972–1979.
10. Flynn JP, Gerriets V. Imatinib. In: StatPearls [Internet]. 2020.
11. Daina A, Michielin O, Zoete V. SwissADME: a free web tool to evaluate pharmacokinetics, drug-likeness and medicinal chemistry friendliness of small molecules. Sci Rep. 2017;7(1):42717. doi:10.1038/srep42717
12. Guideline IHT. Validation of analytical procedures: text and methodology. Q2 (R1). 2005;1:1–15.
13. Ismail NS, Gopinath SC. Enhanced antibacterial effect by antibiotic loaded starch nanoparticle. J Assoc Arab Univ Basic Appl Sci. 2017;24(1):136–140. doi:10.1016/j.jaubas.2016.10.005
14. Gardouh A, Srag El-Din AS, Moustafa Y, Gad S. Formulation factors of starch-based nanosystems preparation and their pharmaceutical application. Int J Pharm Biomed Res. 2021;5(Pharmacology–Pharmaceutics):28–39. doi:10.21608/rpbs.2020.51097.1080
15. Lin Q, Ji N, Li M, et al. Fabrication of debranched starch nanoparticles via reverse emulsification for improvement of functional properties of corn starch films. Food Hydrocoll. 2020;104:105760. doi:10.1016/j.foodhyd.2020.105760
16. Gutiérrez G, Morán D, Marefati A, Purhagen J, Rayner M, Matos M. Synthesis of controlled size starch nanoparticles (SNPs). Carbohydr Polym. 2020;250:116938. doi:10.1016/j.carbpol.2020.116938
17. Marto J, Ribeiro HM, Almeida AJ. Chapter 17 - starch-based nanocapsules as drug carriers for topical drug delivery. In: Nguyen-Tri P, Do T-O, Nguyen TA, editors. Smart Nanocontainers. Elsevier; 2020:287–294.
18. Wu W, Wang L, Wang S. Amorphous silibinin nanoparticles loaded into porous starch to enhance remarkably its solubility and bioavailability in vivo. Colloids Surf B Biointerfaces. 2021;198:111474. doi:10.1016/j.colsurfb.2020.111474
19. Pawar J, Ali MT, Fule R, et al. Biodegradable porous starch spheres as a novel carrier for enhancement of dissolution rate and oral bioavailability of itraconazole. Curr Drug Deliv. 2017;14(7):944–954. doi:10.2174/1567201813666160920154209
20. Wu C, Wang Z, Zhi Z, Jiang T, Zhang J, Wang S. Development of biodegradable porous starch foam for improving oral delivery of poorly water soluble drugs. Int J Pharm. 2011;403(1–2):162–169. doi:10.1016/j.ijpharm.2010.09.040
21. Chin SF, Yazid M, Akmar SN, Pang SC. Preparation and characterization of starch nanoparticles for controlled release of curcumin. Int J Polym Sci. 2014;2014:1–8. doi:10.1155/2014/340121
22. Apostolidis E, Mandala I. Modification of resistant starch nanoparticles using high-pressure homogenization treatment. Food Hydrocoll. 2020;103:105677. doi:10.1016/j.foodhyd.2020.105677
23. Guo Z, Zhao B, Chen L, Zheng B. Physicochemical properties and digestion of lotus seed starch under high-pressure homogenization. Nutrients. 2019;11(2):371. doi:10.3390/nu11020371
24. Shi A-M, Li D, Wang L-J, Li B-Z, Adhikari B. Preparation of starch-based nanoparticles through high-pressure homogenization and miniemulsion cross-linking: influence of various process parameters on particle size and stability. Carbohydr Polym. 2011;83(4):1604–1610. doi:10.1016/j.carbpol.2010.10.011
25. Abral H, Basri A, Muhammad F, et al. A simple method for improving the properties of the sago starch films prepared by using ultrasonication treatment. Food Hydrocoll. 2019;93:276–283. doi:10.1016/j.foodhyd.2019.02.012
26. Hasanvand E, Fathi M, Bassiri A. Production and characterization of vitamin D 3 loaded starch nanoparticles: effect of amylose to amylopectin ratio and sonication parameters. J Food Sci Technol. 2018;55(4):1314–1324. doi:10.1007/s13197-018-3042-0
27. Bel Haaj S, Magnin A, Pétrier C, Boufi S. Starch nanoparticles formation via high power ultrasonication. Carbohydr Polym. 2013;92(2):1625–1632. doi:10.1016/j.carbpol.2012.11.022
28. Song D, Thio YS, Deng Y. Starch nanoparticle formation via reactive extrusion and related mechanism study. Carbohydr Polym. 2011;85(1):208–214. doi:10.1016/j.carbpol.2011.02.016
29. Lamanna M, Morales NJ, García NL, Goyanes S. Development and characterization of starch nanoparticles by gamma radiation: potential application as starch matrix filler. Carbohydr Polym. 2013;97(1):90–97. doi:10.1016/j.carbpol.2013.04.081
30. Alzate P, Gerschenson L, Flores S. Micro/nanoparticles containing potassium sorbate obtained by the dialysis technique: effect of starch concentration and starch ester type on the particle properties. Food Hydrocoll. 2019;95:540–550. doi:10.1016/j.foodhyd.2019.04.066
31. Zhou L, Fang D, Wang M, et al. Preparation and characterization of waxy maize starch nanocrystals with a high yield via dry-heated oxalic acid hydrolysis. Food Chem. 2020;318:126479. doi:10.1016/j.foodchem.2020.126479
32. Velásquez-Castillo LE, Leite MA, Ditchfield C, Sobral PJDA, Moraes ICF. Quinoa starch nanocrystals production by acid hydrolysis: kinetics and properties. Int J Biol Macromol. 2020;143:93–101. doi:10.1016/j.ijbiomac.2019.12.011
33. Winarti C, Surono I, Uswah M. Effect of acid and hydrolysis duration on the characteristics of arrowroot and taro starch nanoparticles.
34. Liu Y, Yang G, Zou D, et al. Formulation of nanoparticles using mixing-induced nanoprecipitation for drug delivery. Ind Eng Chem Res. 2019;59(9):4134–49.
35. Farrag Y, Ide W, Montero B, et al. Preparation of starch nanoparticles loaded with quercetin using nanoprecipitation technique. Int J Biol Macromol. 2018;114:426–433. doi:10.1016/j.ijbiomac.2018.03.134
36. Wu X, Chang Y, Fu Y, Ren L, Tong J, Zhou J. Effects of non‐solvent and starch solution on formation of starch nanoparticles by nanoprecipitation. Starch‐Stärke. 2016;68(3–4):258–263. doi:10.1002/star.201500269
37. Qin Y, Liu C, Jiang S, Xiong L, Sun Q. Characterization of starch nanoparticles prepared by nanoprecipitation: influence of amylose content and starch type. Ind Crops Prod. 2016;87:182–190. doi:10.1016/j.indcrop.2016.04.038
38. Juna S, Hayden S, Damm M, Kappe CO, Huber A. Microwave mediated preparation of nanoparticles from wx corn starch employing nanoprecipitation. Starch‐Stärke. 2014;66(3–4):316–325. doi:10.1002/star.201300067
39. Chin SF, Pang SC, Tay SH. Size controlled synthesis of starch nanoparticles by a simple nanoprecipitation method. Carbohydr Polym. 2011;86(4):1817–1819. doi:10.1016/j.carbpol.2011.07.012
40. Tan Y, Xu K, Li L, Liu C, Song C, Wang P. Fabrication of size-controlled starch-based nanospheres by nanoprecipitation. ACS Appl Mater Interfaces. 2009;1(4):956–959. doi:10.1021/am900054f
41. Shabana S, Prasansha R, Kalinina I, Potoroko I, Bagale U, Shirish S. Ultrasound assisted acid hydrolyzed structure modification and loading of antioxidants on potato starch nanoparticles. Ultrason Sonochem. 2019;51:444–450. doi:10.1016/j.ultsonch.2018.07.023
42. Chang Y, Yan X, Wang Q, Ren L, Tong J, Zhou J. High efficiency and low cost preparation of size controlled starch nanoparticles through ultrasonic treatment and precipitation. Food Chem. 2017;227:369–375. doi:10.1016/j.foodchem.2017.01.111
43. Daina A, Blatter M-C, Baillie Gerritsen V, et al. Drug design workshop: a web-based educational tool to introduce computer-aided drug design to the general public. J Chem Educ. 2017;94(3):335–344. doi:10.1021/acs.jchemed.6b00596
44. Rapalli VK, Kaul V, Gorantla S, et al. UV Spectrophotometric method for characterization of curcumin loaded nanostructured lipid nanocarriers in simulated conditions: method development, in-vitro and ex-vivo applications in topical delivery. Spectrochim Acta A Mol Biomol Spectrosc. 2020;224:117392. doi:10.1016/j.saa.2019.117392
45. Chaudhary A, Singh A, Verma PK. Method development and validation of potent pyrimidine derivative by UV-VIS spectrophotometer. Org Med Chem Lett. 2014;4(1):1–6. doi:10.1186/s13588-014-0015-9
46. El-Menshawe SF, Ali AA, Halawa AA, El-Din ASS. A novel transdermal nanoethosomal gel of betahistine dihydrochloride for weight gain control: in-vitro and in-vivo characterization. Drug Des Devel Ther. 2017;11:3377–3388. doi:10.2147/DDDT.S144652
47. Mittal A, Parmar S, Gilani SJ, Imam SS, Taleuzzaman M. Optimization and validation for simultaneous estimation of citicoline and piracetam in bulk and tablet formulations using RP-HPLC method: analytical quality by design approach. Asian J Res Chem. 2017;10(2):198–205. doi:10.5958/0974-4150.2017.00034.7
48. Lathiyare KB, Jain V. Development and characterization of karanj oil based proniosomal gel for topical delivery. Res J Pharm Technol. 2014;7(9):959–962.
49. Somasundaram I, Yadav B, Kumar SS. Formulation of PLGA polymeric nanosuspension containing pramipexole dihydrochloride for improved treatment of parkinson’s diseases. Res J Pharm Technol. 2016;9(7):810–816. doi:10.5958/0974-360X.2016.00155.4
50. Elkomy MH, El-Menshawe SF, Ali AA, Halawa AA, El-Din ASS, Edwards ET. Betahistine dihydrochloride transdermal delivery via optimized thermosensitive gels: percutaneous absorption evaluation using rat growth as a biomarker. Drug Deliv Transl Res. 2017;7(1):1–13. doi:10.1007/s13346-016-0323-x
51. Bongiovì F, Fiorica C, Palumbo FS, Pitarresi G, Giammona G. Hyaluronic acid based nanohydrogels fabricated by microfluidics for the potential targeted release of Imatinib: characterization and preliminary evaluation of the antiangiogenic effect. Int J Pharm. 2020;573:118851. doi:10.1016/j.ijpharm.2019.118851
52. El-Gizawy SA, Nouh A, Saber S, Kira AY. Deferoxamine-loaded transfersomes accelerates healing of pressure ulcers in streptozotocin-induced diabetic rats. J Drug Deliv Sci Technol. 2020;58:101732. doi:10.1016/j.jddst.2020.101732
53. El-Mesery M, Al-Gayyar M, Salem H, Darweish M, El-Mowafy A. Chemopreventive and renal protective effects for docosahexaenoic acid (DHA): implications of CRP and lipid peroxides. Cell Div. 2009;4(1):1–17. doi:10.1186/1747-1028-4-6
54. Mutar TF, Tousson E, Hafez E, Abo Gazia M, Salem SB. Ameliorative effects of vitamin B17 on the kidney against Ehrlich ascites carcinoma induced renal toxicity in mice. Environ Toxicol. 2020;35(4):528–537. doi:10.1002/tox.22888
55. Hashem MA, Shoeeb SB, Abd-Elhakim YM, Mohamed WA. The antitumor activity of Arthrospira platensis and/or cisplatin in a murine model of Ehrlich ascites carcinoma with hematinic and hepato-renal protective action. J Funct Foods. 2020;66:103831. doi:10.1016/j.jff.2020.103831
56. Mannhold R, Poda GI, Ostermann C, Tetko IV. Calculation of molecular lipophilicity: state-of-the-art and comparison of log P methods on more than 96,000 compounds. J Pharm Sci. 2009;98(3):861–893. doi:10.1002/jps.21494
57. Athar Abbasi M, Raza H, Aziz Ur R, et al. Synthesis of novel N-(1,3-thiazol-2-yl)benzamide clubbed oxadiazole scaffolds: urease inhibition, Lipinski rule and molecular docking analyses. Bioorg Chem. 2019;83:63–75. doi:10.1016/j.bioorg.2018.10.018
58. Ertl P, Rohde B, Selzer P. Fast calculation of molecular polar surface area as a sum of fragment-based contributions and its application to the prediction of drug transport properties. J Med Chem. 2000;43(20):3714–3717. doi:10.1021/jm000942e
59. Daina A, Zoete V. A boiled‐egg to predict gastrointestinal absorption and brain penetration of small molecules. ChemMedChem. 2016;11(11):1117. doi:10.1002/cmdc.201600182
60. Dietrich R, Opper M, Sompolinsky H. Statistical mechanics of support vector networks. Phys Rev Lett. 1999;82(14):2975. doi:10.1103/PhysRevLett.82.2975
61. Montanari F, Ecker GF. Prediction of drug–ABC-transporter interaction—recent advances and future challenges. Adv Drug Deliv Rev. 2015;86:17–26. doi:10.1016/j.addr.2015.03.001
62. Sharom FJ. ABC Multidrug Transporters: Structure, Function and Role in Chemoresistance. 2008.
63. Lipinski CA, Lombardo F, Dominy BW, Feeney PJ. Experimental and computational approaches to estimate solubility and permeability in drug discovery and development settings. Adv Drug Deliv Rev. 2001;46(1–3):3–26. doi:10.1016/S0169-409X(00)00129-0
64. Coates A, Hu Y. Novel approaches to developing new antibiotics for bacterial infections. Br J Pharmacol. 2007;152(8):1147–1154. doi:10.1038/sj.bjp.0707432
65. Yu C, Liu C, Wang S, et al. Hydroxyethyl starch-based nanoparticles featured with redox-sensitivity and chemo-photothermal therapy for synergized tumor eradication. Cancers. 2019;11(2):207. doi:10.3390/cancers11020207
66. Bertrand N, Wu J, Xu X, Kamaly N, Farokhzad OC. Cancer nanotechnology: the impact of passive and active targeting in the era of modern cancer biology. Adv Drug Deliv Rev. 2014;66:2–25.
67. Qiu C, Hu Y, Jin Z, et al. A review of green techniques for the synthesis of size-controlled starch-based nanoparticles and their applications as nanodelivery systems. Trends Food Sci Technol. 2019;92:138–151. doi:10.1016/j.tifs.2019.08.007
68. Rostamabadi H, Falsafi SR, Jafari SM. Starch-based nanocarriers as cutting-edge natural cargos for nutraceutical delivery. Trends Food Sci Technol. 2019;88:397–415. doi:10.1016/j.tifs.2019.04.004
69. Gutiérrez TJ. Polymers for Agri-Food Applications. Springer; 2019.
70. Marslin G, Revina AM, Khandelwal VKM, et al. Delivery as nanoparticles reduces imatinib mesylate-induced cardiotoxicity and improves anticancer activity. Int J Nanomedicine. 2015;10:3163.
71. Maksimenko A, Mougin J, Mura S, et al. Polyisoprenoyl gemcitabine conjugates self assemble as nanoparticles, useful for cancer therapy. Cancer Lett. 2013;334(2):346–353. doi:10.1016/j.canlet.2012.08.023
72. Mao JN, Li AJ, Zhao LP, et al. PEG-PLGA nanoparticles entrapping doxorubicin reduced doxorubicin-induced cardiotoxicity in rats.
73. Ai Y, Jane J. Gelatinization and rheological properties of starch. Starch‐Stärke. 2015;67(3–4):213–224. doi:10.1002/star.201400201
74. Zabala CCV. Starch nanoparticles and nanocrystals. In: Starch-Based Nanomaterials. Springer; 2020:11–18.
75. Hebeish A, El-Rafie M, El-Sheikh M, El-Naggar ME. Ultra-fine characteristics of starch nanoparticles prepared using native starch with and without surfactant. J Inorg Organomet Polym Mater. 2014;24(3):515–524. doi:10.1007/s10904-013-0004-x
76. El-Sheikh MA. New technique in starch nanoparticles synthesis. Carbohydr Polym. 2017;176:214–219. doi:10.1016/j.carbpol.2017.08.033
77. Roberts SA, Cameron RE. The effects of concentration and sodium hydroxide on the rheological properties of potato starch gelatinisation. Carbohydr Polym. 2002;50(2):133–143. doi:10.1016/S0144-8617(02)00007-3
78. Izidoro DR, Sierakowski M-R, Haminiuk CWI, De Souza CF, de Paula Scheer A. Physical and chemical properties of ultrasonically, spray-dried green banana (Musa cavendish) starch. J Food Eng. 2011;104(4):639–648. doi:10.1016/j.jfoodeng.2011.02.002
79. Krishnakumar T, Sajeev M. Effect of ultrasound treatment on physicochemical and functional properties of cassava starch. Int J Curr Microbiol Appl Sci. 2018;7(10):3122–3135. doi:10.20546/ijcmas.2018.710.362
80. Putro JN, Ismadji S, Gunarto C, Soetaredjo FE, Ju YH. A study of anionic, cationic, and nonionic surfactants modified starch nanoparticles for hydrophobic drug loading and release. J Mol Liq. 2020;298:112034. doi:10.1016/j.molliq.2019.112034
81. Ahad A, Aqil M, Kohli K, Sultana Y, Mujeeb M. Enhanced transdermal delivery of an anti-hypertensive agent via nanoethosomes: statistical optimization, characterization and pharmacokinetic assessment. Int J Pharm. 2013;443(1):26–38. doi:10.1016/j.ijpharm.2013.01.011
82. Najafi SHM, Baghaie M, Ashori A. Preparation and characterization of acetylated starch nanoparticles as drug carrier: ciprofloxacin as a model. Int J Biol Macromol. 2016;87:48–54. doi:10.1016/j.ijbiomac.2016.02.030
83. Ahmad M, Gani A, Hassan I, Huang Q, Shabbir H. Production and characterization of starch nanoparticles by mild alkali hydrolysis and ultra-sonication process. Sci Rep. 2020;10(1):3533. doi:10.1038/s41598-020-60380-0
84. Acevedo-Guevara L, Nieto-Suaza L, Sanchez LT, Pinzon MI, Villa CC. Development of native and modified banana starch nanoparticles as vehicles for curcumin. Int J Biol Macromol. 2018;111:498–504. doi:10.1016/j.ijbiomac.2018.01.063
85. Chun A, Lee H-J, Hamaker BR, Janaswamy S. Effects of ripening temperature on starch structure and gelatinization, pasting, and cooking properties in rice (Oryza sativa). J Agric Food Chem. 2015;63(12):3085–3093. doi:10.1021/jf504870p
86. Mondragón M, Bello‐Pérez LA, Agama‐Acevedo E, Betancur‐Ancona D, Peña JL. Effect of cooking time, steeping and lime concentration on starch gelatinization of corn during nixtamalization. Starch‐Stärke. 2004;56(6):248–253. doi:10.1002/star.200200190
87. Lammers K, Arbuckle-Keil G, Dighton J. FT-IR study of the changes in carbohydrate chemistry of three New Jersey pine barrens leaf litters during simulated control burning. Soil Biol Biochem. 2009;41(2):340–347. doi:10.1016/j.soilbio.2008.11.005
88. Hussain S, Alamri MS, Mohamed AA. Rheological, thermal and textural properties of starch blends prepared from wheat and Turkish bean starches. Food Sci Technol Res. 2013;19(6):1141–1147. doi:10.3136/fstr.19.1141
89. Donovan JW. Phase transitions of the starch–water system. Biopolymers. 1979;18(2):263–275. doi:10.1002/bip.1979.360180204
90. Gumieniczek A, Trębacz H, Komsta Ł, et al. DSC, FT-IR, NIR, NIR-PCA and NIR-ANOVA for determination of chemical stability of diuretic drugs: impact of excipients. Open Chem. 2018;16(1):116–132. doi:10.1515/chem-2018-0014
91. Maache-Rezzoug Z, Zarguili I, Loisel C, Queveau D, Buleon A. Structural modifications and thermal transitions of standard maize starch after DIC hydrothermal treatment. Carbohydr Polym. 2008;74(4):802–812. doi:10.1016/j.carbpol.2008.04.047
92. Tian Y, Li Y, Xu X, Jin Z. Starch retrogradation studied by thermogravimetric analysis (TGA). Carbohydr Polym. 2011;84(3):1165–1168. doi:10.1016/j.carbpol.2011.01.006
93. Pigłowska M, Kurc B, Rymaniak Ł, Lijewski P, Fuć P. Kinetics and thermodynamics of thermal degradation of different starches and estimation the OH group and H(2)O content on the surface by TG/DTG-DTA. Polymers (Basel). 2020;12(2):357. doi:10.3390/polym12020357
94. Liu X, Wang Y, Yu L, et al. Thermal degradation and stability of starch under different processing conditions. Starch‐Stärke. 2013;65(1‐2):48–60. doi:10.1002/star.201200198
95. Ragab H, El-Kader MA. Optical and thermal studies of starch/methylcellulose blends. Phys Scr. 2013;87(2):025602. doi:10.1088/0031-8949/87/02/025602
96. Pongsawatmanit R, Chantaro P, Nishinari K. Thermal and rheological properties of tapioca starch gels with and without xanthan gum under cold storage. J Food Eng. 2013;117(3):333–341. doi:10.1016/j.jfoodeng.2013.03.010
97. Abral H, Anugrah AS, Hafizulhaq F, Handayani D, Sugiarti E, Muslimin AN. Effect of nanofibers fraction on properties of the starch based biocomposite prepared in various ultrasonic powers. Int J Biol Macromol. 2018;116:1214–1221. doi:10.1016/j.ijbiomac.2018.05.067
98. Abral H, Dalimunthe MH, Hartono J, et al. Characterization of tapioca starch biopolymer composites reinforced with micro scale water hyacinth fibers. Starch‐Stärke. 2018;70(7–8):1700287. doi:10.1002/star.201700287
99. Lammari N, Louaer O, Meniai AH, Elaissari A. Encapsulation of essential oils via nanoprecipitation process: overview, progress, challenges and prospects. Pharmaceutics. 2020;12(5):431. doi:10.3390/pharmaceutics12050431
100. Ahmad M, Mudgil P, Gani A, Hamed F, Masoodi FA, Maqsood S. Nano-encapsulation of catechin in starch nanoparticles: characterization, release behavior and bioactivity retention during simulated in-vitro digestion. Food Chem. 2019;270:95–104. doi:10.1016/j.foodchem.2018.07.024
101. El-Naggar ME, El-Rafie M, El-Sheikh M, El-Feky GS, Hebeish A. Synthesis, characterization, release kinetics and toxicity profile of drug-loaded starch nanoparticles. Int J Biol Macromol. 2015;81:718–729. doi:10.1016/j.ijbiomac.2015.09.005
102. Wang L, Zhao X, Yang F, et al. Loading paclitaxel into porous starch in the form of nanoparticles to improve its dissolution and bioavailability. Int J Biol Macromol. 2019;138:207–214. doi:10.1016/j.ijbiomac.2019.07.083
103. Cisternino S, Bourasset F, Archimbaud Y, Sémiond D, Sanderink G, Scherrmann JM. Nonlinear accumulation in the brain of the new taxoid TXD258 following saturation of P‐glycoprotein at the blood–brain barrier in mice and rats. Br J Pharmacol. 2003;138(7):1367–1375. doi:10.1038/sj.bjp.0705150
104. Shirasaka Y, Sakane T, Yamashita S. Effect of P‐glycoprotein expression levels on the concentration‐dependent permeability of drugs to the cell membrane. J Pharm Sci. 2008;97(1):553–565. doi:10.1002/jps.21114
105. Crowe A, Ilett KF, Karunajeewa HA, Batty KT, Davis TM. Role of P glycoprotein in absorption of novel antimalarial drugs. Antimicrob Agents Chemother. 2006;50(10):3504–3506. doi:10.1128/AAC.00708-06
106. Ke Z, Hou X, Jia X-B. Design and optimization of self-nanoemulsifying drug delivery systems for improved bioavailability of cyclovirobuxine D. Drug Des Devel Ther. 2016;10:2049. doi:10.2147/DDDT.S106356
107. Wan CPL, Letchford K, Jackson JK, Burt HM. The combined use of paclitaxel-loaded nanoparticles with a low-molecular-weight copolymer inhibitor of P-glycoprotein to overcome drug resistance. Int J Nanomedicine. 2013;8:379–391. doi:10.2147/IJN.S38737
108. Niazi M, Zakeri-Milani P, Najafi Hajivar S, et al. Nano-based strategies to overcome p-glycoprotein-mediated drug resistance. Expert Opin Drug Metab Toxicol. 2016;12(9):1021–1033. doi:10.1080/17425255.2016.1196186
109. Marzolini C, Paus E, Buclin T, Kim RB. Polymorphisms in human MDR1 (P‐glycoprotein): recent advances and clinical relevance. Clin Pharmacol Ther. 2004;75(1):13–33. doi:10.1016/j.clpt.2003.09.012
110. Situ W, Li X, Liu J, Chen L. Preparation and characterization of glycoprotein-resistant starch complex as a coating material for oral bioadhesive microparticles for colon-targeted polypeptide delivery. J Agric Food Chem. 2015;63(16):4138–4147. doi:10.1021/acs.jafc.5b00393
111. Werle M. Natural and synthetic polymers as inhibitors of drug efflux pumps. Pharm Res. 2008;25(3):500–511. doi:10.1007/s11095-007-9347-8
112. Carreno-Gomez B, Duncan R. Compositions with enhanced oral bioavailability. USP 20030211072. 2002.
113. Friche E, Jensen PB, Sehested M, Demant EJ, Nissen NN. The solvents cremophor EL and Tween 80 modulate daunorubicin resistance in the multidrug resistant Ehrlich ascites tumor. Cancer Commun. 1990;2(9):297–303.
114. Shono Y, Nishihara H, Matsuda Y, et al. Modulation of intestinal P-glycoprotein function by cremophor EL and other surfactants by an in vitro diffusion chamber method using the isolated rat intestinal membranes. J Pharm Sci. 2004;93(4):877–885. doi:10.1002/jps.20017
115. Zhang H, Yao M, Morrison RA, Chong S. Commonly used surfactant, Tween 80, improves absorption of P-glycoprotein substrate, digoxin, in rats. Arch Pharm Res. 2003;26(9):768–772. doi:10.1007/BF02976689
116. Jabir NR, Tabrez S, Ashraf GM, Shakil S, Damanhouri GA, Kamal MA. Nanotechnology-based approaches in anticancer research. Int J Nanomedicine. 2012;7:4391. doi:10.2147/IJN.S33838
117. Davis ME. Nanoparticle therapeutics: an emerging treatment modality for cancer. Nanosci Technol. 2008;7:771.
118. Upadhyay KK, Bhatt AN, Mishra AK, et al. The intracellular drug delivery and anti tumor activity of doxorubicin loaded poly (γ-benzyl l-glutamate)-b-hyaluronan polymersomes. Biomaterials. 2010;31(10):2882–2892. doi:10.1016/j.biomaterials.2009.12.043
119. Zhu Z, Li Y, Li X, et al. Paclitaxel-loaded poly (N-vinylpyrrolidone)-b-poly (ε-caprolactone) nanoparticles: preparation and antitumor activity in vivo. J Control Release. 2010;142(3):438–446. doi:10.1016/j.jconrel.2009.11.002
 © 2021 The Author(s). This work is published and licensed by Dove Medical Press Limited. The full terms of this license are available at https://www.dovepress.com/terms.php and incorporate the Creative Commons Attribution - Non Commercial (unported, v3.0) License.
By accessing the work you hereby accept the Terms. Non-commercial uses of the work are permitted without any further permission from Dove Medical Press Limited, provided the work is properly attributed. For permission for commercial use of this work, please see paragraphs 4.2 and 5 of our Terms.
© 2021 The Author(s). This work is published and licensed by Dove Medical Press Limited. The full terms of this license are available at https://www.dovepress.com/terms.php and incorporate the Creative Commons Attribution - Non Commercial (unported, v3.0) License.
By accessing the work you hereby accept the Terms. Non-commercial uses of the work are permitted without any further permission from Dove Medical Press Limited, provided the work is properly attributed. For permission for commercial use of this work, please see paragraphs 4.2 and 5 of our Terms.