")
Back to Journals » International Journal of Nanomedicine » Volume 17
Stability, Toxicity, and Antibacterial Potential of Gallic Acid-Loaded Graphene Oxide (GAGO) Against Methicillin-Resistant Staphylococcus aureus (MRSA) Strains
Authors Shamsi S, Abdul Ghafor AAH, Norjoshukrudin NH, Ng IMJ, Abdullah SNS, Sarchio SNE, Md Yasin F , Abd Gani S, Mohd Desa MN
Received 6 May 2022
Accepted for publication 3 November 2022
Published 30 November 2022 Volume 2022:17 Pages 5781—5807
DOI https://doi.org/10.2147/IJN.S369373
Checked for plagiarism Yes
Review by Single anonymous peer review
Peer reviewer comments 3
Editor who approved publication: Dr Ebrahim Mostafavi
Suhaili Shamsi,1 Ahmad Ashraful Hadi Abdul Ghafor,2 Nur Hazwani Norjoshukrudin,1 Ida May Jen Ng,1 Siti Nur Sharmila Abdullah,1 Seri Narti Edayu Sarchio,2 Faizah Md Yasin,3,4 Shafinaz Abd Gani,1 Mohd Nasir Mohd Desa2
1Laboratory of Animal Biochemistry and Biotechnology, Department of Biochemistry, Faculty of Biotechnology and Biomolecular Sciences, Universiti Putra Malaysia, Serdang, Selangor, 43400, Malaysia; 2Department of Biomedical Sciences, Faculty of Medicine and Health Sciences, Universiti Putra Malaysia, Serdang, Selangor, 43400, Malaysia; 3Department of Chemical and Environmental Engineering, Faculty of Engineering, Universiti Putra Malaysia, Serdang, Selangor, 43400, Malaysia; 4Institute of Nanoscience and Nanotechnology (ION2), Universiti Putra Malaysia, Serdang, Selangor, 43400, Malaysia
Correspondence: Suhaili Shamsi, Laboratory of Animal Biochemistry and Biotechnology, Department of Biochemistry, Faculty of Biotechnology and Biomolecular Sciences, Universiti Putra Malaysia, Serdang, Selangor, 43400, Malaysia, Tel +603-9769 7964, Fax +603-9769 7590, Email [email protected]
Background: The impetuous usage of antibiotics has led to the perpetual rise of methicillin-resistant Staphylococcus aureus (MRSA), which has garnered the interest of potential drug alternatives, including nanomaterials.
Purpose: The present study investigates the stability, toxicity, and antibacterial potential of gallic acid-loaded graphene oxide (GAGO) on several MRSA strains.
Methods: The stability of a synthesized and characterized GAGO was monitored in different physiological media. The toxicity profile of GAGO was evaluated in 3T3 murine fibroblast cells and the embryonic zebrafish model. The antibacterial activity of GAGO against MRSA, methicillin-susceptible S. aureus (MSSA), and community-acquired MRSA; with or without Panton-valentine leucocidin gene (MRSA-pvl+ and MRSA-pvl-) was investigated through disk diffusion, CFU counting method, time-kill experiment, and high-resolution transmission electron microscopy (HRTEM) observation.
Results: A stable GAGO nanocomposite has shown an improved toxicity profile in 3T3 murine fibroblast cells and zebrafish embryos, besides exhibiting normal ROS levels than graphene oxide (GO) and GA (gallic acid). The nanocomposite inhibited the growth of all bacterial strains employed. The effectiveness of the GAGO nanocomposite was comparable to cefoxitin (CFX), at ≥ 150 μg/mL in MRSA and MSSA. GAGO exhibited a significantly delayed response towards MRSA-pvl+ and MRSA-pvl-, with increased inhibition following 8 to 24 h of exposure, while comparable activity to native GA was only achieved at 24 h. Meanwhile, for MRSA and MSSA, GAGO had a comparable activity with native GA and GO as early as 2 h of exposure. HRTEM observation further reveals that GAGO-exposed cells were membrane compromised.
Conclusion: In summary, the present study indicates the antibacterial potential of GAGO against MRSA strains, but further study is warranted to understand the mechanism of action of GAGO and its resistance in MRSA strains.
Keywords: graphene oxide, gallic acid, nanomaterial, MRSA, toxicity, multidrug resistance
Introduction
Staphylococcus aureus (S. aureus) is commonly found on the skin as a normal human microbiota. It does not become pathological until it enters the human body, which causes potent infections leading to a wide range of clinical conditions.1 Unfortunately, the rampant treatment of antibiotics and other antibacterial therapies have enabled S. aureus to evolve and acquire the multidrug-resistant (MDR) trait, known as methicillin-resistant S. aureus (MRSA). This potentially causes complications in clinical conditions, rendering them harder to treat.2 MRSA has been listed as one of the seven pathogens of international concern by the World Health Organization (WHO) since 2014. It has caused major concern due to its association with high mortality and septic shock cases worldwide.3 The national prevalence rate of MRSA in Malaysia ranged from 17.2% to 28.1% between 2016 and 2017,4 and at present, vancomycin has been used as the ultimate drug for treating MRSA infections.5 However, there are reports on the resistance of MRSA towards vancomycin in many parts of the world,6 including the neighboring country, Indonesia.7 Despite the limited data on vancomycin resistance of MRSA in Malaysia, researchers believed that this strain could also be detected here in the near future. This has raised an alarming concern among medical practitioners, and it is believed that we are in dire need of developing alternatives to conventional antibiotics.
Recently, MRSA infections have been reported to occur outside hospital settings. There has been an alarming increase in community-acquired MRSA (CA-MRSA) infections, and its prevalence has continued to increase.8 CA-MRSA is defined as MRSA isolated from outpatients with no history of hospitalization within the past 1 year and who presented no other established risk factors for MRSA infections such as surgery, residence in a long-term facility, dialysis, or indwelling percutaneous medical devices or catheters.9 In addition, CA-MRSA is classified as an epidemic and a serious threat to public health. According to the National Nosocomial Infections Surveillance 2004, issued by the Centers of Disease Control and Prevention, USA, the prevalence of MRSA in outpatient settings is 31.1% among all S. aureus isolates, and most of those MRSA cases were community-associated.10 The basis for the apparent increased virulence of the CA-MRSA strain is incompletely understood. Many factors have been proposed to contribute to the success of CA-MRSA as a pathogen, including increased fitness, improved evasion of the host immune system, and unique toxin production. One of the factors is the presence of Panton-Valentine leucocidin (pvl) genes, a pore-forming toxin that has been epidemiologically associated with CA-MRSA infections.11 In addition, pvl is usually absent in hospital-acquired MRSA (HA-MRSA) strains and is more common in CA-MRSA compared to CA-MSSA (community-acquired methicillin-susceptible S. aureus) isolates, as reported in a recent molecular study showing the presence of pvl in almost all CA-MRSA strains studied.12
Graphene-based nanomaterials have attracted numerous researchers due to their high mechanical strength, optical properties, elasticity, and high thermal conductivity. Graphene is widely used in various applications, such as catalysis, energy technology, composite materials, sensors, and nanoelectronics. In addition, graphene-derivatives were found to have in vitro antibacterial properties. Graphene oxide (GO) exhibits antibacterial activity toward Gram-positive and Gram-negative bacteria.13–15 The antibacterial activities of GO are mostly due to the physical and chemical interactions between GO and bacteria cells. The bacterial cell membrane has been identified as a significant target for GO cytotoxicity studies.16 Changes in the transmembrane potential, morphological changes in the cell structure, leakage of RNA and internal electrolytes, and uptake of membrane-impermeable dyes were all used to indicate membrane damage in GO-exposed bacteria.17,18 GO could adhere to the surface of bacteria cell walls, penetrate and disrupt cell membrane structure, and eventually induce cell death. The development of “pits” on the treated bacterial cell surface demonstrates the disruption and damage to the cell membrane.19 The sharp edges of the graphene nanosheets cut through the cell membrane of the bacterium, allowing the intracellular matrix to leak and leading to death.20 Furthermore, the antibacterial effect of GO is believed to be due to oxidative stress. This involves the overproduction of reactive oxygen species (ROS), which were later discovered to oxidize fatty acids, producing lipid peroxides that trigger a chain reaction leading to cell membrane rupture and cell death.20 The lipid peroxidation mechanism is enhanced by ROS, which causes lipid molecules to be oxidized to generate lipid peroxide radicals, initiating oxidative damage throughout the bacterial cell membrane by producing lesions and cellular content leakage.21 ROS formation triggers a series of pathogenic processes, including inflammation, fibrosis, genotoxicity, and carcinogenesis.22 In general, GO imposed several mechanisms of action, rendering it a potent and promising antibacterial agent. Moreover, GO has been shown to exhibit the enhanced antibacterial activity of empirical antibiotics by disrupting the bacterial membrane of Gram-positive bacteria and has also been studied in vancomycin resistance MRSA.23
Gallic acid (GA), a polyhydroxylphenolic compound, has a wide range of biological applications such as antiviral, antibacterial, anti-melanogenic, antimutagenic, anti-inflammatory, and anticancer activity in a range of cells and is distributed in various fruits, plants, and food.24,25 The antibacterial property of GA against several bacterial strains has been highlighted in many studies, and the mechanism of its bactericidal action has also been proven against certain bacteria.26 However, the development of gallic acid in clinical settings is often hindered by its rapid degradation, poor oral bioavailability, and absorption27,28 that lead to the rapid elimination of GA when administered in vivo.
Therefore, the present study aims to investigate the potential of GO, a graphene derivative with promising antibacterial properties, and GA, a phenolic compound known to inhibit multi-drug resistance (MDR), joined together using nanocomposite (GAGO) against MRSA strains. The present study has employed MRSA, MSSA, and CA-MRSA with and without the Panton-Valentine leucocidin gene (MRSA-pvl+ and MRSA-pvl-) as the strains of interest. To our best knowledge, no published report has evaluated the antibacterial activity of GO, as well as GAGO towards CA-MRSA, compared to commercially available MRSA and MSSA. In the present study, GAGO, which has been shown to possess antibacterial activity against MRSA,13 was synthesized and characterized according to a previously established method employed in our research group.13 The stability of the GAGO nanocomposite was further evaluated in different physiological media, and its toxicity profile was monitored in 3T3 murine fibroblast cells, as well as zebrafish embryonic models. The interaction of GAGO with MRSA strains was investigated by evaluating its antibacterial activity through disk diffusion, CFU counting method, time-kill study, and high-resolution transmission electron microscopy (HRTEM) observation.
Materials and Methods
Materials
All chemicals used were of the highest analytical grade available. Graphite (Gr) powder was purchased from Thermo Fisher Scientific. Sulfuric acid (PP: 98%, AR), phosphoric acid (H3PO4) (PP: 85%, AR), hydrogen peroxide (H2O2; PP: 30%, AR), hydrochloric acid (HCl; PP: 37%, AR), ethyl alcohol (PP: 99.8%, AR), diethyl ether, and potassium permanganate powder (KMnO4) were obtained from R&M chemicals. For the synthesis of gallic acid-loaded graphene oxide (GAGO), GA was procured from Sigma Aldrich and was used as purchased without further purification (St. Louis, USA). Phosphate-buffered saline (PBS, pH 7.4; Sigma-Aldrich, Missouri, USA) was used in the in vitro drug release analysis to determine drug release from the nanocomposite. Double deionized Milli-Q water (Millipore Corporation, Massachusetts, USA) and distilled water were used throughout the experiment. For the antibacterial assay, the chemicals used were sodium chloride (NaCl; Hamburgh Chem GmbH, Germany), 0.5 McFarland latex standard tube solution (Hardy Diagnostics, All Eights [M] S/B), Mueller-Hinton (MH) agar powder (Sigma-Aldrich, Missouri, USA) and MH broth powder (Sigma-Aldrich, Missouri, USA). For HRTEM sample preparation, the chemicals used were glutaraldehyde solution (Vijay Deep Medicose, Uttar Pradesh, India), horse serum (Sigma-Aldrich, Missouri, USA), cacodylate buffer (FUJIFILM Wako Pure Chemical Corporation, Osaka, Japan), acetone (Sigma-Aldrich, Missouri, USA), osmium tetroxide (Polysciences Asia Pacific, Inc., Taipei, Taiwan) and toluidine blue (Home Science Tools, Billings, USA).
Preparation of Gallic Acid-Loaded Graphene Oxide (GAGO) Nanocomposite
GAGO was prepared according to the methods by Dorniani et al29 and Shamsi et al13 with modifications. Native GA (0.25 g) and GO (0.05 g) were dissolved together in 50 mL of distilled water, and the pH of the solution was adjusted to 4.71 (Mettler Toledo, Greifensee, Switzerland) using 1 M of HCL. The mixture was stirred for 16 h (Heidolph, Schwabach, Germany), centrifuged at 4000 rpm for 15 min, washed with distilled water, and filtered using PTFE membrane (50 mm and 0.45 μm pore size; Sigma-Aldrich, Missouri, USA) to remove excess GA. The supernatant containing excess GA was decanted, and the suspension obtained inside the falcon tube was left to dry overnight in an oven at 40°C (Memmert GmbH + Co.KG, Schwabach, Germany).
Characterization of GO and GAGO Nanocomposite
The synthesized GO and GAGO nanocomposite were characterized with a UHTS 300 Raman spectroscopy (WITec, Germany) using 532 nm diode laser excitation to observe the structural difference among samples. The morphology of GO and GAGO nanocomposite was observed on a field emission scanning electron microscope (FESEM; FEI, USA), transmission electron microscope (TEM, Hitachi H-7100 equipped with a thermionic tungsten source at 200 kV), and atomic force microscopy (AFM, QUESANT 250, USA). X-ray diffraction (XRD; XRD-600 Diffractometer, Philips, Netherlands) analysis was performed on the synthesized GO, GAGO, and native GA as control. The percentage yield of the nanocomposite was quantified, and the loading of GA was analyzed using a UV-Visible spectrophotometer (Bio-Rad, USA). The zeta potential of GO and GAGO was measured using the dynamic light scattering zetasizer (Malvern Zetasizer, USA) in triplicates, with the results presented as mean ± SD.
GA Loading and Loading Efficiency
A linear calibration plot (y = 101.77x – 0.0061, R2 = 0.9994) was obtained by plotting the absorbance value at 262 nm30,31 of wavelength against the concentration of a standard GA stock solution (0–0.01 mg/mL). GA loading and loading efficiency (DL and LE) were determined by quantifying the GA content using the calibration curve of GA. A weighed quantity of GAGO (0.001 g) was well dispersed by stirring (Stuart, UK) for 10 min prior to absorbance analysis. DL and LE were calculated as below:

In vitro Drug Release Profiles
Approximately 25 mg of GAGO nanocomposite was dispersed into 30 mL of PBS (pH 7.4) at 37°C in a shaking water bath operating at 150 rpm. At predetermined time intervals over 24 h, 1 mL of sample was aliquoted from the medium and replaced with 1 mL of PBS to maintain the sink condition throughout the experiment. The amount of GA released was measured using a UV-Vis spectrophotometer at 262 nm. The cumulative GA release was calculated using Equation 3 and plotted against time to obtain the drug release profile.

Stability of GAGO Nanocomposite in Physiologically Relevant Media
A stability study of GAGO was performed in four different physiological media, ie, distilled water, PBS (pH 7.4), Dulbecco’s Modified Eagle medium (DMEM), and DMEM supplemented with 10% (v/v) of fetal bovine serum (FBS) at pH 7.4 to observe the effects of different physiological media towards the structure and surface charge of GAGO when dispersed in the medium. PBS was used to observe the stability of GAGO at pH 7.4, and DMEM was used to observe the stability of GAGO in a cell culture medium containing many substances such as vitamins, glucose, and nutrients that are important for cell growth. DMEM supplemented with 10% FBS was used to determine the stability of GAGO in the presence of protein albumin. The varied elements of the culture media may disrupt the stability of GAGO, leading to aggregation or agglomeration. Understanding the interaction of GAGO with the cell culture media is an important step for determining the interaction of GAGO with biological interfaces.
Previously synthesized GAGO (1 mg/mL) was dispersed in four physiological media, as stated above. The dispersion was characterized using the dynamic light scattering zetasizer to measure the zeta potential and TEM for morphology observation.
In vitro Cytotoxicity Assay
The 3T3 murine fibroblast cell line (passage 19) was obtained from the American Type Culture Collection (ATCC) in a cryogenic form. The cells were seeded with 200 μL DMEM supplemented with 10% (v/v) FBS in a 96-well plate with a density of 8×10⁴ cells per well and incubated in the incubator (37°C, 5% CO2) for 24 h. After 24 h, the old media in each well were removed, and each well was washed with 100 µL of PBS. The 3T3 fibroblast cells were treated with 200 μL of GO, GA, and GAGO at different concentrations (0–1000 µg/mL) in DMEM supplemented with 10% (v/v) FBS and 0.1% (w/v) of sodium dodecyl sulfate (SDS) as the positive control for 24, 48, and 72 h. At the incubation period, the old media were removed, and the cells were washed with 100 μL of PBS. Then, 200 μL of DMEM and 20 μL of MTT reagent were added to each well. The cells were incubated for 3 h in the incubator (37°C, 5% CO2). After incubation, the old media were removed, and 100 µL of DMSO was added to each well. The absorbance measurement was read at 570 nm using the microplate absorbance reader (Multiskan FC, Thermo Fisher Scientific, Waltham, MA, USA). The cell viability was calculated according to Equation 4 and reported as LC50 values.32

Zebrafish Embryo Acute Toxicity Test (ZFET)
The principle of embryonic toxicity assessment on the zebrafish embryo was based on the method developed by Nagel.33 The wild-type zebrafish (AB strain) was maintained by the Danio Assay Laboratories, Malaysia, according to procedures approved by the Institutional Animal Care and Use Committee (IACUC), Universiti Putra Malaysia (UPM/IACUC/AUP No. R024/2014). Healthy embryos at 4 h post-fertilization (hpf) received from the supplier (Danio Assay Laboratories) were transferred gently into a 96-well plate (one embryo per well) using a Pasteur pipette, and each well was filled with 200 µL of Danio embryo media. The embryo was incubated overnight at 28 ± 2°C, with a 12 h light/12 h dark cycle for acclimatization. After 24 h, healthy embryos were selected and treated with different concentrations (0–500 µg/mL) of GO, GA, and GAGO suspensions at 28°C in a semi-static condition for 96 h exposure (embryo age: 24 to 120 hpf). The embryos were arranged in three sets of 96-well plates, representing 3 different treatments (GO, GA, and GAGO). Each set includes 6 groups of 10 embryos placed in individual wells of 96 well plates, exposed to 50, 100, 150, 300, and 500 µg/mL of GO, GA, and GAGO treatment solutions. Embryos exposed to the embryo media served as the negative control. All treatment solutions were refreshed daily. The LC50 values were recorded at every time interval (24–96 h of exposure).
Reactive Oxygen Species Assay (ROS)
A total of 70 embryos at 24 hpf were segregated into 96-well plates according to the treatment group (n = 10 for each treatment group), with each well equivalent to one embryo. The embryos were treated with the treatment solutions (GO, GA, and GAGO) at 5 different concentrations (0–500 mg/mL). Distilled water was used as a negative control, while 0.5 mM of H2O2 was used as a positive control in this study. These embryos were treated at 4 different time points (30, 60, 120, and 240 min). After reaching the exposure time, embryos were washed twice with a wash buffer (PBS) and centrifuged at 10,000 rpm for 5 min at 4°C. The embryos were then homogenized in 500 µL of cold wash buffer (PBS) using a tissue homogenizer tube. Next, the homogenate was centrifuged at 12,372 rpm for 30 min at 4°C. The supernatant was transferred to a new tube and stored at −80°C for no more than 2 months or used for ROS assay assessment. The assay was run in triplicates.
About 20 µL of the homogenate was added to a black 96-well plate and incubated at room temperature for 5 min.34 After the incubation, each well was added with 100 µL of PBS and 8.3 µL of 2’-7ʹdichlorofluorescin diacetate (DCFH-DA) stock solution (dissolved in DMSO, 10 mg/mL). The plate was incubated for 30 min in the dark. The fluorescence intensity was measured using a microplate reader (Tecan Infinite M200) with excitation and emission wavelength of 485 and 530 nm.
Bacterial Strains
Four bacterial strains were used in this study, ie, MRSA (700,699) and MSSA (25,923) procured from ATCC and CA-MRSA Panton-Valentine leucocidin gene positive (MRSA-pvl+, A33) and Panton-Valentine leucocidin negative (MRSA-pvl-, 172,817) from our laboratory culture collection. All bacterial strains were from the Department of Biomedical Sciences, Faculty of Medicine and Health Sciences, UPM. These CA-MRSA isolates were previously collected from nasal swabs of healthy volunteers at the Faculty of Medicine and Health Sciences, Universiti Putra Malaysia.35 CA-MRSA sample isolates were preserved in glycerol stock at −80°C and labeled as MRSA-pvl+ and MRSA-pvl-.
Phases of the Bacterial Growth Curve
Approximately 25 mL of MH broth was prepared in a 100 mL conical flask. Another 3 mL of MH broth was poured into a 10 mL bottle for bacterial suspension stock. About 1 to 3 colonies of MRSA were sampled and mixed into the 10 mL bottle containing MH broth using a sterile and flamed loop. A volume of 400 μL bacterial suspension was pipetted and added to the MH broth in the conical flask. The flask was incubated on a shaking incubator at 120 rpm at 37°C throughout the experiment. Then, 1 mL of the broth was taken every hour to measure the absorbance using a UV-Vis spectrophotometer at 650 nm, and fresh MH broth was added back to the flask to replace the spent medium.
Kirby-Bauer Disk Diffusion Test
The Kirby-Bauer disk diffusion test was conducted according to the Clinical and Laboratory Standard Institute (CLSI 2013)36 guidelines to determine the susceptibility of all bacterial strains against GA, GO, and GAGO. The sterile disk was immersed with all samples (0–1000 µg/mL) and placed on the MH agar at room temperature for 30 min to ensure adequate diffusion prior to incubation in a shaking incubator at 37°C for 18 h (Sartorius, Germany). Distilled water was used as the negative control, while cefoxitin disk (CFX, 30 µg), a standard antibiotic, was used as the positive control.
Colony-Forming Units (CFU) Counting Method
The bacterial suspension of S. aureus (1.5 × 10⁵ CFU/mL) and different concentrations (0–1000 μg/mL) of test samples (GA, GO, and GAGO) were prepared. About 100 μL of MH broth, bacterial suspension, and test samples were added to the well plates. The plates were incubated at 37°C for 4 h in a shaking incubator. After 4 h of incubation, each mixture was diluted (100-folds) and spread evenly over the entire surface of MH agar using a sterile cotton swab to obtain a uniform plate of surface growth. The Petri dish was allowed to dry at room temperature prior to 18 h incubation at 37°C to allow for bacterial colony growth. The colonies were counted and recorded as a colony-forming unit (CFU). The test also included a negative control (distilled water) and positive control (CFX). The result was presented as CFU and percentage of inhibition.37
Time-Kill Experiment
S. aureus suspension was prepared similar to the CFU counting method procedure (1.5 × 10⁵ CFU/mL), and test samples (GA, GO, and GAGO) were prepared at the selected concentration of 150 μg/mL.38 About 25 mL of bacterial suspension and 25 mL of test samples were added into the conical flask containing 100 mL of MH broth. A flask without test samples or antibiotics was included. The flasks were incubated on a shaking incubator at 37°C and 150 rpm for 24 h. At predetermined time intervals, 100 μL of the sample was taken from each flask and spread on top of the MH agar for colony count.
High-Resolution Transmission Electron Microscopy (HRTEM) Analysis
Following the time-kill experiment, MRSA and MSSA strains exposed to GO, GA, and GAGO were subjected to the HRTEM analysis to investigate their interactions with the bacterial samples. Specimen preparation for electron microscopy was conducted according to the guidelines provided by the Microscopy Unit, Institute of Bioscience (IBS), UPM. Samples embedded in resin were sectioned to 1 µm thickness using a microtome equipped with a glass knife (Jinhua Hisure Scientific Co., Ltd. Zhejiang, China). Sections were placed onto glass slides, stained with toluidine blue, and dried on a hot plate. The stained sections were washed with distilled water and examined under a light microscope (WITec Pte. Ltd., German Centre, Singapore) to select the area of interest. These sections were dried using a filter paper (50 mm of diameters), placed onto 100-mesh copper grids, stained with uranyl acetate (1% in water) for 15 min, and washed thrice with water. The stained sections were visualized under the HRTEM at 100 kV (Zeiss GmbH, Jena, Germany).
Statistical Analyses
Statistical analysis was performed using SPSS 16.0 (SPSS Inc., Chicago, IL, USA). One-way analysis of variance (ANOVA) was used to determine the significance of the antibacterial effect of GA, GO, and GAGO at different concentrations exposure to different bacterial strains, ie, MRSA, MSSA, MRSA-pvl+, and MRSA-pvl-. Data were presented as the mean ± standard deviation (SD), and the data were significant when the p-value was ≤0.05.
Results
Synthesis and Characterization of GAGO
GO was synthesized via modified Hummer’s method, a chemical process utilized to generate GO using Gr powder. It is known as a safer, faster, and more efficient method of producing GO. Following the successful synthesis of GO, the GO powder obtained was further used to load native GA at a ratio of 1:5 w/w (GO:GA) to produce the GAGO nanocomposite.
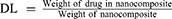
The absorption spectra of GA, GO, and GAGO were measured using a UV-Vis spectrophotometer from 200 nm to 800 nm to identify their peak absorbance. Figure 1A shows a strong absorption peak of GO at 230 nm due to the π→π* transition of C=C ring bonds. Meanwhile, GA and GAGO exhibit two similar peaks at 214 and 262 nm. The results indicate that the loading of GA in GO was successful, forming GAGO nanocomposite, as noted in the absorption peaks of GA seen in GAGO.
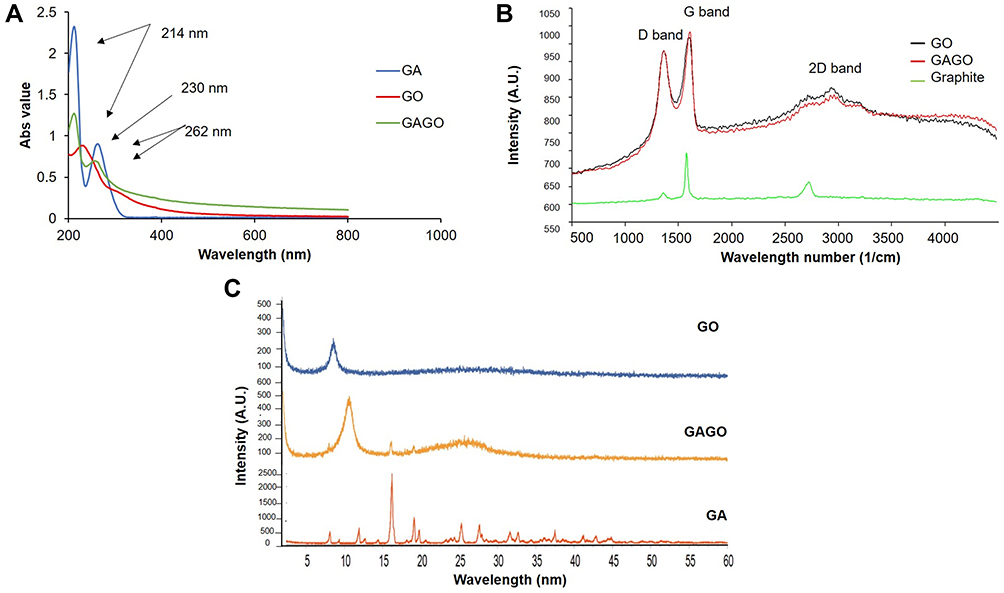 |
Figure 1 (A) UV-Vis absorbance spectra of GA, GO, and GAGO samples, (B) Raman spectra of GO, GAGO, and Gr obtained using 532 nm diode laser excitation. The G band is a result of in-plane vibrations of sp2 bonded carbon atoms, while the D band represents plane vibrations attributed to the presence of structural defects, (C) XRD patterns of GO, GAGO, and GA measured at 40 kV and 40 mA with a scanning rate of 5°/min and 2ϴ angles ranging from 5° to 60°. |
Raman spectroscopy has been widely employed as a non-destructive method to characterize several materials, particularly carbon materials with varying structures and crystal arrangements. The defects and disorders in Gr, GO, and GAGO crystal structure were studied using Raman spectroscopy. Based on the Raman spectra shown in Figure 1B, the D band was observed at 1361 cm−1, while the G band was at 1594 cm−1 for Gr, GO, and GAGO. On the other hand, the 2D band can be observed at 2930 cm−1 for both GO and GAGO, while the 2D band for Gr was observed at 2724 cm−1. The D band indicates the disorder present in the sp2 carbon network. The broadening of the D band in GO and GAGO might be related to the reduced sp2 domain size due to distortions, defects, and vacancies during oxidation. The G band comes from first-order Raman scattering and is usually present in all sp2 carbon forms. The second-order dispersive Raman mode for the Gr, GO, and GAGO is represented by the 2D band in the Raman spectra. The Raman spectra of GO and GAGO nanocomposite showed no significant shift in the D band and G band. As in the present study, the synthesized GO and GAGO nanocomposite showed a similar occurrence of spectra which further confirms that GO and GAGO have been successfully synthesized.
XRD analysis (Figure 1C) was applied to evaluate the crystal structure of all samples, ie, GO, GAGO nanocomposite, and native GA. The presence of several characteristic peaks at about 2ϴ degree of 16.22°, 25.3°, and 27.65° in the XRD profile of native GA are representatives of the highly crystalline structure of GA.29 A characteristic peak at 2ϴ degree of 8.60° was observed for GO, attributed to the diffraction of the (001) for GO, due to the formation of oxygen-containing functional groups, such as carboxylic acid, hydroxyl groups, and epoxides between the hydrophilic GO layers.39 A significant shift of the characteristic peak of GO was noted when loaded with GA. The characteristic peak of GO shifted from 8.60° to 10.15°, with the appearance of new characteristic peaks at 16.22° and 19.06°, attributed to the characteristic peaks of GA, confirming the loading of the GA sample through the surface coating.
FESEM (FEI, USA) and TEM were employed to further elucidate the surface morphology and structure of GO and GAGO as an aqueous dispersion. Figures 2A and B revealed the wrinkled, thin film surface morphology of GO, consistent with the previously reported morphology of GO as a large sheet with a rippled, silk-like surface.39,40 Figures 2C and D show the FESEM and TEM micrographs of GAGO, with a thicker and denser structure than GO. This further confirms that the loading process of GA has occurred according to the changes in the structures of GAGO compared to GO itself. Similar GO and GAGO morphological variations were further observed in AFM images (Figure 3). Figure 3A shows a typical AFM image of GO, comprising wrinkled and occasional folds of a few layers of GO sheets. It is evident that the loading of GA alters the surface topography of GO (Figure 3B), as observed by FESEM and TEM images. The visible stacked-up layers of GA are noticeable in the AFM image, which indicates the surface coating of GA onto the surface of GO. GAGO has a reduced porosity and roughness (Figure 3D) compared to GO (Figure 3C), which is pivotal in the interaction of GAGO with bacteria cells that could inhibit biofilm formation.41
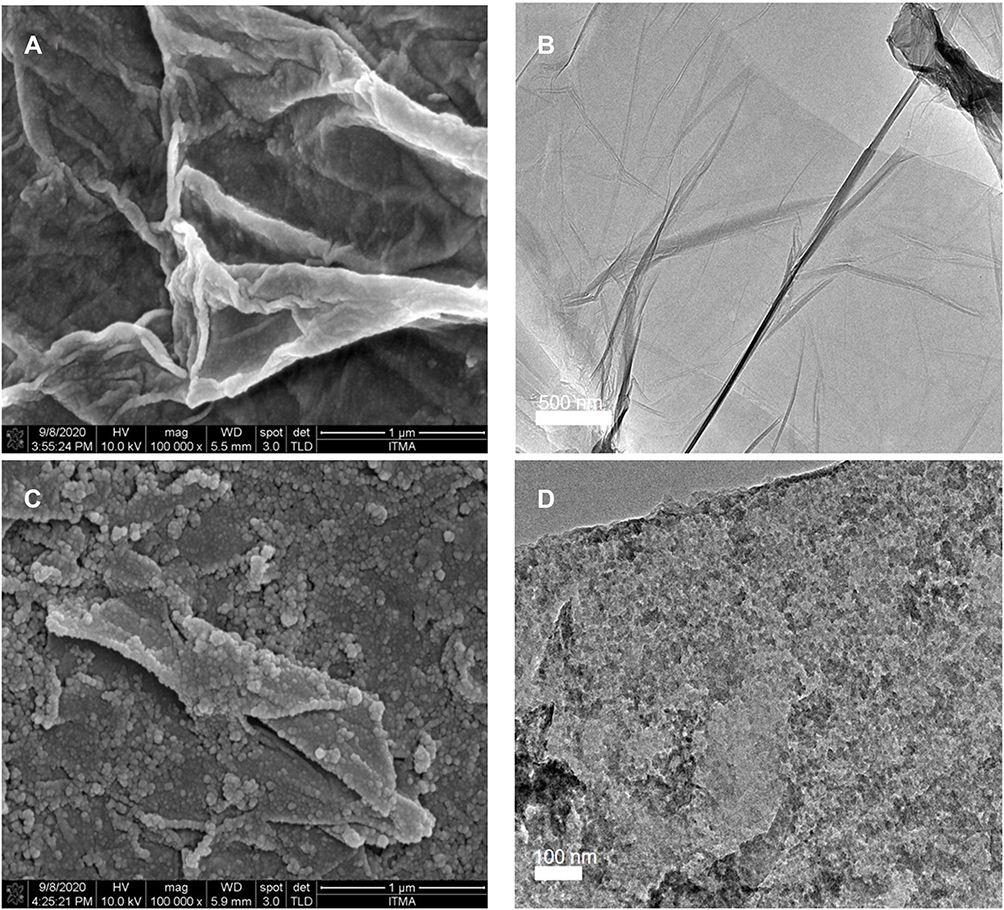 |
Figure 2 FESEM and TEM micrographs of (A) GO, (B) GO (TEM), (C) GAGO, and (D) GAGO (TEM) dispersed in distilled water at 1 mg/mL. The scale bars shown are 1 µM for FESEM, 500 nm (B), and 100 nm (E) for TEM. |
 |
Figure 3 Characterization of the surface by 2D images of (A) GO and (B) GAGO as observed by AFM, and the 3D image analyses of (C) GO and (D) GAGO. |
The loading of native GA in the GAGO nanocomposite was evaluated using a simple, rapid, and precise spectrophotometric method (Bio-Rad, USA). A previous study has reported that GA has a maximum absorption at a wavelength of 262 nm.28 In this study, a linear calibration plot (y=101.77x – 0.0061, R2 = 0.9994) was obtained by plotting the absorbance values at 262 nm against the concentration of standard GA solution (0–0.010 mg/mL). The drug loading of native GA and the loading efficiency were calculated from the equation. The consistency between GAGO batches was maintained throughout in terms of yield and drug loading. Table 1 shows that GA was successfully loaded at 241 ± 0.05 mg of 1 g of GAGO, with a loading efficiency of 28.92 ± 6.20%.
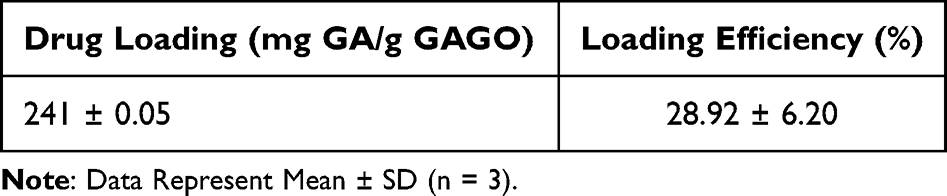 |
Table 1 Characteristics of GAGO Nanocomposite Prepared at a Weight Ratio of 1:5 w/w GO:GA |
A typical two-phase release profile was observed for GA from the GAGO nanocomposite when it was added to the release medium, as observed by the relatively slow release of 13% GA load in the initial 4 h, followed by a rapid increase of GA release up to 51.62% at 10 h. The maximum percentage release of GA from GAGO was only achieved at 48 h (95%) and further increased to 106% at 72 h (Figure 4).
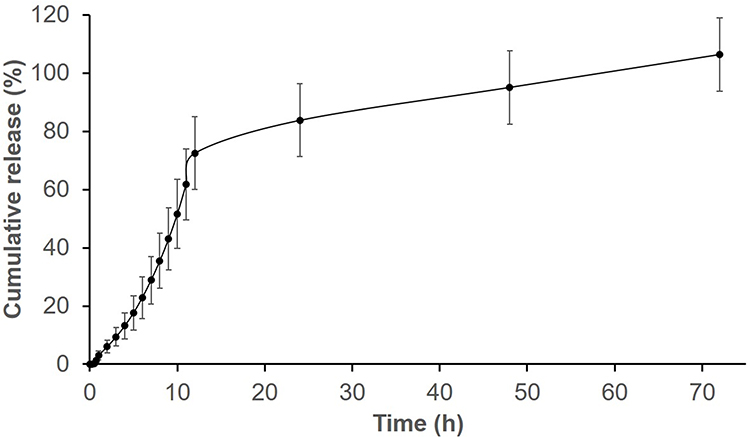 |
Figure 4 In vitro release profile of GA from GAGO solution. 25 mg of GAGO was dispersed into 30 mL of PBS (pH = 7.4) at 37°C in a shaking water bath operating at 150 rpm. At predetermined time intervals over 24 h, 1 mL of sample was aliquoted from the medium, and the aliquoted sample was replaced with 1 mL of PBS to maintain the sink condition throughout the experiment. Data represents mean ± SD (n = 3). |
Stability of GAGO in Physiologically Relevant Media
Figure 5 shows that GO in water has a higher negative zeta potential than GAGO. GO has a zeta potential value of −32.1 ± 0.954 mV, while GAGO showed a zeta potential value of −21.17 ± 0.757 mV. The high negative zeta potential of GO is most likely due to the oxygen-containing functional groups on the surface of GO. On the other hand, GAGO exhibited an increase in the zeta potential value, with a lower negative zeta potential compared to GO, due to the loading of GA onto the surface of GO through interaction with the oxygenated functional groups and surface coating.
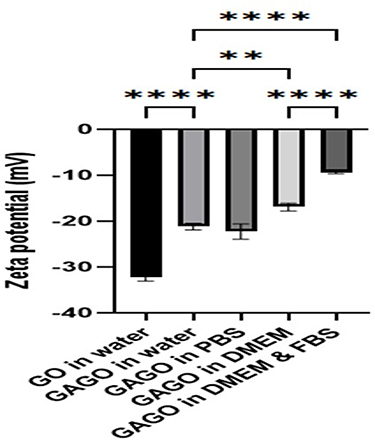 |
Figure 5 The zeta potential (mV) of GO and GAGO in four different physiological media. ** and ****Denotes the significant difference between the zeta potential of each sample with p < 0.01 and p < 0.001, respectively. |
The dispersion of GAGO into four physiological media such as distilled water, PBS, DMEM, and DMEM with 10% FBS significantly affects the zeta potential value of GAGO. From Figure 5, no significant difference in the zeta potential between GAGO dispersed in water and PBS was observed, indicating the stability of GAGO in saline buffered solution at the physiological pH of 7.4. GAGO has also shown to yield a stable dispersion in PBS, pH 7.4 upon incubation for 72 h at 37°C when compared to GA (Figure S1).
However, there was a significant difference in the zeta potential between GAGO dispersed in water with GAGO in DMEM supplemented with 10% FBS. Lower negative zeta potential was observed in GAGO dispersed in DMEM supplemented with 10% FBS (−9.35 ± 0.312 mV) compared to GAGO dispersed in DMEM only (−16.93 ± 0.862 mV). The morphology and characteristics of GAGO in these different physiological media were further observed by TEM (FEI, USA). According to Figure 6A–C, GAGO exhibited a similar, denser thin film in its respective medium. On the contrary, the TEM morphology of GAGO in DMEM with 10% FBS exhibited the appearance of small micellar particles, with sizes in the range of 20–50 nm; however, these particles displayed some aggregation among each other (Figure 6D). Collectively, from the TEM observation, we could deduce that there are no obvious aggregations or agglomerations of GAGO in all physiological media.
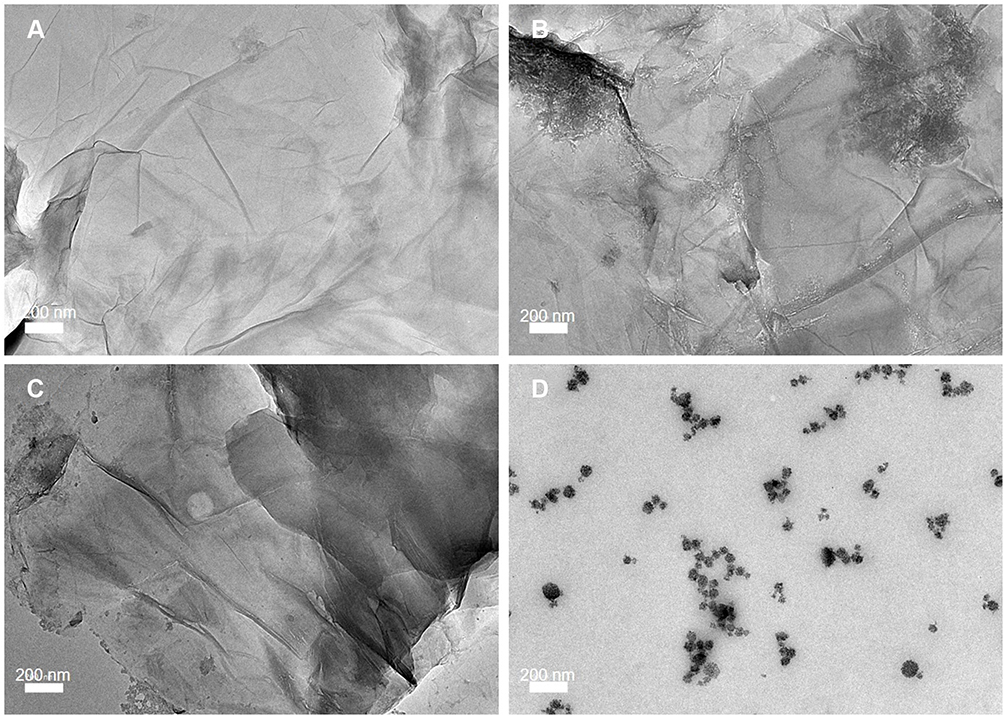 |
Figure 6 TEM micrographs of (A) GAGO in water, (B) GAGO in PBS, (C) GAGO in DMEM, and (D) GAGO in DMEM with 10% FBS dispersed at 1 mg/mL at 100,000× magnification. Scale bars represent 200 nm. |
In vitro Cytotoxicity MTT Assay Using 3T3 Fibroblast Cells
In vitro cytotoxicity MTT assay was conducted to analyze the effect of GA, GO, and GAGO against 3T3 fibroblast cells. The 3T3 fibroblast cells were exposed to various concentrations of GA, GO, and GAGO for 24, 48, and 72 h, with 0.1% (w/v) SDS as the negative control. Based on Figure 7, GAGO exhibited low toxicity effects on cell viability at all incubation times compared to GA. GA reduced cell viability to 22.2% at 50 µg/mL only upon 24 h of exposure (Figure 7A), while GO affected the cell viability to 34.75% at the same concentration after 48 h of exposure (Figure 7B). GAGO only affected the cell viability after 72 h of treatment, reducing the cell viability to 29.14% at 50 µg/mL compared to GA, where the cell viability was reduced to 4.95% at a similar concentration comparable to the positive control, SDS (Figure 7C). From the results, GA exhibited more prominent toxicity towards the cells as early as 24 h post-treatment at the concentration of 50 µg/mL, with the reduction of cell viability down to 22.16%.
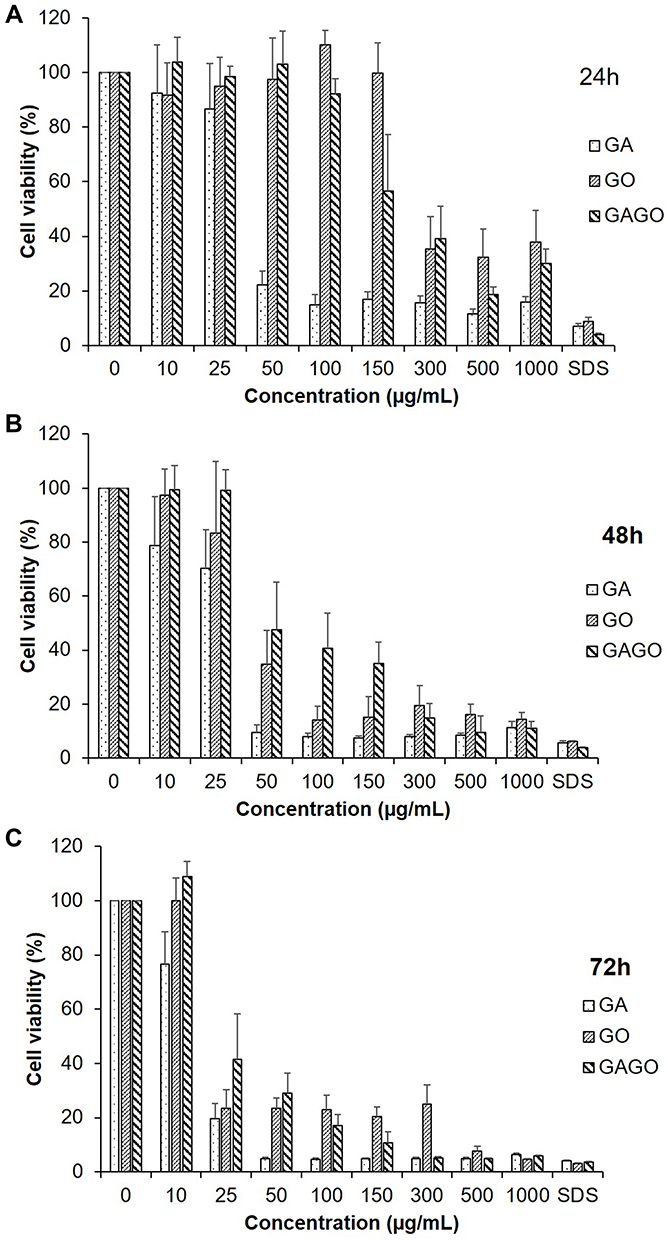 |
Figure 7 Cytotoxicity of GA, GO, and GAGO at concentrations of 0 to 1000 µg/mL against the 3T3 fibroblast cells at 24 h (A), 48 h (B), and 72 h (C). SDS 0.1% was used as a positive control. The viability of the cells was expressed as a percentage of the cells exposed to the appropriate medium, and the results were expressed as mean ± SD (n≥3). |
The 50% lethal concentration (LC50) values of GO, GA, and GAGO towards the 3T3 fibroblast cells were determined from the cell viability data. Table 2 shows that GA has lower LC50 than GO and GAGO at all exposure times (24–72 h). It indicates that GA exhibited a higher toxicity effect than GO and GAGO and could decrease 50% cell viability at a lower concentration of 38.26 ± 8.549 µg/mL, as early as 24 h. GAGO showed a lower LC50 compared to GA at all exposure times. The LC50 of GAGO decreased significantly from 245.30 ± 9.867 µg/mL at 24 h, 78.91 ± 9.172 µg/mL at 48 h, and 28.95 ± 6.674 µg/mL at 72 h.
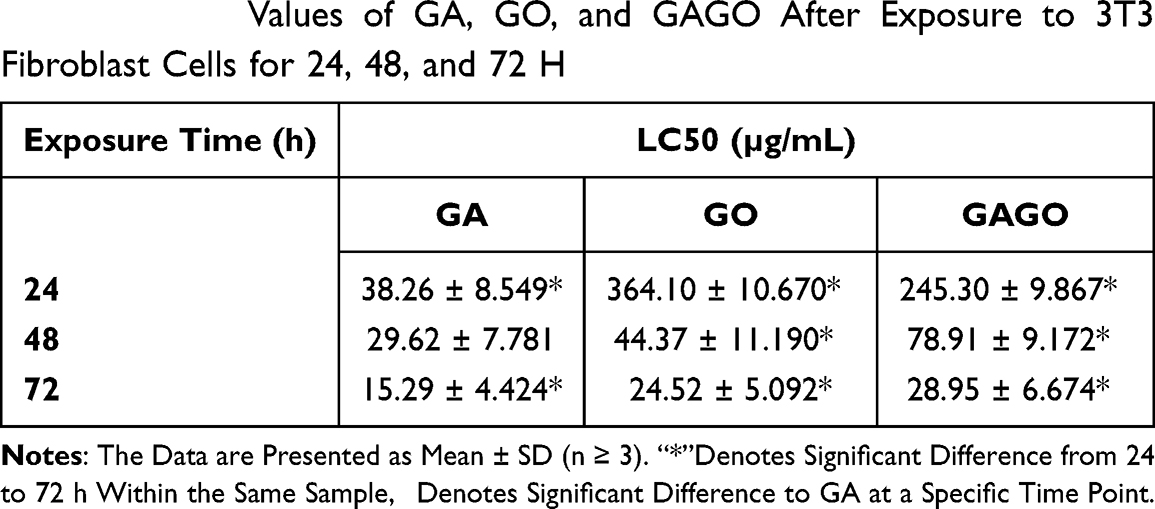 |
Table 2 LC50 Values of GA, GO, and GAGO After Exposure to 3T3 Fibroblast Cells for 24, 48, and 72 H |
Zebrafish Embryo Acute Toxicity Test (ZFET)
The toxicity effects of GO, GA, and GAGO were further assessed in the concentration determination that led to 50% death of zebrafish embryos, referred to as LC50, at 4 time points (24–96 h exposure). Figure 8A shows that most embryos treated with pure GO have the LC50 slightly higher or below 50 μg/mL at all time points. Meanwhile, the LC50 of embryos treated with pure GA showed more than 500 μg/mL at 24 h post-exposure. However, the concentration that caused 50% death of zebrafish embryos decreased continuously over time. By 96 h post-exposure, the LC50 of GA-treated embryos was 24 μg/mL (Figure 8B). In comparison, embryos exposed to GAGO showed greater improvement than the native compounds, GO and GA. LC50 of the GAGO-treated group was ≥500 μg/mL and 78 μg/mL at 24 to 72 h exposure and 96 h post-exposure. Together, these data suggest that GAGO nanocomposite is safe to be used at concentrations of ≥500 μg/mL for up to 72 h of exposure.
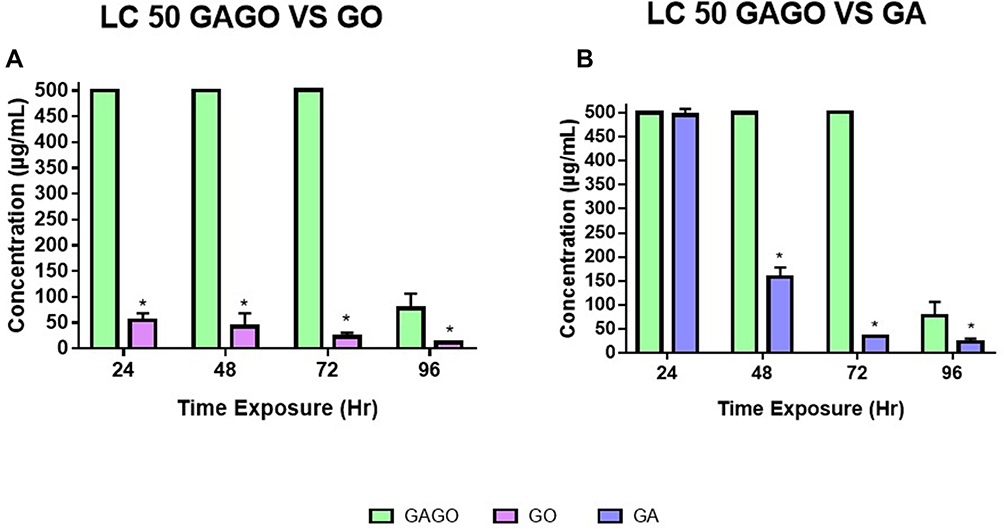 |
Figure 8 Lethal concentration at 50% (LC50). Lethal concentration at 50% (LC50) of zebrafish embryo for each timepoint of exposure (24, 48, 72 and 96 h) in (A) LC50 GAGO vs GO, (B) LC50 GAGO vs GA. Data were averaged from three independent experiments and are shown as mean ± SEM. Significant differences between experimental groups are denoted by “*” (Two-way ANOVA, followed by a post hoc test: Dunnet’s, p ≤ 0.05). |
Reactive Oxygen Species in Zebrafish Embryo-Treated with GO, GA, and GAGO
The ROS content of embryos treated with pure GO, pure GA, or GAGO nanocomposite was measured at 4 time points (30–240 min), as shown in Figure 9. In the present study, GO-treated embryos exhibited strong ROS content (Figure 9A–D) than pure GA and GAGO nanocomposite. A notably high ROS content was observed in embryos treated with 50 μg/mL of GO as early as 30 min of exposure. The generation of ROS continues at 60 min post-exposure, with most of the concentrations (100, 150, and 300 μg/mL) significantly elevating the ROS content compared to the control. This pattern continues at 120 min exposure, with embryos treated with 150 μg/mL of GO showing a significantly high ROS content. Interestingly, unlike GO, GAGO was observed to have maintained a comparable ROS content to the control group at all concentrations tested throughout the time points measured (30–240 min).
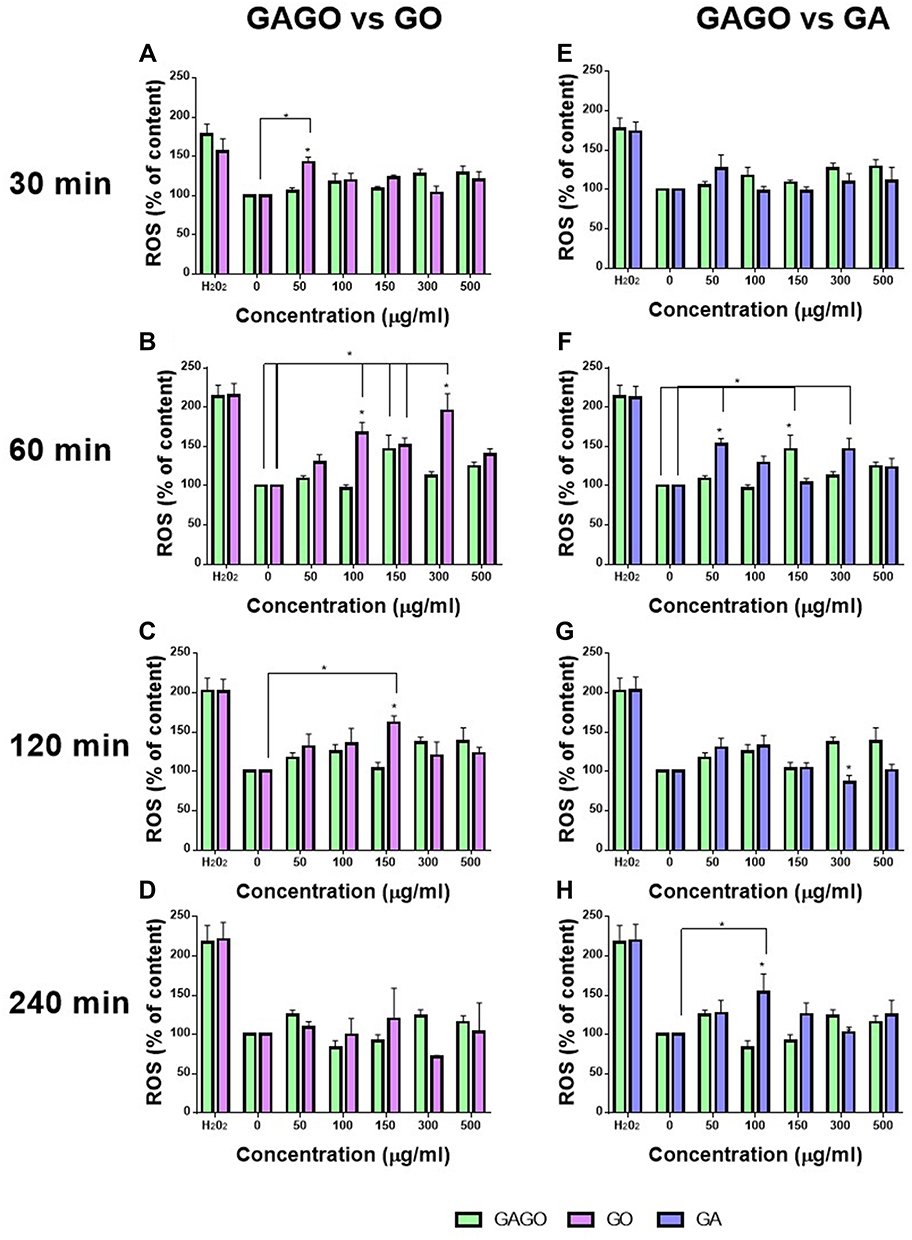 |
Figure 9 Reactive Oxygen Species content (ROS). This figure shows the ROS content on zebrafish embryos treated with GO, GA, and GAGO at four time points (30, 60, 120, and 240 min). (A–D) shows the comparison of ROS content between GAGO and GO, while (E–H) shows the comparison of ROS content between GAGO and GA. Significant differences between experimental groups are denoted by “*” (Two-way ANOVA, followed by a post hoc test: Dunnet’s, p ≤ 0.05). |
As shown in Figure 9E–H, GA-treated embryos maintained a comparable ROS content to control groups at 30 min of exposure. However, the production of ROS content was significantly elevated at 60 min post-exposure in 50 and 300 μg/mL of GA-treated embryos. This pattern of ROS content reverted to the normal range at 120 min post-exposure. Conversely, GAGO-treated embryos showed a marked improvement in ROS content compared to the pure GO and pure GA treatments. Most of the GAGO-treated embryos showed a normal range of ROS content in all concentrations tested and time points, but high ROS content was only observed in embryos treated with 150 μg/mL of GAGO at 60 min compared to the control.
Growth Curve of S. aureus
The differences in the growth pattern of all bacterial strains are shown in Figure 10. The lag phase for MRSA strain started from 0 to 1 h after incubation, while the log phase started at 2 h to 14 h after incubation. The MRSA strain exhibited an exponential growth at the log phase before reaching a plateau growth rate (stationary phase) at 12 h and above. Figure 9 also shows the growth curve of the MSSA strain. The lag phase started from 0 to 3 h after incubation and continues to the log phase from 4 h to 14 h after incubation. The MSSA strain only exhibited a stationary phase at 15 h, indicated by the plateau absorbance reading, which was 3 h later than the MRSA strain. The growth of the MRSA strain was much slower (Figure 10, at 2 to 3 h) than the MSSA strain at the commencement of the log phase (Figure 10, at 3 to 4 h), although their growth rates were almost similar throughout the exponential growth phase. This situation suggests that their virulence may be at least partly due to such a difference in the growth pattern.
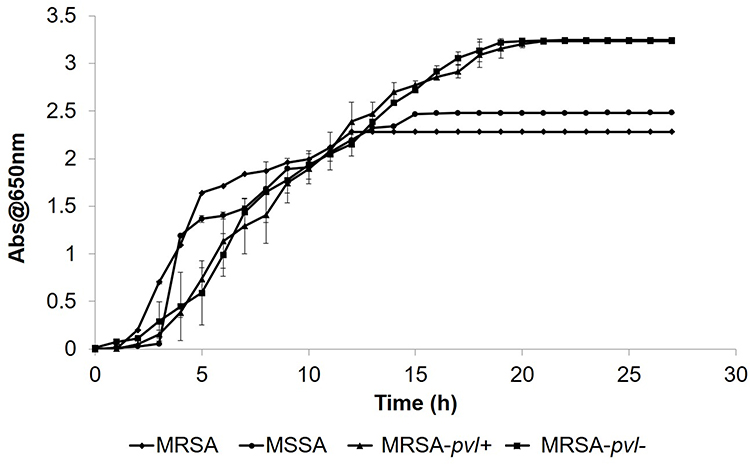 |
Figure 10 The growth curve of MRSA, MSSA, MRSA-pvl+, and MRSA-pvl-. Bacterial cultures were incubated on a shaking incubator at 120 rpm at 37°C throughout the experiment. Then, 1 mL of the bacterial culture was taken every hour for 28 h to measure the absorbance reading at 650 nm. The spent medium was replaced with a fresh MH broth. Data represent mean ± SD (n = 3). |
The lag phase for MRSA-pvl+ bacteria isolate was observed from 0 to 1 h upon incubation at 37°C, followed by a significant exponential phase at 2 to 17 h of incubation. The MRSA-pvl+ isolate achieved its stationary phase, with plateau growth recorded at 18 h and above, later than the MRSA and MSSA strains, with the stationary phase occurring at 12 and 15 h. The growth curve for MRSA-pvl- exhibited a lag phase from 0 to 1 h incubation, and exponential growth was only achieved from 2 h until 17 h following incubation. Plateau absorbance reading was noted at 18 h and above. The growing pattern of MRSA-pvl- was similar to the MRSA-pvl+ strain, but both showed a slower growth rate at the beginning of the log phase (2 h) compared to MRSA and MSSA strains. On the other hand, higher absorbance readings in the stationary phase for CA-MRSA strains indicate an increasing number of bacterial cells, exceeding the number of cells for MRSA and MSSA strains.
Antibacterial Activity
The antibacterial effects of all samples, ie, GA, GO, and GAGO, were investigated against MRSA, MSSA, MRSA-pvl+, and MRSA- pvl- using the Kirby-Bauer disk diffusion test. GA exhibited a concentration-dependent effect on all strains, as observed by a significant increase in the diameter of the zone inhibition (Figure 11A). However, GA only inhibited the growth of MRSA, MSSA, and MRSA-pvl+ at higher concentrations (150 µg/mL for MRSA and MSSA, and 300 µg/mL in MRSA-pvl-) compared to GO and GAGO, which contradict GO and GAGO. In the present study, GO inhibited the growth of MRSA and MSSA at 100 µg/mL, while a higher concentration of GO was needed to inhibit the growth of MRSA-pvl+ and MRSA-pvl- at 150 µg/mL (Figure 11B). A similar observation was recorded for GAGO. No significant difference was observed in the effect of GAGO with GO in inhibiting the growth of MRSA, MSSA, and MRSA-pvl- (Figure 11D), albeit an improved effect on MRSA-pvl+ strain (Figure 11C). Meanwhile, GAGO exhibited a zone of inhibition at a lower concentration of 100 µg/mL, which warrants further investigation.
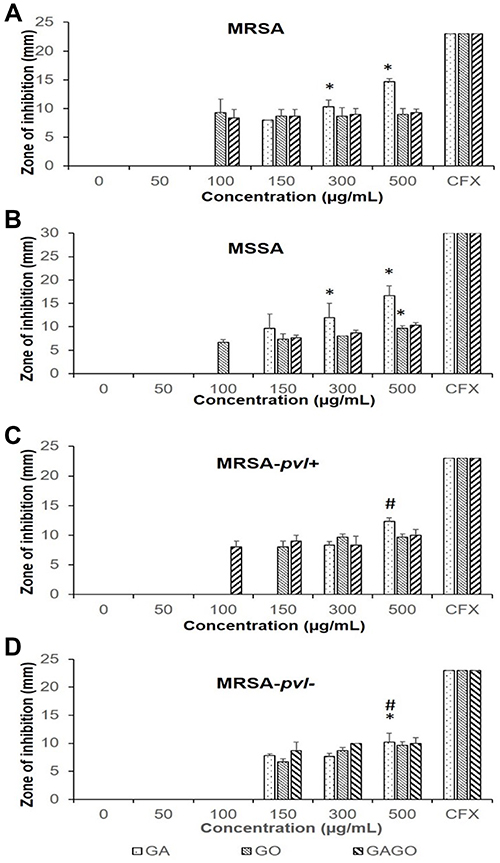 |
Figure 11 Zone inhibition of (A) MRSA, (B) MSSA, (C) MRSA-pvl+, and (D) MRSA-pvl- following exposure to GA, GO, and GAGO for 18 h at different concentrations (0-–500 µg/mL). MRSA, MSSA, MRSA-pvl+, and MRSA-pvl- treated with distilled water served as negative control (CTRL), while CFX acts as the positive control. Data represent mean ± SD (n = 3). Significant differences between experimental groups are denoted by *(Significant difference to 150 µg/mL) and #(Significant difference to 300 µg/mL; One-way ANOVA, followed by a post-hoc Tukey’s test, p ≤ 0.05). |
The extent of inhibition imposed on MRSA, MSSA, MRSA-pvl+, and MRSA-pvl- by GA, GO, and GAGO was further investigated by evaluating the CFU of each bacteria following exposure (Figure 12). It is also worth noting that among all bacterial strains, the community-acquired strains (MRSA-pvl+ and MRSA-pvl-; Figure 12C and D) showed less susceptibility to all samples compared to MRSA and MSSA (Figure 12A and B). In contrast to the disk diffusion experiment in Figure 11, all samples exhibited an inhibitory effect on the growth of MRSA at a concentration as low as 50 µg/mL. GA exerted 98.32% inhibition towards MRSA at 50 µg/mL, significantly comparable to CFX, a conventional antibiotic used in the present study as the positive control (Figure 12A). In contrast, GAGO exhibited a 95.96% inhibition towards MRSA at a higher concentration, 300 µg/mL, comparable to CFX (Figure 12A). A similar trend was observed for GA and GAGO in MSSA (Figure 12C).
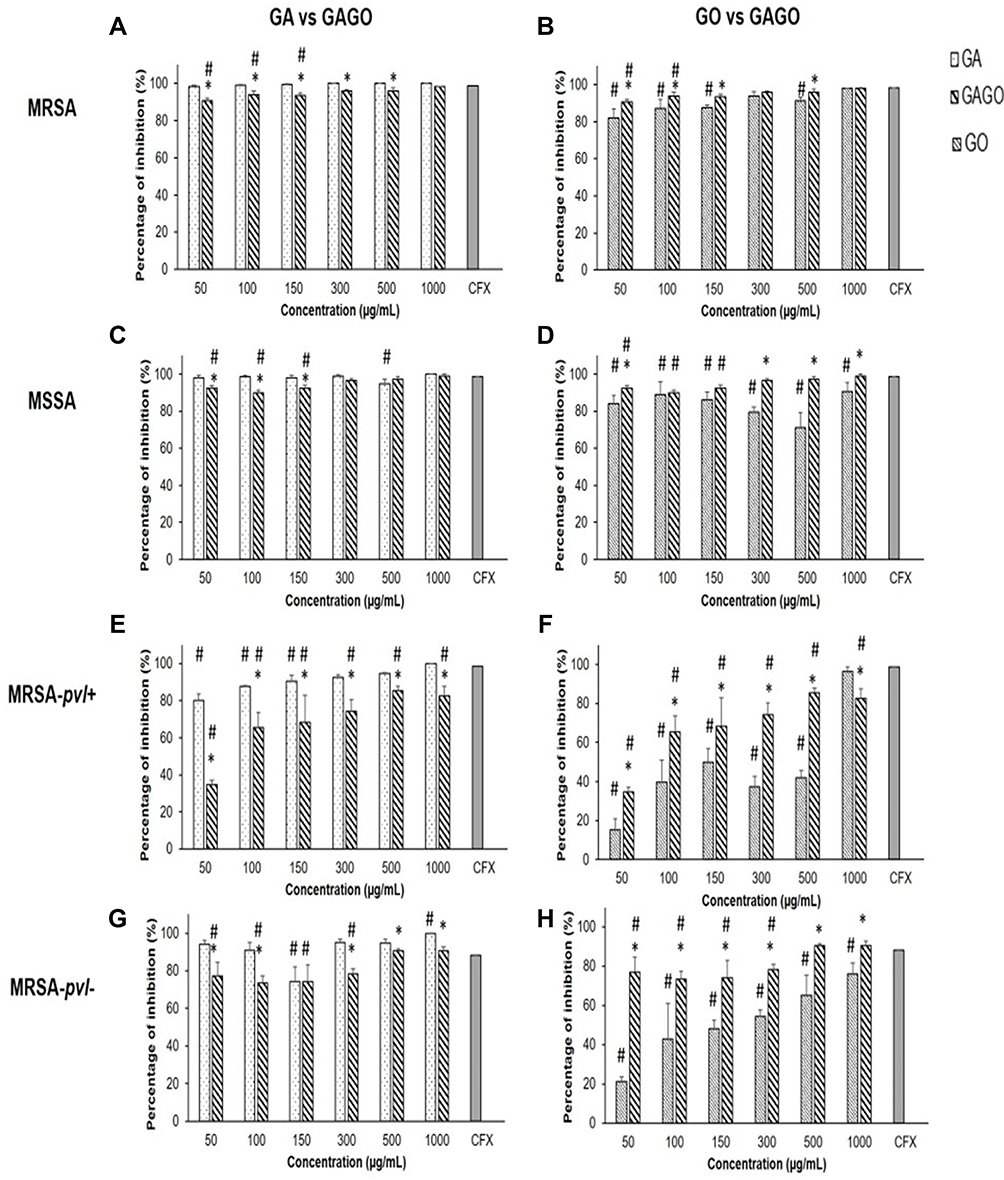 |
Figure 12 Percentage of inhibition of (A–B) MRSA, (C–D) MSSA, (E–F) MRSA-pvl+, and (G–H) MRSA-pvl- following exposure to GA, GO, and GAGO for 18 h at different concentrations (50–1000 µg/mL) compared to the positive control, CFX. Data represent mean ± SD (n = 3). Significant differences between experimental groups are denoted by * and #Denotes significant differences in CFX (One-way ANOVA, followed by a post-hoc Tukey’s test, p ≤ 0.05). |
In contrast to MRSA (Figure 12B), GO had a lower effect on MSSA, with only 71.26% inhibition at 500 µg/mL (Figure 12D). MRSA-pvl+ was resilient to all treatments, with lower inhibition at lower concentrations of samples observed (Figure 12E and F), where MRSA-pvl+ was inhibited up to 80.13% for GA (Figure 12E), 15.38% for GO (Figure 12F), and 34.61% for GAGO at 50 µg/mL (Figure 12E). Furthermore, GO exhibited a more significant effect on the inhibition of MRSA-pvl+ (96.37%) than GAGO (82.70%) at a similar concentration of 1000 µg/mL (Figure 12F). GA shows a similar trend of inhibition for MRSA-pvl- (Figure 12G) compared to MRSA and MSSA, with a significant inhibition observed at 50 µg/mL. The increase in the percentage of inhibition for GAGO is concentration-dependent, with a significant comparable inhibition to CFX at 500 and 100 µg/mL (Figure 12G). Conversely, GO was observed less effective towards MRSA-pvl- compared to GAGO and CFX at all concentrations employed (Figure 12H).
To investigate the antibacterial kinetics, the time-kill experiment of all samples, GA, GO, and GAGO at 150 µg/mL using all strains was conducted (Figure 13). The extent of growth inhibition is dependent on the time exposure, with greater suppression of the growth of all bacteria strains at prolonged exposure (Figure 13A–D). There was a time-dependent decrease in the growth of all strains when exposed to GA, GO, and GAGO. GAGO showed a delayed response for all strains. In MRSA, the percentage of GAGO inhibition was as low as 1.63% within the first hour of exposure (Figure 13A). This is contrary to GO and GA, which exhibited 16.98% and 29.44% inhibition within the same period (Figure 13A). The effect of GAGO on MRSA was tremendously increased following 2 h of exposure, at 48.41%, comparable to GA and GO, with only 44.88% and 42.38% of inhibition on MRSA (Figure 13A). The effects of GAGO on MRSA showed an increasing trend up to 3 h, with 65.67% of inhibition on MRSA, followed by a slow and sustained increase in the growth inhibition of MRSA at 8 to 12 h (Figure 13A). The increase in the percentage of inhibition of MRSA by GAGO was again observed at 18 to 24 h, where it reaches a comparable percentage to GA at 98.11%. In contrast to GAGO, GO exerted a lower percentage of inhibition towards MRSA throughout the experiment (Figure 13A). A similar trend was also observed with the MSSA strain (Figure 13B). GAGO exerted a significantly higher effect on the inhibition of MSSA than GA at 2 h, with 56.30% of inhibition, compared to only 42.19% of GO and 50.74% of GA (Figure 13B). A slow and sustained effect of GAGO was observed for MSSA, with a sharp increase in the inhibition effects from 18 to 24 h (86.74% to 98.93%). A further delay in the inhibition effect was significantly noted in the CA-MRSA strains, which shows that GAGO could only cause effects towards MRSA-pvl+ after 3 h of exposure (Figure 13C) and 4h for MRSA-pvl- (Figure 13D). However, the effects of GAGO on MRSA exhibit a sharp increase at 12 to 18 h before reaching a comparable percentage of inhibition to GA at 24 h with 98.30% and 97.67% for MRSA-pvl+ (Figure 13C) and MRSA-pvl- (Figure 13D). The time-kill experiment of CFX was also conducted, in which it demonstrated a total inhibition of all strains upon >3 h of exposure (Figure S2).
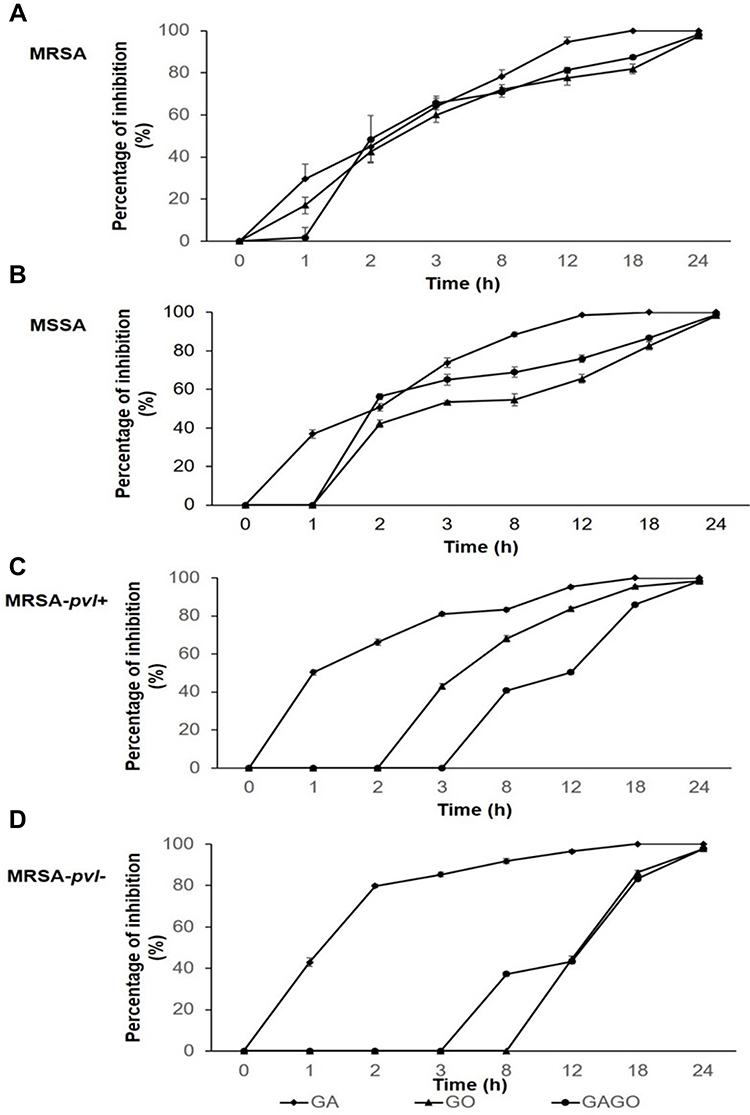 |
Figure 13 Percentage of inhibition of (A) MRSA, (B) MSSA, (C) MRSA-pvl+, and (D) MRSA-pvl- following exposure to GA, GO, and GAGO for 0–24 h at 150 µg/mL. Data represent mean ± SD (n = 3). |
HRTEM Observation
The morphological changes of bacterial cells, particularly the MRSA and MSSA, upon exposure to GA, GO, and GAGO were further deduced via the TEM analysis. As indicated in the previous section, MRSA and MSSA were more susceptible to all treatments; hence, further study was conducted to evaluate the interaction of the samples employed with MRSA and MSSA. The control MRSA and MSSA (Figures 14A and A) appear round, with smooth morphological features. The treatment with either GA or GAGO resulted in the disrupted morphology and damaged surface. Thus, it can be interpreted that lysis of the bacterial cells occurs, resulting in the release of the cellular content of MRSA and MSSA into the surrounding environment, which is apparent following treatment with GA and GAGO (Figure 14B and D; Figure 15B and D). It can be deduced that a significant decrease in the cellular content of MRSA and MSSA treated with GA and GAGO was observed throughout. On the contrary, GO showed a less prominent effect on MSSA (Figure 15C), where the cell wall of MSSA is not significantly affected upon treatment with GO for 12 h. The MSSA bacterial cells remain intact, with a perfectly round shape compared to the control. However, it should be noted that the cell walls are compromised by the appearance of a clearer layer of the cell walls in GO-treated MSSA and MRSA (Figures 15C and 14C), in contrast to the control MSSA. The morphological observation recorded for GO towards MSSA and MRSA further corroborated the data recorded for GO in the previous sections.
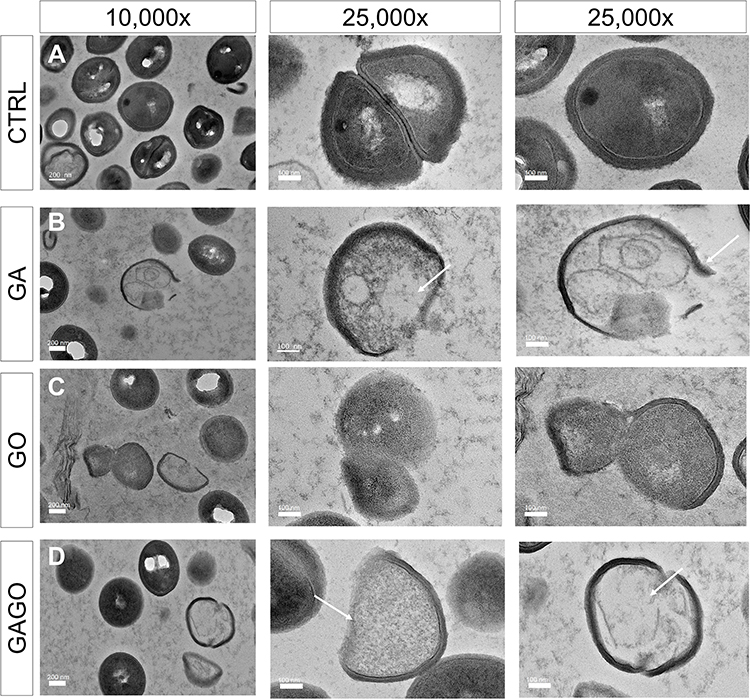 |
Figure 14 HRTEM micrographs of MRSA treated with (A) distilled water (CTRL), (B) GA, (C) GO, and (D) GAGO at 150 µg/mL for 12 h. Scale bars represent 200 nm (10,000× magnification) and 100 nm (25,000× magnification). Arrows indicate a compromised membrane with cell lysis, resulting in cytoplasm leakage and reduced cellular content. |
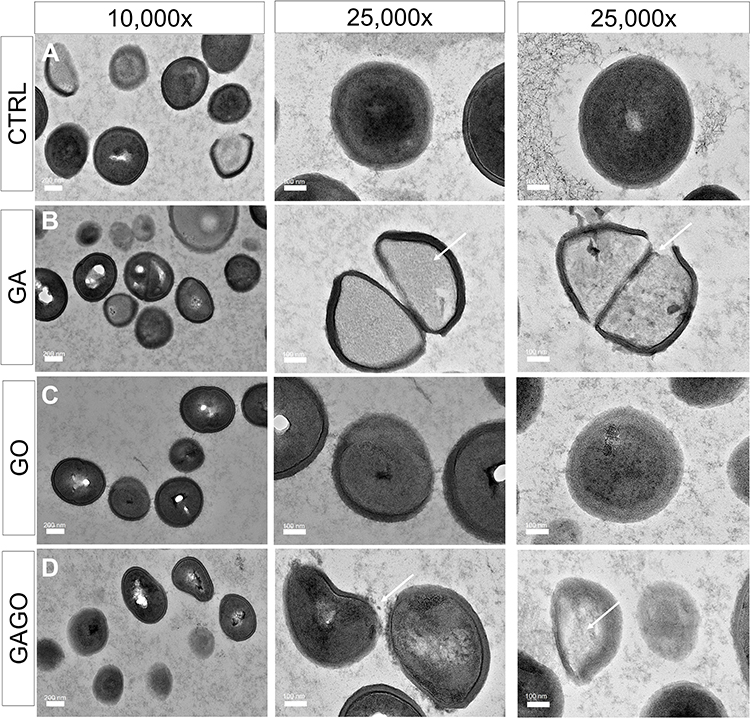 |
Figure 15 HRTEM micrographs of MSSA treated with (A) distilled water (CTRL), (B) GA, (C) GO, and (D) GAGO at 150 µg/mL for 12 h. Scale bars represent 200 nm (10,000× magnification) and 100 nm (25,000× magnification). Arrows indicate a compromised membrane with cell lysis, that results in cytoplasm leakage and reduced cellular content. |
Discussion
One of the promising strategies in the treatment of infectious diseases driven by multidrug resistance organisms is nanotechnology. In the present study, a relatively simple GAGO nanocomposite formulation was prepared to employ GO, a biocompatible and cost-effective graphene derivative, and GA, a phenolic compound against MRSA. Preliminary data have suggested the ability of GAGO to impose antibacterial activity on MRSA.13 GA has been reported to act as an antibacterial agent against several pathogens, such as Salmonella typhimurium,42 Escherichia coli,43 S. aureus,13 Helicobacter pylori,44 and Campylobacter spp.45 Nonetheless, its development into clinical settings has been hampered by rapid degradation, poor oral bioavailability, and absorption27,28 that led to the rapid elimination of GA when administered in vivo. In the present study, GAGO has been successfully synthesized with batch-to-batch consistency, loading efficiency of 28.92 ± 6.20%, and GA loading of 241 ± 0.05 mg of 1 g GAGO. This is significantly higher than the study by Dornani et al,29 who reported loading of only 12% of GA at a 10:1 ratio of GA:GO. A more recent study has shown that GO could load 20–40% of GA, in accordance with the loading obtained in the present study.46
The efficacy and performance of nanomaterials in biological studies are heavily influenced by their stability and characterization. An accurate characterization of nanomaterials within biological systems at pre-clinical stages is important to provide insights into how nanomaterial properties could influence their biological effects. Physical properties, such as aggregation status, surface charge, and state of dispersion, are examples of characteristics that need to be closely monitored. In the present study, the stability of GAGO in terms of aggregation status, morphology, and surface charge were monitored in different physiological media, namely water, PBS, and culture media supplemented with FBS, ie, the media often used to evaluate the efficacy and biological properties of nanomaterials in vitro and in vivo.
The zeta potential was used to determine the stability of the GO and GAGO. A lower negative zeta potential was observed in GAGO dispersed in DMEM supplemented with 10% FBS compared to GAGO dispersed in DMEM only. This is due to the presence of complex components in the DMEM such as ionic salts, vitamins, glucose, amino acids,47 and the presence of the serum proteins in FBS such as albumin. The lower negative zeta potential exerted by GAGO indicates its higher stability in the physiological media, ie, culture medium supplemented with FBS. As albumin is present abundantly in FBS, its adsorption onto the surface of GAGO could be the cause of the enhanced stability of GAGO in the medium containing FBS. The presence of small particles on the surface of GAGO is postulated due to albumin in FBS.47 Albumin is the major protein in FBS,50 and it has been reported to have a particle size of 10 to 50 nm, which is in congruent to the TEM morphology of GAGO dispersed in DMEM supplemented with 10% FBS. This finding is consistent with Franqui et al48 who reported that the single-layer sheet of GO was completely covered by FBS proteins when dispersed in the culture medium containing FBS. Due to the protein adsorption, the dispersion of GAGO in DMEM has further lowered its negative zeta potential (Figure 5), which is significant to GAGO dispersed in only DMEM. This is due to the steric hindrance and electrostatic repulsion that resulted from protein coating on the surface of GAGO, confirming the possibility of protein adsorption in GAGO. The adsorption of protein could be advantageous for carbon-based materials, as it improves stability and avoids recognition of these materials by the immune system when administered in vivo.
One of the major hurdles in fully integrating nanomaterials applications in industries, especially biomedicine, is the potential biocompatibility issues. The toxicity of GAGO was evaluated using 3T3 murine fibroblast cells and zebrafish embryos. Fibroblasts are often involved in inflammation, cell proliferation, and extracellular matrix generation during injury and wound healing. During injury, it will trigger an inflammatory response and begins to initiate the re-modeling of the damaged tissue cells.49 Meanwhile, zebrafish has been favored by researchers over the conventional animal model for toxicity study as it shares 70% of homologous genes as well as demonstrates similar physiological responses in humans with chronic diseases.50 In the present study, GAGO exerted a lower toxicity effect compared to GA based on its LC50, both in 3T3 murine fibroblast cells and zebrafish embryos. This is possibly due to the slow and sustained release of GA from GO, demonstrating that GAGO can reduce the over-exposure of a large quantity of GA to the cells. However, despite GA being an antioxidant, it wields the highest toxicity among all three samples. Based on a previous study, reduced cell viability and proliferation were observed when treated with GA besides the induction of cell apoptosis51 at an LC50 concentration (Table 2). Interestingly, GAGO exerted lower toxicity due to the surface coating of GA onto GO and possible protein adsorption, as corroborated by the zeta potential value in Figure 5. The improved toxicity of GA, when loaded onto GO in the form of GAGO, could also be contributed to the slow and sustained release of GA, rendering GAGO a promising candidate to be developed as a treatment for inflammation in the multidrug-resistant organism.
ROS is a chemically reactive molecule that can cause damage to DNA, fatty acid, and cellular molecules, resulting in oxidative stress conditions at the cellular level.52 In a normal condition, ROS is usually produced in small quantities depending on the physiological metabolism of the body.53 However, upon endogenous or exogenous exposure, the ROS content may elevate and exceed the limit until the antioxidant ability is outperformed, leading to oxidative stress.54 The improvement of the ROS content in GAGO-treated embryos was congruent with a previous study on GO-HA, where it showed low oxidative stress content when treated in zebrafish embryos compared to the GO at 100 µg/mL, resulting in a significant increase of ROS, glutathione (GSH), and malondialdehyde (MDA) besides inhibiting the antioxidant enzyme activity of Superoxide dismutase (SOD).55 In addition, Mu et al56 also reported a normal ROS content on recorded CysGO compared to the high ROS content in the treatment of pure GO. Contrarily, GA is known for its antioxidant property, which can inactivate the free radicals present, preventing oxidative stress.
Furthermore, several studies have reported a high ROS content of GO that could trigger apoptosis and is associated with cell death.57 One reason for the increased ROS content during GO exposure is the surface defect. As reported by Chen et al.58 GO has sharp edges that may damage the mitochondrial membrane and induce the generation of ROS through dangling bonds, turns, and kinks on the edges or inner plane. Furthermore, hypoxia due to the cellular envelopment by GO has also assumed a specific mechanism that induces excessive ROS production, a decrease in ATP production, and metabolic toxicity, leading to cell death.59 As seen in Figure 8, the ROS level of GO was significantly high at 1 h exposure, which also led to high mortality in zebrafish embryos observed at early exposure. In a previous study from our laboratory, surface coating of GO with a co-block polymer, Pluronic F127, has been shown to mitigate the toxicity effects of GO on zebrafish embryos by preventing the interaction of GO sharp edges with the cell membrane and embryonic chorion.39
On the other hand, the increasing ROS content observed on 50 and 300 μg/mL of pure GA at 1 h exposure may be due to the chemical properties of GA that contains multiple hydroxyl groups, particularly the β-rings, which significantly increased the production of ROS.60 This hydroxyl group could produce superoxide anion, hydrogen peroxide, and quinones in an oxygenated solution during autoxidation, causing DNA damage.61 Moreover, GA has also been reported to produce H2O2 in HL-60 human leukemia cells and increase the amount of 8-oxo-7,8-dihydro-20-deoxyguanosine, an oxidative stress biomarker.62 Furthermore, a study on GA derivatives shows that propyl gallate could induce oxidative stress at 1 and 10 µg/mL exposure.63
The disk diffusion test confirmed the antibacterial activity of all samples. All strains were shown to be affected by GA, GO, and GAGO at a concentration as low as 150 µg/mL, except for GA, which demonstrated a zone of inhibition towards MRSA-pvl+ only at 300 µg/mL. Additionally, the antibacterial properties of GA, GO, and GAGO at different concentrations against MRSA strains were corroborated by using the CFU counting method. The results were shown as the reduction in bacterial colony count (percentage of inhibition) upon treatment with each tested sample compared to that with a control distilled water solution and CFX. Among all bacteria strains employed, the community-acquired strains (MRSA-pvl+ and MRSA-pvl-) were shown to have less susceptibility towards all samples compared to MRSA and MSSA. This phenomenon could be explained by the increase in the virulence factor, as well as the fitness properties of CA-MRSA compared to MRSA or hospital-acquired MRSA. CA-MRSA has been shown in Figure 9 to have a faster multiplication rate compared to MSSA and MRSA, with a significant shorter doubling time and a higher cell count, which is in agreement with a previous study by Kockritz-Blickwede et al.64 GO was also observed to exhibit a more significant effect on the inhibition of MRSA-pvl+ (96.37%) than GAGO (82.70%) at a similar concentration of 1000 µg/mL. GAGO might reach its therapeutic concentration within the MRSA-pvl+ bacterial cell, accounting for the comparable cytotoxic profiles obtained for GAGO at 500 and 1000 µg/mL. This phenomenon could also be explained by the presence of pvl, a bi-component pore-forming toxin that can destroy and lyse leukocytes, which leads to tissue necrosis.35,65
The time-dynamic antibacterial effectiveness of GAGO was determined for all S. aureus strains. Loading of GA onto GO might change its antibacterial activity. Although GAGO showed a delayed response for MRSA, its effect increased tremendously following 2 h of exposure. The therapeutic effect of antibacterial agents against intracellular S. aureus depends on the persistent time in the infected cell above the effective therapeutic levels. The drug concentration within the cells is derived from its ability to penetrate the cell membrane and elucidate its efficacy intracellularly. Prolonged incubation with GAGO was necessary for the cellular GA to accumulate to therapeutic levels. GA, being lypophilic,66,67 is reportedly taken up by the cells through passive diffusion; its transcellular trafficking was also affected by protein-mediated transport.25,26 The passive diffusion pathway is inaccessible to particulate systems like the GAGO. It was reported that GO could be internalized by cells through an energy-dependent, clathrin-mediated endocytosis pathway.68,69 Endocytosis provides a slower uptake by the cells compared to the passive diffusion pathway, which further explains the delayed intracellular interaction of GAGO with MRSA and the delayed response of GAGO in inhibiting bacterial cells. A similar pattern was also observed with MSSA.
On the other hand, a significant delay in the inhibition of CA-MRSA was observed, congruent to the results obtained in the previous CFU counting method. The delayed response of GAGO in CA-MRSA could be attributable to the lower uptake of GAGO by bacterial cells, which caused a slower interaction of both GA and GO with the bacterial cells. In addition, the loaded GA had to be released from GAGO before it was accessible for interaction with the bacterial cell wall and enzyme system. In a drug release study, GA from the GAGO nanocomposite was released at a relatively slow rate, with only 13.21% of the GA load released into the aqueous media within the first 4 h. GO effects towards MRSA-pvl+ was observed to be more prominent than GAGO throughout the time-kill experiment, with a comparable percentage of inhibition for GAGO achieved following 24 h of incubation. In a previous study from our laboratory, surface coating of GO with a co-block polymer, Pluronic F127, has been shown to mitigate the toxicity effects of GO on zebrafish embryos by preventing the interaction of GO sharp edges with the cell membrane and embryonic chorion.39 At 24 h, the loaded GA was released up to 83.77%, making it possible for GA to impose its effects on MRSA-pvl+, together with GO. As mentioned previously, the sharp edges of GO were coated by GA on the surface, contributing to the inability of the GAGO nanocomposite to penetrate the cell wall of MRSA-pvl+ at the initial phase of incubation, which in turn delayed the access of this nanocomposite formulation towards the virulence gene. According to the drug release experiment conducted in the previous section, the release of GA from GAGO nanocomposite was initially relatively slow, but an increase and sustained release of GA was found to occur that lasted for three days. This could be advantageous when GAGO is administered in vivo, in which the sustained release could maintain the high concentration of GA in the plasma within the therapeutic window for an extended amount of time. The subsequent controlled release of the nanocomposite entrapped GA could potentially enhance the intracellular antibacterial effects and prevent a sudden surge of exposure of GA at high concentration, which could increase the possibility of this multidrug-resistant microorganism adapting quickly and developing resistance. It is also worth noting that the concentration of samples used for the CFU counting method and time-kill experiment of 150 µg/mL adhered to the cytotoxicity profile of GO as reported. The loading of GA onto GAGO nanocomposite was also reported to be 28.92 ± 6.20% in the present study. This further explained the more significant antibacterial effects of GA on CA-MRSA and the discrepancy in the action of GA when compared to GAGO nanocomposite in these bacterial strains.
HRTEM was employed to explore the interaction between the nanocomposite and bacteria to investigate the mechanism of action for the antibacterial property of GA. Two strains of S. aureus bacteria, MRSA and MSSA, were chosen due to the superior antibacterial property of GAGO in these two strains compared to CA-MRSA. The cell walls of MRSA and MSSA were compromised upon exposure to GAGO, in which they appear thinner and damaged,70 accompanied by the reduced cellular content due to cytoplasm leakage.71 The irreversible damage and disintegration of the bacterial cell walls were postulated as the main mechanism in the action of GAGO that exhibits its antibacterial activity, resulting in apoptosis of the bacteria.72 Prolonged exposure to GAGO was necessary to gradually interrupt the cell wall of S. aureus, hence, damaging the peptidoglycan layer. GO, on the other hand, did not demonstrate a significant decrease in cellular content upon contact with MSSA, and the bacteria cells appear rather as normal round shape, similar to the control MSSA. Several studies have demonstrated superior antibacterial activity of GO towards Gram-negative bacteria compared to Gram-positive bacteria, such as S. aureus. Gram-positive bacteria possess a different cell wall structure and composition than Gram-negative bacteria. The cell wall of S. aureus consists of thick and dense peptidoglycan, making it difficult even for GO that contains sharp edges to penetrate the cell walls.14
Conclusion
In summary, the integration of GA onto the GO sheet could impose more effects of GAGO on MRSA and MSSA at a lower concentration of GA. The effects involved improved biocompatibility in 3T3 fibroblast cells and zebrafish embryos and stability in different physiological media. GAGO nanocomposite exhibited inhibition towards all bacteria strains employed, ie, MRSA, MSSA, MRSA-pvl+, and MRSA-pvl-. The present study demonstrates the antibacterial potential of GAGO against MRSA strains, but further study is warranted to understand the mechanism of action of GAGO and its resistance in MRSA strains.
Acknowledgments
This research was funded by the Ministry of Higher Education of Malaysia under the Fundamental Research Grant Scheme (FRGS), grant number FRGS/1/2018/SKK11/UPM/02/1, and Universiti Putra Malaysia (GP/IPS/2018/9602000). The authors acknowledge the facilities and scientific and technical assistance from the Institute of Nanoscience and Nanotechnology (ION2) and the Institute of Biosciences (IBS) at Universiti Putra Malaysia.
Disclosure
The authors report no conflicts of interest in this work.
References
1. Tong SY, Davis JS, Eichenberger E, Holland TL, Fowler VG. Staphylococcus aureus infections: epidemiology, pathophysiology, clinical manifestations, and management. Clin Microbiol Rev. 2015;28:603–661. doi:10.1128/CMR.00134-14
2. Guo Y, Song G, Sun M, Wang J, Wang Y. Prevalence and therapies of antibiotic-resistance in Staphylococcus aureus. Front Cell Infect Microbiol. 2020;10:107. doi:10.3389/fcimb.2020.00107
3. Ministry of Health Malaysia. National surveillance of antimicrobial resistance; 2017. Available from: https://www.imr.gov.my/images/uploads/NSAR/NSAR_2017/NSAR_report_2017-edited-31.1.2019.pdf.
4. World Health Organization. Antimicrobial resistance: global report on surveillance; 2014. Available from: https://apps.who.int/iris/bitstream/handle/10665/112642/9789241564748_eng.pdf?sequence=1.
5. Rodvold KA, McConeghy KW. Methicillin-resistant Staphylococcus aureus therapy: past, present, and future. Clin Infect Dis. 2014;58:S20–S27. doi:10.1093/cid/cit614
6. CDC. Staphylococcus aureus resistant to vancomycin-United States, 2002. MMWR Morb Mortal Wkly Rep. 2002;51:565–567.
7. Ramazoni M, Siregar ML, Jamil KF. Vancomycin-resistant Staphylococcus aureus (VRSA) in hepatic cirrhosis patient: a case report. IOP Conf Ser Earth Environ Sci. 2018;25:012096. doi:10.1088/1755-1315/125/1/012096
8. Choo EJ. Community-associated methicillin-resistant Staphylococcus aureus in nosocomial infections. Infect Chemother. 2017;49:158–159. doi:10.3947/ic.2017.49.2.158
9. Yamamoto T, Nishiyama A, Takano T, et al. Community-acquired methicillin-resistant Staphylococcus aureus: community transmission, pathogenesis, and drug resistance. J Infect Chemother. 2010;16:225–254. doi:10.1007/s10156-010-0045-9
10. Al Amiry A. Methicillin-resistant Staphylococcus aureus: an occupational health hazard in the prehospital setting. J Acute Dis. 2015;4:274–276. doi:10.1016/j.joad.2015.06.003
11. Correa-Jiménez O, Pinzón-Redondo H, Reyes N. High frequency of Panton-Valentine leukocidin in Staphylococcus aureus causing pediatric infections in the city of Cartagena-Colombia. J Infect Public Health. 2016;2020:9415–9420.
12. Otto M. Community-associated MRSA: what makes them special? Int J Med Microbiol. 2013;303:324–330. doi:10.1016/j.ijmm.2013.02.007
13. Shamsi S, Elias N, Sarchio SNE, Yasin FM. Gallic acid loaded graphene oxide based nanoformulation (GAGO) as potential anti-bacterial agent against Staphylococcus aureus. Mater Today. 2018;5:S160–S165.
14. Pulingam T, Thong KL, Ali ME, et al. Graphene oxide exhibits differential mechanistic action towards gram-positive and gram-negative bacteria. Colloids Surf B Biointerfaces. 2019;181:6–15. doi:10.1016/j.colsurfb.2019.05.023
15. Cobos M, De-La-Pinta I, Quindós G, Fernández MJ, Fernández MD. Graphene oxide-silver nanoparticle nanohybrids: synthesis, characterization, and antimicrobial properties. Nanomaterials. 2020;10:376. doi:10.3390/nano10020376
16. Nanda SS, Yi DK, Kim K. Study of antibacterial mechanism of graphene oxide using Raman spectroscopy. Sci Rep. 2016;6:1–12. doi:10.1038/srep28443
17. Tu Y, Lv M, Xiu P, et al. Destructive extraction of phospholipids from Escherichia coli membranes by graphene nanosheets. Nat Nanotechnol. 2013;8:594–601. doi:10.1038/nnano.2013.125
18. Chen J, Peng H, Wang X, Shao F, Yuan Z, Han H. Graphene oxide exhibits broad-spectrum antimicrobial activity against bacterial phytopathogens and fungal conidia by intertwining and membrane perturbation. Nanoscale. 2014;6:1879–1889. doi:10.1039/C3NR04941H
19. Sondi I, Salopek-Sondi B. Silver nanoparticles as antimicrobial agent: a case study on E. coli as a model for Gram-negative bacteria. J Colloid Interface Sci. 2004;275:177–182. doi:10.1016/j.jcis.2004.02.012
20. Mangadlao JD, Santos CM, Felipe MJL, de Leon ACC, Rodriguesb DF. Advincula RC On the antibacterial mechanism of graphene oxide (GO) Langmuir–Blodgett films. Chem Comm. 2015;51:2886–2889. doi:10.1039/C4CC07836E
21. Hanif Z, Ahmed FR, Shin SW, Kim YK, Um SH. Size-and dose-dependent toxicity of cellulose nanocrystals (CNC) on human fibroblasts and colon adenocarcinoma. Colloids Surf B Biointerfaces. 2014;119:162–165. doi:10.1016/j.colsurfb.2014.04.018
22. Shvedova AA, Pietroiusti A, Fadeel B, Kagan VE. Mechanisms of carbon nanotube-induced toxicity: focus on oxidative stress. Toxicol Appl Pharmacol. 2012;261:121–133. doi:10.1016/j.taap.2012.03.023
23. Singh V, Kumar V, Kashyap S, et al. Graphene oxide synergistically enhances antibiotic efficacy in vancomycin-resistant Staphylococcus aureus. ACS Appl Bio Mater. 2019;2:1148–1157. doi:10.1021/acsabm.8b00757
24. Hassani A, Azarian MMS, Ibrahim WN, Hussain SA. Preparation, characterization and therapeutic properties of gum Arabic-stabilized gallic acid nanoparticles. Sci Rep. 2020;10:17808. doi:10.1038/s41598-020-71175-8
25. Liu YL, Hsu CC, Huang HJ, Chang CJ, Sun SH, Lin AM. Gallic acid attenuated LPS-induced neuroinflammation: protein aggregation and necroptosis. Mol Neurobiol. 2020;57:96–104. doi:10.1007/s12035-019-01759-7
26. Rajamanickam K, Yang J, Sakharkar MK. Gallic acid potentiates the antimicrobial activity of tulathromycin against two key bovine respiratory disease (brd) causing-pathogens. Front Pharmacol. 2019;9:1486. doi:10.3389/fphar.2018.01486
27. Munin A, Edwards-Lévy F. Encapsulation of natural polyphenolic compounds; a review. Pharmaceutics. 2011;3:793–829. doi:10.3390/pharmaceutics3040793
28. Mao X, Wu LF, Zhao HJ, et al. Transport of corilagin, gallic acid, and ellagic acid from Fructus Phyllanthi tannin fraction in Caco-2 cell monolayers. Evid Based Complement Alternat Med. 2016;9205379. doi:10.1155/2016/9205379
29. Dorniani D, Saifullah B, Barahuie F, et al. Graphene oxide-gallic acid nanodelivery system for cancer therapy. Nanoscale Res Lett. 2016;11:491. doi:10.1186/s11671-016-1712-2
30. Vijayalakshmi R, Ravindhran R. Comparative fingerprint and extraction yield of Diospyrus ferrea (willd.) Bakh. root with phenol compounds (gallic acid), as determined by UV–Vis and FT-IR spectroscopy. Asian Pac J Trop Biomed. 2012;2:S1367–S1371. doi:10.1016/S2221-1691(12)60418-3
31. Nguang SL, Yeong YL, Pang SF, Gimbun J. Optimisation of gallic acid and quercetin extraction from. Phyllanthus Niruri Int J Eng Technol. 2018;207:90–94. doi:10.14419/ijet.v7i3.13.16331
32. Seisenbaeva GA, Ali LMA, Vardanyan A, et al. Mesoporous silica adsorbents modified with amino polycarboxylate ligands - functional characteristics, health and environmental effects. J Hazard Mater. 2021;406:124698. doi:10.1016/j.jhazmat.2020.124698
33. Nagel R, Dar T. The embryo test with the zebrafish danio rerio–a general model in ecotoxicology and toxicology. Altex. 2002;19:38–48.
34. Zhao X, Wang S, Wu Y, You H, Lv L. (2013). Acute ZnO nanoparticles exposure induces developmental toxicity, oxidative stress and DNA damage in embryo-larval zebrafish. Aquat Toxicol. 2013;136:49–59. doi:10.1016/j.aquatox.2013.03.019
35. Mat Azis N, Pung HP, Abdul Rachman AR, et al. A persistent antimicrobial resistance pattern and limited methicillin-resistance-associated genotype in a short-term Staphylococcus aureus carriage isolated from a student population. J Infect Public Health. 2017;10:156–164. doi:10.1016/j.jiph.2016.02.013
36. Clinical and Laboratory Standards Institute (CLSI). Performance standards for antimicrobial susceptibility testing; twenty-third informational supplement. CLSI document M100-S23. Wayne, PA: Clinical and Laboratory Standards Institute; 2013.
37. Martí M, Frígols B, Serrano-Aroca A. Antimicrobial characterization of advanced materials for bioengineering applications. J Vis Exp. 2018;138:57710.
38. de Moraes AC, Lima BA, de Faria AF, Brocchi M, Alves OL. Graphene oxide-silver nanocomposite as a promising biocidal agent against methicillin-resistant Staphylococcus aureus. Int J Nanomedicine. 2015;10:6847–6861. doi:10.2147/IJN.S90660
39. Shamsi S, Alagan AA, Sarchio SNE, Md Yasin F. Synthesis, characterization, and toxicity assessment of Pluronic F127-functionalized graphene oxide on the embryonic development of zebrafish (Danio rerio). Int J Nanomedicine. 2020;15:8311–8329. doi:10.2147/IJN.S271159
40. Ghafor AAHA, Elias N, Shamsi S, Yasin FM, Sarchio SN. Toxicity assessment of gallic acid loaded graphene oxide (GAGO) nano-formulation in zebrafish (Danio rerio) embryos. Pertanika J Sci Tech. 2020;28:311–326.
41. Yadav N, Dubey A, Shukla S, et al. Graphene oxide-coated surface: inhibition of bacterial biofilm formation due to specific surface-interface interactions. ACS Omega. 2017;2:3070–3082. doi:10.1021/acsomega.7b00371
42. Nohynek LJ, Alakomi HL, Kähkönen MP, et al. Berry phenolics: antimicrobial properties and mechanisms of action against severe human pathogens. Nutr Cancer. 2006;54:18–32. doi:10.1207/s15327914nc5401_4
43. Dwivedi GR, Gupta S, Maurya A, et al. Synergy potential of indole alkaloids and its derivative against drug-resistant Escherichia coli. Chem Biol Drug Des. 2015;86:1471–1481. doi:10.1111/cbdd.12613
44. Díaz-Gómez R, López-Solís R, Obreque-Slier E, Toledo-Araya H. Comparative antibacterial effect of gallic acid and catechin against Helicobacter pylori. LWT - Food Sci Tech. 2013;54:331–335. doi:10.1016/j.lwt.2013.07.012
45. Sarjit A, Wang Y, Dykes GA. Antimicrobial activity of gallic acid against thermophilic Campylobacter is strain specific and associated with a loss of calcium ions. Food Microbiol. 2015;46:227–233. doi:10.1016/j.fm.2014.08.002
46. Croitoru AM, Oprea O, Tihauan BM, Nicoara A, Trusca R, Ficai A. Gallic acid loaded graphene oxide material as an effective antibacterial nanocarrier. UPB Sci Bull B Chem Mater Sci. 2021;83:13–24.
47. Allouni ZE, Cimpan MR, Høl PJ, Skodvin T, Gjerdet NR. Agglomeration and sedimentation of TiO2 nanoparticles in cell culture medium. Colloids Surf B. 2009;68:83–87. doi:10.1016/j.colsurfb.2008.09.014
48. Franqui LS, De Farias MA, Portugal RV, et al. Interaction of graphene oxide with cell culture medium: evaluating the fetal bovine serum protein Corona formation towards in vitro nanotoxicity assessment and nanobiointeractions. Mater Sci Eng C. 2019;100:363–377. doi:10.1016/j.msec.2019.02.066
49. Li B, Wang JHC. Fibroblasts and myofibroblasts in wound healing: force generation and measurement. J Tissue Viability. 2011;20:108–120. doi:10.1016/j.jtv.2009.11.004
50. Wiecinski PN, Metz KM, Heiden TCK, Louis KM, Mangham AN, Hamers RJ. Toxicity of oxidatively degraded quantum dots to developing zebrafish (Danio rerio). Environ Sci Techno. 2013;47:9132–9139. doi:10.1021/es304987r
51. Saffari-Chaleshtori J, Heidari-Sureshjani E, Moradi F, Jazi HM, Heidarian E. The study of apoptosis-inducing effects of three pre-apoptotic factors by gallic acid, using simulation analysis and the Comet assay technique on the prostatic cancer cell line PC3. Malays J Med Sci. 2017;24:18–29. doi:10.21315/mjms2017.24.4.3
52. Zorov DB, Juhaszova M, Sollott SJ. Mitochondrial reactive oxygen species (ROS) and ROS-induced ROS release. Physiol Rev. 2014;94::909–950. doi:10.1152/physrev.00026.2013
53. Trachootham D, Alexandre J, Huang P. Targeting cancer cells by ROS-mediated mechanisms: a radical therapeutic approach? Nat Rev Drug Discov. 2009;8:579–591.
54. Klaunig JE, Kamendulis LM. The role of oxidative stress in carcinogenesis. Annu Rev Pharmacol Toxicol. 2004;44:239–267. doi:10.1146/annurev.pharmtox.44.101802.121851
55. Chen Y, Ren C, Ouyang S, Hu X, Zhou Q. Mitigation in multiple effects of graphene oxide toxicity in zebrafish embryogenesis driven by humic acid. J Environ Sci Technol. 2015;49::10147–10154. doi:10.1021/acs.est.5b02220
56. Mu L, Gao Y, Hu X. l-Cysteine: a biocompatible, breathable and beneficial coating for graphene oxide. Biomaterials. 2015;52:301–311. doi:10.1016/j.biomaterials.2015.02.046
57. Lammel T, Navas J. Graphene nanoplatelets spontaneously translocate into the cytosol and physically interact with cellular organelles in the fish cell line PLHC-1. Aquat Toxicol. 2014;150:55–65. doi:10.1016/j.aquatox.2014.02.016
58. Chen Y, Hu X, Sun J, Zhou Q. Specific nanotoxicity of graphene oxide during zebrafish embryogenesis. Nanotoxicology. 2016;10:42–52. doi:10.3109/17435390.2015.1005032
59. Forristal CE, Christensen DR, Chinnery FE, et al. Environmental oxygen tension regulates the energy metabolism and self-renewal of human embryonic stem cells. PLoS One. 2013;8:e62507. doi:10.1371/journal.pone.0062507
60. Lee KW, Lee HJ. Biphasic effects of dietary antioxidants on oxidative stress-mediated carcinogenesis. Mech Ageing Dev. 2006;127:424–431. doi:10.1016/j.mad.2006.01.021
61. Gil-Longo J, González-Vázquez C. Vascular pro-oxidant effects secondary to the autoxidation of gallic acid in rat aorta. J Nutr Biochem. 2010;21:304–309. doi:10.1016/j.jnutbio.2009.01.003
62. Kobayashi H, Oikawa S, Hirakawa K, Kawanishi S. Metal-mediated oxidative damage to cellular and isolated DNA by gallic acid, a metabolite of antioxidant propyl gallate. Mutat Res - Genet Toxicol Environ Mutagen. 2004;558:111–120. doi:10.1016/j.mrgentox.2003.11.002
63. Baran A, Köktürk M, Atamanalp M, Ceyhun SB. Determination of developmental toxicity of zebrafish exposed to propyl gallate dosed lower than ADI (Acceptable Daily Intake). Regul Toxicol Pharmacol. 2018;94:16–21. doi:10.1016/j.yrtph.2017.12.027
64. Kockritz-Blickwede VM, Rohde M, Oehmcke S, et al. Immunological mechanisms underlying the genetic predisposition to severe Staphylococcus aureus infection in the mouse model. Am J Pathol. 2008;173:1657–1668. doi:10.2353/ajpath.2008.080337
65. Yoong P, Torres VJ. The effects of Staphylococcus aureus leukotoxins on the host: cell lysis and beyond. Curr Opin Microbiol. 2013;16:63–69. doi:10.1016/j.mib.2013.01.012
66. Rosso R, Vieira TO, Leal PC, Nunes RJ, Yunes RA, Creczynski-Pasa TB. Relationship between the lipophilicity of gallic acid n-alquil esters’ derivatives and both myeloperoxidase activity and HOCl scavenging. Bioorg Med Chem. 2006;14:6409–6413. doi:10.1016/j.bmc.2006.05.038
67. Badhani B, Sharma N, Kakkar R. Gallic acid: a versatile antioxidant with promising therapeutic and industrial applications. RSC Adv. 2015;5:27540. doi:10.1039/C5RA01911G
68. Mu Q, Su G, Li L, et al. Size-dependent cell uptake of protein-coated graphene oxide nanosheets. ACS Appl Mater Interfaces. 2012;4::2259–2266. doi:10.1021/am300253c
69. Linares J, Matesanz MC, Vila M, et al. Endocytic mechanisms of graphene oxide nanosheets in osteoblasts, hepatocytes and macrophages. ACS Appl Mater Interfaces. 2014;6:13697–13706. doi:10.1021/am5031598
70. Wang C, Zhao W, Cao B, et al. Biofilm-responsive polymeric nanoparticles with self-adaptive deep penetration for in vivo photothermal treatment of implant infection. Chem Mater. 2020;32:7725–7738. doi:10.1021/acs.chemmater.0c02055
71. Hamida RS, Ali MA, Goda DA, Khalil MI, Al-Zaban MI. Novel biogenic silver nanoparticle-induced reactive oxygen species inhibit the biofilm formation and virulence activities of methicillin-resistant Staphylococcus aureus (MRSA) strain. Front Bioeng Biotechnol. 2020;8:433. doi:10.3389/fbioe.2020.00433
72. Lee DS, Eom SH, Kim YM, et al. Antibacterial and synergic effects of gallic acid-grafted-chitosan with β-lactams against methicillin-resistant Staphylococcus aureus (MRSA). Can J Microbiol. 2014;60:629–638. doi:10.1139/cjm-2014-0286
 © 2022 The Author(s). This work is published and licensed by Dove Medical Press Limited. The full terms of this license are available at https://www.dovepress.com/terms.php and incorporate the Creative Commons Attribution - Non Commercial (unported, v3.0) License.
By accessing the work you hereby accept the Terms. Non-commercial uses of the work are permitted without any further permission from Dove Medical Press Limited, provided the work is properly attributed. For permission for commercial use of this work, please see paragraphs 4.2 and 5 of our Terms.
© 2022 The Author(s). This work is published and licensed by Dove Medical Press Limited. The full terms of this license are available at https://www.dovepress.com/terms.php and incorporate the Creative Commons Attribution - Non Commercial (unported, v3.0) License.
By accessing the work you hereby accept the Terms. Non-commercial uses of the work are permitted without any further permission from Dove Medical Press Limited, provided the work is properly attributed. For permission for commercial use of this work, please see paragraphs 4.2 and 5 of our Terms.