")
Back to Journals » Cancer Management and Research » Volume 11
SSBP1 Upregulation In Colorectal Cancer Regulates Mitochondrial Mass
Authors Yang Y, Pan C, Yu L, Ruan H , Chang L, Yang J, Zheng Z, Zheng F, Liu T
Received 5 April 2019
Accepted for publication 28 September 2019
Published 2 December 2019 Volume 2019:11 Pages 10093—10106
DOI https://doi.org/10.2147/CMAR.S211292
Checked for plagiarism Yes
Review by Single anonymous peer review
Peer reviewer comments 2
Editor who approved publication: Professor Rudolph Navari
Yongping Yang,1,* Chenxi Pan,2,* Lingyun Yu,1 Hongxia Ruan,2 Ling Chang,2,3 Jingbo Yang,4 Zihan Zheng,2 Feng Zheng,2,3 Tongjun Liu1,4
1First Bethune Hospital, Jilin University, Changchun, Jilin, People’s Republic of China; 2Dalian Key Laboratory of Immune and Metabolic Kidney Diseases, Advanced Institute for Medical Sciences, Dalian Medical University, Dalian, Liaoning, People’s Republic of China; 3Department of Nephrology, Second Affiliated Hospital of Dalian Medical University, Dalian, Liaoning, People’s Republic of China; 4Second Bethune Hospital, Jilin University, Changchun, Jilin, People’s Republic of China
*These authors contributed equally to this manuscript
Correspondence: Tongjun Liu
Department of Gastrointestinal Surgery, First Bethune Hospital of Jilin University, No.828 Xinmin Street, Changchun, Jilin 130021, People’s Republic of China
Email [email protected]
Feng Zheng
Advanced Institute for Medical Sciences, Dalian Medical University, 9 West Section, South Road, Lushunkou District, Dalian, Liaoning 116044, People’s Republic of China
Email [email protected]
Background: Colorectal cancers (CRC) are one of the most common forms of cancer seen worldwide, and also remain difficult to treat despite recent advances in chemotherapy. Although significant progress has been made in recent years towards precision medicine and mutation-guided therapy, common mechanisms that underlie tumor growth and progression remain incompletely understood.
Methods: Tumor tissue and nearby unaffected tissue were collected from >15 patients at each stage of CRC, from which we generated representative proteomics profiles of three stages. Bioinformatics analysis was performed to discover common differences that may be shared between the representative profiles and across larger cohorts. Flow cytometry was then used to identify functional consequences of SSBP1 depletion in cell lines, since its expression level was consistently increased in tumor cells across all of the datasets analyzed.
Results: Direct comparison of CRC tumor and unaffected tissue at each stage demonstrated that a number of proteins involved in mitochondrial function displayed significantly altered expression patterns. Depletion of SSBP1 in colon cancer cell lines was able to trigger loss of mitochondrial mass and an increase in tumor cell death, and this effect that was further accentuated in the presence of the common chemotherapy drug cisplatin.
Conclusion: Mitochondrial biogenesis and maintenance may play an important part in tumor cell survival during CRC progression, and may be a useful target for directed inhibition or adjuvant targeting in the cases of cisplatin resistance.
Keywords: SSBP1, colorectal cancer, proteomics
Introduction
Colorectal cancers (CRC) are one of the most common forms of cancer seen worldwide, and also remain difficult to treat despite the development of a wide number of therapeutics. A major reason for this difficulty is the ability of tumors to develop resistance to chemotherapy agents, particularly in cases with mutations that may signal resistance.1–3 Combination therapies using chemotherapy drugs with different mechanisms of action have been developed to overcome this problem; for example, the thymidine analog 5-fluoruracil and alkylating agent oxaliplatin are commonly used together to pressure the tumor along separate routes, and may be effective when one of them would otherwise be inefficient.4 However, many chemotherapy drugs end up converging together to generate oxidative stress in tumor cells, and this convergence may prevent combination therapies from reach full potency. Newer cell cycle checkpoint inhibitors have been developed with the aim of providing an independent means of targeting the tumors. Genomic analyses into the mechanisms of resistance have demonstrated that autophagy may play an important role in this process, and a number of recent reports have demonstrated that inhibition of autophagy-related proteins either directly or through indirect mechanism of genetic regulation may aid in overcoming drug resistance.5–7 However, these approaches remain incompletely characterized, and the need for other avenues of intervention remains.
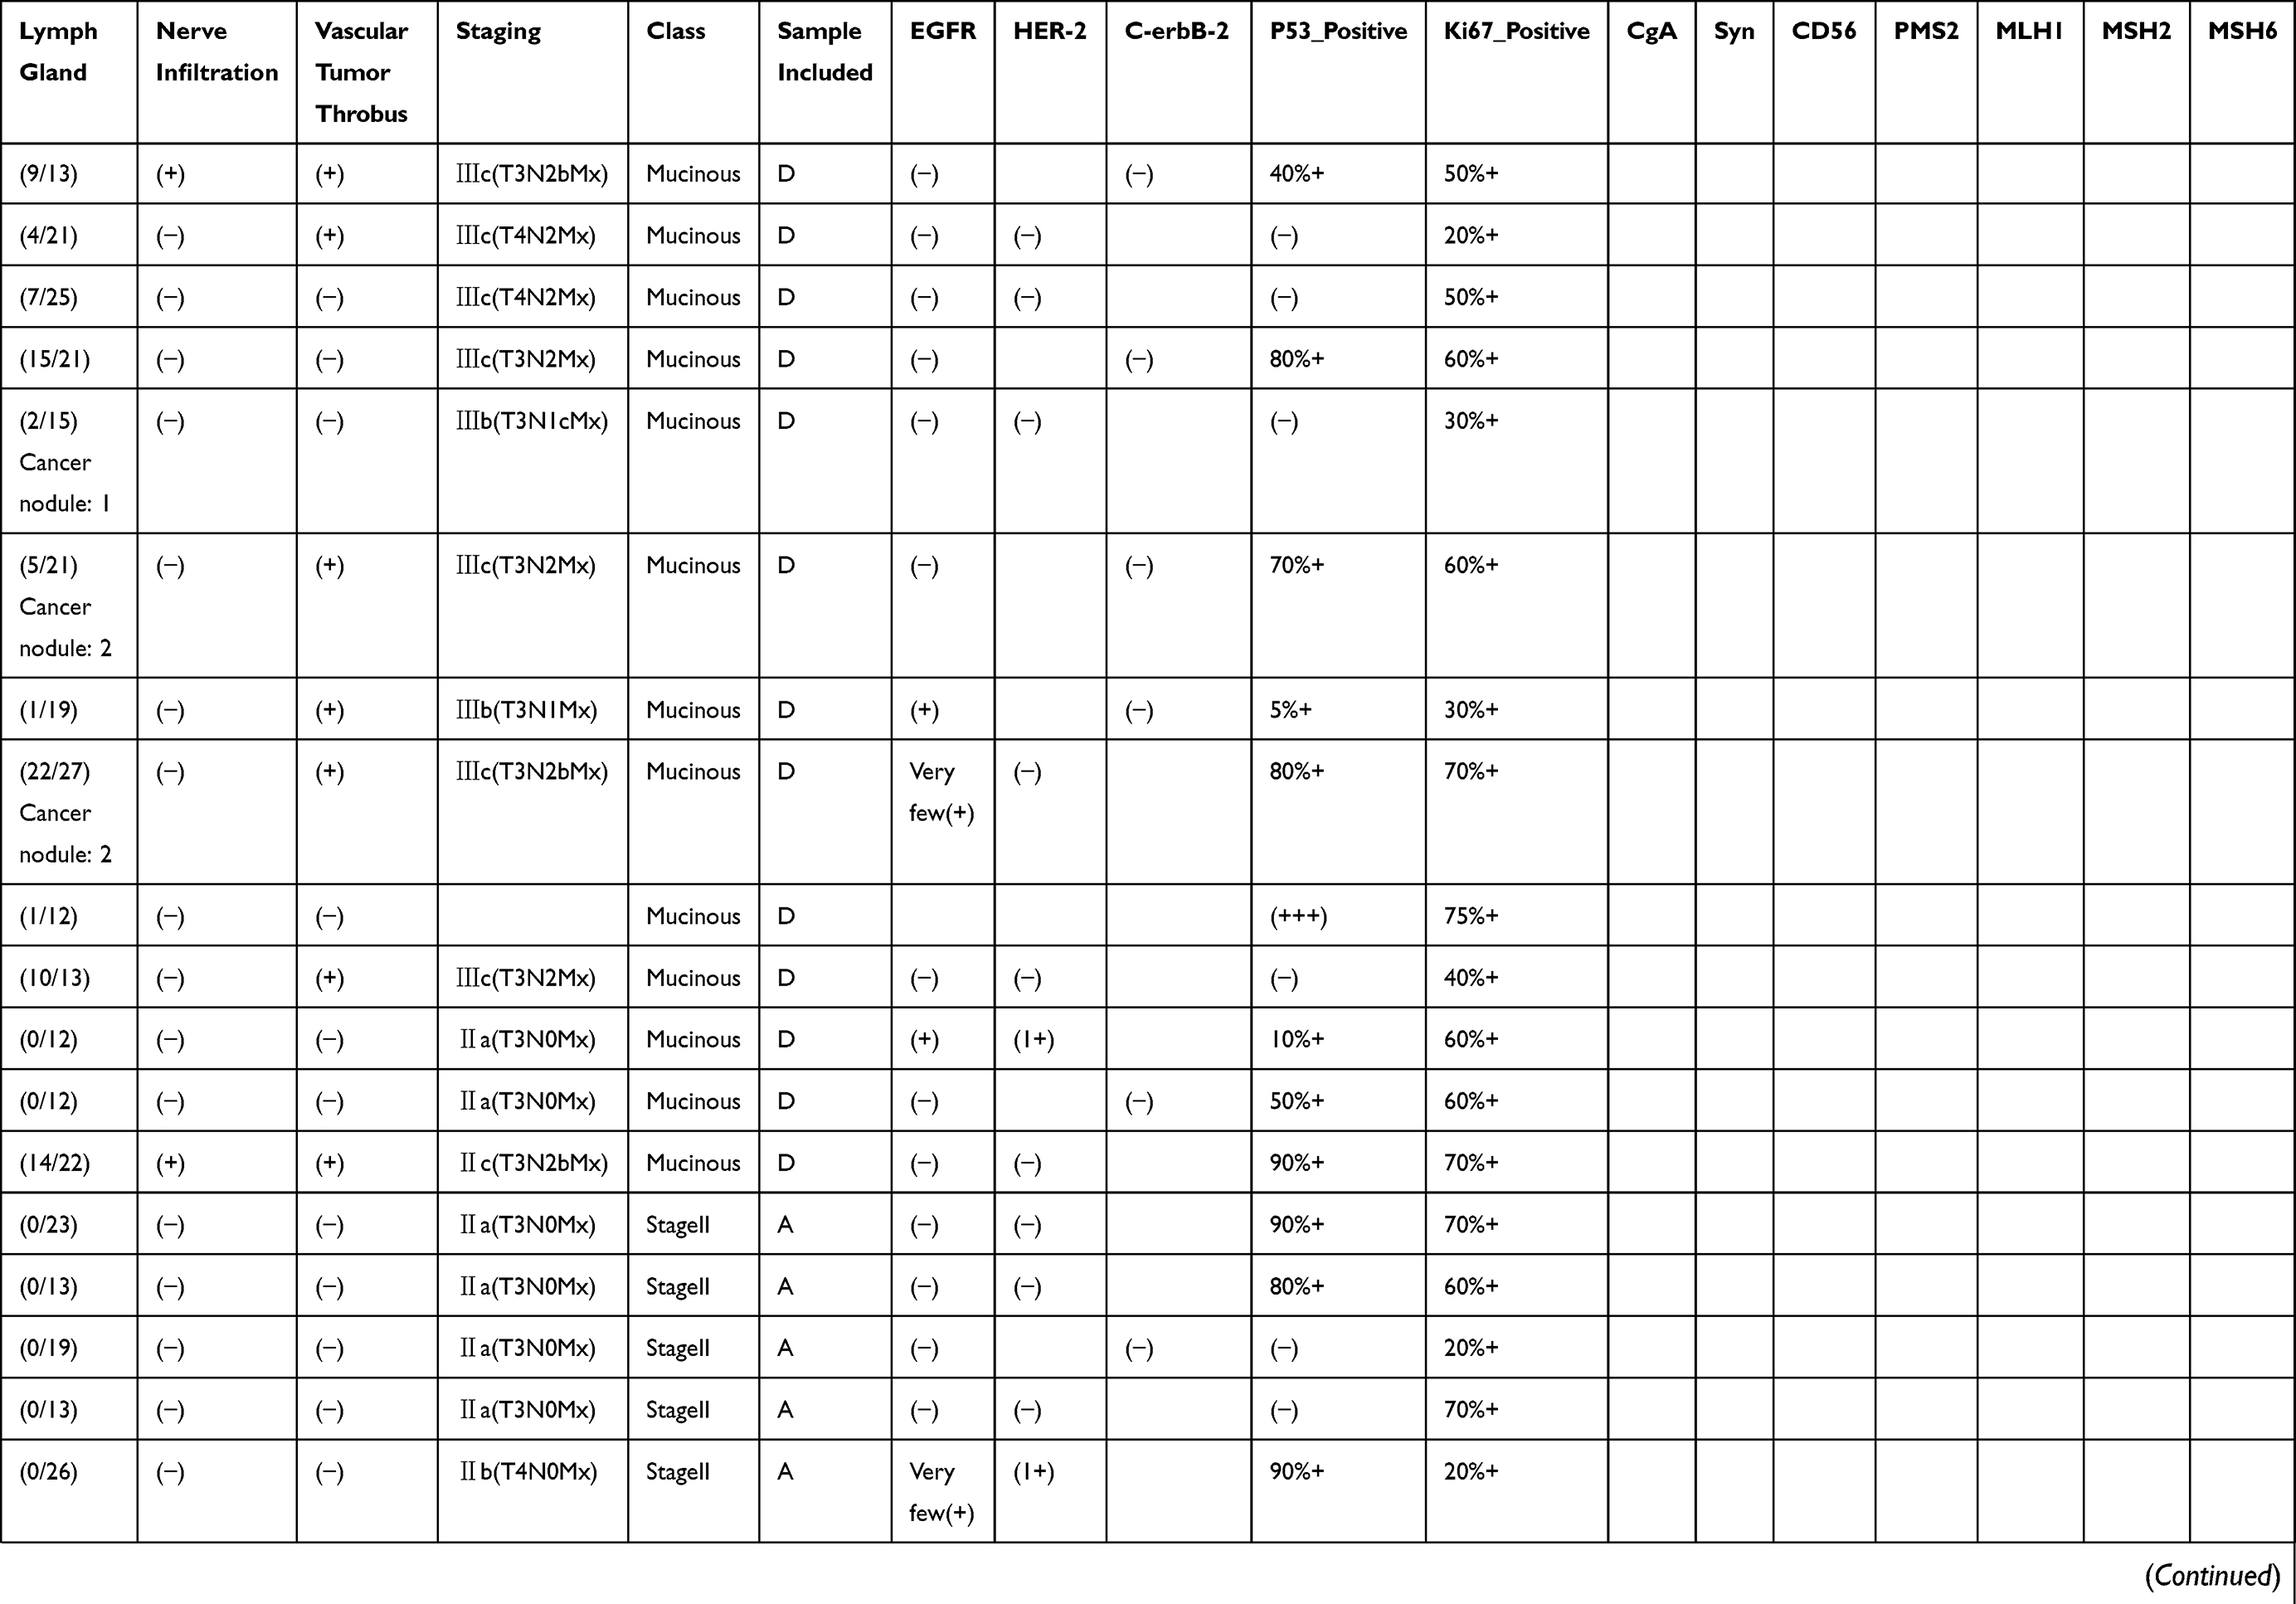 | 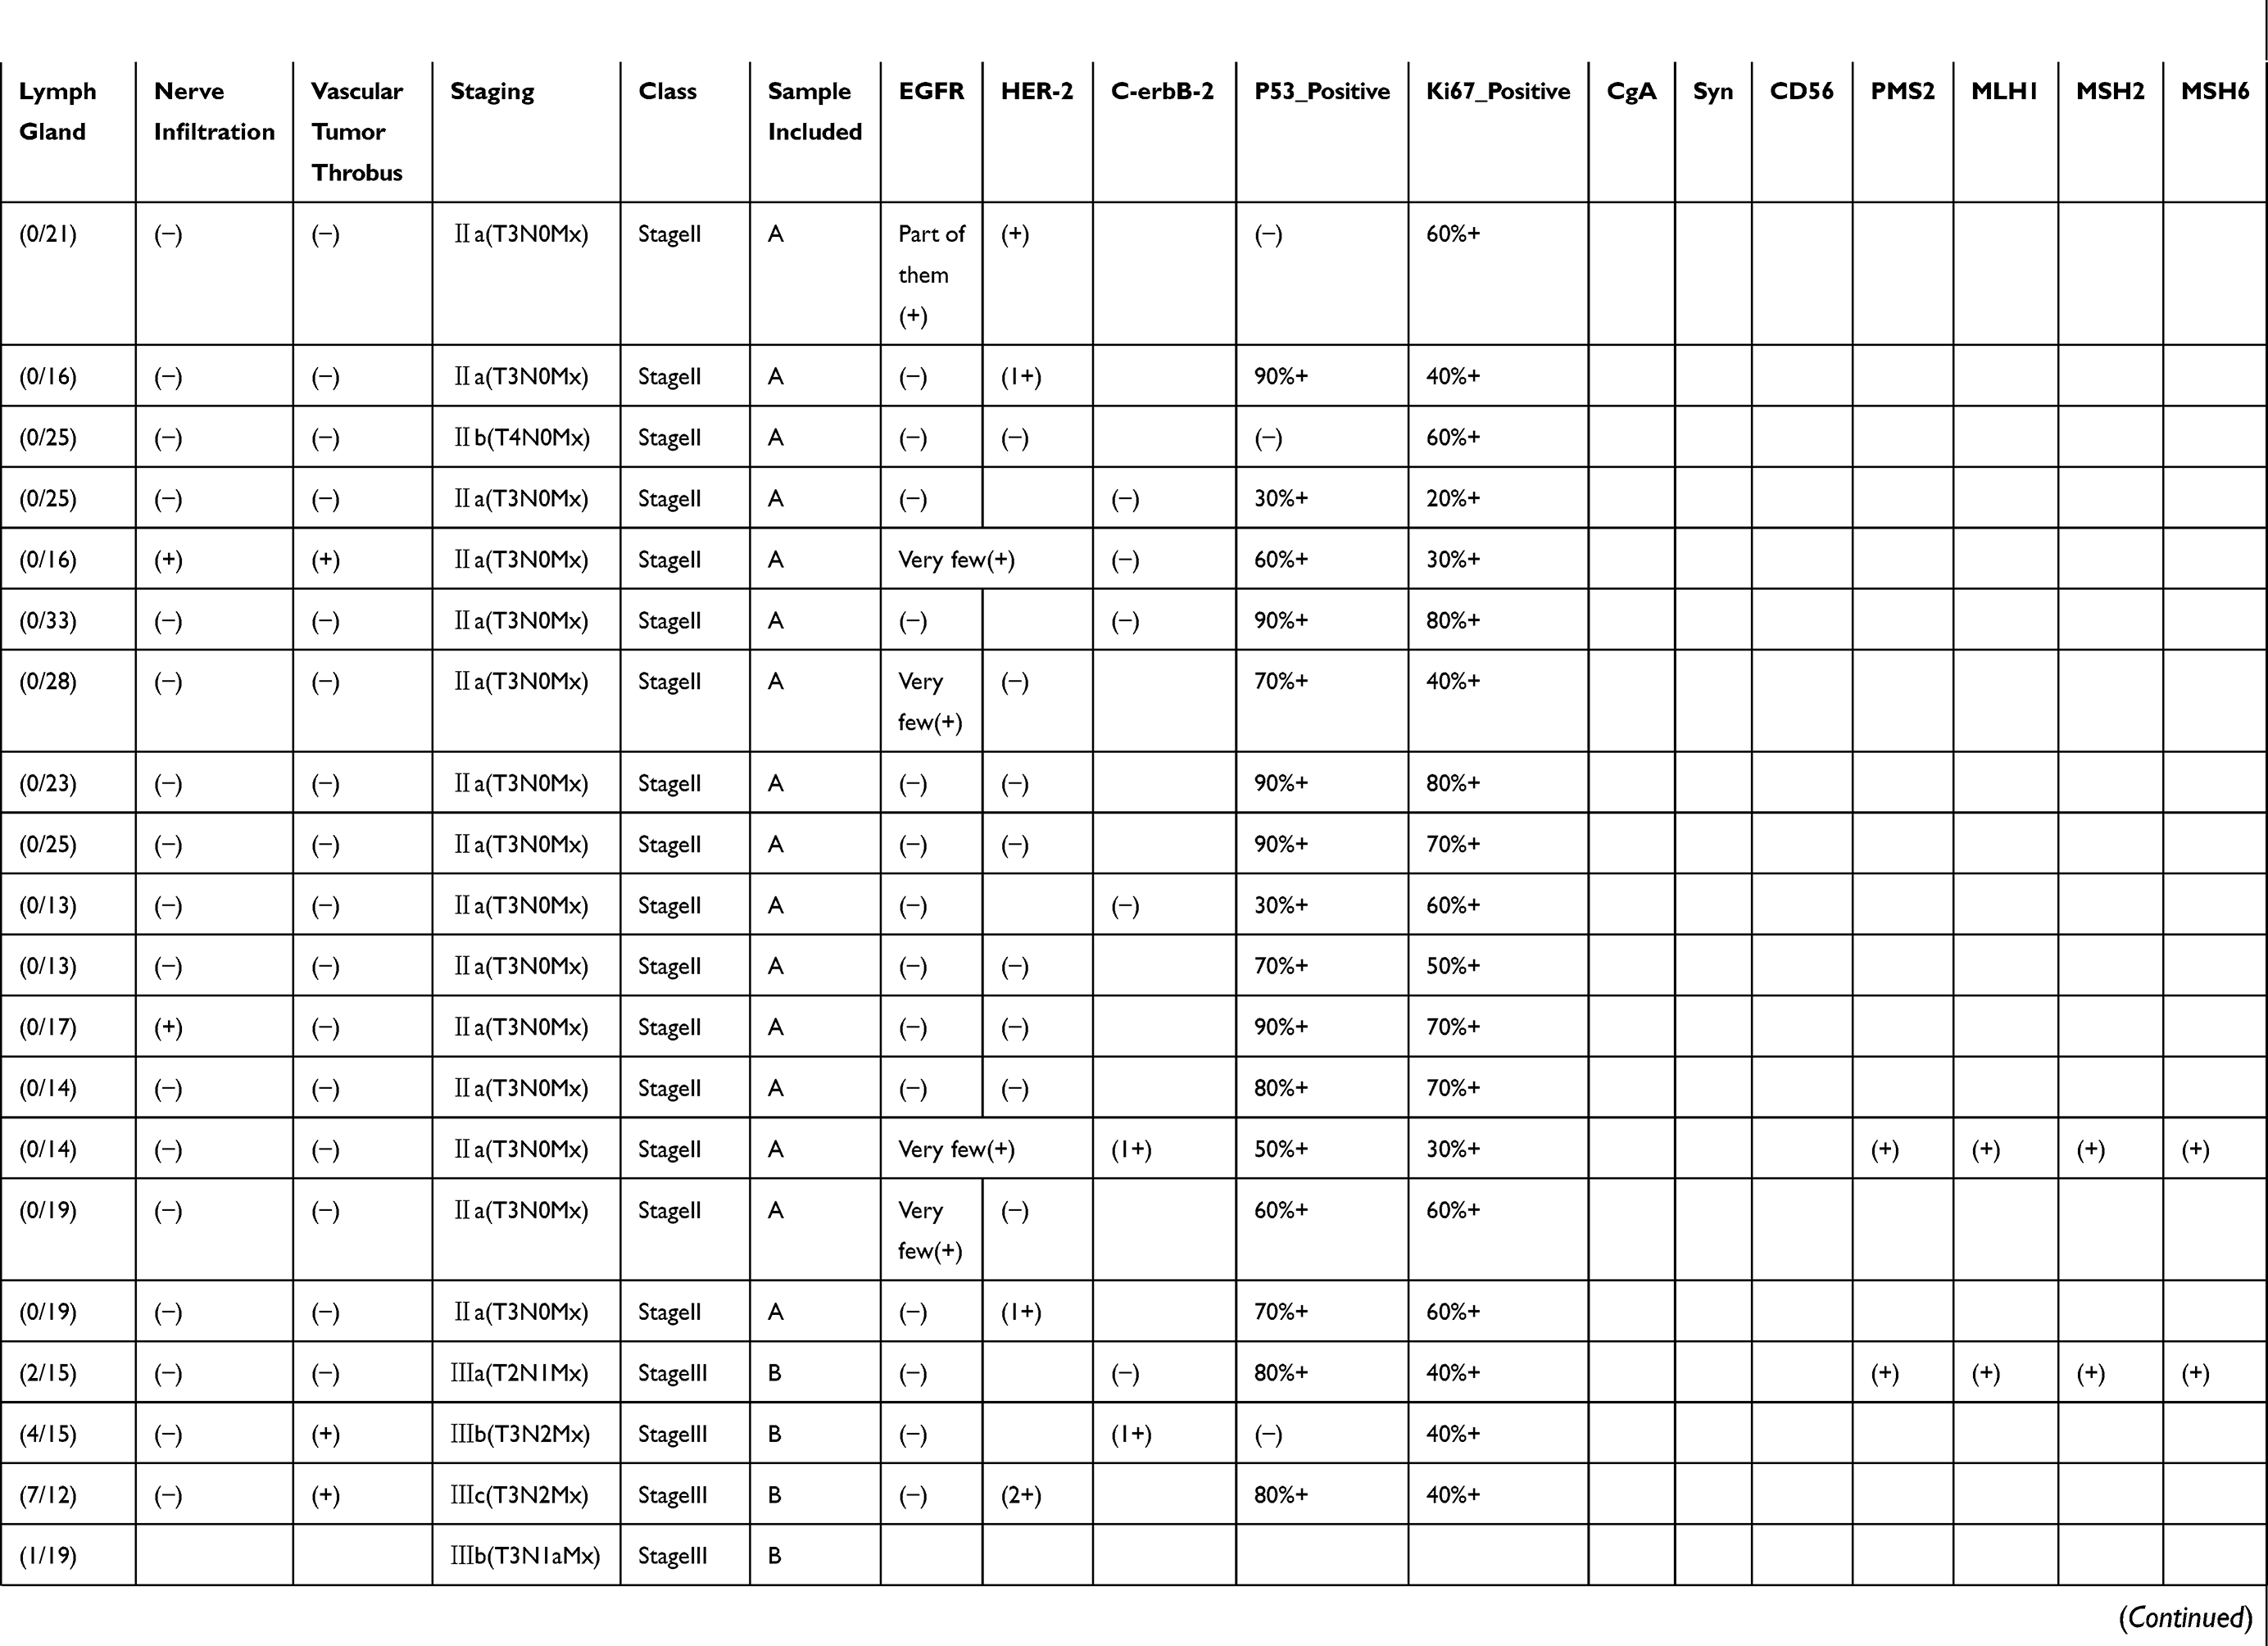 | 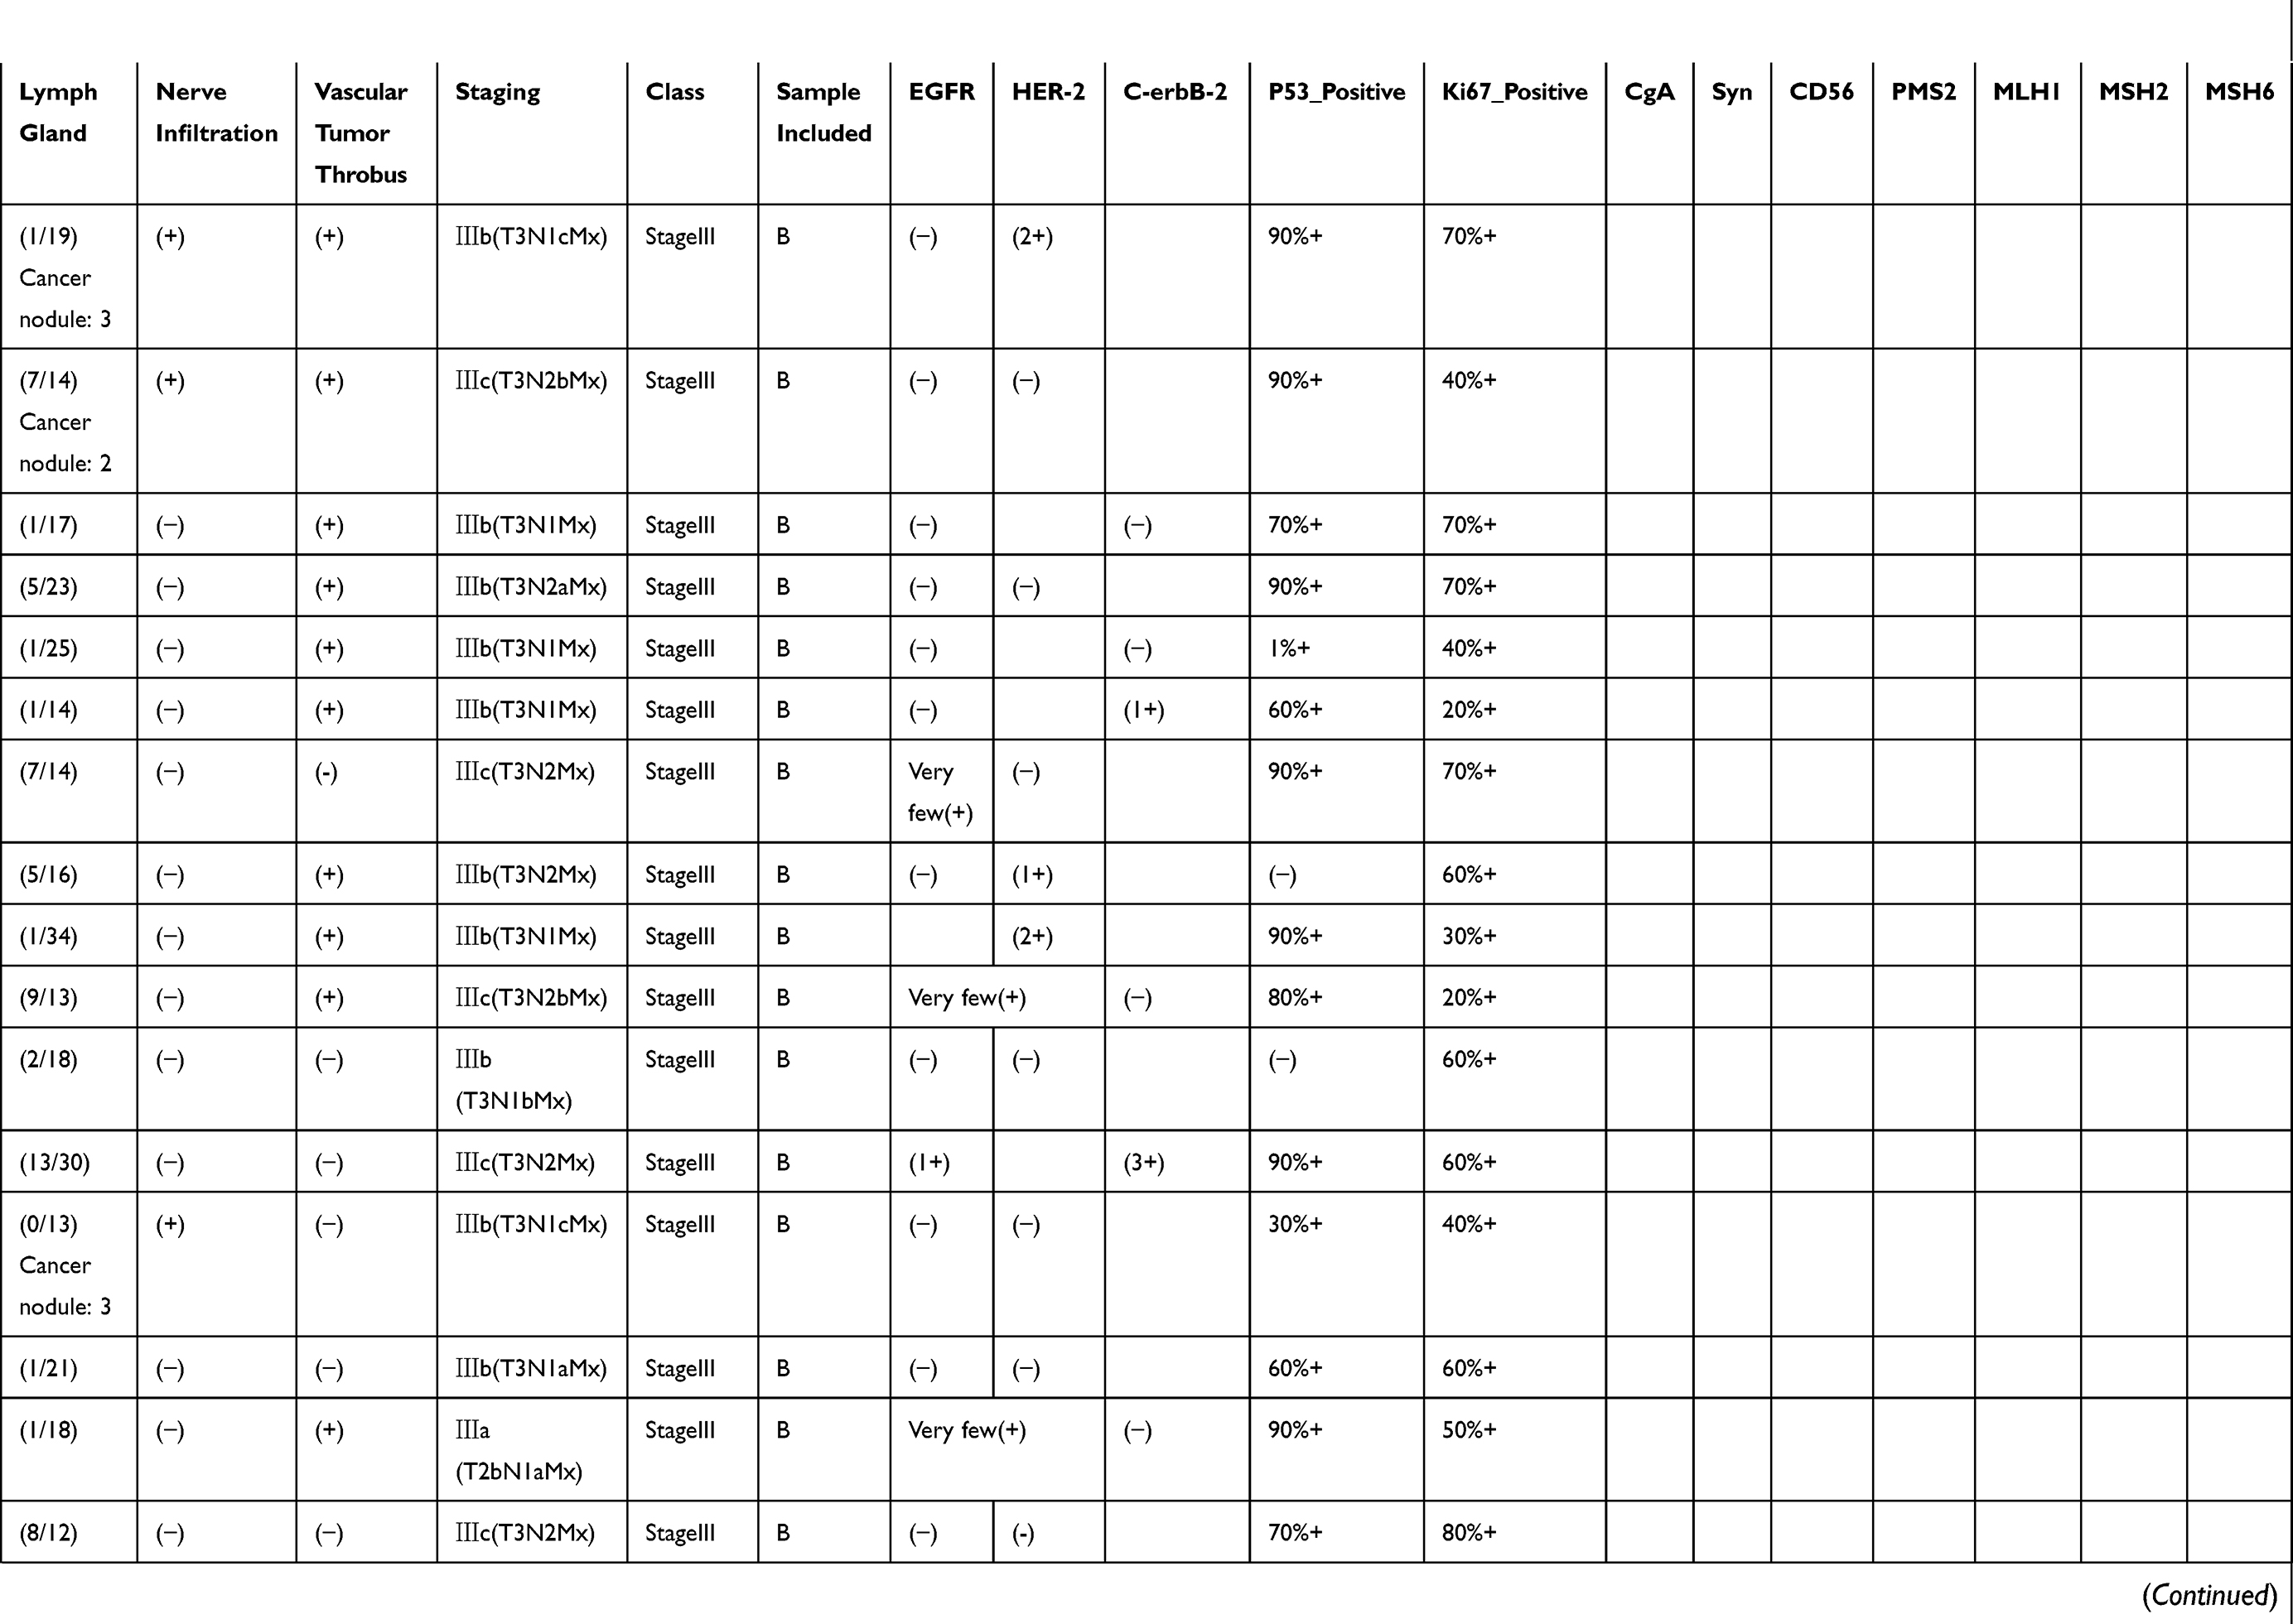 | 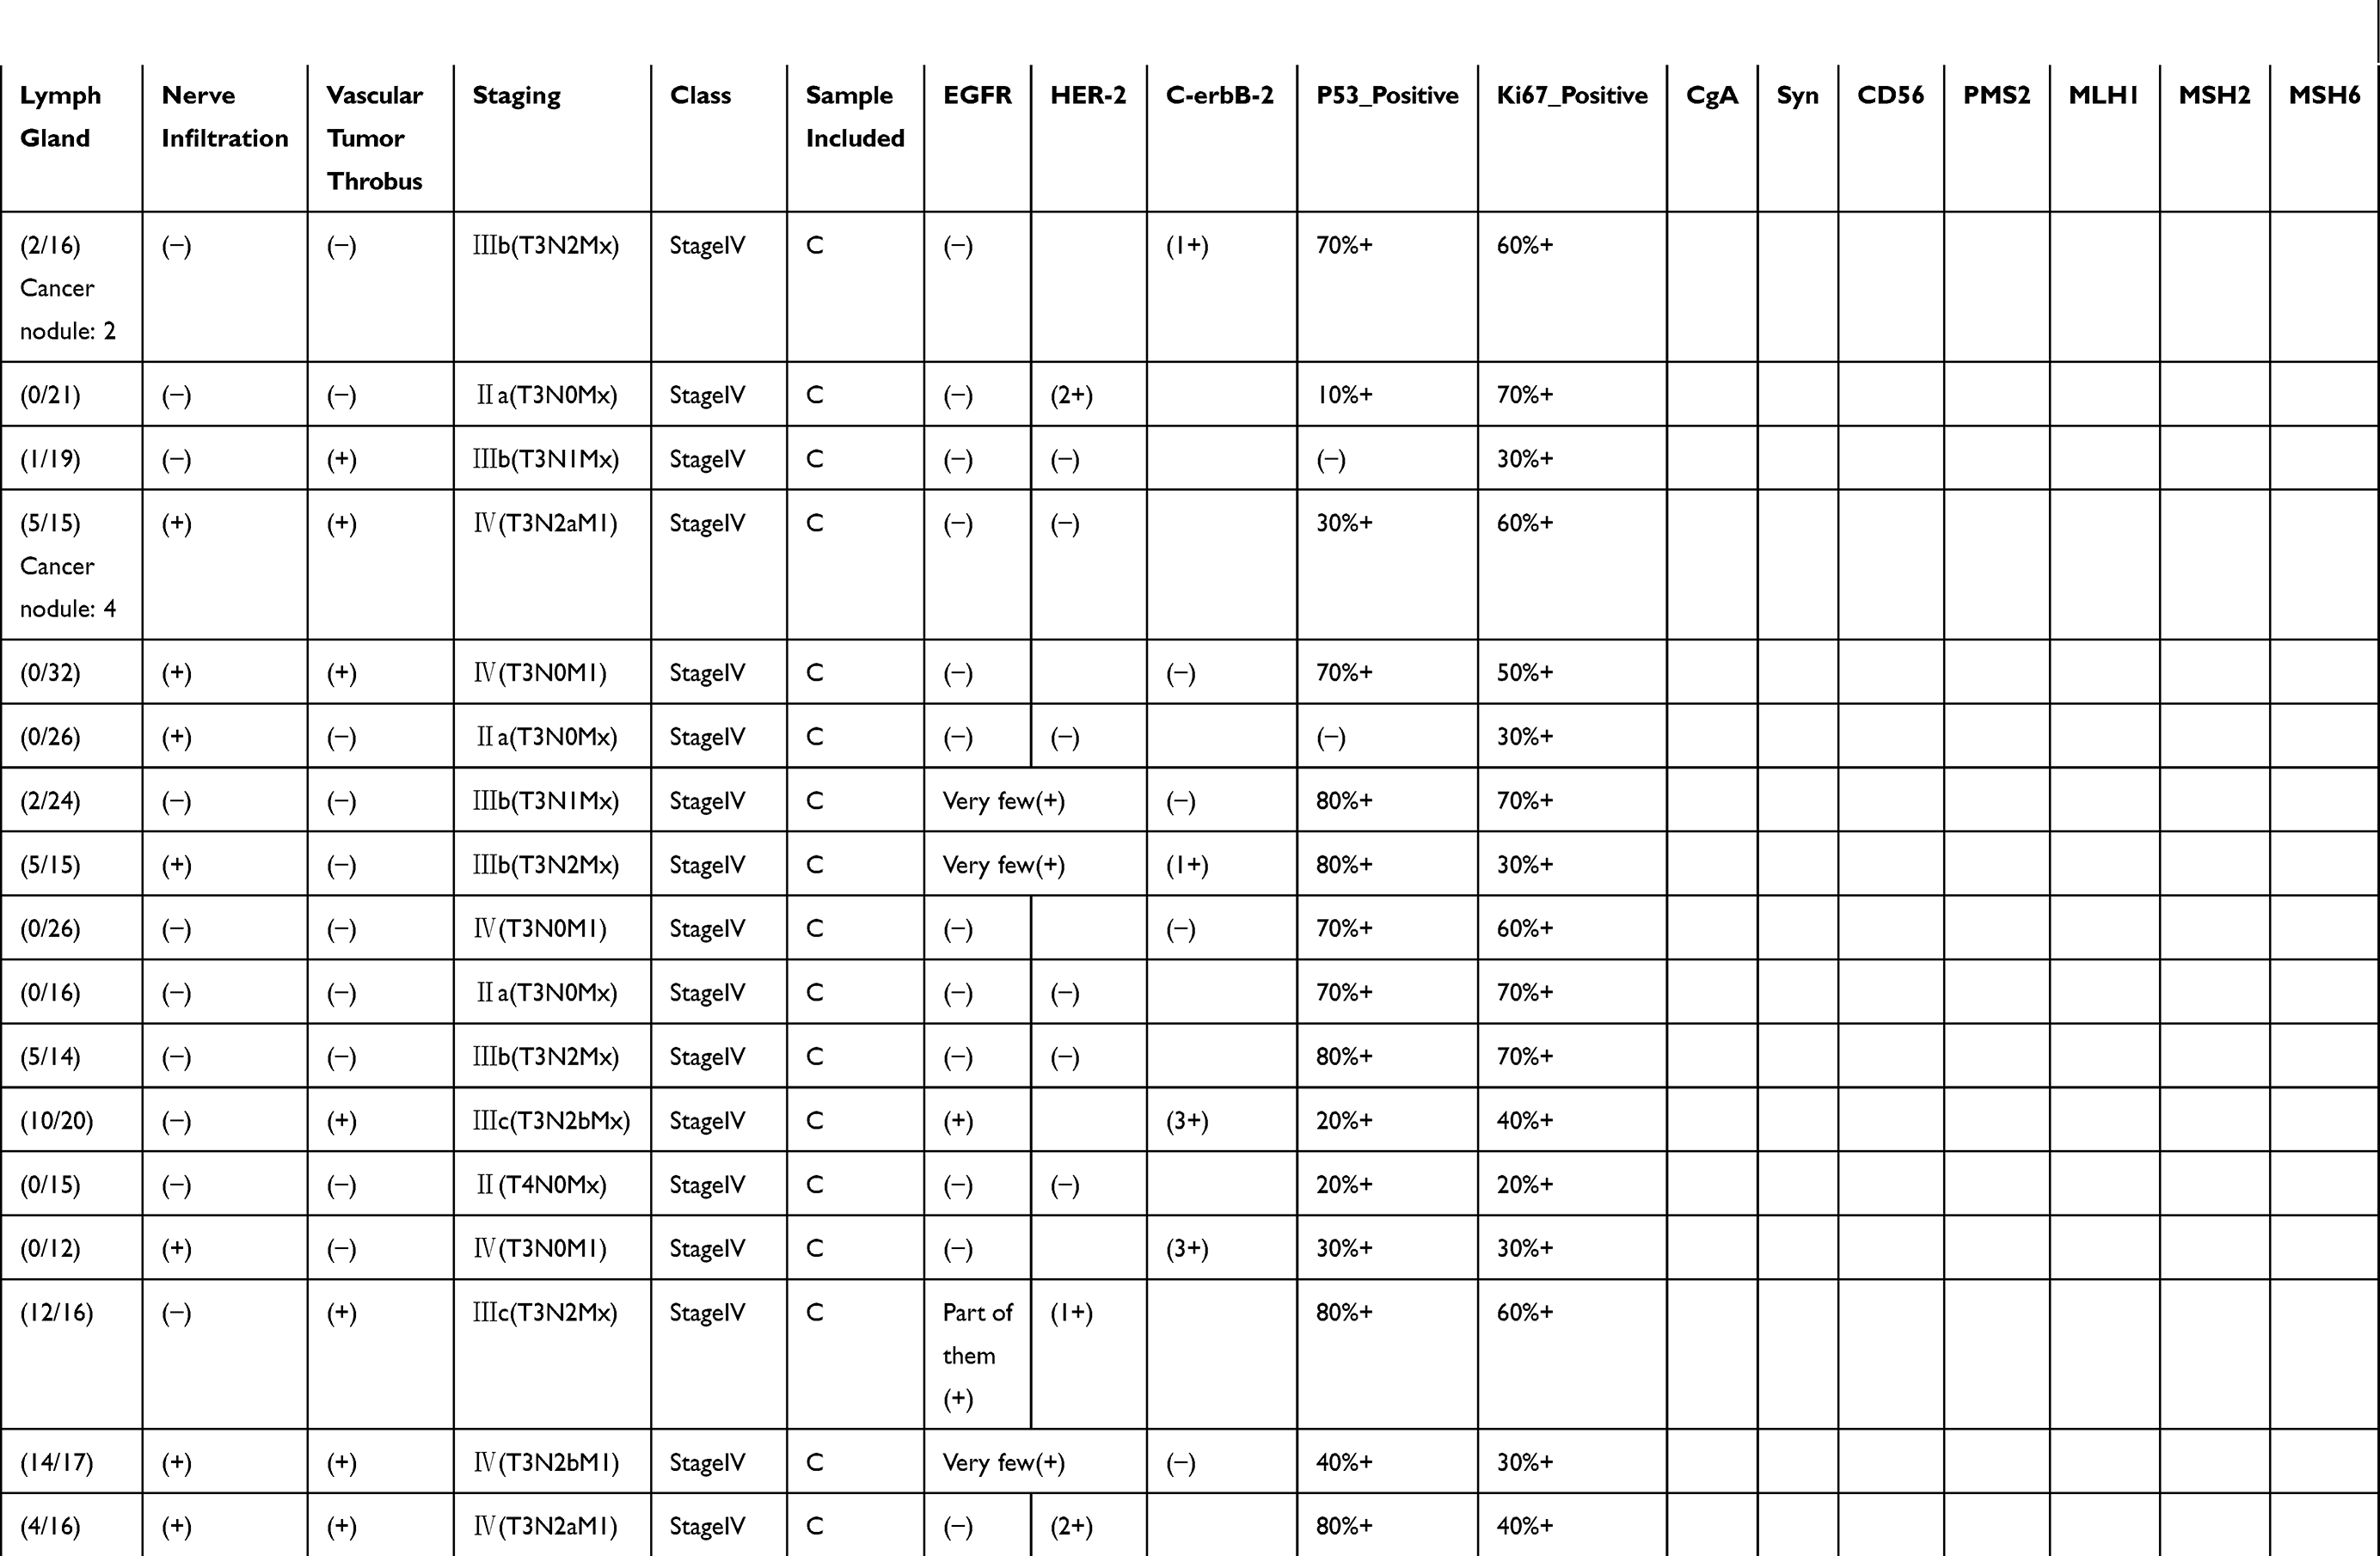 |
Table 1 Pathological Findings For Each Of The Samples Included In This Study. Disease Staging And Other Characteristics Listed Here Were Reported By An Independent Pathologist Who Evaluated The Tumor Sections Post-resection. Positive Or Negative Protein Expression Was Evaluated By Immunohistochemistry |
One such avenue that has been relatively poorly understood is through targeting of mitochondrial capacity. While it is well appreciated that tumor cells have a distinct reliance on anaerobic respiration that is not seen in normal colonic epithelial, the molecular mechanisms that mediate this process, especially around the mitochondria, are not fully known.8 Although mitochondrial damage is commonly observed following treatment with chemotherapy drugs, the actual importance of this damage is not fully clear, since tumor cells are not necessarily as sensitive to cytochrome c complex driven apoptosis the way normal cells are, or repair the damage in the same way.9 Seemingly contradictory observations of decreased mitochondrial gene copy number and of increased mitochondrial gene expression have been reported.10,11 It remains unclear how important/dispensable mitochondrial capacity and oxidative phosphorylation are to CRC proliferation and chemotherapy resistance.
In this report, we generated representative proteomics profiles of three stages of CRC and nearby healthy tissue. Bioinformatics analyses of these profiles confirmed that the tumors had significantly different metabolic protein profiles compared to healthy tissue at all stages, and included significant variation in mitochondrial proteins. Comparison of the results of our dataset with published single-set data and the cancer genome atlas (TCGA) dataset demonstrated that these differences were generally reproducible, with an upregulation in single-stranded DNA-binding protein 1 (SSBP1) being particularly prominent. Functional validation using SSBP1 knockdown demonstrated that the gene plays an important role in regulating mitochondrial mass. Depletion of SSBP1 increases the sensitivity of tumor cells to cisplatin-induced cell death, but only modestly impacts the ability of tumor cells to proliferate in the absence of the drug. Collectively, these results suggest that CRC cells may be able to compensate for loss of mitochondrial mass under steady-state conditions, but may succumb when given additional pressure from therapeutic intervention.
Materials And Methods
Patient Samples
Clinical specimens of tumor and peritumor samples were resected from patients who had given signed informed consent according to the approval of the Ethics Committee of the First Bethune Hospital of Jilin University. Samples were washed with ice-cold PBS and then snap frozen at −80°C before subsequent processing for proteomics.
Proteomics
Tissue samples were homogenized and recovered in 1X RIPA lysis buffer supplemented with proteinase inhibitors (ThermoFisher) prior to denaturation and trypsin cleavage (ThermoFisher). Protein concentrations were measured according to manufacturer’s protocol using a Bradford kit (Beyotime). Equal amounts of protein from each sample following digest (100 μg/sample) were washed, dried, and solubilized with 0.1% formic acid prior to loading into the ThermoFisher LTQ Orbitrap Velos. A false-discovery rate of 1% was set on peptide searches with minimum lengths of 8 and maximum lengths of 30 AA. Proteins that contained similar peptides and which could not be differentiated based on MS/MS analysis alone were grouped to satisfy the principles of parsimony using the MaxQuant analysis suite. Proteins sharing significant peptide evidence were sorted into protein groups, and intensity values recovered were log-normalized prior to differential expression analysis. For differential analysis of protein expression, only proteins which were detected in at least two of the four replicates of each sample were considered.
Cell Culture
Routinely maintained and validated HT-29 and SW480 cell lines (a gift from Dr. Juan Wang of Southern Medical University, China) were maintained in RPMI-1640 medium supplemented with 10% FBS and penicillin/streptomycin (Gibco) in a HeraCell incubator at 37°C and with 5% carbon dioxide content (ThermoFisher) for all experiments. All cell line work was conducted in accordance with the institutional guidelines of Dalian Medical University, and receipt of the cells was approved by the institute. For knockdown experiments, cells were plated at 50% confluence, rested overnight, and subsequently transfected with siRNAs targeting SSBP1 or scrambled control siRNA using Lipofectamine 3000 according to manufacturer’s protocol. Media were refreshed after 12 hrs, and cells were observed at least 24 hrs post-transfection to allow for effective interference with mRNA and degradation of existing protein prior to further experimental manipulation. For the wound healing experiment, cells were grown in 6-well plates, with the “wound“ being generated by scraping of an equal-sized area in the center of each well. Plates were imaged using a Canon EOS Rebel attached to a 10X objective under a brightfield microscope (Olympus). 1μM Cisplatin and 5-flurouracil dissolved in DMSO (Sigma-Aldrich) were used to treat the cells for 24 hrs following transfection with siRNA and prior to analysis. Each experiment was performed at least 3 times, and representative results are shown in each case.
Flow Cytometry
Mitochondrial mass and mitochondrial potential were assessed through the use of MitoTracker Green and MitoTracker DeepRed, respectively (ThermoFisher). Cells were stained for 20 mins at 4°C with MitoTrackers in 1X HBSS before 7-AAD (Beyotime) was added as an exclusion dye for 5 mins to mark dead cells. The stained cells were then promptly washed and acquired on a BD Verse flow cytometer. Resulting FACS data were analyzed via Flowjo (TreeStar).
Meta-Analysis And Visualizations
FPKM data of normal and tumor samples from the TCGA COAD cohort were retrieved from UCSC Xena, and imported into R for clustering via the Seurat package.12 Clinical data of the TCGA samples taken from the Xena browser was annotated as additional metadata. As a further point of comparison, publically available single-cell RNAseq data of colorectal cancer were downloaded from GSE8186113 and analyzed similarly. Clustering was performed using t-stochastic neighborhood embedding on all genes with significant differential expression as recommended in the standard Seurat pipeline.14 Volcano plots were generated using the EnhancedVolcano package.15
Results
Proteomics Characterization Of Human CRC
In order to assess the relative importance proteomic changes may have to CRC pathogenesis, we first performed a simple proteomics assay of pooled tumor samples resected from patients at three different stages of disease, as well as corresponding normal tissue nearby. We selected highly representative patients for this analysis (Table 1), and ran technical quadruplicates to recover 1,072 common proteins across every sample run according to stringent detection criteria (Figure 1A). Correlational analysis of the expression profiles across these samples demonstrated that normal tissue at each stage was essentially identical, while tumor samples could be somewhat differentiated while being highly separated from the healthy tissue (Figure 1B). The four replicates originating from mucinous adenocarcinoma patients were most clearly separated by this analysis as a result of their unique origin cell type. This separation could also be confirmed through principal component analysis (Figure 1C). Volcano plot mapping demonstrated that the distribution of protein expression changes between all tumor and normal samples was largely balanced, but that a number of genes associated with cellular replication and synthesis (such as PCNA and EIF3B) were increased in the tumor, while the expression of surface proteins indicative of epithelial cell status (such as COL14A1, MUC2, and DCN) notably decreased (Figure 1D). These changes are consistent with tumor cells de-differentiating over the course of cancer, and may also be related to the epithelial–mesenchymal transition tumors undergo in order to metastasis.
Functional analysis of these protein changes revealed striking increases in RNA processing machinery and downregulation of pathways involved in oxidative phosphorylation according to pathway enrichment analysis (Figure S1) consistent with previous reports. These functional changes could also be confirmed via induced module analysis (Figure S2) and protein–protein interaction network analysis (Figure 1E), suggesting that the quality of our samples was highly robust. Similar results could also be recovered through searching for other annotation databases for gene set enrichment analysis (Figure 1F). A full listing of the expression profiles of each recovered high-confidence protein is included in Table S1.
Changes In Mitochondrial Gene Expression During CRC
Encouraged by these results, we then performed more in-depth analyses to explore the extent to which these divergences between tumor and normal proteomes may be explained by cellular organelle origin within the conventional adenocarcinoma samples. Proteins recovered were assigned localizations according to KEGG annotations, allowing for one protein to be matched to all of the organelles to which it has been previously reported to be associated with. We then performed independent correlation mappings of the subset of genes from each organelle. A large degree of separation between tumors and normal samples could be seen for nuclear, ER, and cytoplasmic proteins, consistent with the significant differences seen between the groups in our PCA and clustering analyses. Interestingly, however, proteins with putative endosome localization were highly similar, suggesting that tumor cells may share, and have a similar need for, mechanisms involved in vesicle uptake and degradation (Figure S3). Significant similarity could also be seen for mitochondrial proteins (Figure 2A), which we decided to focus on. A full heatmap visualization of mitochondrial-related genes showed surprisingly few significantly genes, despite relatively even expression profiles across each sample (Figure 2B). Forty out of the 469 proteins were found to have significant differential expression, with increases in the expression of Trap1, Ssbp1, and Pycr1 being particularly prominent (Figure 2C). Despite being relatively few in number, however, protein–protein network analysis demonstrated that these genes were likely to be highly interlinked in function and may interact directly (Figure 2D). Collectively, these results confirm that a portion of mitochondrial genes may be sensitive to change during CRC pathogenesis.
Joint Analysis Confirms Change In Mitochondrial Expression In CRC Tumors
Since our dataset is limited to providing protein information on changes in CRC, we next sought to evaluate if these changes were also reproducible on a transcriptional level. We first turned to the TCGA CRC dataset for information on a broader cohort-wide scale. Through dimensionality reduction and clustering with t-stochastic neighborhood embedding (t-SNE), we were able to cleanly differentiate out samples originating from healthy normal tissue from the tumor samples (Figure 3A). This separation was not driven by differences in resection site, tumor stage, or cell origin (Figure S4), although the mucinous adenocarcinoma samples formed a unique cluster in the t-SNE space. Direct visualization of the expression of varied mitochondrial proteins identified in our dataset confirmed that the results were reproducible across the TCGA cohort (Figure 3B). Violin plots demonstrated that the expression profiles of the genes fell along relatively normal distributions, with the primary tumor samples having higher expression of Trap1, Ssbp1, and Pycr1 than nearby normal solid tissue (Figure 3C).
Having confirmed these differences on a bulk transcriptomics level, we then performed a meta-analysis using single-cell sequencing data of CRC to investigate if the changes in mitochondrial expression might also be detectable on a cellular scale. Consistent with our expectations, t-SNE clustering was able to easily separate out the majority of normal and tumor cells (Figure 3D). Visualization of expression profiles in the t-SNE space and violin plots confirmed that these genes were also significantly varied in the single-cell dataset, although the absolute expression percentages were less impressive as a result of technical dropout (Figure 3E and F). Overall, these comparisons confirmed that the varied expression of mitochondrial proteins we observed in our dataset was indeed robust and shared across other independent datasets.
SSBP1 Influences Mitochondrial Mass And Cell Survival In CRC Cell Lines
Given the consistency of the expression changes observed, we then sought to perform functional validation to assess the significance of the increased genes. We elected to focus on SSBP1 since its functional role in the mitochondria is incompletely understood. We knocked down the expression of SSBP1 through siRNA transfection into two CRC cell lines (HT29 and SW480) and tracked the mitochondrial mass and potential of the cells through flow cytometry (Figure S5). Depletion of SSBP1 itself decreased the viability of the cells (Figure 4A), and mitochondrial mass became noticeably reduced 24 hrs post-transfection in both lines (Figure 4B). Curiously, however, this decrease did not result in a large reduction in overall mitochondrial potential, suggesting that the remaining mitochondria in the surviving cells might be able to compensate somewhat (Figure 4C). At the same time, a wound-healing experiment performed with SSBP1-depleted cells suggested that knockdown may only modestly lower the rate at which SW480 cells can proliferate (Figure 4D).
We then repeated these experiments to further consider the potential influence the commonly used chemotherapy drug cisplatin may have on the system. Interestingly, the knockdown of SSBP1 appeared to lead to a significant increase in the susceptibility of the cells (Figure 4E). At the same time, mitochondrial mass and potential did not appear to be further altered in the surviving cells (Figure S5); indeed, it appears as though the heavy cell death may actually lead to a slight survivor’s bias in favor of cells with higher mitochondrial content. At the same time, this result was less clearly seen when 5-fluoruracil was used, suggesting that it may be somewhat specific to cisplatin’s mechanism of action (Figure S5). Overall, these results demonstrate that SSBP1 expression does indeed have functional consequences for the viability of tumor cells, especially in the face of secondary pressure from chemotherapy.
Discussion
As a key regulator of the mitochondrial genome, SSBP1 has been reported to bind to asymmetric clusters within mitochondrial DNA and regulate its replication.16 This unique localization pattern renders SSBP1 to be an essential player in mitochondrial biogenesis and DNA damage responses.17–19 Increased expression of SSBP1 has already been shown to occur in a number of cancers, including melanoma, triple-negative breast cancer, and hepatocellular carcinoma.20–22 This increase has been correlated with negative clinical outcomes in the context of gastric cancer, while reversal of this increase has been shown to increase the sensitivity of non-small cell lung cancer cells to ionizing radiation.23 In this report, we demonstrate that SSBP1 is also upregulated in colorectal cancer, and that this increase may be functionally linked to mitochondrial mass in CRC cell lines. These increases seem to be part of a larger shift towards increased expression of mitochondrial maintenance genes, as we also detected significant increases in TOMM22, PYCR1, and TRAP1, despite not observing a dramatic skew of all mitochondrial genes. This occurrence may indicate a compensation for mitochondrial stress caused by the harsh solid tumor environment.
However, since the increased expression of these mitochondrial genes was observed to be independent of disease stage in CRC tumor cells, it is likely that the change represents a more general shift during tumor growth. This shift is somewhat surprising given the known dependence of most tumors on cytosolic anaerobic glycolysis over mitochondria-mediated aerobic respiration. However, the decrease in mitochondria mass that followed from SSBP1 depletion correlated with a loss of cellular viability, suggesting that CRC cells may still require an increased mitochondrial mass to survive. This need may be partly due to other mitochondrial functions outside of respiration, such as processing of reactive oxygen species, or synthesis of other small molecules like prostaglandins or ethyl esters.24,25 Damaged mitochondria might also serve as a danger signal within a cell to trigger protective mitophagy,26 or otherwise as a source of immune stimulus by releasing sequestered cardiolipin and nucleic acids.27 How tumor cells are able to adjust their behavior to prevent providing further stimulus from immune cells remains to be explored. Future work may also clarify the relative importance of these processes to tumor formation and proliferation. For instance, other treatments that restrict mitochondrial mass and disrupt these other processes may thus be of additional interest as adjuvants to enhance the efficacy of chemotherapy drugs.
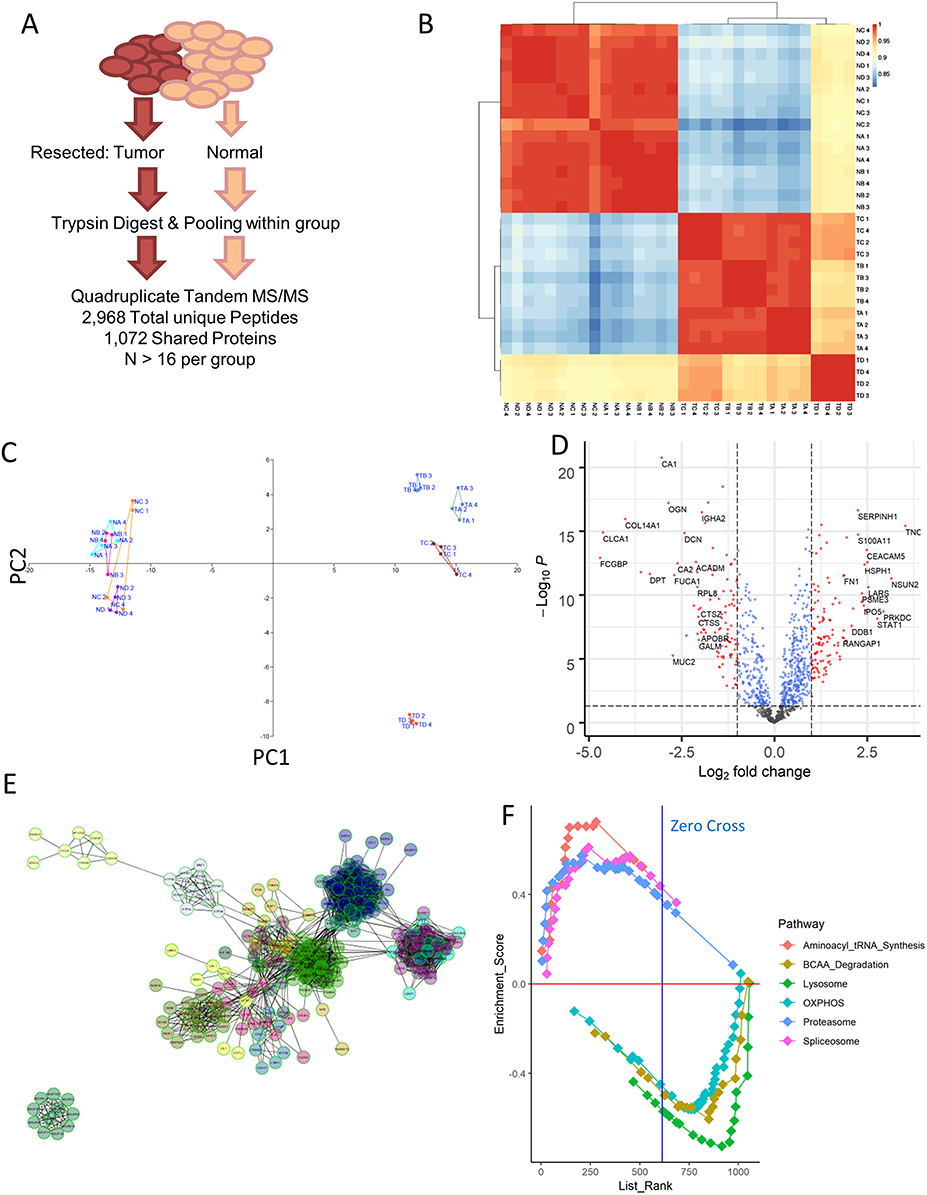 |
Figure 1 Proteomic profiling of colorectal cancer. (A) Resected samples from a pool of patients were pooled together and run through mass spectrometry, yielding a collection of 2,968 peptides that match to 1071 distinct proteins shared among all the samples. (B) Correlation matrix computed using Pearson correlation between each of the samples run. NA = normal stage II, NB = normal stage III, NC = normal stage IV, TA = tumor stage II, TB = tumor stage III, TC = tumor stage IV. ND and TD samples corresponded to mucinous adenocarcinoma sample. (C) Principal component analysis of the samples confirms the stratification of tumor and normal samples seen in simple correlation analysis, while also separating out the mucinous adenocarcinoma tumor samples from the rest. (D) Volcano plot visualization of the differentially expressed genes between normal and tumor samples reveals an upregulation in some factors associated with basic cellular processes, such as PCNA and EIF3b. (E) Network analysis of proteins upregulated in tumor samples using ReactomeFI as visualized in Cytoscape identifies several classes of proteins that are highly related. (F) Gene set enrichment analysis for KEGG pathways that are differentially expressed across all normal vs tumor samples. Positive enrichment score indicates enrichment in tumor samples. The top 3 varied pathways in either direction are shown here, and are statistically significant with FDR <10% and p-value <0.05. |
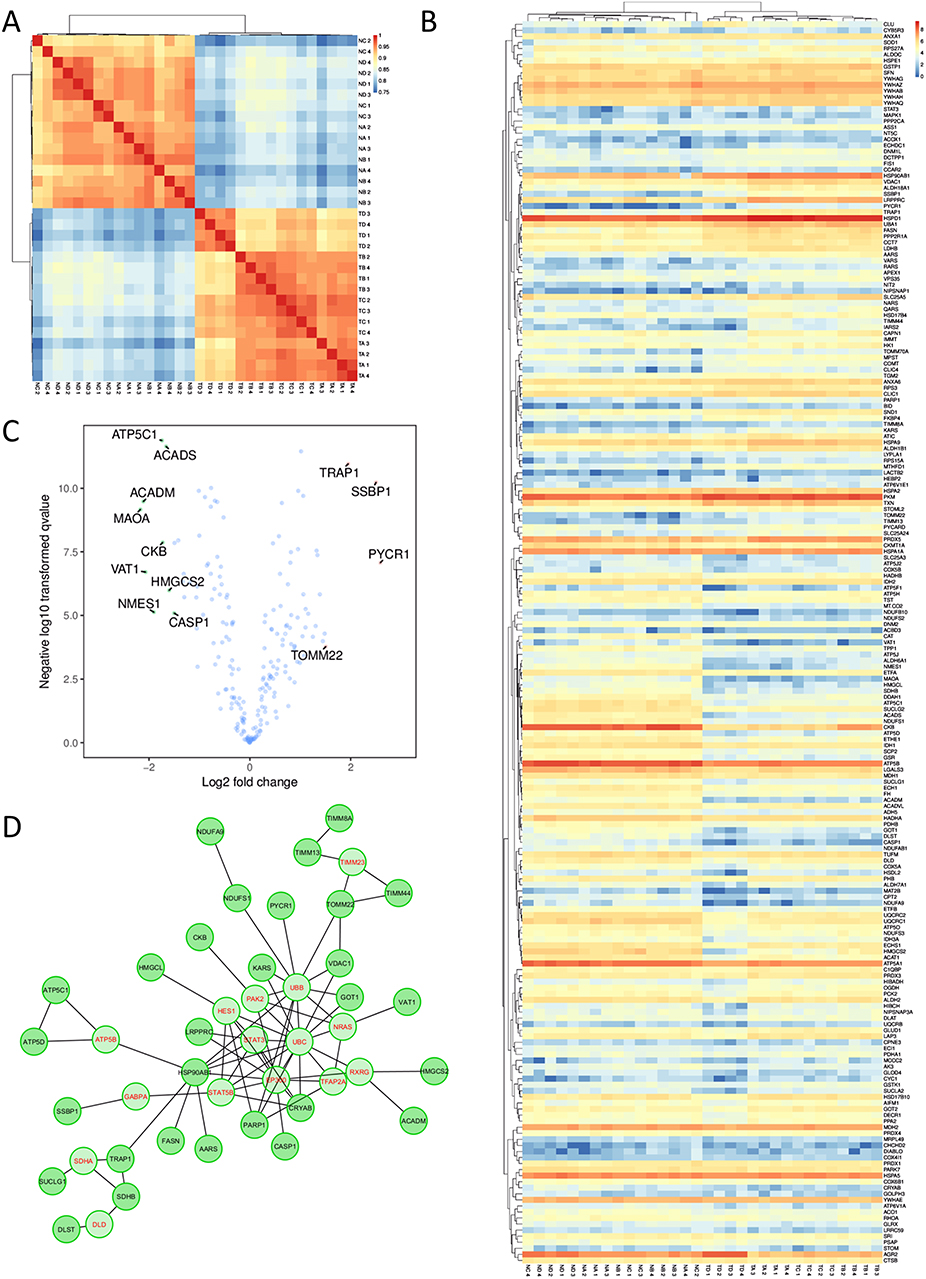 |
Figure 2 Changes in mitochondrial gene expression show sharp differences between samples derived from healthy tissue and tumor tissue. (A) Correlation of all mitochondrial protein expression levels according to Pearson’s R. (B) Heatmap visualization of the expression profiles for each gene. (C) Volcano plot highlighting the most variably expressed genes in between all of the tumor and healthy samples. (D) Network analysis through ReactomeFI based on the full list of mitochondrial proteins identified. Genes in red are key nodes identified. |
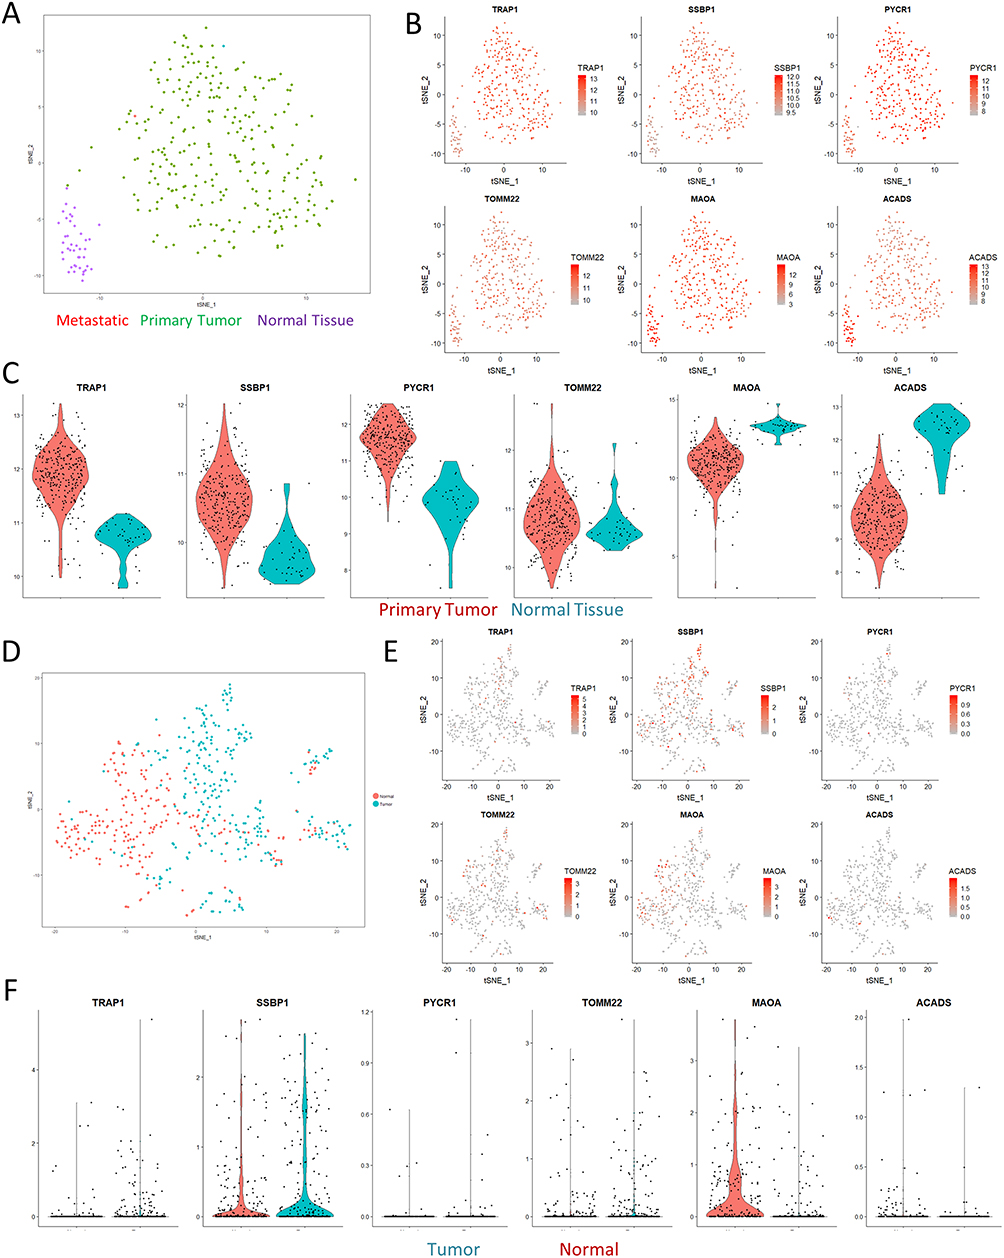 |
Figure 3 Paired analyses with TCGA and single-cell RNAseq. (A) tSNE visualization of the TCGA colon cancer cohort shows clear separation of normal solid tissue from tumor samples. (B) Overlaid gene expression visualization of the expression profiles of mitochondrial genes identified in Figure 2 shows that the proteomics results we observed could also be matched with larger cohort-level data. (C) Violin plots computing the expression levels between normal and primary tumor samples. All of the visualizations shown were significant at a p-value <0.01 according to Wilcoxian testing. (D) tSNE visualization of a single-cell sequencing dataset of a colorectal cancer sample. (E–F) tSNE visualization and violin plots of the same genes in (B) show similar effects in terms of expression differences, albeit with significant levels of dropout. |
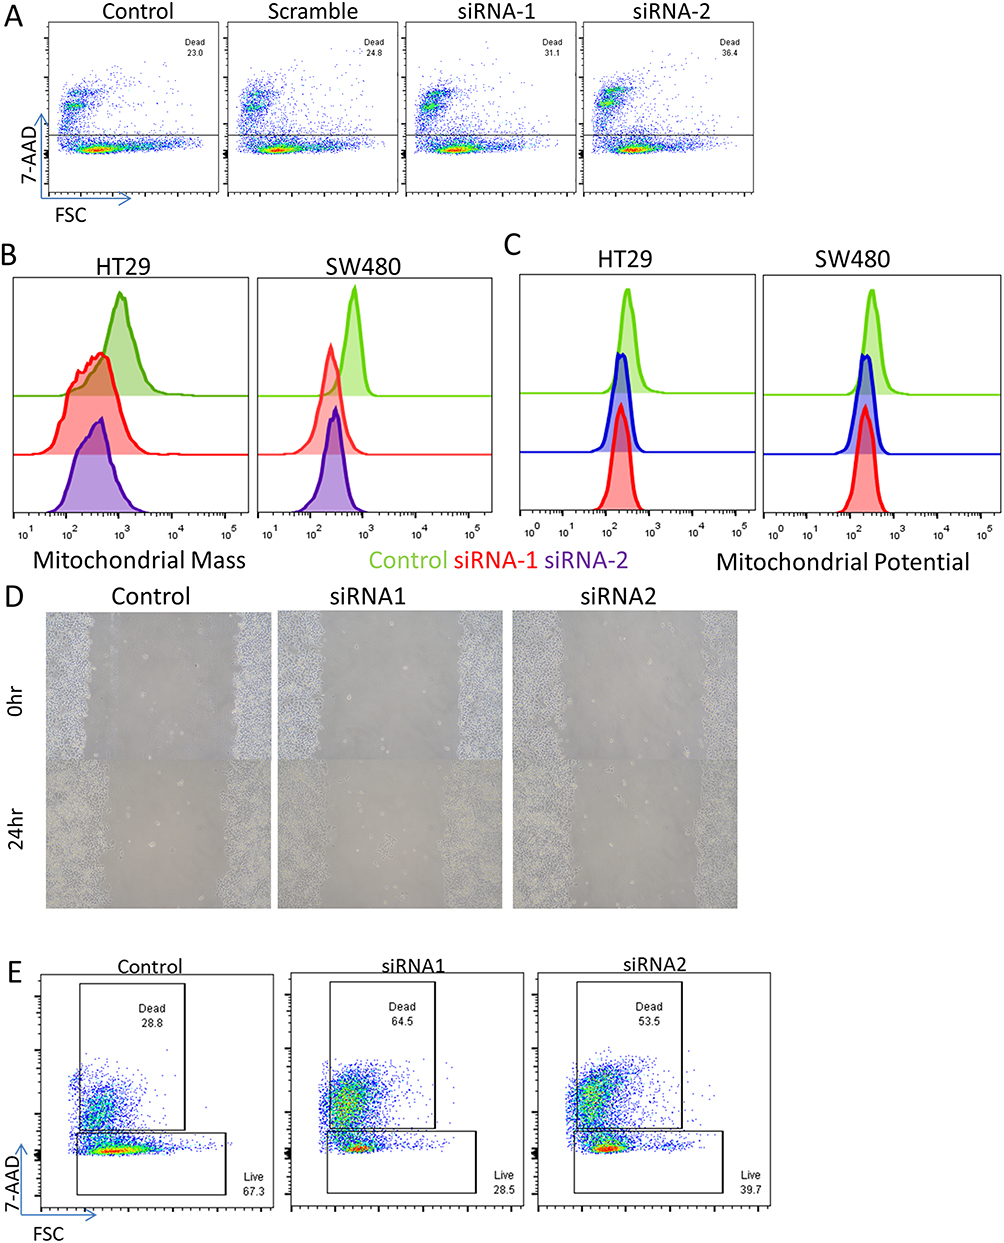 |
Figure 4 SSBP1 regulates mitochondrial mass and cell viability. Depletion of SSBP1 via lipofectamine transfection of targeted siRNA or scramble induces an increase in cell death when assessed in flow cytometry via 7-AAD staining in SW480 cells. (B–C) Assessment of mitochondrial mass and potential in two cell lines via flow cytometry based on mitotracker dyes shows a decrease in mean fluorescence intensity following knockdown. (D) Wound healing assay did not observe significant differences in the rates of recovery of SSBP1-knockdown cells. (E) Viability assay as in (A) but performed in the additional presence of 1uM cisplatin for 24 hrs. |
Acknowledgements
The authors would like to thank all of the patients who granted permission to use resected samples for biological research. HT29 and SW480 cell lines used in this study were a gift from Dr. Juan Wang of Southern Medical University, Guangzhou, China. The authors would also like to thank the other members of the labs for providing insightful comments during manuscript discussions.
Disclosure
This work was supported in part by National Science Foundation of China grant 81670668 and Liaoning Province Key Research and Development grant 2017225041 to FZ. The authors report no other conflicts of interest in this work.
References
1. De Roock W, De Vriendt V, Normanno N, Ciardiello F, Tejpar S. KRAS, BRAF, PIK3CA, and PTEN mutations: implications for targeted therapies in metastatic colorectal cancer. Lancet Oncol. 2011;12(6):594–603. doi:10.1016/S1470-2045(10)70209-6
2. Varghese V, Magnani L, Harada-Shoji N, et al. FOXM1 modulates 5-FU resistance in colorectal cancer through regulating TYMS expression. Sci Rep. 2019;9(1):1505. doi:10.1038/s41598-018-38017-0
3. Wasserman I, Lee LH, Ogino S, et al. SMAD4 loss in colorectal cancer patients correlates with recurrence, loss of immune infiltrate, and chemoresistance. Clin Cancer Res. 2019;25(6):1948–1956. doi:10.1158/1078-0432.CCR-18-1726
4. Zaanan A, Shi Q, Taieb J, et al. Role of deficient DNA mismatch repair status in patients with stage III colon cancer treated with FOLFOX adjuvant chemotherapy: a pooled analysis from 2 randomized clinical trials. JAMA Oncol. 2018;4(3):379–383. doi:10.1001/jamaoncol.2017.2899
5. Ou J, Peng Y, Yang W, et al. ABHD5 blunts the sensitivity of colorectal cancer to fluorouracil via promoting autophagic uracil yield. Nat Commun. 2019;10(1):1078. doi:10.1038/s41467-019-08902-x
6. Wang M, Han D, Yuan Z, et al. Long non-coding RNA H19 confers 5-Fu resistance in colorectal cancer by promoting SIRT1-mediated autophagy. Cell Death Dis. 2018;9(12):1149. doi:10.1038/s41419-018-1187-4
7. Morgan MJ, Fitzwalter BE, Owens CR, et al. Metastatic cells are preferentially vulnerable to lysosomal inhibition. Proc Natl Acad Sci U S A. 2018;115(36):E8479–E8488. doi:10.1073/pnas.1706526115
8. Vander Heiden MG, Cantley LC, Thompson CB. Understanding the Warburg effect: the metabolic requirements of cell proliferation. Science. 2009;324(5930):1029–1033. doi:10.1126/science.1160809
9. Chiang SC, Meagher M, Kassouf N, et al. Mitochondrial protein-linked DNA breaks perturb mitochondrial gene transcription and trigger free radical-induced DNA damage. Sci Adv. 2017;3(4):e1602506. doi:10.1126/sciadv.1602506
10. Márquez-Jurado S, Díaz-Colunga J, Das Neves RP, et al. Mitochondrial levels determine variability in cell death by modulating apoptotic gene expression. Nat Commun. 2018;9(1):389. doi:10.1038/s41467-017-02787-4
11. Shin YK, Yoo BC, Chang HJ, et al. Down-regulation of mitochondrial F1F0-ATP synthase in human colon cancer cells with induced 5-fluorouracil resistance. Cancer Res. 2005;65(8):3162–3170. doi:10.1158/0008-5472.CAN-04-3300
12. Butler A, Hoffman P, Smibert P, Papalexi E, Satija R. Integrating single-cell transcriptomic data across different conditions, technologies, and species. Nat Biotechnol. 2018;36(5):411–420. doi:10.1038/nbt.4096
13. Li H, Courtois ET, Sengupta D, et al. Reference component analysis of single-cell transcriptomes elucidates cellular heterogeneity in human colorectal tumors. Nat Genet. 2017;49(5):708–718. doi:10.1038/ng.3818
14. van der Maaten LJP. Accelerating t-SNE using Tree-Based Algorithms. J Med Learn Res. 2014;15:
15. Blighe K. EnhancedVolcano: publication-ready volcano plots with enhanced colouring and labeling. R Package Version 1.1.1. 2019. Available from: htps://github.com/kevinblighe/EnhancedVolcano.
16. Koh CWQ, Goh YT, Toh JDW, et al. Single-nucleotide-resolution sequencing of human N6-methyldeoxyadenosine reveals strand-asymmetric clusters associated with SSBP1 on the mitochondrial genome. Nucleic Acids Res. 2018;46(22):11659–11670. doi:10.1093/nar/gky1104
17. Morin JA, Cerrón F, Jarillo J, et al. DNA synthesis determines the binding mode of the human mitochondrial single-stranded DNA-binding protein. Nucleic Acids Res. 2017;45(12):7237–7248. doi:10.1093/nar/gkx395
18. Sykora P, Kanno S, Akbari M, et al. DNA polymerase beta participates in mitochondrial DNA repair. Mol Cell Biol. 2017. pii: MCB.00237-17. doi:10.1128/MCB.00237-17
19. Richard DJ, Bolderson E, Cubeddu L, et al. Single-stranded DNA-binding protein hSSB1 is critical for genomic stability. Nature. 2008;453(7195):677–681. doi:10.1038/nature06883
20. Ye Y, Huang A, Huang C, et al. Comparative mitochondrial proteomic analysis of hepatocellular carcinoma from patients. Proteomics Clin Appl. 2013;7(5–6):403–415. doi:10.1002/prca.201100103
21. Jiang HL, Sun HF, Gao SP, et al. SSBP1 suppresses TGFβ-driven epithelial-to-mesenchymal transition and metastasis in triple-negative breast cancer by regulating mitochondrial retrograde signaling. Cancer Res. 2016;76(4):952–964. doi:10.1158/0008-5472.CAN-15-1630
22. Cecconi D, Carbonare LD, Mori A, et al. An integrated approach identifies new oncotargets in melanoma. Oncotarget. 2017;9(14):11489–11502. doi:10.18632/oncotarget.23727
23. Wang Y, Hu L, Zhang X, et al. Downregulation of mitochondrial single stranded DNA binding protein (SSBP1) induces mitochondrial dysfunction and increases the radiosensitivity in non-small cell lung cancer cells. J Cancer. 2017;8(8):1400–1409. doi:10.7150/jca.18170
24. Schiabor KM, Quan AS, Eisen MB. Saccharomyces cerevisiae mitochondria are required for optimal attractiveness to Drosophila melanogaster. PLoS One. 2014;9(12):e113899. doi:10.1371/journal.pone.0113899
25. Vyas S, Zaganjor E, Haigis MC. Mitochondria and Cancer. Cell. 2016;166(3):555–566. doi:10.1016/j.cell.2016.07.002
26. Hu L, Wang H, Huang L, Zhao Y, Wang J. The protective roles of ROS-mediated mitophagy on 125I seeds radiation induced cell death in HCT116 cells. Oxid Med Cell Longev. 2016;2016:9460462. doi:10.1155/2016/9460462
27. Zhu M, Barbas AS, Lin L, Scheuermann U, Bishawi M, Brennan TV. Mitochondria released by apoptotic cell death initiate innate immune responses. Immunohorizons. 2018;2(11):384–397. doi:10.4049/immunohorizons.1800063
 © 2019 The Author(s). This work is published and licensed by Dove Medical Press Limited. The full terms of this license are available at https://www.dovepress.com/terms.php and incorporate the Creative Commons Attribution - Non Commercial (unported, v3.0) License.
By accessing the work you hereby accept the Terms. Non-commercial uses of the work are permitted without any further permission from Dove Medical Press Limited, provided the work is properly attributed. For permission for commercial use of this work, please see paragraphs 4.2 and 5 of our Terms.
© 2019 The Author(s). This work is published and licensed by Dove Medical Press Limited. The full terms of this license are available at https://www.dovepress.com/terms.php and incorporate the Creative Commons Attribution - Non Commercial (unported, v3.0) License.
By accessing the work you hereby accept the Terms. Non-commercial uses of the work are permitted without any further permission from Dove Medical Press Limited, provided the work is properly attributed. For permission for commercial use of this work, please see paragraphs 4.2 and 5 of our Terms.