")
Back to Journals » International Journal of Chronic Obstructive Pulmonary Disease » Volume 16
Sputum Gene Expression Reveals Dysregulation of Mast Cells and Basophils in Eosinophilic COPD
Authors Winter NA , Gibson PG, McDonald VM , Fricker M
Received 4 February 2021
Accepted for publication 19 June 2021
Published 21 July 2021 Volume 2021:16 Pages 2165—2179
DOI https://doi.org/10.2147/COPD.S305380
Checked for plagiarism Yes
Review by Single anonymous peer review
Peer reviewer comments 4
Editor who approved publication: Dr Richard Russell
Natasha A Winter,1– 3 Peter G Gibson,1– 5 Vanessa M McDonald,1,2,4,6 Michael Fricker1– 4
1National Health and Medical Research Council Centre for Research Excellence in Severe Asthma, Newcastle, NSW, Australia; 2The Priority Research Centre for Health Lungs, The University of Newcastle, Newcastle, NSW, Australia; 3School of Medicine and Public Health, The University of Newcastle, Newcastle, NSW, Australia; 4Hunter Medical Research Institute, Newcastle, NSW, Australia; 5Department of Respiratory and Sleep Medicine, John Hunter Hospital, Hunter Medical Research Institute, Newcastle, NSW, Australia; 6School of Nursing and Midwifery, The University of Newcastle, Newcastle, NSW, Australia
Correspondence: Michael Fricker
The Priority Research Centre for Healthy Lungs, The University of Newcastle, Lot 1 Kookaburra Circuit, New Lambton Heights, NSW, 2305, Australia
Tel +64 2 4042 0207
Email [email protected]
Purpose: The clinical and inflammatory associations of mast cells (MCs) and basophils in chronic obstructive pulmonary disease (COPD) are poorly understood. We previously developed and validated a qPCR-based MC/basophil gene signature in asthma to measure these cells in sputum samples. Here, we measured this gene signature in a COPD and control population to explore the relationship of sputum MCs/basophils to inflammatory and COPD clinical characteristics.
Patients and Methods: MC/basophil signature genes (TPSAB1/TPSB2, CPA3, ENO2, GATA2, KIT, GPR56, HDC, SOCS2) were measured by qPCR in sputum from a COPD (n=96) and a non-respiratory control (n=17) population. Comparative analyses of gene expression between the COPD and the control population, and between eosinophilic COPD and non-eosinophilic COPD were tested. Logistic regression analysis and Spearman correlation were used to determine relationships of sputum MC/basophil genes to inflammatory (sputum eosinophil proportions, blood eosinophils) and clinical (age, body mass index, quality of life, lung function, past year exacerbations) characteristics of COPD.
Results: MC/basophil genes were increased in COPD versus control participants (CPA3, KIT, GATA2, HDC) and between eosinophilic-COPD and non-eosinophilic COPD (TPSB2, CPA3, HDC, SOCS2). We found all MC/basophil genes were positively intercorrelated. In COPD, MC/basophil genes were associated with eosinophilic airway inflammation (GATA2, TPSB2, CPA3, GPR56, HDC, SOCS2), blood eosinophilia (all genes) and decreased lung function (KIT, GATA2, GPR56, HDC).
Conclusion: We demonstrate associations of MCs and basophils with eosinophilic inflammation and lower lung function in COPD. These findings are consistent with prior results in asthma and may represent a new tool for endotyping eosinophilic-COPD.
Keywords: basophils, mast cells, COPD, gene expression, inflammation
Plain Language Summary
Mast cells (MCs) and basophils are important granulocytes that exert numerous immune functions, the dysregulation of which promote airway inflammation, bronchoconstriction and airway remodelling. The scarcity of these immune cells in the airways and the absence of MCs from circulation make them challenging to study in the clinical context and their inflammatory and clinical associations in COPD remain poorly understood. We have previously developed and validated a qPCR-based MC/basophil gene signature in asthma that reflects the abundance of these cells in sputum samples. Here, we apply this gene signature in a COPD cohort (n=96) and non-respiratory disease controls (n=17), demonstrating dysregulation of sputum MCs and basophils in COPD. Sputum MC/basophil-related gene expression was related to airway and systemic eosinophilic inflammation and lower lung function in COPD. These novel findings demonstrate potentially automatable PCR-based measure of airway MCs/basophils in COPD and reveal dysregulation of lumen MCs and basophils and associations with important clinical and inflammatory characteristics in COPD.
Introduction
COPD is the third leading cause of death and fifth cause of disability worldwide.1 Disease progression is marked by lung function decline and increased exacerbations of worsening symptoms.2 Inflammation plays an integral pathophysiological role in COPD. Patients can present with varied inflammatory patterns, the most well described being neutrophilic airway inflammation.3 However, eosinophilic inflammation, in sputum and blood, is also present in a significant number of individuals with COPD.4–8 Eosinophilic COPD (E-COPD) is associated with increased acute lung attacks,8,9 as well as higher healthcare utilization and costs.10 An understanding of the inflammatory pathways and mechanisms of E-COPD, and biomarkers that can support treatment and management is needed. Mast cells (MCs) and basophils exert numerous immunological functions associated with allergy, eosinophilic inflammation11,12 and airway remodelling.13 Recently, sputum MCs have been associated with asthma control and lung function14 and have been found to be dysregulated in severe asthma.15–17 Bronchial MC numbers are increased in smokers compared to non-smokers, with MC density correlating with airway remodelling18 and lung function.19 Sputum MC numbers are increased in current COPD smokers compared to ex-smokers20 and biopsy basophil numbers are increased in COPD patients compared to controls.21 However, the relationship of MCs and basophils to inflammation and clinical features of COPD, particularly E-COPD, is less understood. Further, the scarcity of MCs and basophils in airway-derived clinical samples such as sputum and the absence of mature MCs in circulation can make direct measurement difficult.
MCs and basophils possess distinctive and overlapping transcriptomic signatures expressed at greater levels compared to other immune cells in the lungs.22,23 We recently developed and validated a sputum MC/basophil gene signature, consisting of eight genes relating to varied MC/basophil immune functions (TPSAB1/TPSB2, CPA3, ENO2, GATA2, KIT, GPR56, HDC, SOCS2). qPCR-based measures of MC/basophil-related genes were directly related to MC and basophil abundance in sputum samples.17 Jiang et al further demonstrated a similar MC gene signature was directly related to biopsy MC abundance.24 These findings demonstrate the value of unique MC/basophil-related gene signatures to measure their abundance in complex primary airway samples such as sputum and bronchial biopsies.
Here we measured the validated sputum MC/basophil gene signature in COPD (n=96) and control populations (n=17) to explore the relationship of MCs and basophils to airway and systemic inflammation, clinical characteristics and exacerbation risk in COPD. We hypothesized that MC/basophil-related genes would be differentially expressed between control participants, eosinophilic and non-eosinophilic COPD and would be associated with systemic eosinophilia, clinical characteristics, and risk of lung attacks in COPD.
Methods
Study Design
In this observational, cross-sectional study, COPD participants were recruited via the respiratory ambulatory care clinics at John Hunter Hospital (NSW, Australia), the clinical research database of the Department of Respiratory and Sleep Medicine, John Hunter Hospital and by advertisement. Control participants were recruited by advertisement. Studies were approved by the Hunter New England Health Human Research Ethics Committee for COPD (12/12/12/3.06) and control (8/08/20/3.10) populations and research conducted complied with the Declaration of Helsinki. All participants provided written informed consent.
Participants
Participants required a doctor-confirmed diagnosis of COPD with documented evidence of incompletely reversible airflow limitation, and stable COPD at study visit. For detailed inclusion/exclusion criteria for COPD participants, see supplementary appendix S1. Control participants had no diagnosis of respiratory disease and had no overt respiratory infection at study visit. Current smokers were excluded from the study (COPD and controls).
Clinical Methods
Participants underwent previously published clinical methods,25 including sputum sample collection, blood collection for full blood count (peripheral blood eosinophil [PBE] count), spirometry (forced expiratory volume in one second [FEV1%], forced vital capacity [FVC%] and FEV1/FVC%), health status assessment (COPD Assessment Test [CAT] and St George’s Respiratory Questionnaire [SGRQ]) and past year exacerbation history (see Supplementary appendix S1 for exacerbation definitions).
Sputum Processing and Inflammatory Phenotyping
Sputum was induced and processed as described previously26 (see supplementary appendix S1 for details). Airway inflammatory phenotypes were determined via differential cell counts as follows: neutrophilic inflammation (N-COPD) (≥61% neutrophils, <3% eosinophils); eosinophilic inflammation (E-COPD) (<61% neutrophils, ≥3% eosinophils); mixed granulocytic inflammation (MG-COPD) (≥61% neutrophils, ≥3% eosinophils); paucigranulocytic inflammation (PG-COPD) (<61% neutrophils, <3% eosinophils).27 Dichotomous categorisations include eosinophilic (E-COPD and MG-COPD) vs non-eosinophilic (NE-COPD, which combines N-COPD and PG-COPD). PBE categories were determined using a PBE threshold (PBE high ≥300 cells/µL vs low <300 cells/µL).
Laboratory Methods
Sputum qPCR-based gene expression methods have been previously described.28–30 Target gene expression normalized to the B-actin housekeeping gene. ΔCt (change in cycle threshold between target gene and B-actin) and 2−ΔCt (relative mRNA abundance) values were used in the analysis. For detailed laboratory methods see supplementary appendix S1.
Statistical Analyses
Two-group comparisons were analyzed using Student’s t-test (parametric) or Wilcoxon rank sum (non-parametric). Kruskal–Wallis with Bonferroni post-hoc correction was used for multiple groups. Categorical data were analyzed using Fisher’s exact test, with Fisher’s p-value reported when expected counts were <5. Spearman correlation coefficients were used. Relative mRNA abundance values (2−ΔCt) were used for comparisons between groups and correlation analysis. Gene expression values (ΔCt) were used for regression analysis due to approximate normal distribution. MC/basophil genes were analyzed individually and in a combinatorial gene metric (see supplementary appendix S1).31 Relationship of MC/basophil genes to inflammatory phenotypes was determined with univariate logistic regression and receiver operating characteristic (ROC) curve analysis. Least absolute shrinkage and selection operator (LASSO) multivariate regression was used to select important genes in a model (R Studio v.3.6.2). Participants were categorized by PBE threshold (PBE high ≥300 cells/µL vs low <300 cells/µL) and frequent (≥2) and infrequent (0–1) for total and severe exacerbations in prior 12 months. A p-value <0.05 was considered statistically significant. Data were analyzed using STATA v.15.1 and GraphPad Prism v7. The data that support the findings of this study are available from the authorship team upon reasonable request.
Results
Clinical Characteristics of COPD and Control Participants
Participant demographics for both groups are shown in Table 1. COPD individuals were older, with more ex-smokers who had a higher pack-year history (Table 1). Most COPD participants had severe disease (GOLD quadrant D, n=70 [72.9%]). Sputum neutrophil and eosinophil proportions and PBE counts were higher in COPD participants compared to controls.
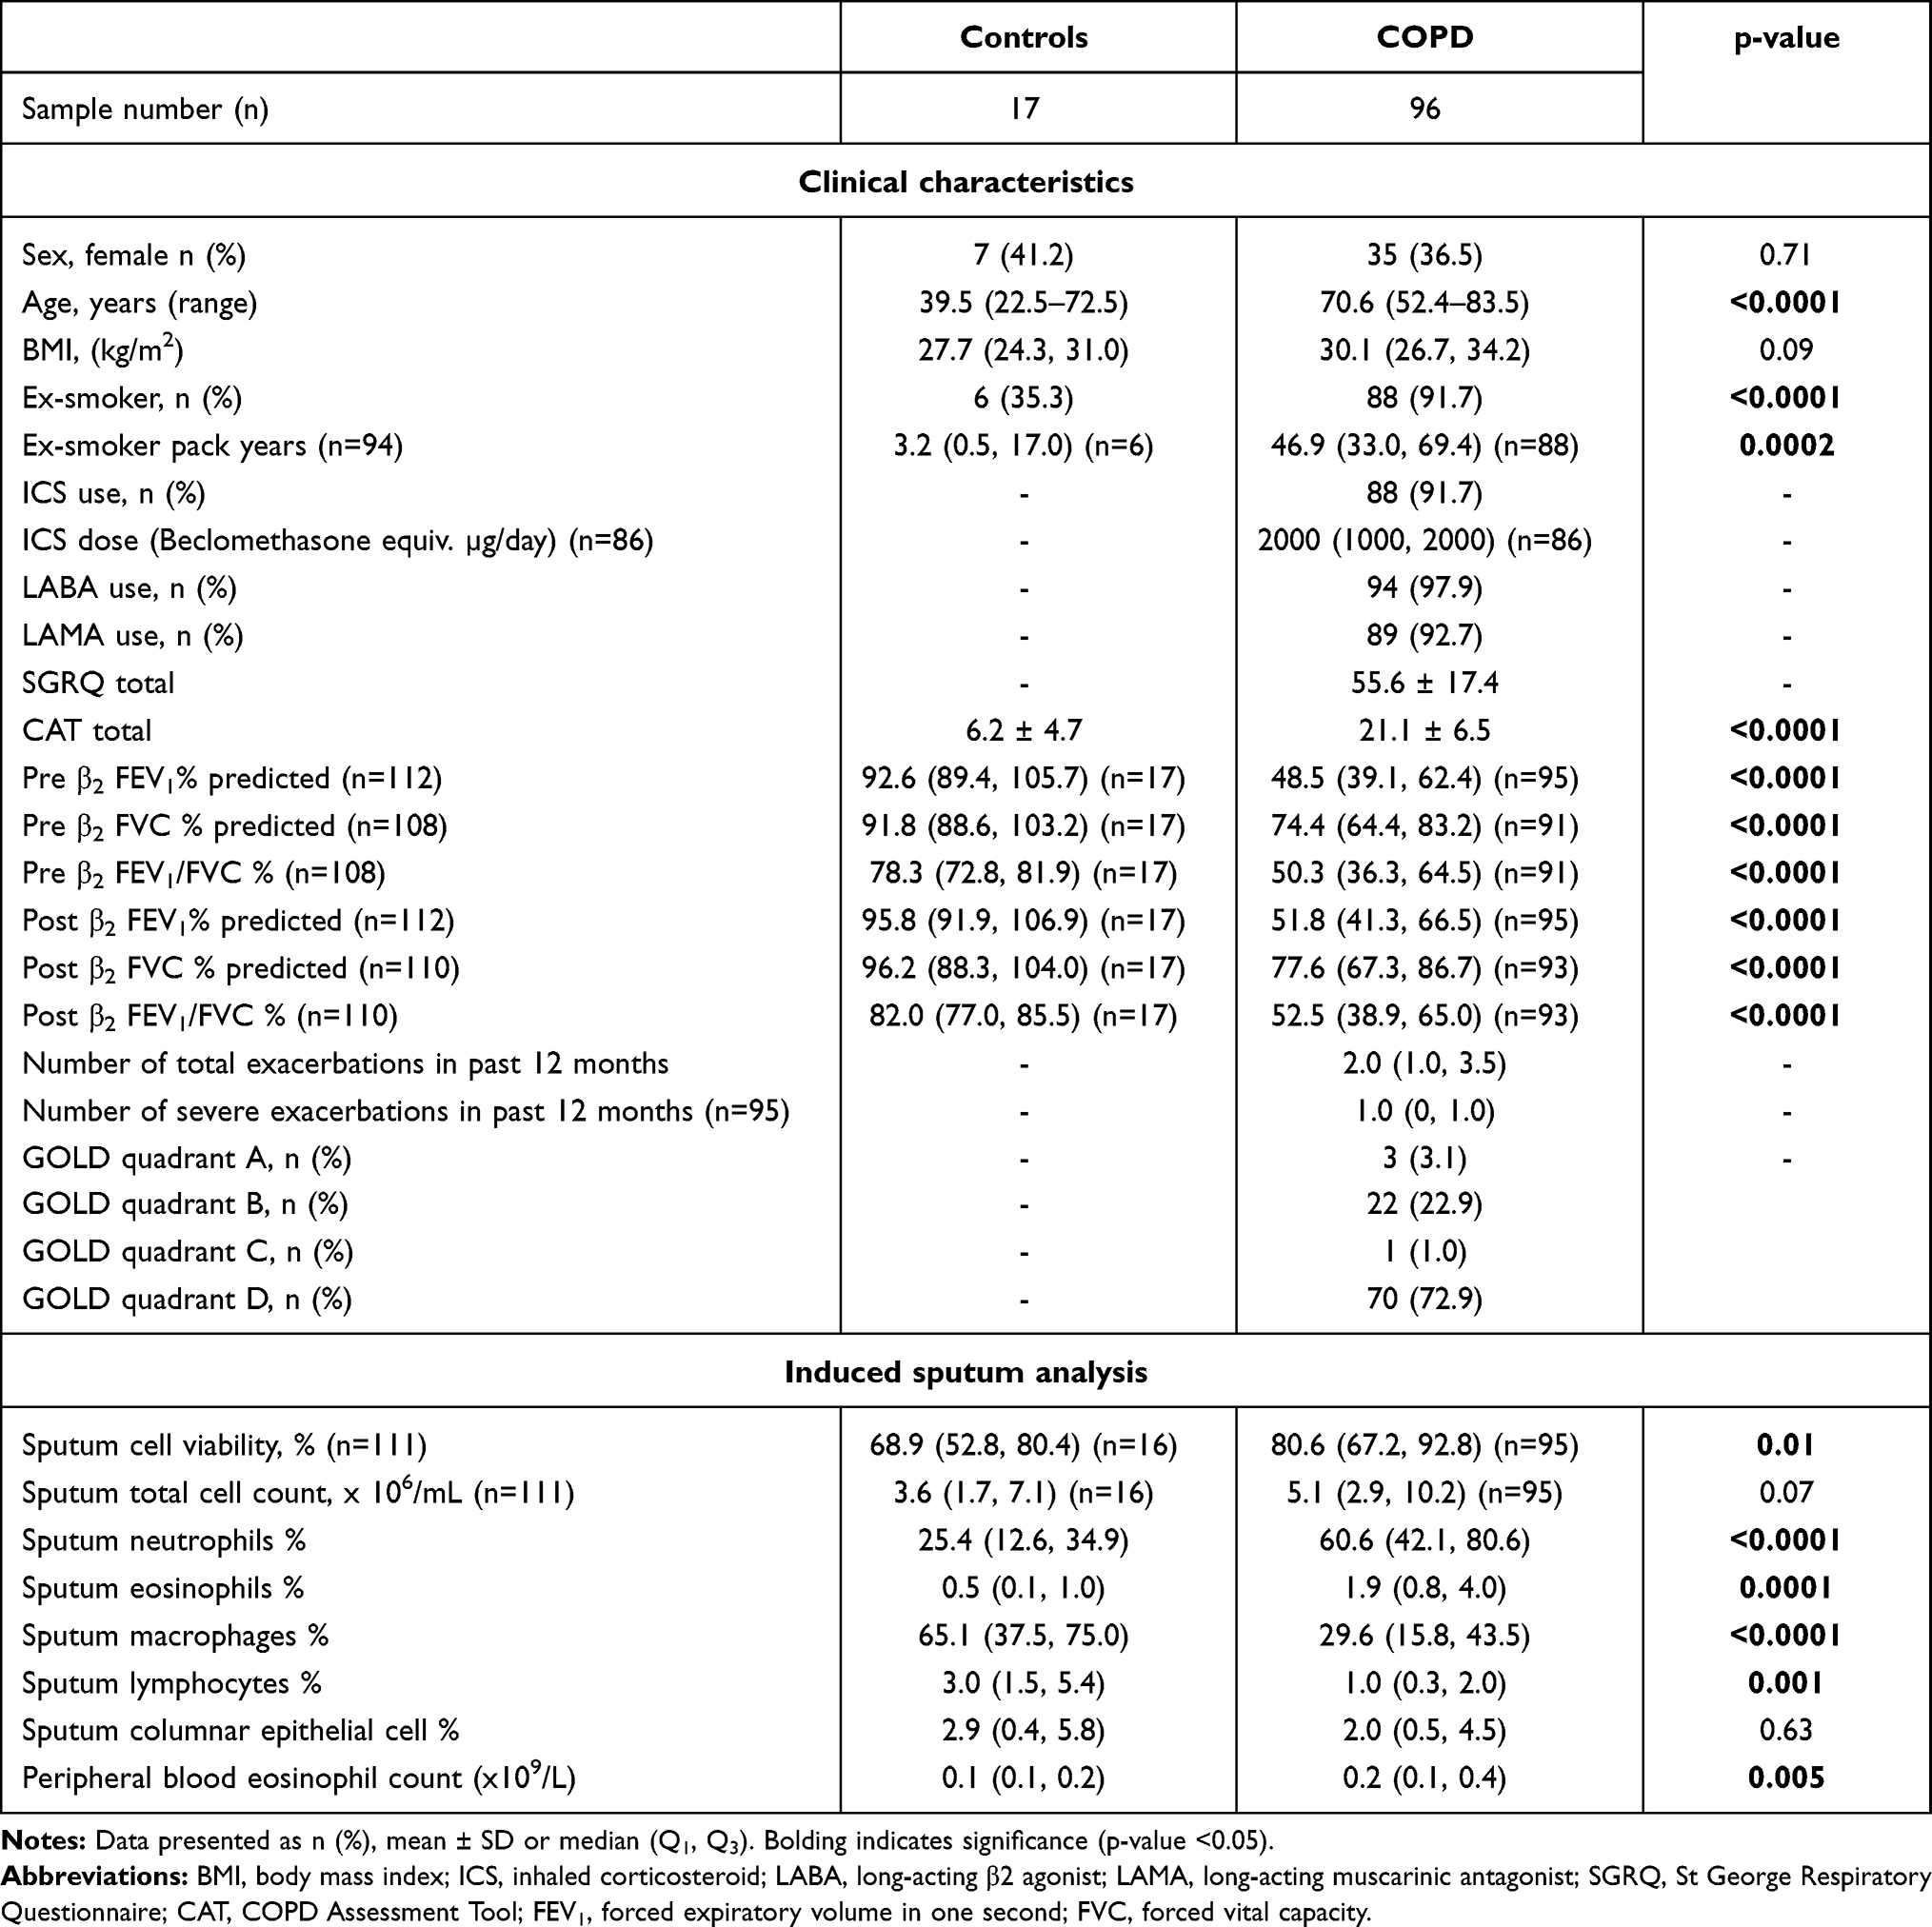 |
Table 1 Clinical Characteristics of Study Sample Populations |
MC/Basophil mRNA Abundance Increased Between COPD and Controls
Relative mRNA abundance significantly differed between COPD and control participants for CPA3, KIT, GATA2, SOCS2, ENO2 and HDC (Figure 1). CPA3, KIT, GATA2 and HDC mRNA abundance were increased in COPD vs controls. Control participants had increased SOCS2 and ENO2 mRNA abundance. No significant difference in the combinatorial gene metric was found.
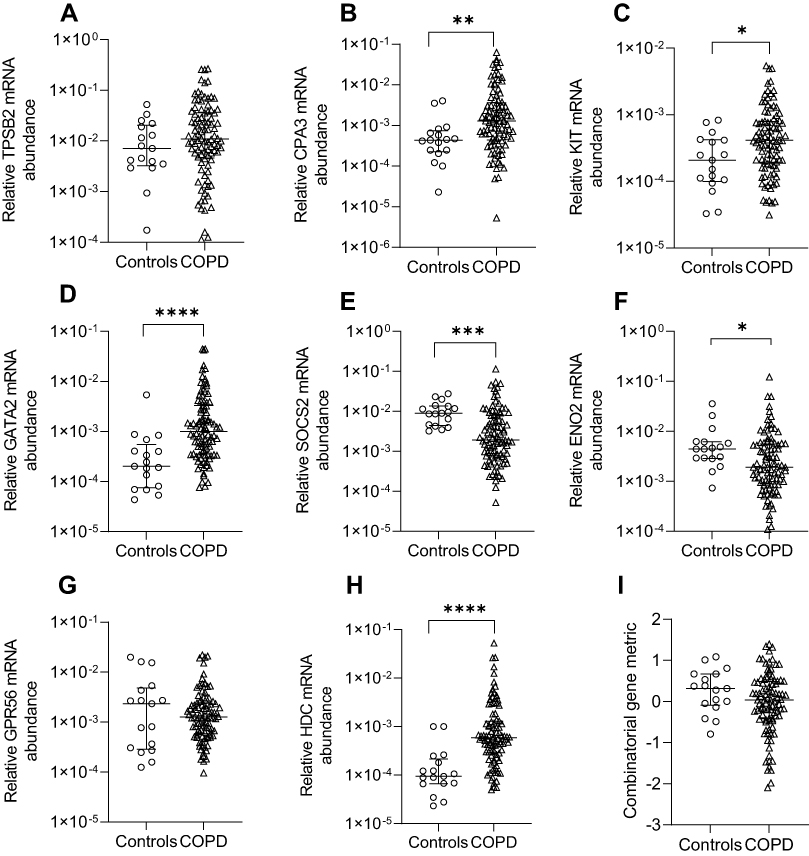 |
Figure 1 Relative mRNA abundance of (A) TPSB2, (B) CPA3, (C) KIT, (D) GATA2, (E) SOCS2, (F) ENO2, (G) GPR56, (H) HDC, and (I) combinatorial MC/basophil gene metric in COPD participants compared to control participants. Bars represent median, with error bars representing Q1, Q3. Relative mRNA abundance compared between groups are expressed as 2−ΔCt relative to the housekeeping gene β-actin. Combinatorial gene metric based on ΔCt gene expression values. *p≤0.05, **p≤0.01, ***p≤0.001, ****p≤0.0001. |
MC/Basophil mRNA Abundance Correlated in COPD
Spearman correlational analysis determined significantly positively correlated MC/basophil mRNA abundance between all genes in COPD sputum (Figure 2). Notable results include a strong positive correlation between TPSB2 and CPA3 (r=0.74, p<0.001), and moderate positive correlations between GATA2 and KIT (r=0.55, p<0.001), GATA2 and HDC (r=0.63, p<0.001) and HDC and KIT (r=0.69, p<0.001).
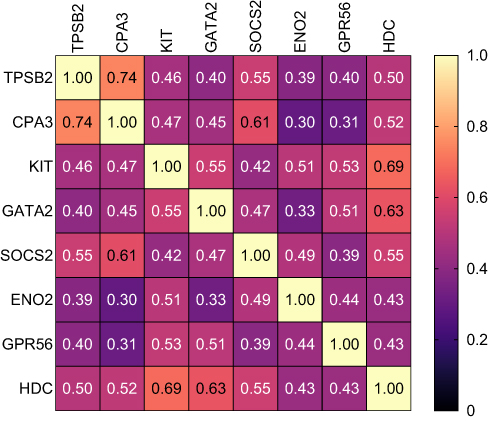 |
Figure 2 Correlational analysis heat map represents the correlations between MC/basophil-related gene mRNA abundance in COPD participants. Relative mRNA abundance 2−ΔCt values based on the housekeeping gene β-actin used in correlation analysis. Spearman correlation r-values reported. All correlations were significant. |
Clinical Characteristics of Eosinophilic-COPD and Non-Eosinophilic COPD
E-COPD and NE-COPD were categorized using sputum differential cell count. Clinical characteristics of E-COPD and NE-COPD groups (Table 2) were not significantly different. Sputum neutrophil proportion was higher in NE-COPD vs E-COPD. Sputum eosinophil proportion and PBE count were higher in E-COPD vs NE-COPD.
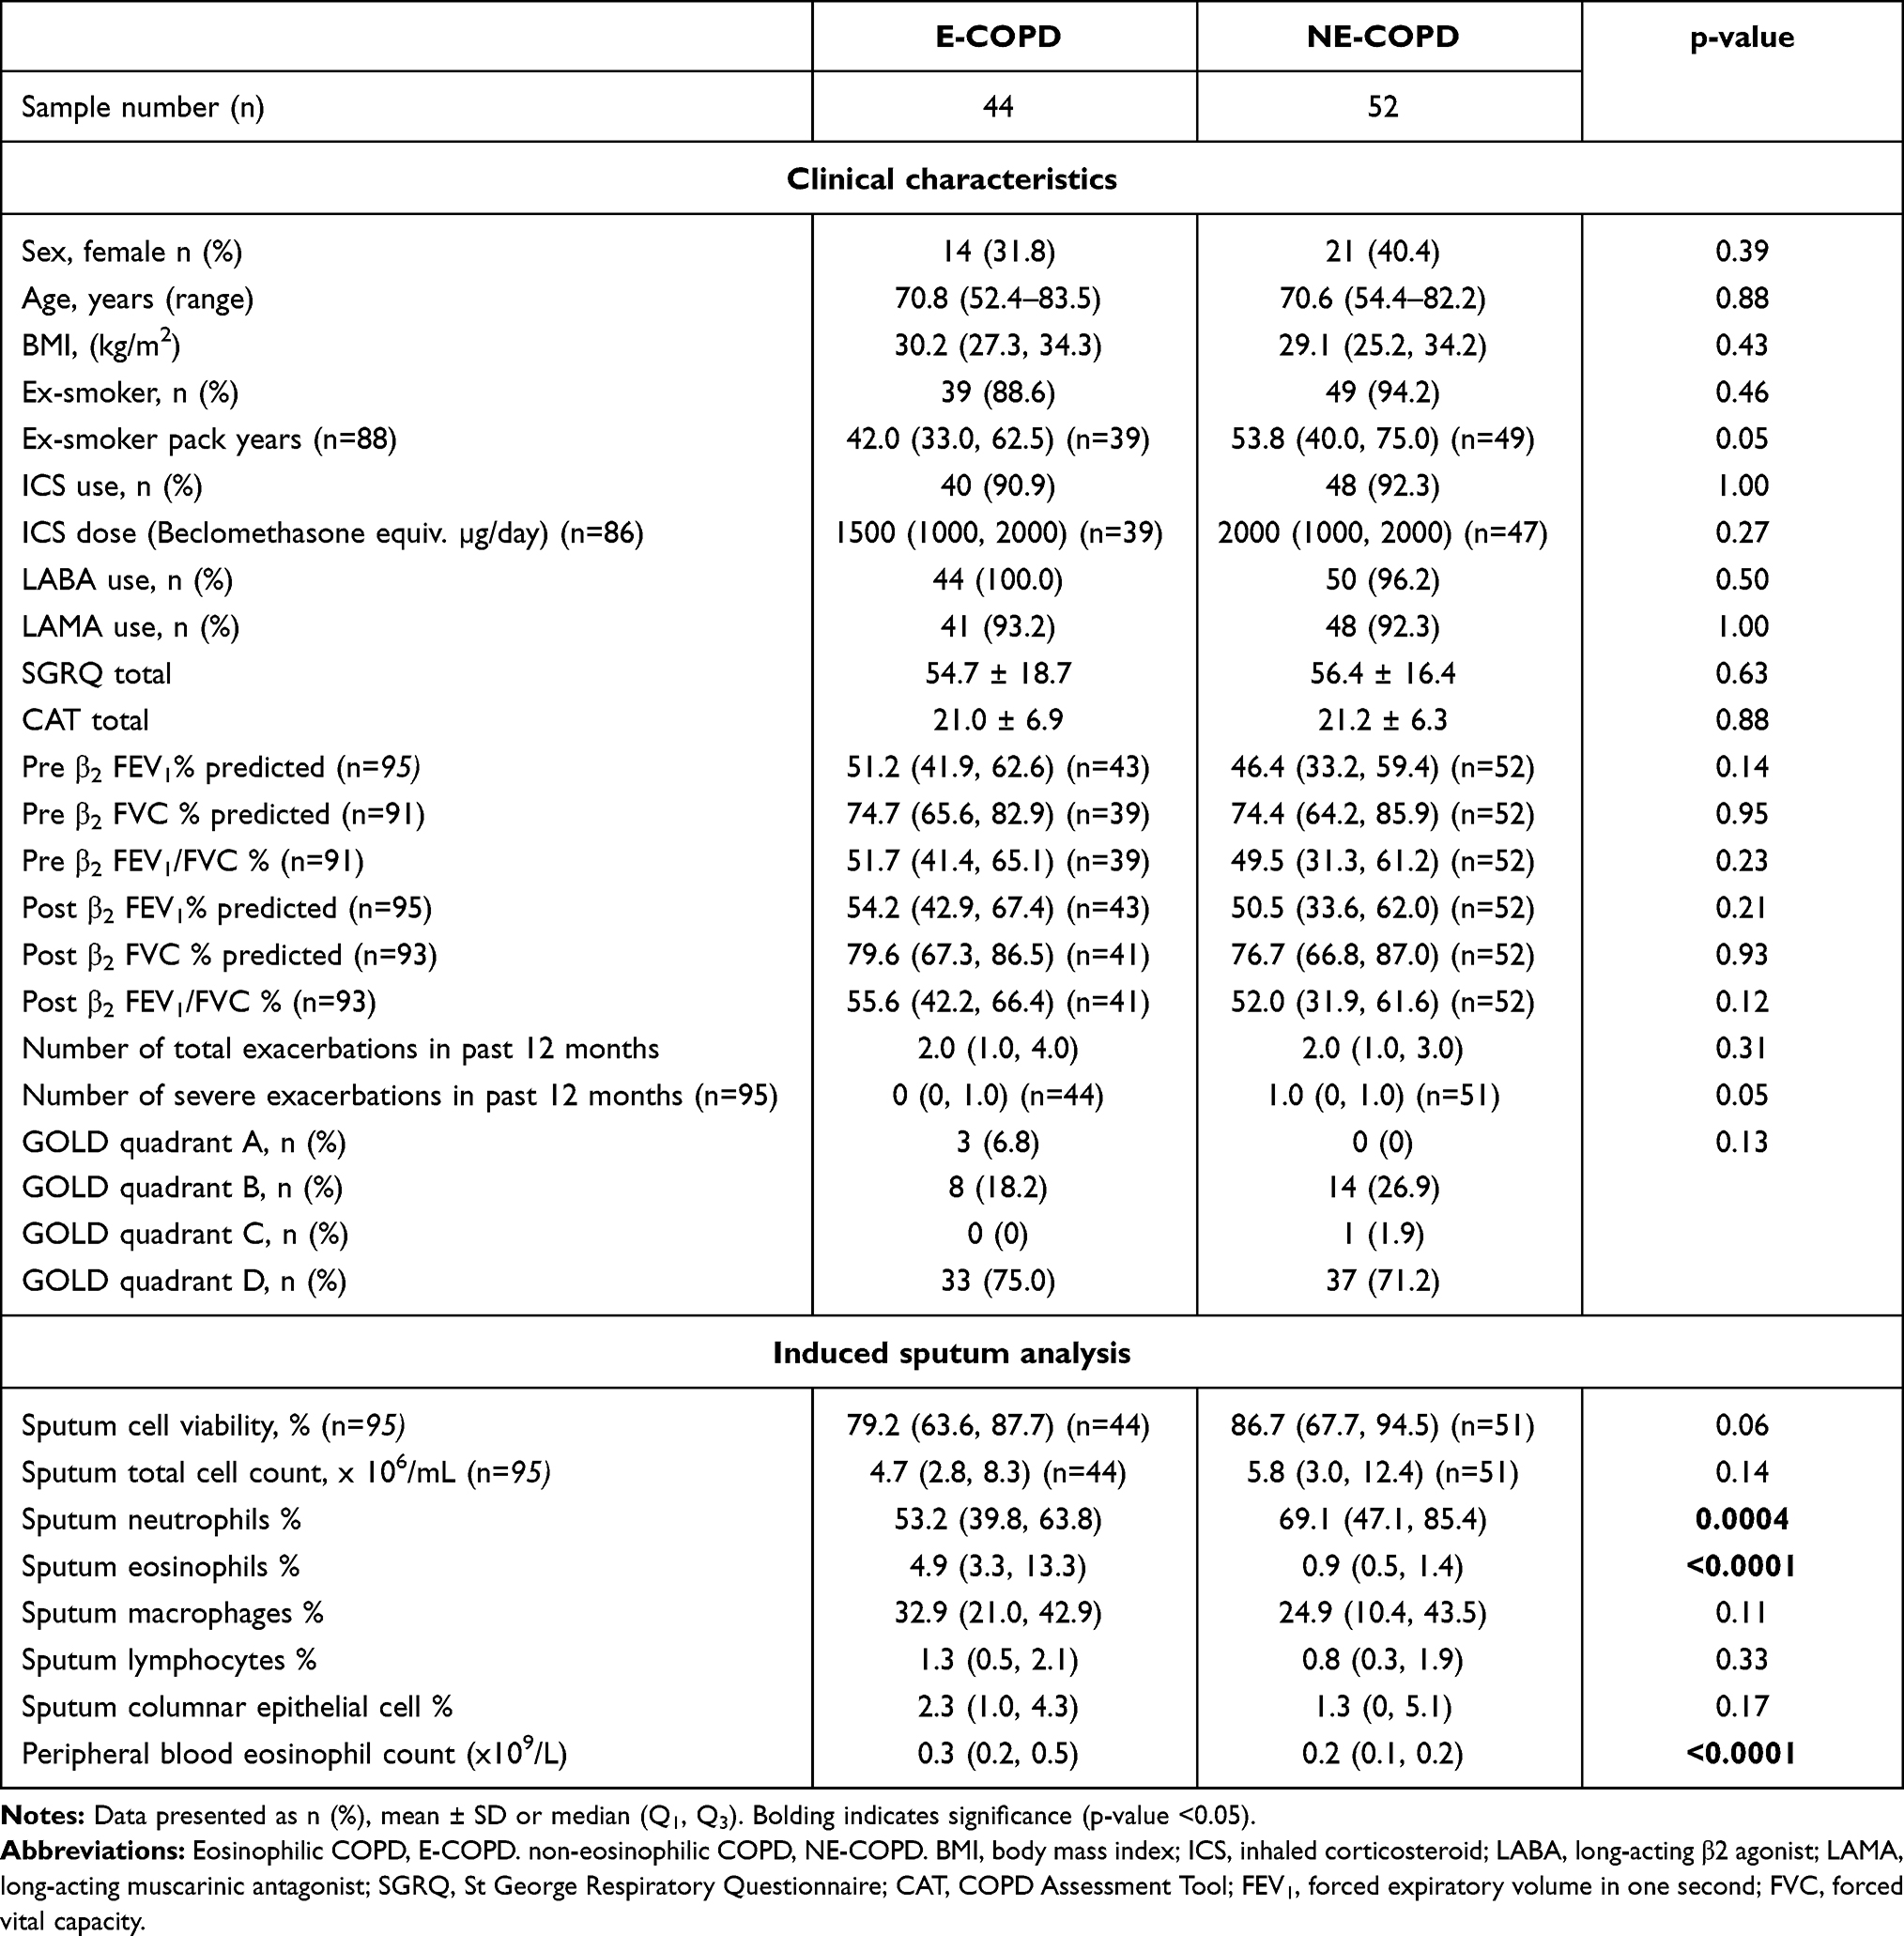 |
Table 2 Clinical Characteristics of Eosinophilic COPD and Non-Eosinophilic COPD |
MC/Basophil mRNA Abundance is Increased in Eosinophilic COPD
We compared MC/basophil gene expression between E-COPD, NE-COPD and control participants (Figure 3). Relative mRNA abundance differed for TPSB2, CPA3, KIT, GATA2, SOCS2, ENO2 and HDC between COPD inflammatory phenotypes and controls. GATA2 and KIT were significantly elevated in COPD inflammatory phenotypes compared to controls, however, showed no significant differences between the phenotypes. TPSB2, CPA3 and HDC mRNA abundance were significantly higher in E-COPD compared to NE-COPD and control participants. SOCS2 mRNA abundance was significantly increased in E-COPD compared to NE-COPD. SOCS2 and ENO2 mRNA abundance were significantly higher in control participants compared to NE-COPD. The combinatorial MC/basophil gene metric incorporating the 8 signature genes was significantly higher in E-COPD (−0.3070) vs NE-COPD (0.2141) vs controls (0.3139) (p=0.0002). Additional analyses comparing relative mRNA abundance of the genes between the four COPD airway inflammatory phenotypes (N-COPD [n=34], E-COPD [n=31], MG-COPD [n=13] and PG-COPD [n=18]) vs control participants [n=17] (Appendix S2, Figure S1) showed similar results. GATA2 and HDC were significantly elevated in disease inflammatory phenotypes compared to controls however, showed no significant differences between the phenotypes. For TPSB2 and CPA3, relative mRNA abundance was significantly higher in E-COPD compared to N-COPD, PG-COPD, and control participants. The combinatorial gene metric was significantly higher in the E-COPD (−0.4259) compared to the N-COPD (0.2809) and control participants (0.3139) (p=0.0006).
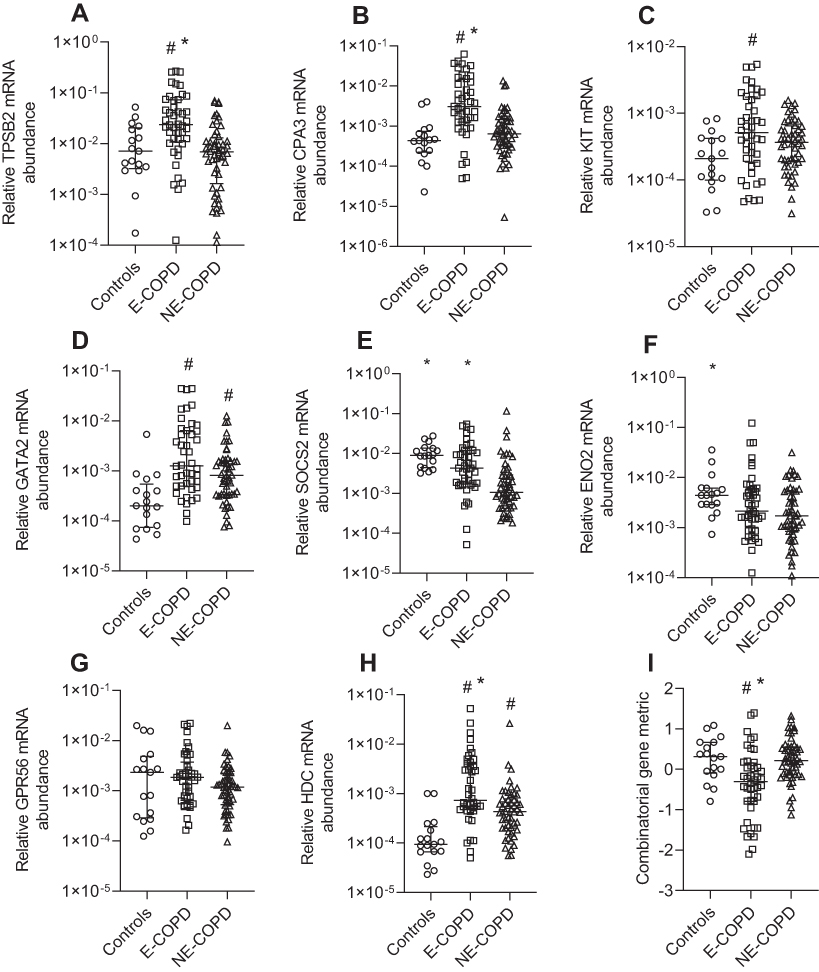 |
Figure 3 Relative mRNA abundance of (A) TPSB2, (B) CPA3, (C) KIT, (D) GATA2, (E) SOCS2, (F) ENO2, (G) GPR56, (H) HDC, and (I) combinatorial MC/basophil gene metric between Eosinophilic COPD (E-COPD), Non-eosinophilic COPD (NE-COPD) and control participants. Bars represent median, with error bars representing Q1, Q3. Relative mRNA abundance compared between groups are expressed as 2−ΔCt relative to the housekeeping gene β-actin. Combinatorial gene metric based on ΔCt gene expression values. #p<0.02 versus control participants; *p<0.02 versus NE-COPD participants. |
MC/Basophil Gene Expression Predicts Airway Eosinophilic Airway Inflammation in COPD
Univariate logistic regression with ROC curve analysis was used to analyze the association of MC/basophil gene expression with eosinophilic vs non-eosinophilic airway inflammation (Table 3). All odds ratios produced were below 1, indicating increased gene ΔCt values (equating to decreased relative mRNA abundance) were associated with decreased odds of being categorized as eosinophilic. All genes (except KIT and ENO2) were significantly associated with eosinophilic inflammation. Univariate and multivariate LASSO regression determined CPA3 had the highest AUC of 0.78, suggesting it is the most important gene in predicting eosinophilic inflammation with good predictive accuracy. The combinatorial gene metric was also associated with eosinophilic inflammation (AUC=0.73, p<0.0001).
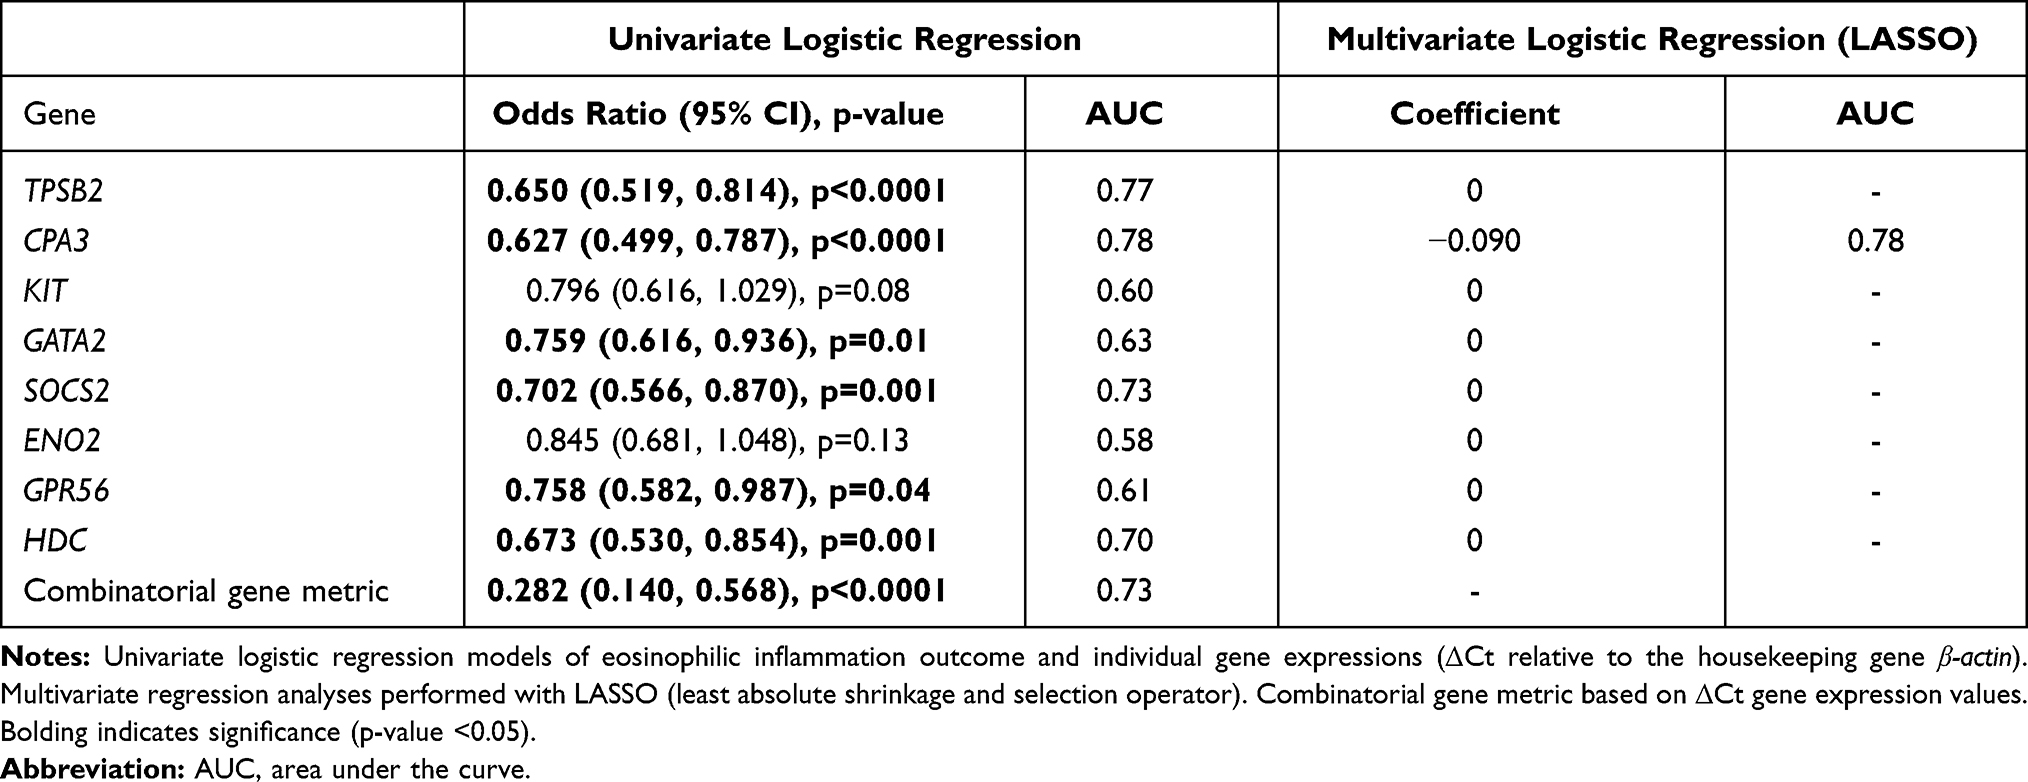 |
Table 3 Association Between Eosinophilic Inflammation Classification and MC/Basophil Gene Expression in COPD |
MC/Basophil mRNA Abundance is Increased in PBE-High COPD
We examined sputum MC/basophil gene abundance in relation to PBEs, using a clinically relevant cut-off (PBE high ≥300 cells/µL vs low <300 cells/µL). Clinical characteristics of PBE-high and low groups are shown in Table 4. For all genes, mRNA abundance was increased in PBE high (n=40) vs low (n=56) groups (Figure 4). The combinatorial gene metric was increased in PBE high (−0.3070) vs low (0.2004, p<0.0001).
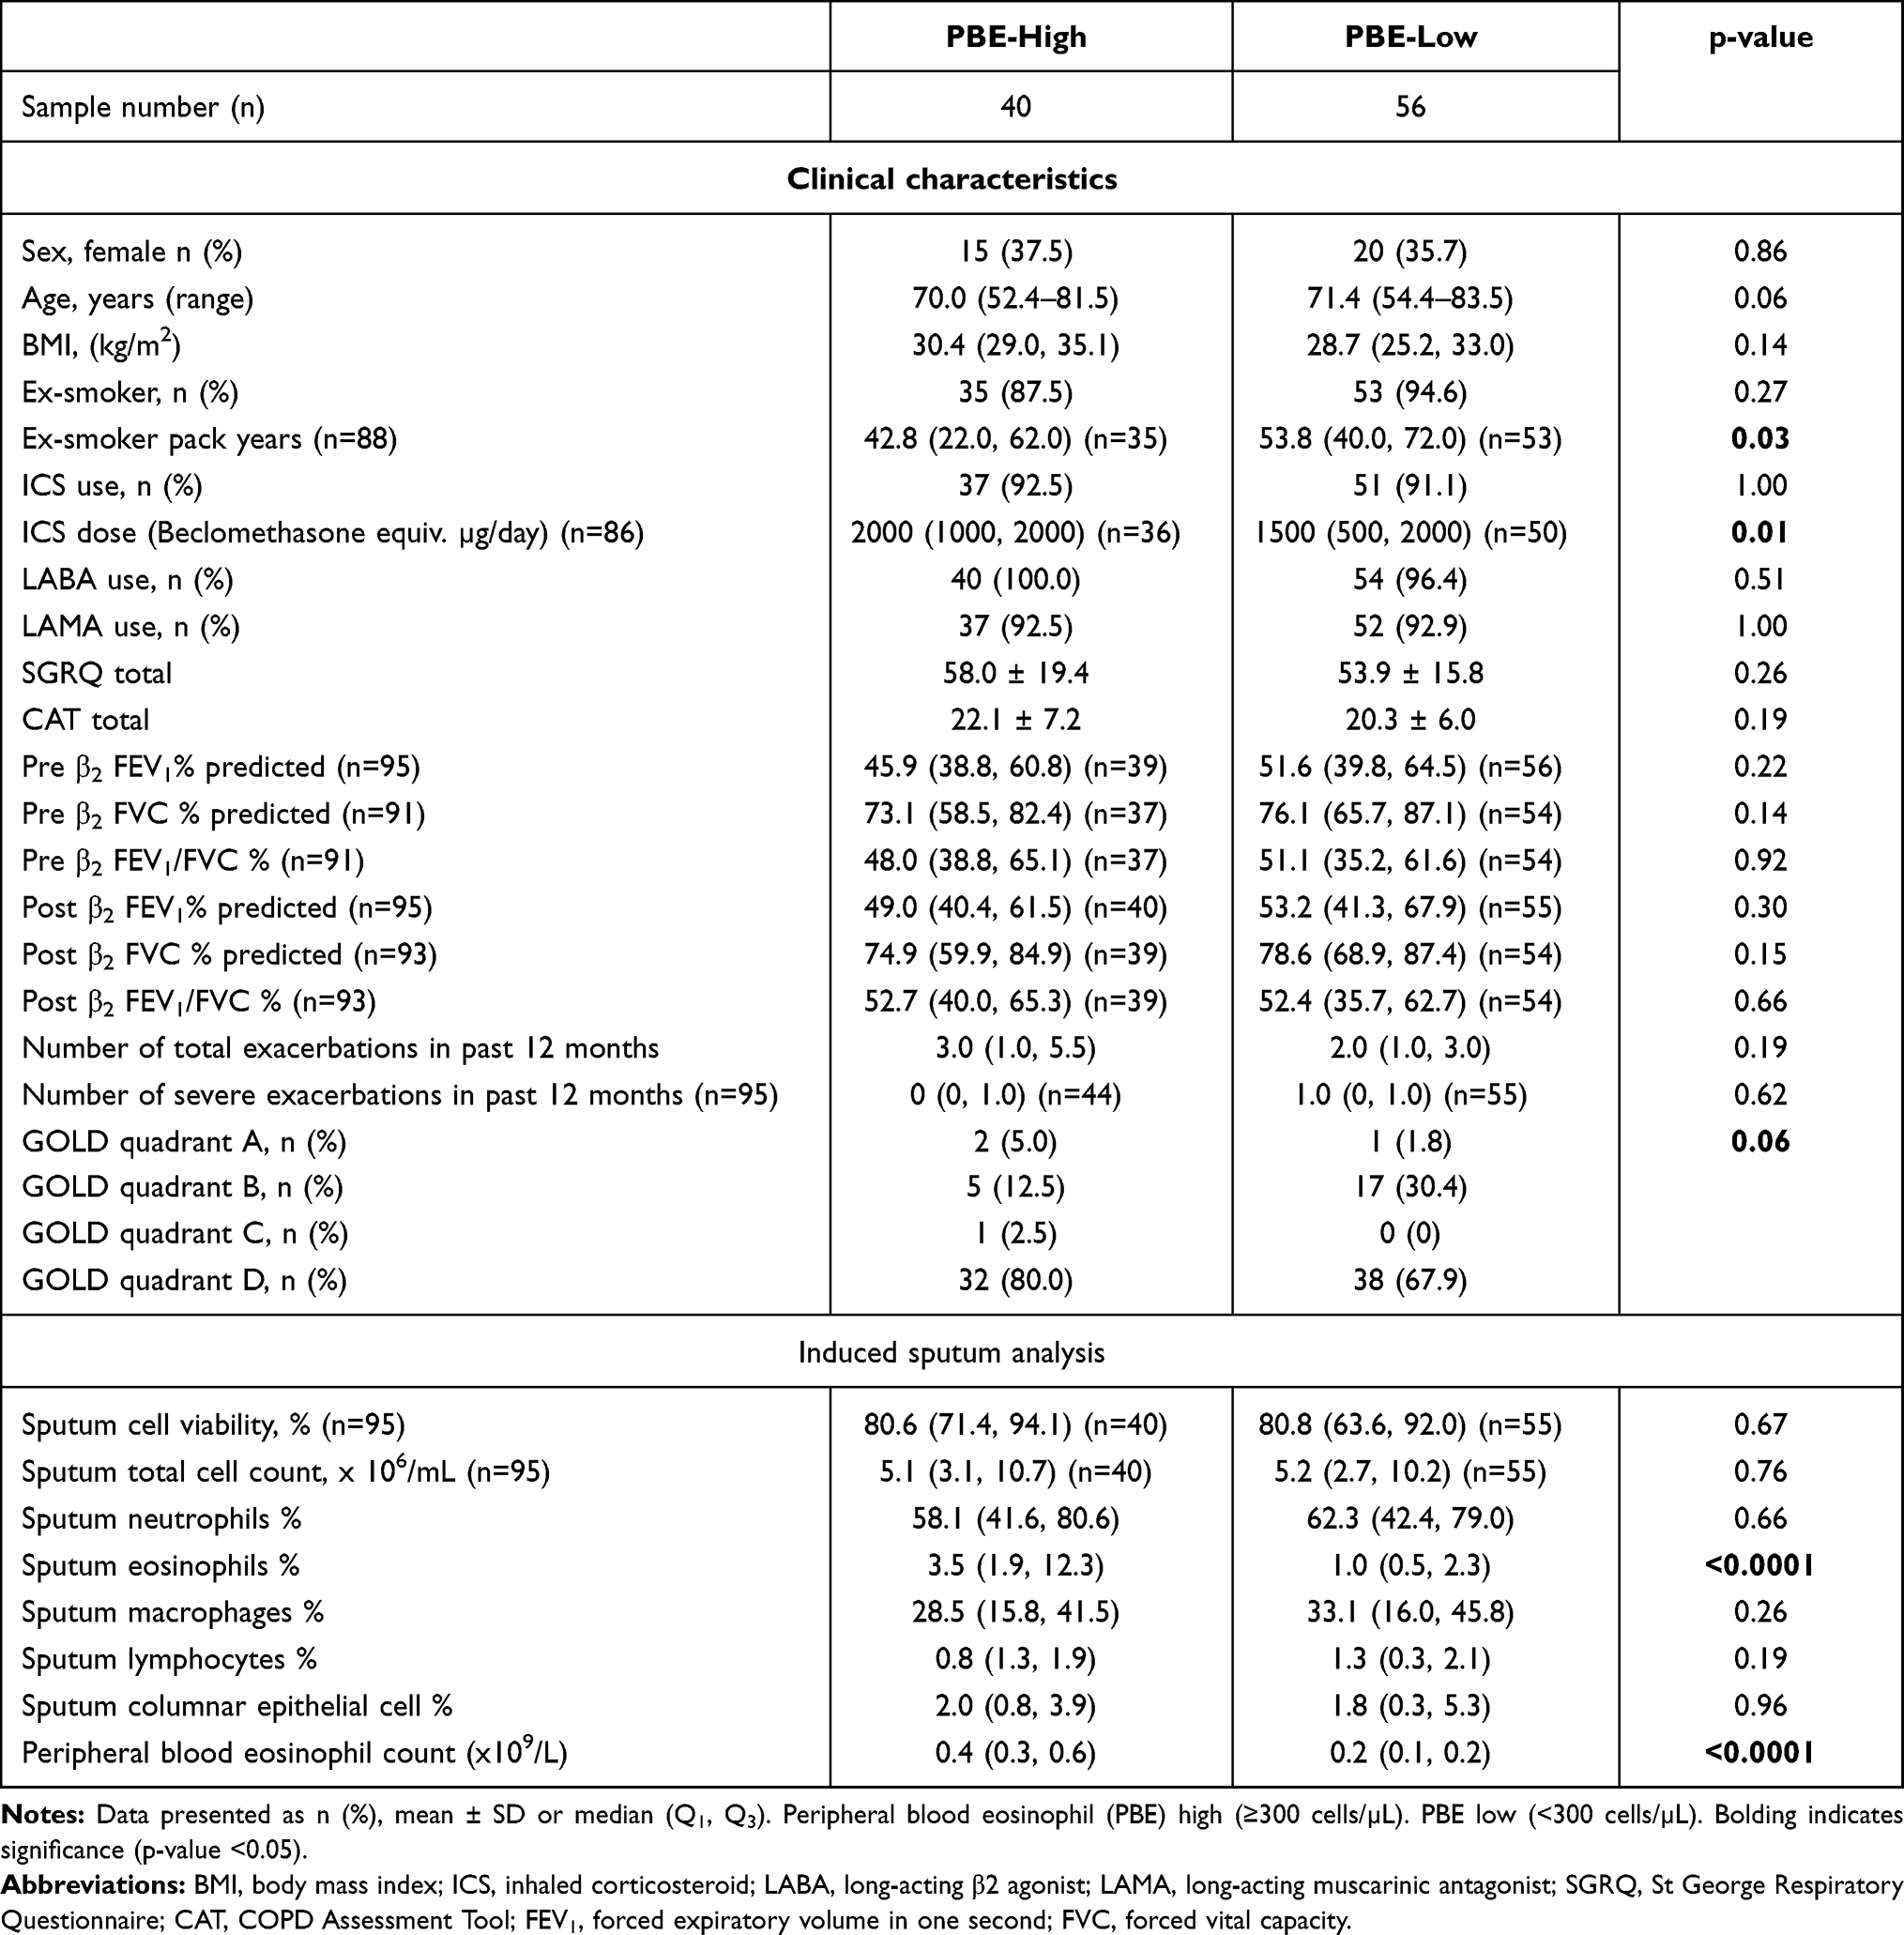 |
Table 4 Clinical Characteristics of PBE-High and PBE-Low COPD |
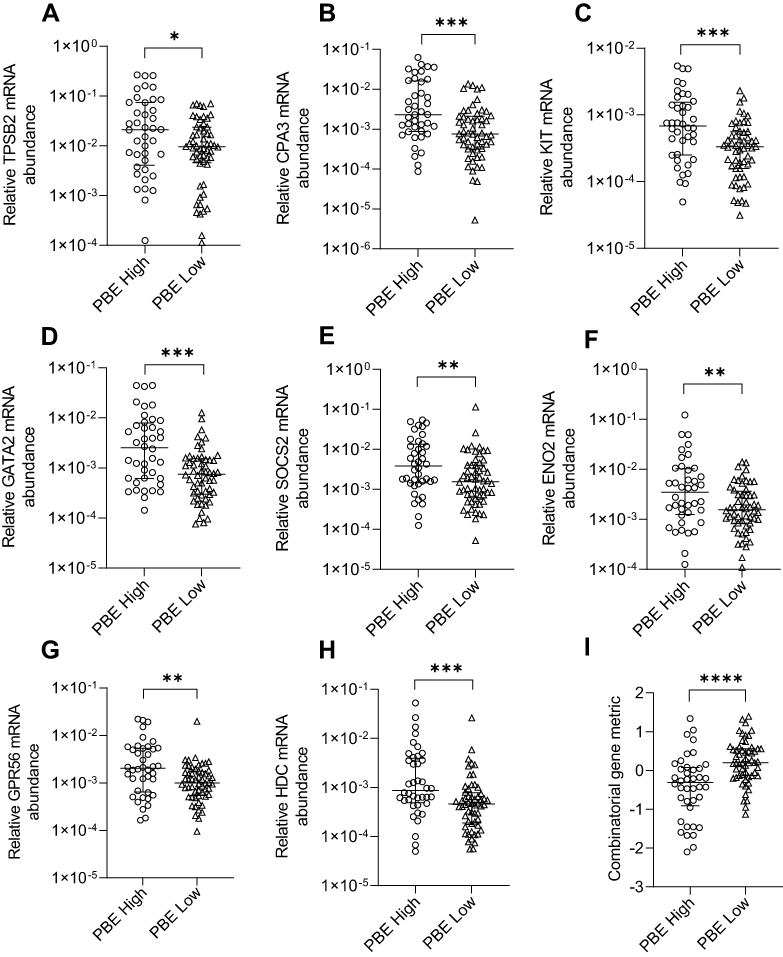 |
Figure 4 Relative mRNA abundance of (A) TPSB2, (B) CPA3, (C) KIT, (D) GATA2, (E) SOCS2, (F) ENO2, (G) GPR56, (H) HDC, and (I) combinatorial gene metric in COPD participants categorized as PBE high or PBE low. Bars represent median, with error bars representing Q1, Q3. Relative mRNA abundance compared between groups are expressed as 2−ΔCt relative to the housekeeping gene β-actin. Combinatorial gene metric based on ΔCt gene expression values. PBE high (≥300 cells/µL) (n=40) and PBE low (<300 cells/µL) (n=56). *p≤0.05, **p≤0.01, ***p≤0.001, ****p≤0.0001. |
MC/Basophil mRNA Abundance is Associated with Lung Function
KIT, GATA2, GPR56, and HDC were negatively correlated with pre-β2 FEV1% predicted values, whilst GATA2 was negatively correlated with pre-β2 FEV1/FVC%, indicating higher relative mRNA abundance was correlated with lower lung function (Table 5). The combined gene metric was positively correlated with pre-β2 FEV1% predicted values, indicating a lower ΔCt value (indicating higher relative mRNA abundance) was correlated with lower lung function (Table 5). Similar correlations for KIT, GATA2, GPR56 and HDC were observed with post-β2 FEV1% predicted (data not shown). Increased GATA2 mRNA abundance was negatively correlated with BMI (r= −0.225, p=0.03). TPSB2 (r= −0.228, p=0.03) was negatively correlated with health status (CAT total score), indicating lower relative mRNA abundance was correlated with worse health status. MC/basophil mRNA abundance did not differ between COPD participants who experienced frequent (≥2) and infrequent (0–1) exacerbations, for total and severe exacerbations (Figure 5). The exception was GPR56, which was significantly increased in the group with infrequent severe exacerbations. The combinatorial gene metric was not significantly different for total or severe exacerbations.
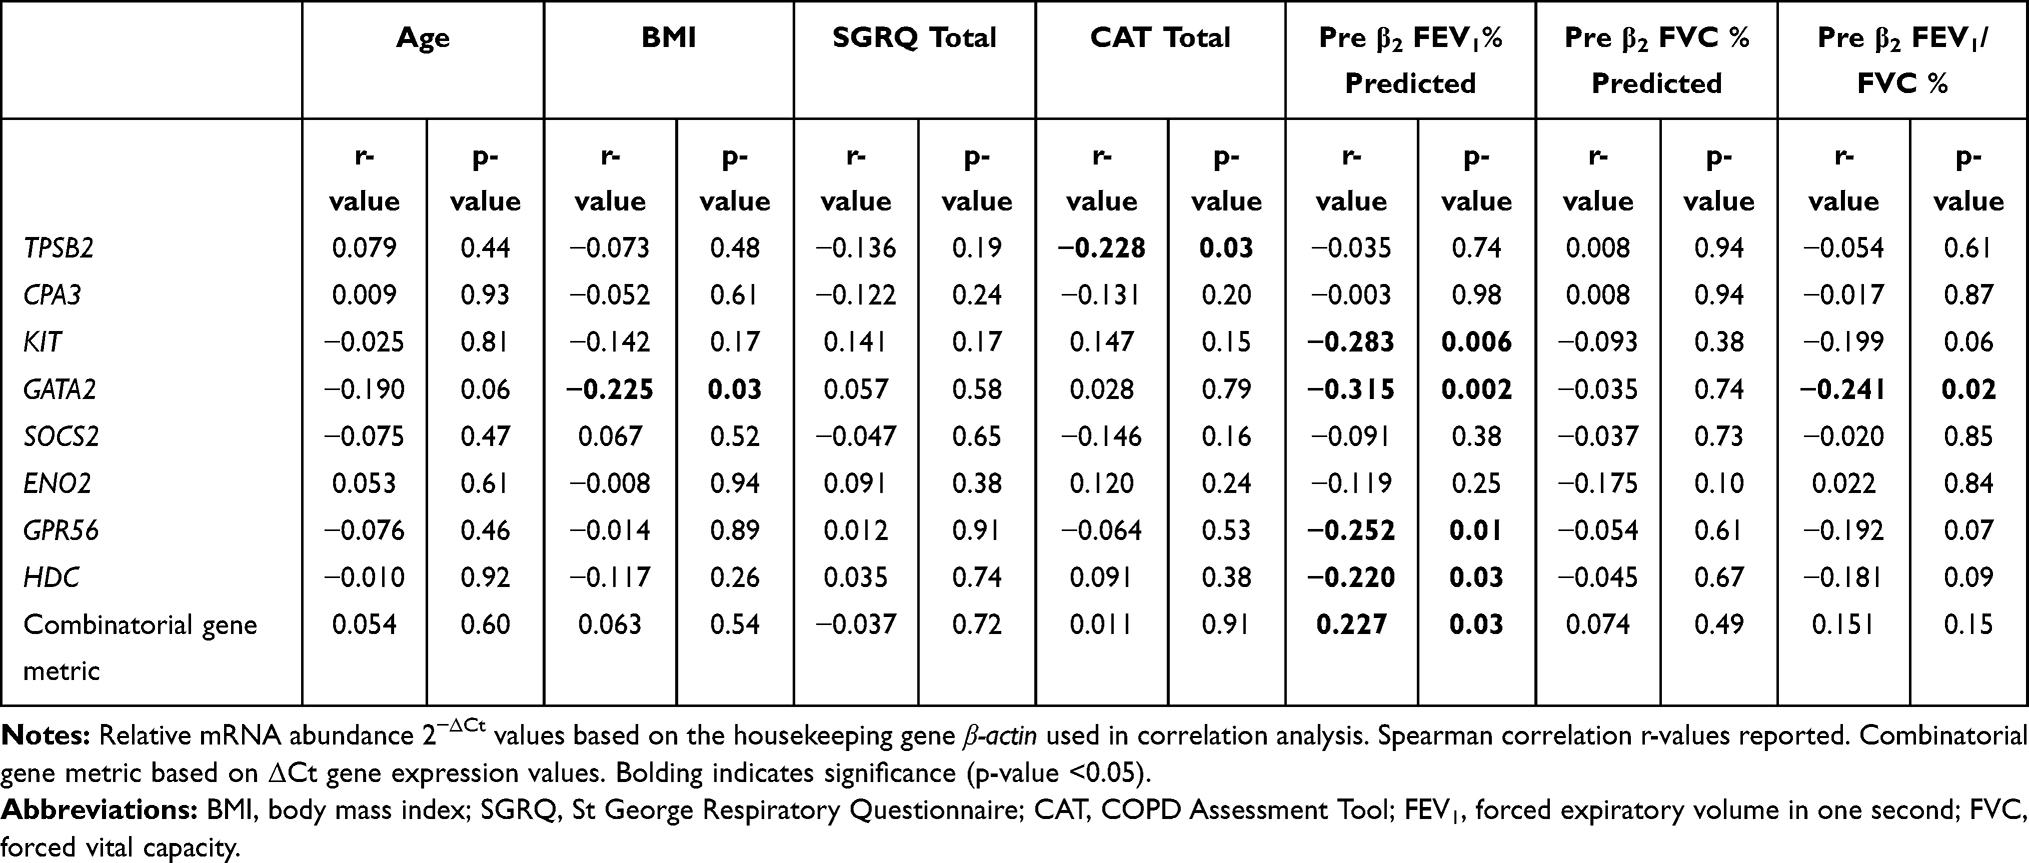 |
Table 5 Associations Between MC/Basophil mRNA Abundance and Clinical Characteristics in COPD |
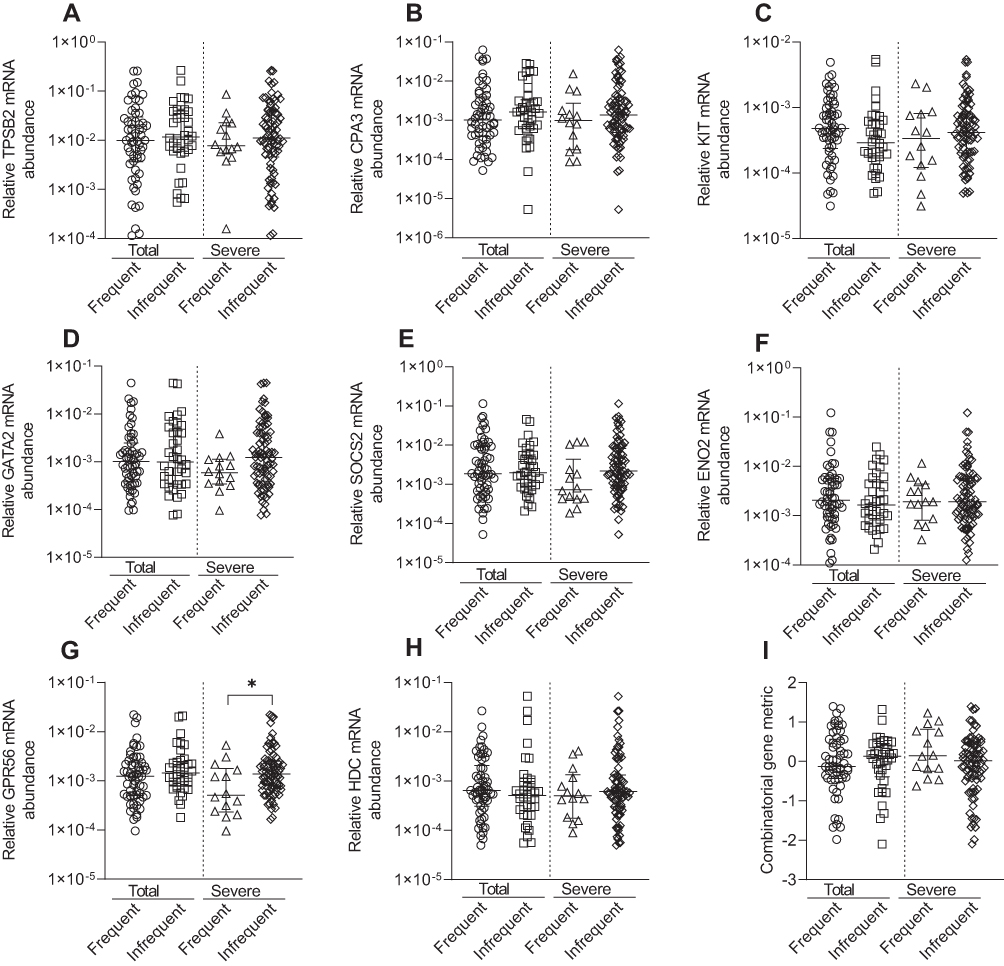 |
Figure 5 Relative mRNA abundance of (A) TPSB2, (B) CPA3, (C) KIT, (D) GATA2, (E) SOCS2, (F) ENO2, (G) GPR56, (H) HDC, and (I) combinatorial gene metric in COPD participants classified by frequent (>2) and infrequent (0–1) exacerbator status for total (frequent [n=58] and infrequent [n=38]) or severe (frequent [n=14] and infrequent [n=81]) exacerbations. Bars represent median, with error bars representing Q1, Q3. Relative mRNA abundance compared between groups are expressed as 2−ΔCt relative to the housekeeping gene β-actin. Combinatorial gene metric based on ΔCt gene expression values. *p≤0.05. |
Discussion
MCs and basophils have functionally diverse pathophysiological roles impacting on airway inflammation and remodeling. Their direct measurement in sputum is difficult due to their scarcity; hence, their inflammatory and clinical associations in COPD remain poorly understood. We measured a previously validated sputum MC/basophil gene signature in people with COPD and a control cohort and identified several MC/basophil-related genes increased in mRNA abundance in COPD participants. Correlation analysis revealed genes were all interrelated in COPD sputum. Increased MC/basophil gene expression was associated with airway and peripheral eosinophilic inflammation and decreased lung function in COPD. These novel findings demonstrate a dysregulation of MCs and basophils in E-COPD through measures of sputum MC/basophil gene expression.
Given their key roles in many airway pathological and inflammatory processes32–34 and their ability to activate via IgE-independent activation pathways,13,35 MCs and basophils may contribute to COPD pathogenesis. Our findings demonstrate dysregulation of sputum MCs and basophils in the airway lumen in COPD, and that sputum MCs and basophils are associated with both airway and peripheral eosinophilic inflammation in COPD. These findings are comparable to previous findings in severe asthma,14–17,36 demonstrating a common inflammatory mechanism involving MCs and basophils associated with eosinophilia in COPD and severe asthma. Notably, TPSB2, CPA3, HDC and the combinatorial gene metric were increased in E-COPD compared to NE-COPD. A recent study identifying SOCS2 and HDC as differentially expressed in E-COPD vs NE-COPD in sputum microarray analysis supports the positive association between MC/basophil genes and eosinophilic inflammation in COPD.37 This study also reported increased IL9R in E-COPD compared to non-eosinophilic COPD. IL9 promotes MC growth and differentiation, and this further supports the role of MCs and basophils in T2 inflammation in COPD.37 mRNA abundance of all MC/basophil genes was correlated in COPD sputum, supporting a common MC/basophil origin, with qPCR measures of MC/basophil-related genes reflecting MC and basophil abundance in sputum. There were no significant clinical differences between E-COPD and NE-COPD and therefore the differences in MC/basophil gene expression between the groups demonstrate the importance of molecular biomarkers such as these to distinguish between COPD inflammatory phenotypes. Previous asthma studies have shown networks of CPA3, HDC and GATA216 and TPSAB1 and CPA3,38 were related to T2 cytokine genes (IL-4, IL-5, IL-13) and future studies should address the potential role of MCs/basophils in promoting T2 inflammation in COPD. The latter study also demonstrated that IgE-independent epithelial IL-33 MC activation was related to T2 inflammation demonstrating potential importance of allergic and non-allergic MC-mediated mechanisms.38 We observed increased expression of all MC/basophil genes in PBE-high COPD. PBEs are promoted by IL-5 and IL-5 is expressed by MCs and basophils, further demonstrating a link between airway MC/basophils and a T2-high phenotype in COPD.39–41 CPA3 was found to be the best predictor of sputum eosinophilic inflammation in COPD. Therefore, the clinical measurement of MC/basophil signature genes in sputum is useful as a relatively non-invasive tool in predicting sputum inflammatory phenotypes in COPD. Surprisingly, SOCS2 and ENO2 expression were significantly increased in non-COPD controls compared to COPD participants. This may represent a mechanism of inflammatory dysregulation in COPD, as SOCS2 plays a role as a feedback inhibitor of IL1β and TLR signalling, particularly in dendritic cells42 and are also upregulated during dendritic cell maturation.43 Neither gene significantly correlated with age in COPD or non-COPD participants; thus, the lower age of the non-COPD controls likely does not fully account for this result.
KIT, GATA2, GPR56 and HDC were associated with decreased lung function. GATA2, KIT and HDC showed relatively high intercorrelation in COPD. GATA2, important in MC/basophil differentiation,44 promotes KIT45 and HDC46 expression, both important in MC/basophil development, proliferation and survival and acute inflammation.46,47 A previous study has reported FEV1% predicted values were decreased in eosinophilic COPD patients compared to non-eosinophilic COPD.8 As these genes were significantly increased in E-COPD, this may reflect the decreased lung function seen in E-COPD. Of note, TPSB2 and CPA3 whilst also increased in E-COPD and highly intercorrelated, were not associated with decreased lung function. Similarly, previous research has shown that CPA3 is not related to lung function in COPD.48 Airway MC expression of MC-related factors may be modulated in different inflammatory and clinical contexts in asthma,49,50 thus it may be that a particular MC/basophil phenotype associated with increased expression of GATA2, KIT and HDC is related to lower lung function in COPD, or that other factors that contribute to increased expression of these genes are also associated with lower lung function. GPR56 is a proposed basophil-specific gene.22 Its increased expression was related to poorer lung function and suggests a role of basophils in COPD. In contrast, GPR56 was the only MC/basophil gene differentially expressed between exacerbation phenotypes and was higher in participants with reduced severe exacerbation history. Previous findings have shown that basophil-derived IL-4, drives macrophage-produced MMP-12 and contributes to emphysema in COPD mouse models.34 Recent findings suggest a more complex scenario with a proposed immunomodulatory role for basophils in the airways.51 Lack of altered expression of other MC/basophil genes between exacerbation phenotypes suggests that MC/basophil presence in the airway lumen may not be an important predictor of exacerbation risk in COPD.
Our study has limitations. The cross-sectional study design does not provide an understanding of gene expression over time nor its longitudinal relationship to inflammatory measures. Replication of our findings in an independent cohort would be desirable in future studies. Retrospective data collection of exacerbations was based on patient recall over the past year. Atopic status and FeNO levels were not collected, and future work may provide further insight into the relationship of MCs and basophils to allergic COPD. Current smokers were excluded from our study, and validation of these findings in current smokers is important for future studies. The difference in age range between the control and COPD populations was large, with an older median age in COPD participants. We do not know the influence of age on MC/basophil gene expression. However, we found no correlation between MC/basophil mRNA abundance and age in COPD participants, nor did age differ significantly between E-COPD and NE-COPD.
Conclusions
In conclusion, we applied a sputum qPCR-based MC/basophil gene signature validated in asthma, to a COPD cohort compared to controls and demonstrated that sputum MCs and basophils were dysregulated in COPD, with several genes increased in COPD participants. We also found that MC/basophil gene expression was associated with airway and peripheral eosinophilic inflammation and poorer lung function in COPD. The clinical measurement of MC/basophil signature genes in sputum is useful as a relatively non-invasive tool for endotyping E-COPD, with clinical associations with decreased lung function.
Abbreviations
AUC, area under the curve; BMI, body mass index; CAT, COPD Assessment Test; CPA3, carboxypeptidase A3; COPD, chronic obstructive pulmonary disease; E-COPD, eosinophilic COPD; ENO2, enolase 2; FER, forced expiratory ratio; FEV1%, forced expiratory volume in one second; FVC%, forced vital capacity; GATA2, GATA-binding protein 2; GPR56, G protein-coupled receptor 56; HDC, histidine decarboxylase; ICS, inhaled corticosteroid; LABA, long-acting beta agonist; LAMA, long-acting muscarinic antagonist; LASSO, least absolute shrinkage and selection operator; KIT, KIT proto-oncogene receptor tyrosine kinase; NE-COPD, non-eosinophilic COPD; MC, mast cell; mRNA, messenger RNA; PBE, peripheral blood eosinophils; PCR, polymerase chain reaction; SGRQ, St George Respiratory Questionnaire; SOCS2, suppressor of cytokine signaling 2; TPSAB1/TPSB2, tryptase alpha/beta 1/tryptase beta 2.
Acknowledgments
We acknowledge laboratory technical assistance from Heather MacDonald, Lakshitha Gunawardhana, Bridgette Donati, Kellie Fakes, Naomi Fibbens, Michelle Gleeson, the clinical assistance from Gabrielle LeBrocq, Amber Smith, Kelly Steel, Paola Urroz, Catherine Delahunty, Penelope Chan, Michelle Rostas, data management support from Vanessa Clark, statistical analysis assistance of Jack Faulkner and the study participants.
Author Contributions
Study conception: P.G, V.M and M.F. Study design and execution: all authors. Acquisition of data: all authors. Analysis and interpretation: all authors. Manuscript drafting: N.W and M.F. Critical review of manuscript: P.G, V.M and M.F. Revisions of article: all authors. All authors approved submission of each version of the article for publication at IJCOPD, and agree to take responsibility and be accountable for the contents of the article.
Funding
This work was supported by the National Health and Medical Research Council, The Lung Foundation of Australia and The Ramaciotti Foundation. M.F. was funded by a Thoracic Society of Australia and New Zealand/AstraZeneca Respiratory Research Fellowship. Sponsors had no role in study design, analysis or interpretation of results or preparation of manuscript.
Disclosure
Natasha Winter does not have any competing interests to declare.
Peter Gibson reports personal speaker’s fees from AstraZeneca, GlaxoSmithKline and Novartis, and grants from AstraZeneca, GlaxoSmithKline, outside this work.
Vanessa McDonald reports research funding/grants from AstraZeneca, Cyclopharm, GSK, Lung Foundation Australia, NHMRC, and Ramaciotti Foundation, during the conduct of the study; speaker’s honoraria from AstraZeneca and GSK; personal fees from GSK; and provided consultancy for AstraZeneca, GSK, and Menarini, outside this work.
Michael Fricker reports grants from NHMRC and research fellowship from Thoracic Society of Australia and New Zealand, during the conduct of the study.
The authors reported no other potential conflicts of interest for this work.
References
1. Lozano R, Naghavi M, Foreman K, et al. Global and regional mortality from 235 causes of death for 20 age groups in 1990 and 2010: a systematic analysis for the Global Burden of Disease Study 2010. Lancet. 2012;380(9859):2095–2128. doi:10.1016/S0140-6736(12)61728-0
2. Wedzicha JA, Brill SE, Allinson JP, Donaldson GC. Mechanisms and impact of the frequent exacerbator phenotype in chronic obstructive pulmonary disease. BMC Med. 2013;11:181. doi:10.1186/1741-7015-11-181
3. Barnes PJ. Inflammatory mechanisms in patients with chronic obstructive pulmonary disease. J Allergy Clin Immunol. 2016;138(1):16–27. doi:10.1016/j.jaci.2016.05.011
4. Negewo NA, McDonald VM, Baines KJ, et al. Peripheral blood eosinophils: a surrogate marker for airway eosinophilia in stable COPD. Int J Chron Obstruct Pulmon Dis. 2016;11:1495–1504. doi:10.2147/COPD.S100338
5. Hiles SA, Gibson PG, McDonald VM. Disease burden of eosinophilic airway disease: comparing severe asthma, COPD and asthma–COPD overlap. Respirology. 2021;26:52–61.
6. Kim VL, Coombs NA, Staples KJ, et al. Impact and associations of eosinophilic inflammation in COPD: analysis of the AERIS cohort. Eur Respir J. 2017;50(4):1700853. doi:10.1183/13993003.00853-2017
7. Proboszcz M, Mycroft K, Paplinska-Goryca M, et al. Relationship between Blood and Induced Sputum Eosinophils, Bronchial Hyperresponsiveness and Reversibility of Airway Obstruction in Mild-to-Moderate Chronic Obstructive Pulmonary Disease. Copd. 2019;16(5–6):354–361. doi:10.1080/15412555.2019.1675150
8. Hastie AT, Martinez FJ, Curtis JL, et al. Association of sputum and blood eosinophil concentrations with clinical measures of COPD severity: an analysis of the SPIROMICS cohort. Lancet Respir Med. 2017;5(12):956–967. doi:10.1016/S2213-2600(17)30432-0
9. Vedel-Krogh S, Nielsen SF, Lange P, Vestbo J, Nordestgaard BG. Blood Eosinophils and Exacerbations in Chronic Obstructive Pulmonary Disease. The Copenhagen General Population Study. Am J Respir Crit Care Med. 2016;193(9):965–974. doi:10.1164/rccm.201509-1869OC
10. Ortega H, Llanos JP, Lafeuille MH, et al. Burden of disease associated with a COPD eosinophilic phenotype. Int J Chron Obstruct Pulmon Dis. 2018;13:2425–2433. doi:10.2147/COPD.S170995
11. Bradding P, Arthur G. Mast cells in asthma – state of the art. Clin Exp Allergy. 2016;46(2):194–263.
12. Karasuyama H, Miyake K, Yoshikawa S, Yamanishi Y. Multifaceted roles of basophils in health and disease. J Allergy Clin Immunol. 2018;142(2):370–380. doi:10.1016/j.jaci.2017.10.042
13. Komi DEA, Mortaz E, Amani S, Tiotiu A, Folkerts G, Adcock IM. The Role of Mast Cells in IgE-Independent Lung Diseases. Clin Rev Allergy Immunol. 2020;58(3):377–387. doi:10.1007/s12016-020-08779-5
14. Fricker M, Qin L, Niessen N, et al. Relationship of sputum mast cells with clinical and inflammatory characteristics of asthma. Clin Exp Allergy. 2020;50(6):696–707. doi:10.1111/cea.13609
15. Kuo CS, Pavlidis S, Loza M, et al. T-helper cell type 2 (Th2) and non-Th2 molecular phenotypes of asthma using sputum transcriptomics in U-BIOPRED. Eur Respir J. 2017;49(2):1602135. doi:10.1183/13993003.02135-2016
16. Peters MC, Ringel L, Dyjack N, et al. A Transcriptomic Method to Determine Airway Immune Dysfunction in T2-High and T2-Low Asthma. Am J Respir Crit Care Med. 2019;199(4):465–477. doi:10.1164/rccm.201807-1291OC
17. Winter NA, Qin L, Gibson PG, et al. Sputum mast cell/basophil gene expression relates to inflammatory and clinical features of severe asthma. J Allergy Clin Immunol. 2021. doi:10.1016/j.jaci.2021.01.033
18. Ekberg-Jansson A, Amin K, Bake B, et al. Bronchial mucosal mast cells in asymptomatic smokers relation to structure, lung function and emphysema. Respir Med. 2005;99(1):75–83. doi:10.1016/j.rmed.2004.05.013
19. Gosman MM, Postma DS, Vonk JM, et al. Association of mast cells with lung function in chronic obstructive pulmonary disease. Respir Res. 2008;9:64. doi:10.1186/1465-9921-9-64
20. Wen Y, Reid DW, Zhang D, Ward C, Wood-Baker R, Walters EH. Assessment of airway inflammation using sputum, BAL, and endobronchial biopsies in current and ex-smokers with established COPD. Int J Chron Obstruct Pulmon Dis. 2010;5:327–334.
21. Jogdand P, Mori M, Bergqvist A, Walls A, Sanden C, Erjefält J. Mapping of eosinophil and basophils in COPD lung tissues. Eur Respir J. 2015;46(suppl 59):PA384.
22. Dwyer DF, Barrett NA, Austen KF. The Immunological Genome Project C. Expression profiling of constitutive mast cells reveals a unique identity within the immune system. Nat Immunol. 2016;17:878–887. doi:10.1038/ni.3445
23. Vieira Braga FA, Kar G, Berg M, et al. A cellular census of human lungs identifies novel cell states in health and in asthma. Nat Med. 2019;25(7):1153–1163. doi:10.1038/s41591-019-0468-5
24. Jiang J, Faiz A, Berg M, et al. Gene signatures from scRNA-seq accurately quantify mast cells in biopsies in asthma. Clin Exp Allergy. 2020;50:1428–1431. doi:10.1111/cea.13732
25. McDonald VM, Clark VL, Cordova-Rivera L, Wark PAB, Baines KJ, Gibson PG. Targeting treatable traits in severe asthma: a randomised controlled trial. Eur Respir J. 2020;55(3):1901509. doi:10.1183/13993003.01509-2019
26. Gibson PG, Wlodarczyk JW, Hensley MJ, et al. Epidemiological Association of Airway Inflammation with Asthma Symptoms and Airway Hyperresponsiveness in Childhood. Am J of Respir Crit Care Med. 1998;158(1):36–41. doi:10.1164/ajrccm.158.1.9705031
27. Simpson JL, Scott R, Boyle MJ, Gibson PG. Inflammatory subtypes in asthma: assessment and identification using induced sputum. Respirology. 2006;11(1):54–61. doi:10.1111/j.1440-1843.2006.00784.x
28. Baines KJ, Simpson JL, Wood LG, Scott RJ, Gibson PG. Transcriptional phenotypes of asthma defined by gene expression profiling of induced sputum samples. J Allergy Clin Immunol. 2011;127(1):
29. Baines KJ, Simpson JL, Wood LG, et al. Sputum gene expression signature of 6 biomarkers discriminates asthma inflammatory phenotypes. J Allergy Clin Immunol. 2014;133(4):997–1007. doi:10.1016/j.jaci.2013.12.1091
30. Berthon BS, Gibson PG, Wood LG, MacDonald-Wicks LK, Baines KJ. A sputum gene expression signature predicts oral corticosteroid response in asthma. Eur Respir J. 2017;49(6):1700180. doi:10.1183/13993003.00180-2017
31. Peters MC, Mekonnen ZK, Yuan S, Bhakta NR, Woodruff PG, Fahy JV. Measures of gene expression in sputum cells can identify TH2-high and TH2-low subtypes of asthma. J Allergy Clin Immunol. 2014;133(2):388–394. doi:10.1016/j.jaci.2013.07.036
32. Krystel-Whittemore M, Dileepan KN, Wood JG. Mast Cell: a Multi-Functional Master Cell. Front Immunol. 2016;6:620. doi:10.3389/fimmu.2015.00620
33. Falkencrone S, Poulsen LK, Bindslev-Jensen C, et al. IgE-mediated basophil tumour necrosis factor alpha induces matrix metalloproteinase-9 from monocytes. Allergy. 2013;68(5):614–620. doi:10.1111/all.12143
34. Shibata S, Miyake K, Tateishi T, et al. Basophils trigger emphysema development in a murine model of COPD through IL-4–mediated generation of MMP-12–producing macrophages. Proc Natl Acad Sci U S A. 2018;115(51):13057–13062. doi:10.1073/pnas.1813927115
35. Miyake K, Karasuyama H. Emerging roles of basophils in allergic inflammation. Allergol Int. 2017;66(3):382–391. doi:10.1016/j.alit.2017.04.007
36. Wang G, Baines KJ, Fu JJ, et al. Sputum mast cell subtypes relate to eosinophilia and corticosteroid response in asthma. Eur Respir J. 2016;47(4):1123–1133. doi:10.1183/13993003.01098-2015
37. Singh D, Bassi M, Balzano D, et al. COPD patients with chronic bronchitis and higher sputum eosinophil counts show increased type-2 and PDE4 gene expression in sputum. J Cell Mol Med. 2021;25(2):905–918. doi:10.1111/jcmm.16146
38. Altman MC, Lai Y, Nolin JD, et al. Airway epithelium–shifted mast cell infiltration regulates asthmatic inflammation via IL-33 signaling. J Clin Invest. 2020;129(11):4979–4991. doi:10.1172/JCI126402
39. Roufosse F. Targeting the Interleukin-5 Pathway for Treatment of Eosinophilic Conditions Other than Asthma. Front Med. 2018;5:49. doi:10.3389/fmed.2018.00049
40. McLeod JJA, Baker B, Ryan JJ. Mast cell production and response to IL-4 and IL-13. Cytokine. 2015;75(1):57–61. doi:10.1016/j.cyto.2015.05.019
41. Borriello F, Longo M, Spinelli R, et al. IL-3 synergises with basophil-derived IL-4 and IL-13 to promote the alternative activation of human monocytes. Eur J Immunol. 2015;45(7):2042–2051. doi:10.1002/eji.201445303
42. Sarajlic M, Neuper T, Föhrenbach Quiroz KT, et al. IL-1β Induces SOCS2 Expression in Human Dendritic Cells. Int J Mol Sci. 2019;20:23. doi:10.3390/ijms20235931
43. Hu J, Winqvist O, Flores-Morales A, Wikström AC, Norstedt G. SOCS2 influences LPS induced human monocyte-derived dendritic cell maturation. PLoS One. 2009;4(9):e7178. doi:10.1371/journal.pone.0007178
44. Li Y, Qi X, Liu B, Huang H. The STAT5-GATA2 pathway is critical in basophil and mast cell differentiation and maintenance. J Immunol. 2015;194(9):4328–4338. doi:10.4049/jimmunol.1500018
45. Desai A, Sowerwine K, Liu Y, et al. GATA-2-deficient mast cells limit IgE-mediated immediate hypersensitivity reactions in human subjects. J Allergy Clin Immunol. 2019;144(2):613–617.e614. doi:10.1016/j.jaci.2019.05.007
46. Huang H, Li Y, Liang J, Finkelman FD. Molecular Regulation of Histamine Synthesis. Front Immunol. 2018;9:1392. doi:10.3389/fimmu.2018.01392
47. Cahill KN, Katz HR, Cui J, et al. KIT Inhibition by Imatinib in Patients with Severe Refractory Asthma. N Engl J Med. 2017;376(20):1911–1920. doi:10.1056/NEJMoa1613125
48. Baines KJ, Negewo NA, Gibson PG, et al. A Sputum 6 Gene Expression Signature Predicts Inflammatory Phenotypes and Future Exacerbations of COPD. Int J Chron Obstruct Pulmon Dis. 2020;15:1577–1590. doi:10.2147/COPD.S245519
49. Dougherty RH, Sidhu SS, Raman K, et al. Accumulation of intraepithelial mast cells with a unique protease phenotype in T(H)2-high asthma. J Allergy Clin Immunol. 2010;125(5):1046–1053.e1048. doi:10.1016/j.jaci.2010.03.003
50. Balzar S, Fajt ML, Comhair SA, et al. Mast cell phenotype, location, and activation in severe asthma. Data from the Severe Asthma Research Program. Am J Respir Crit Care Med. 2011;183(3):299–309. doi:10.1164/rccm.201002-0295OC
51. Inclan-Rico JM, Ponessa JJ, Valero-Pacheco N, et al. Basophils prime group 2 innate lymphoid cells for neuropeptide-mediated inhibition. Nat Immunol. 2020;21(10):1181–1193. doi:10.1038/s41590-020-0753-y
 © 2021 The Author(s). This work is published and licensed by Dove Medical Press Limited. The full terms of this license are available at https://www.dovepress.com/terms.php and incorporate the Creative Commons Attribution - Non Commercial (unported, v3.0) License.
By accessing the work you hereby accept the Terms. Non-commercial uses of the work are permitted without any further permission from Dove Medical Press Limited, provided the work is properly attributed. For permission for commercial use of this work, please see paragraphs 4.2 and 5 of our Terms.
© 2021 The Author(s). This work is published and licensed by Dove Medical Press Limited. The full terms of this license are available at https://www.dovepress.com/terms.php and incorporate the Creative Commons Attribution - Non Commercial (unported, v3.0) License.
By accessing the work you hereby accept the Terms. Non-commercial uses of the work are permitted without any further permission from Dove Medical Press Limited, provided the work is properly attributed. For permission for commercial use of this work, please see paragraphs 4.2 and 5 of our Terms.