")
Back to Journals » Nature and Science of Sleep » Volume 13
Spectral Power Analysis of Sleep Electroencephalography in Subjects with Different Severities of Obstructive Sleep Apnea and Healthy Controls
Authors Kang JM , Cho SE , Na KS , Kang SG
Received 4 December 2020
Accepted for publication 25 February 2021
Published 1 April 2021 Volume 2021:13 Pages 477—486
DOI https://doi.org/10.2147/NSS.S295742
Checked for plagiarism Yes
Review by Single anonymous peer review
Peer reviewer comments 2
Editor who approved publication: Professor Ahmed BaHammam
Jae Myeong Kang,1,2,* Seo-Eun Cho,2,* Kyoung-Sae Na,2 Seung-Gul Kang1,2
1Sleep Medicine Center, Gil Medical Center, Gachon University College of Medicine, Incheon, Republic of Korea; 2Department of Psychiatry, Gil Medical Center, Gachon University College of Medicine, Incheon, Republic of Korea
*These authors contributed equally to this work
Correspondence: Seung-Gul Kang
Department of Psychiatry, Gil Medical Center, Gachon University, College of Medicine, 21, Namdong-daero 774 Beon-gil, Namdong-gu, Incheon, 21565, Republic of Korea
Tel +82 32-458-2818
Email [email protected]
Purpose: Previous spectral analysis studies on obstructive sleep apnea (OSA) involved small samples, and the results were inconsistent. We performed a spectral analysis of sleep EEG based on different severities of OSA using the Sleep Heart Health Study data. This study aimed to determine the difference in EEG spectral power during sleep in the non-OSA group and with different severities of OSA in the general population.
Patients and Methods: The participants (n = 5,804) underwent polysomnography, and they were classified into non-OSA, mild OSA, moderate OSA, and severe OSA groups. The fast Fourier transformation was used to compute the EEG power spectrum for total sleep duration within contiguous 30-second epochs of sleep. The EEG spectral powers of the groups were compared using 4,493 participants after adjusting potential confounding factors that could affect sleep EEG.
Results: The power spectra differed significantly among the groups for all frequency bands (p corr < 0.001). We found that the quantitative EEG spectral powers in the beta and sigma bands of total sleep differed (p corr < 0.001) among the participants in the non-OSA group and with different severities of OSA, controlling for covariates. The beta power was higher and the sigma power was lower in the OSA groups than in the non-OSA group. The beta power decreased in the order of severe OSA, moderate OSA, mild OSA, and non-OSA.
Conclusion: This study suggests that there are differences between the microstructures of PSG-derived sleep EEG of non-OSA participants and those with different severities of OSA.
Keywords: sleep EEG, spectral power, polysomnography, OSA, beta power, sigma power
Introduction
Obstructive sleep apnea (OSA) is a prevalent sleep disorder and the most common type of sleep-related breathing disorders (SRBD). OSA is characterized by repeated episodes of complete or partial upper airway collapse during sleep.1 OSA affects approximately 2%–14% of adults,2 and its prevalence increases in older adults.3 Untreated OSA can impair quality of life due to the disruption of sleep and sleepiness and increase the risk of cardiovascular complications and neurocognitive dysfunction.4,5
OSA is diagnosed using overnight polysomnography (PSG) when apnea or hypopnea occurs five or more times per hour (apnea-hypopnea index [AHI] ≥ 5).6 Apnea and hypopnea can induce arousal, as well as desaturation, and lead to decreased sleep quality and changes in the macrostructure (eg, increased shallow sleep and decreased slow-wave sleep and rapid eye movement [REM] sleep) of sleep electroencephalography (EEG);7,8 continuous positive airway pressure and optimal treatment for OSA may gradually normalize these changes.8 EEG recorded during sleep is a complex mixture of different waveforms; therefore, EEG can be deconstructed into waveforms with different frequency components (ie, delta, theta, alpha, sigma, and beta). The development of power spectral analysis, such as the fast Fourier transform, the most common quantitative EEG (qEEG) technique, facilitates the investigation of subtle brain dysfunction in various sleep disorders.
Several studies have been conducted on sleep qEEG of OSA using spectral analysis; however, the results have been inconsistent.9,10 Several outcomes have been reported: higher slow-wave activity during REM sleep in patients with OSA compared to controls;11,12 lower slow-wave activity during non-rapid eye movement (NREM) and REM sleep in OSA patients compared to controls;13,14 no difference in slow-wave activity during NREM sleep in OSA and control groups;15 higher absolute beta power during NREM sleep in OSA than in control groups.13 The inconsistent previous findings have been presumably attributed to the restriction of analyses to only NREM or REM sleep in existing studies, inconsistencies of the qEEG analysis method, and different phenotypes of OSA due to different study designs.10 It has been argued that larger sample sizes with different OSA severities are needed to overcome these issues and produce reliable research results.10
The aim of our study was to investigate qEEG spectral power during total sleep in a large sample of the general population and compare the spectral powers of the non-OSA group and the OSA groups with different severities. The Sleep Heart Health Study (SHHS) is optimal for investigating the difference in qEEG in normal controls and with different severities of OSA because of its sample size and good quality control. The aims of this study were as follows: (1) to compare the power spectral density of qEEG frequency bands during total sleep among non-OSA, mild OSA, moderate OSA, and severe OSA patients; (2) to compare the power spectral density of qEEG frequency bands during NREM and REM sleep for different severities of OSA.
Patients and Methods
Data Sources and Study Cohort
The SHHS is a large, multi-center, community-based, prospective cohort study that sought to determine the cardiovascular and other consequences of SRBD (ClinicalTrials.gov Identifier: NCT00005275).16 From 1995 to 1998, the participants older than 40 years underwent unattended PSG, participated in structured health interviews, and responded to sleep questionnaires. The design and aims of this study have been previously reported.16 The data collected included the following: information on psychotropic medications (ie, recent use of benzodiazepine, tricyclic antidepressants [TCA], and non-TCA) and substances (ie, current smoking status and amount of alcohol use per day) that could affect sleep EEG; age; sex; information on sleep-related symptoms such as Epworth sleepiness scale score and frequent insomnia (insomnia symptoms more than 16 days among 1 month). We had access to the database of SHHS-1 from the National Sleep Research Resource website (https://sleepdata.org/datasets/shhs) after a signed agreement with Brigham and Women’s Hospital. The SHHS was approved by the institutional review board (IRB) at each site and participants provided written informed consent. The database complied with relevant data protection and privacy regulations. Our project was exempted from review by the IRB of Gil Medical Center (IRB No: GCIRB2020-198) and the need to obtain additional written informed consent from the participants was waived, since the data were open to the public, anonymized, and maintained with confidentiality.
Polysomnography
All participants underwent unattended overnight PSG in their homes, as previously described, using a Compumedics P-series recording system (Compumedics).17 The recording montage included a C3-A2 and a C4-A1 EEG, left and right electrooculograms, chin electromyogram, single-lead electrocardiogram, airflow by an oral-nasal thermistor, oxyhemoglobin saturation by pulse oximetry, measurement of thoracic and abdominal effort by impedance plethysmography, and body position (by mercury strain gauge). Sleep-stage scoring of all nocturnal recordings was conducted by trained technicians using Rechtschaffen and Kales criteria at a centralized reading center. Apnea was characterized by absent or nearly absent airflow for ≥ 10 s. Hypopnea was characterized by a discernible reduction in airflow or thoracoabdominal movement (≥ 30% below baseline values) for ≥ 10 s. These data were scored using the AHI in various ways; among them, we chose recommended hypopnea criteria of the American Academy of Sleep Medicine manual18 (ie, hypopnea was characterized by a reduction in peak signal excursions by ≥ 30% of the pre-event baseline using nasal pressure and ≥ 3% decrease in oxygen saturation and/or an association between the event and arousal). Based on the degree of AHI, the participants were classified into non-OSA (AHI < 5), mild OSA (5 ≤ AHI < 15), moderate OSA (15 ≤ AHI < 30), and severe OSA (AHI ≥ 30) groups.
Spectral Analysis
The spectral analysis method used for the data was described in a previous study that compared the sleep EEGs of smokers and nonsmokers.19 The C3-A2 and C4-A1 EEG recordings were sampled at 125 Hz and analyzed using the fast Fourier transform techniques. The fast Fourier transform was conducted for an EEG record length of 5 s to obtain a frequency resolution of 0.2 Hz. Each 5-s segment of the EEG signal was first windowed with a Hanning tapering window before computing the power spectra. The power content expressed as μV2 for each 30-second epoch of sleep was determined as the average power across the six 5-s segments of the EEG. Power spectra were computed for each of the EEG frequency bands: delta (1–4 Hz), theta (4–8 Hz), alpha (8–12 Hz), sigma (12–15 Hz), and beta (15–20 Hz). For the present analysis, the data derived from the central EEG electrode (ie, [C3/A2 + C4/A1]/2) during the total sleep, NREM, and REM sleep period were used. To achieve normal distributions, all absolute power data were log-transformed.20
Statistical Analysis
The chi-squared test was used for categorical variables, and Kruskal–Wallis test, analysis of variance (ANOVA), and analysis of covariance (ANCOVA) were used to compare the demographics, PSG characteristics, and absolute spectral EEG powers of the groups. The ANCOVA was performed to compare the powers of each spectral bandwidth among the groups after controlling for the potential confounders, including age and sex. The significance of the comparison of the spectral powers of the groups during total sleep was defined as p < 0.05 after Bonferroni correction calculated by an uncorrected p-value × 5, as 5 was the number of EEG frequency bands. The significance of the comparison of the spectral powers of the groups during NREM and REM sleep was defined as p < 0.05 after Bonferroni correction calculated by an uncorrected p-value × 10. IBM SPSS software (version 25.0, IBM Corp, Armonk, NY, USA) was used for data analysis.
Results
Demographic Characteristics and PSG Results
Of the 5,804 SHHS-1 participants with PSG data, 961 were excluded because of missing data for spectral analysis, and 350 participants were excluded due to other missing or unreliable data for the covariates (ie, TCA use, non-TCA use, benzodiazepine use, current smoking status, usual alcohol intake per day, and the presence of insomnia). In total, 4,493 were included in the final study population.
Of the 4,493 participants, 767 (17.1%), 1,753 (39.0%), 1,236 (27.5%), and 737 (16.4%) were classified into the non-OSA, mild OSA, moderate OSA, and severe OSA groups, respectively. The demographic characteristics of the participants and their comparison are presented in Table 1. There were significant differences between the age and sex distributions of the groups. As expected, the groups differed in body mass index and total score of Epworth sleepiness scale, which are significantly related to OSA. We compared the use of medication and substance, which could affect sleep EEG among the groups, and we found significant differences between the trends of current smoking, the amount of alcohol taken per day, and the recent use of benzodiazepine. However, there was no significant difference between the trends of recent use of TCA and non-TCA in the groups. In addition, the frequencies of insomnia in the groups were not different.
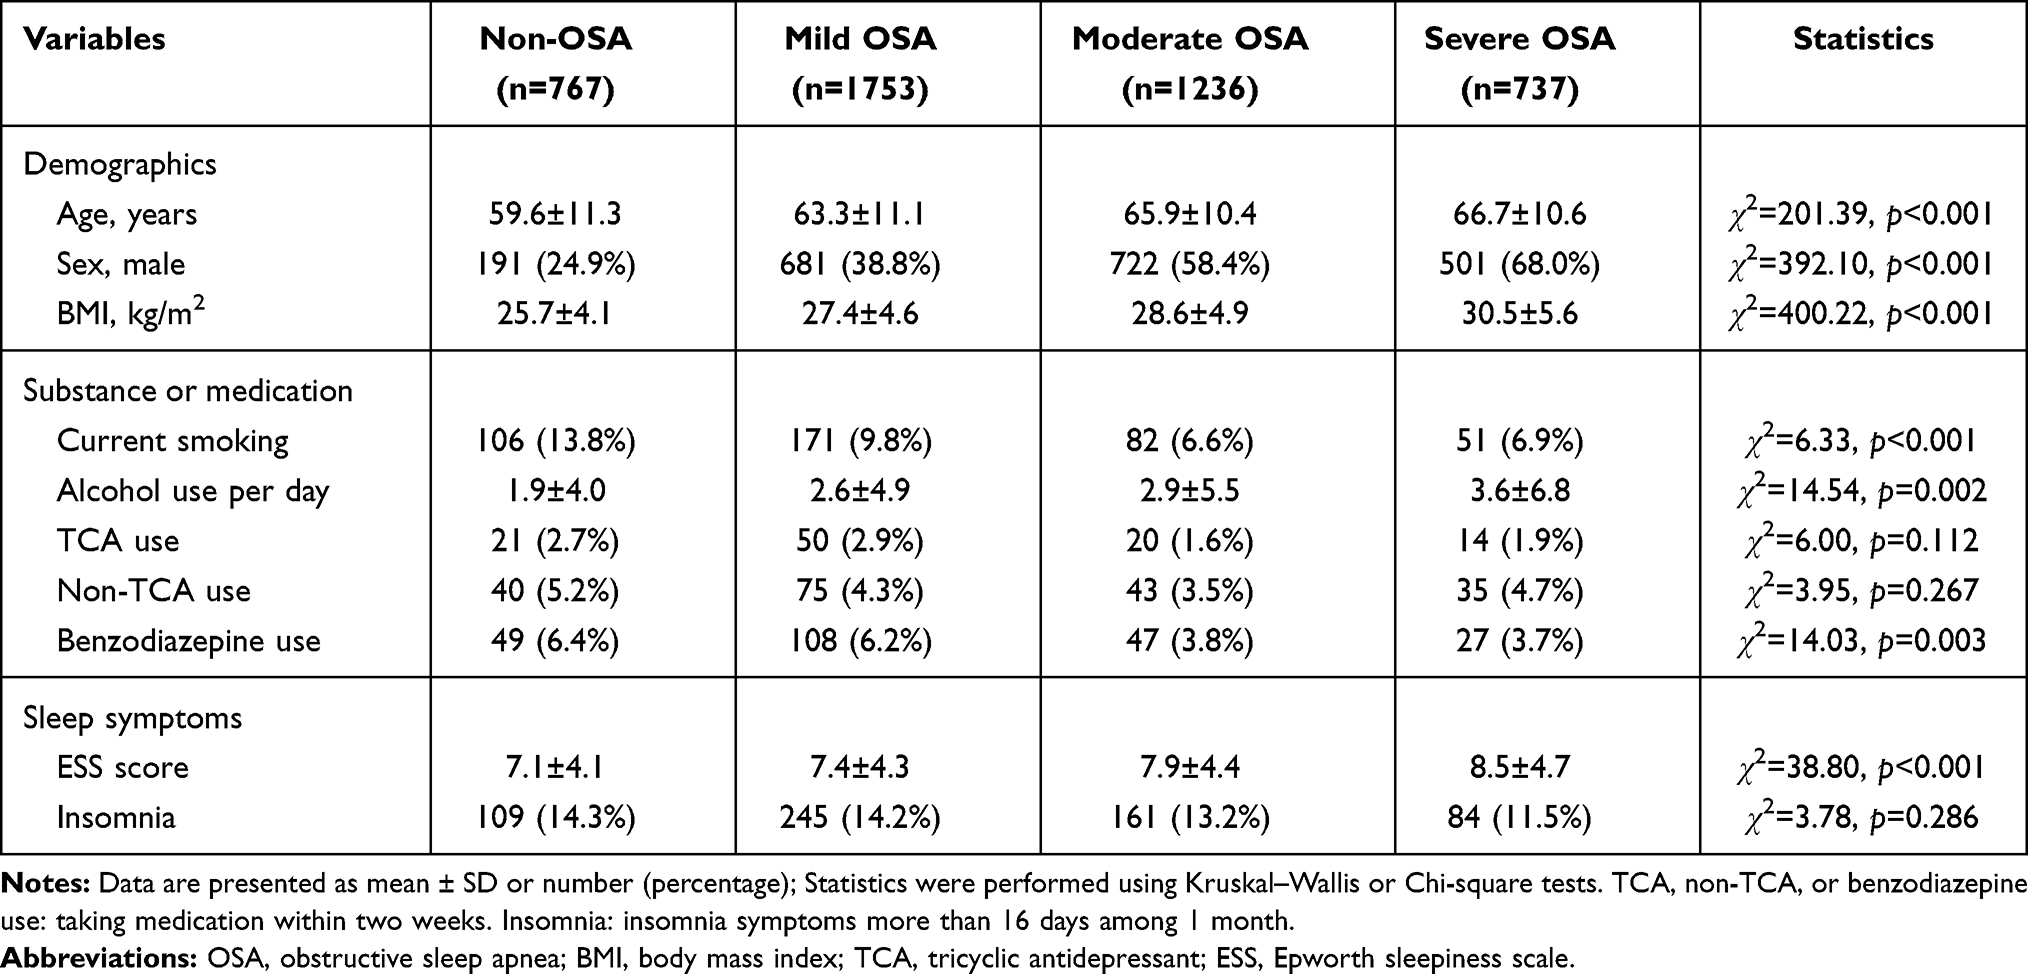 |
Table 1 Comparison of Demographic and Clinical Characteristics of the Non-OSA, Mild OSA, Moderate OSA, and Severe OSA Groups |
Table 2 shows the PSG results of the four groups and their comparison. As expected, the groups differed in AHI. Total sleep time, sleep efficiency, wake after sleep onset, and the ratio of stage N1, N2, N3, and REM sleep differed among the groups.
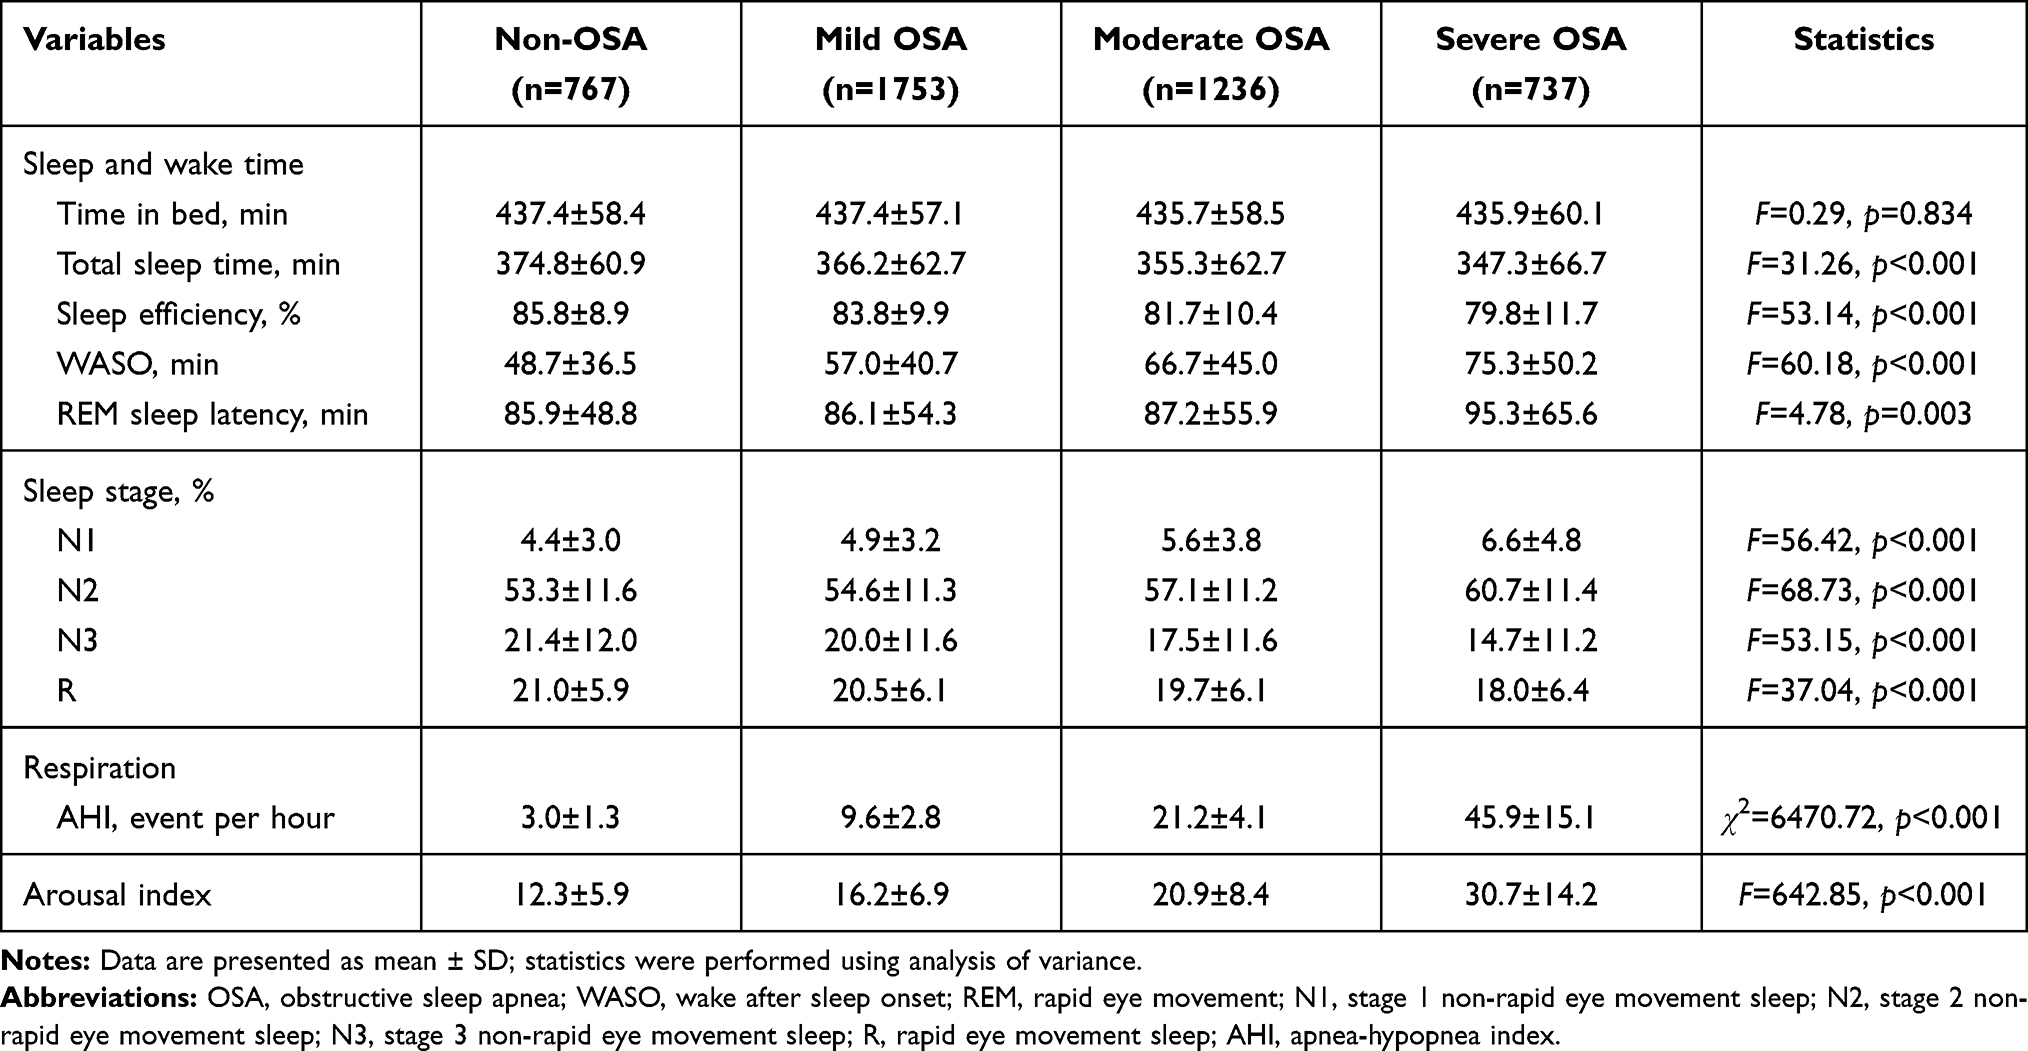 |
Table 2 Comparison of Polysomnographic Findings of the Groups |
Comparison of Spectral EEG Powers
Table 3 and Figure 1 show the comparison of the absolute spectral powers in the central electrodes during total sleep in the non-OSA, mild OSA, moderate OSA, and severe OSA groups. The ANOVA test showed significant differences between the spectral powers for all the frequency bands of the groups (p corrected < 0.001 in all frequency bands). Significant differences in the sigma (12–15 Hz, F = 9.72, p < 0.001, p corrected < 0.001) and beta (15–20 Hz, F = 38.58, p < 0.001, p corrected < 0.001) frequency bands of the groups were revealed by the ANCOVA test after controlling for the potential confounders (ie, age, sex, current smoking status, usual alcohol intake per day, recent use of TCA, non-TCA, and benzodiazepine, and the presence of insomnia). The posthoc analysis showed that the absolute spectral power of the beta band during total sleep decreased in the order of severe OSA, moderate OSA, mild OSA, and non-OSA, and it was different for all the 2-group combinations. Furthermore, the absolute spectral power of the sigma band during total sleep was lower in the OSA groups (ie, OSA groups of all severity) than in the non-OSA group, and lower in the severe OSA than in the mild OSA group. When we re-calculated the AHI after excluding the hypopnea events with arousal to adjust for cortical responses of respiratory events and repeated the analyses, the results were generally similar, although there were group pairs whose significance disappeared (Supplementary Tables S1 and S2).
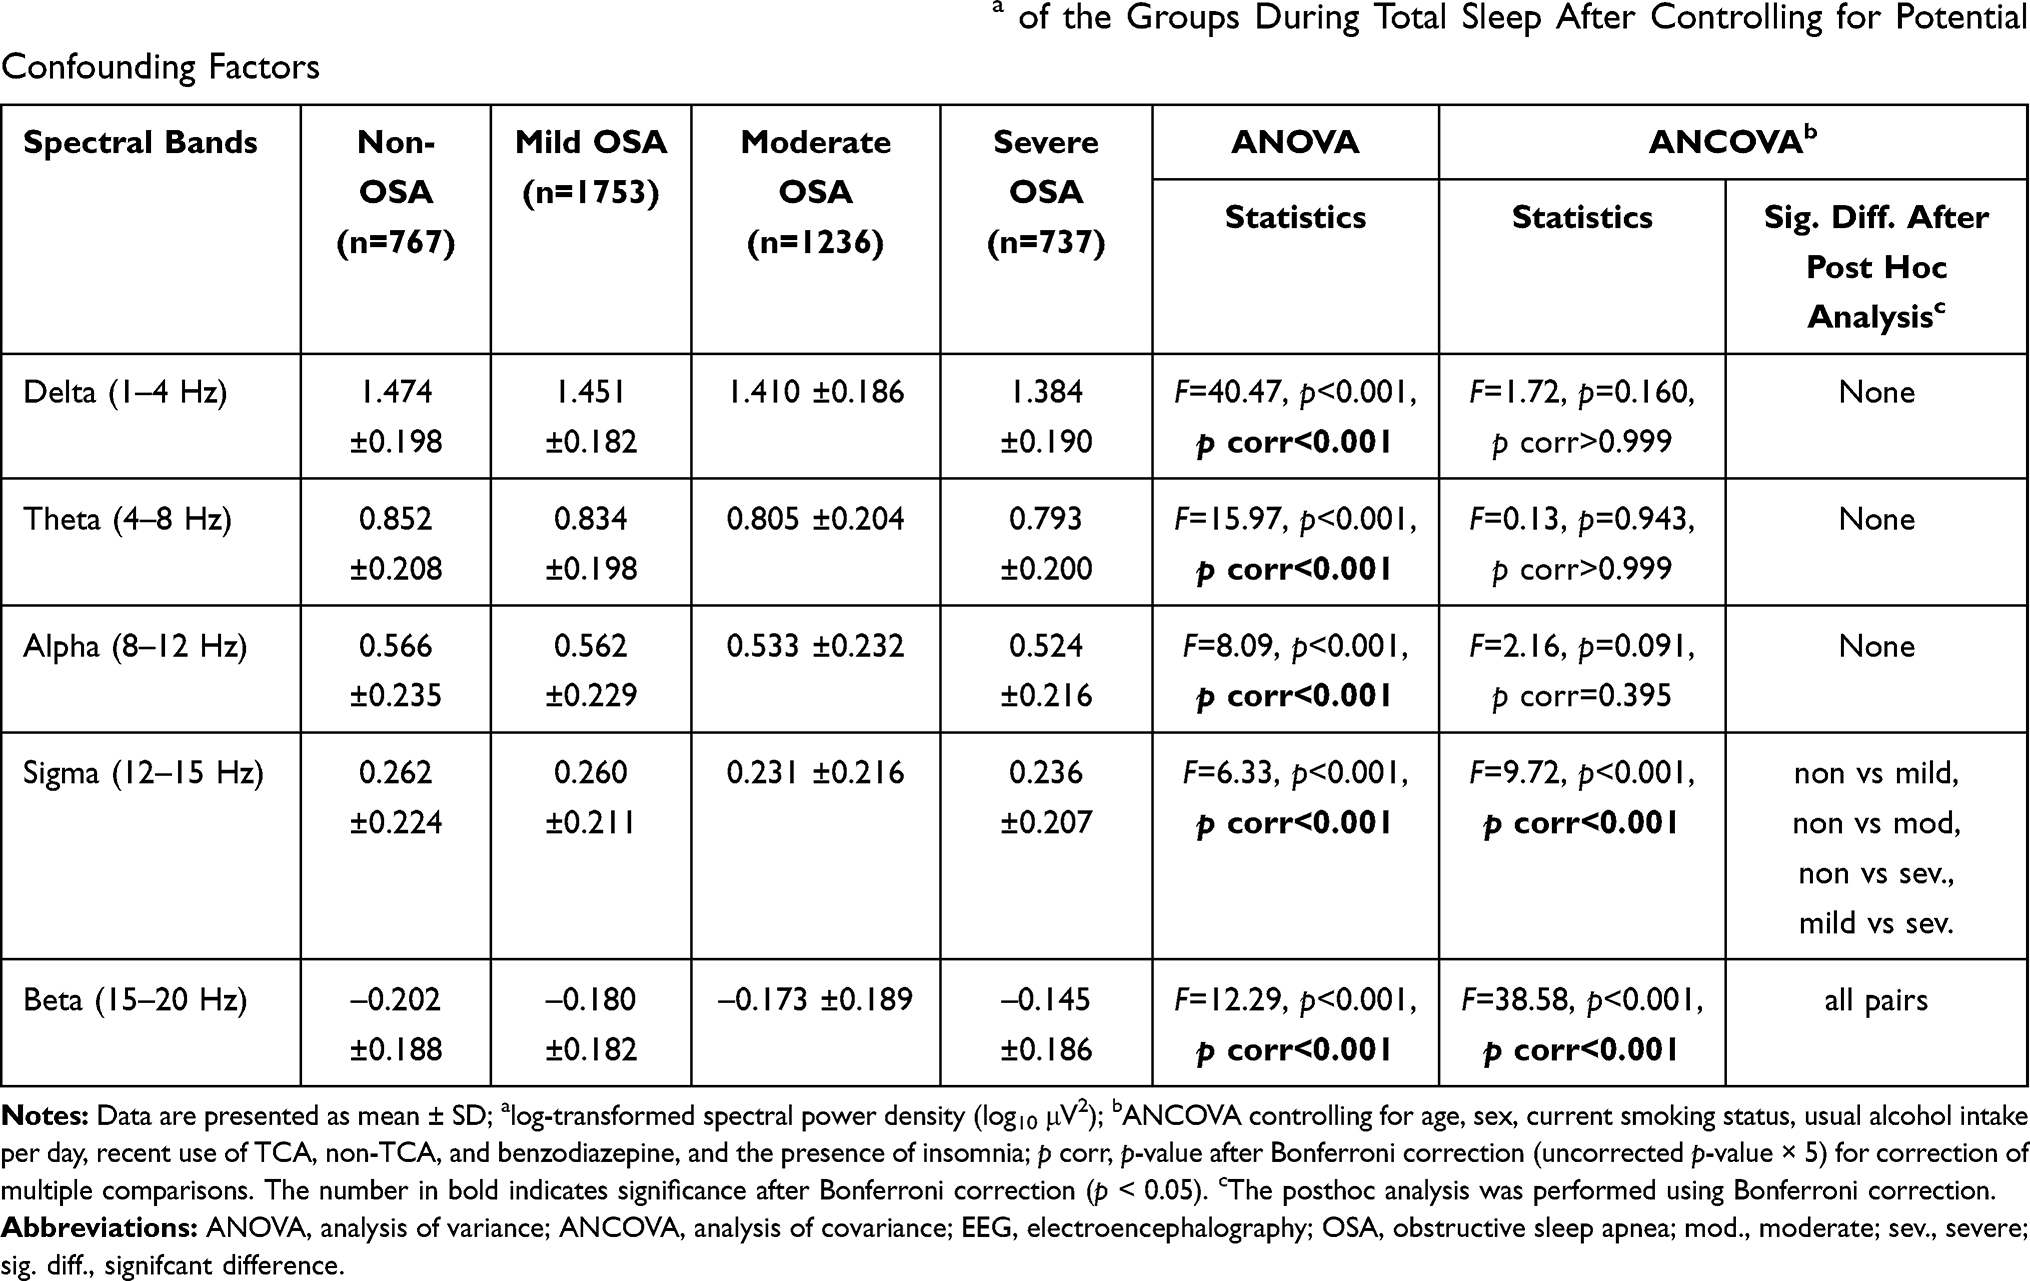 |
Table 3 Comparison of the Absolute Spectral Power Densitiesa of the Groups During Total Sleep After Controlling for Potential Confounding Factors |
 |
Figure 1 Comparisons of the absolute power spectral densities of patients without OSA and those with different severities of OSA during total sleep. *p < 0.05 in ANCOVA controlling for age, sex, current smoking, amount of alcohol intake per day, recent use of benzodiazepine, TCA, and non-TCA, and the presence of insomnia after Bonferroni correction (uncorrected p-value × 5) for multiple comparisons. Bars denote mean ± standard deviation. Abbreviations: OSA, obstructive sleep apnea; ANCOVA, analysis of covariance. |
Table 4 and Figure 2 present the results of the comparisons of the absolute spectral powers in the central electrodes during NREM and REM sleep in the groups. There were significant differences (p corrected < 0.05) between the spectral powers in all frequency bands during NREM sleep and in all frequency bands, except the alpha band, during REM sleep in the groups, as shown by the ANOVA test. Significant differences between the sigma and beta frequency bands of the groups during NREM and REM sleep were revealed by the ANCOVA test and posthoc analysis after controlling for the potential confounders.
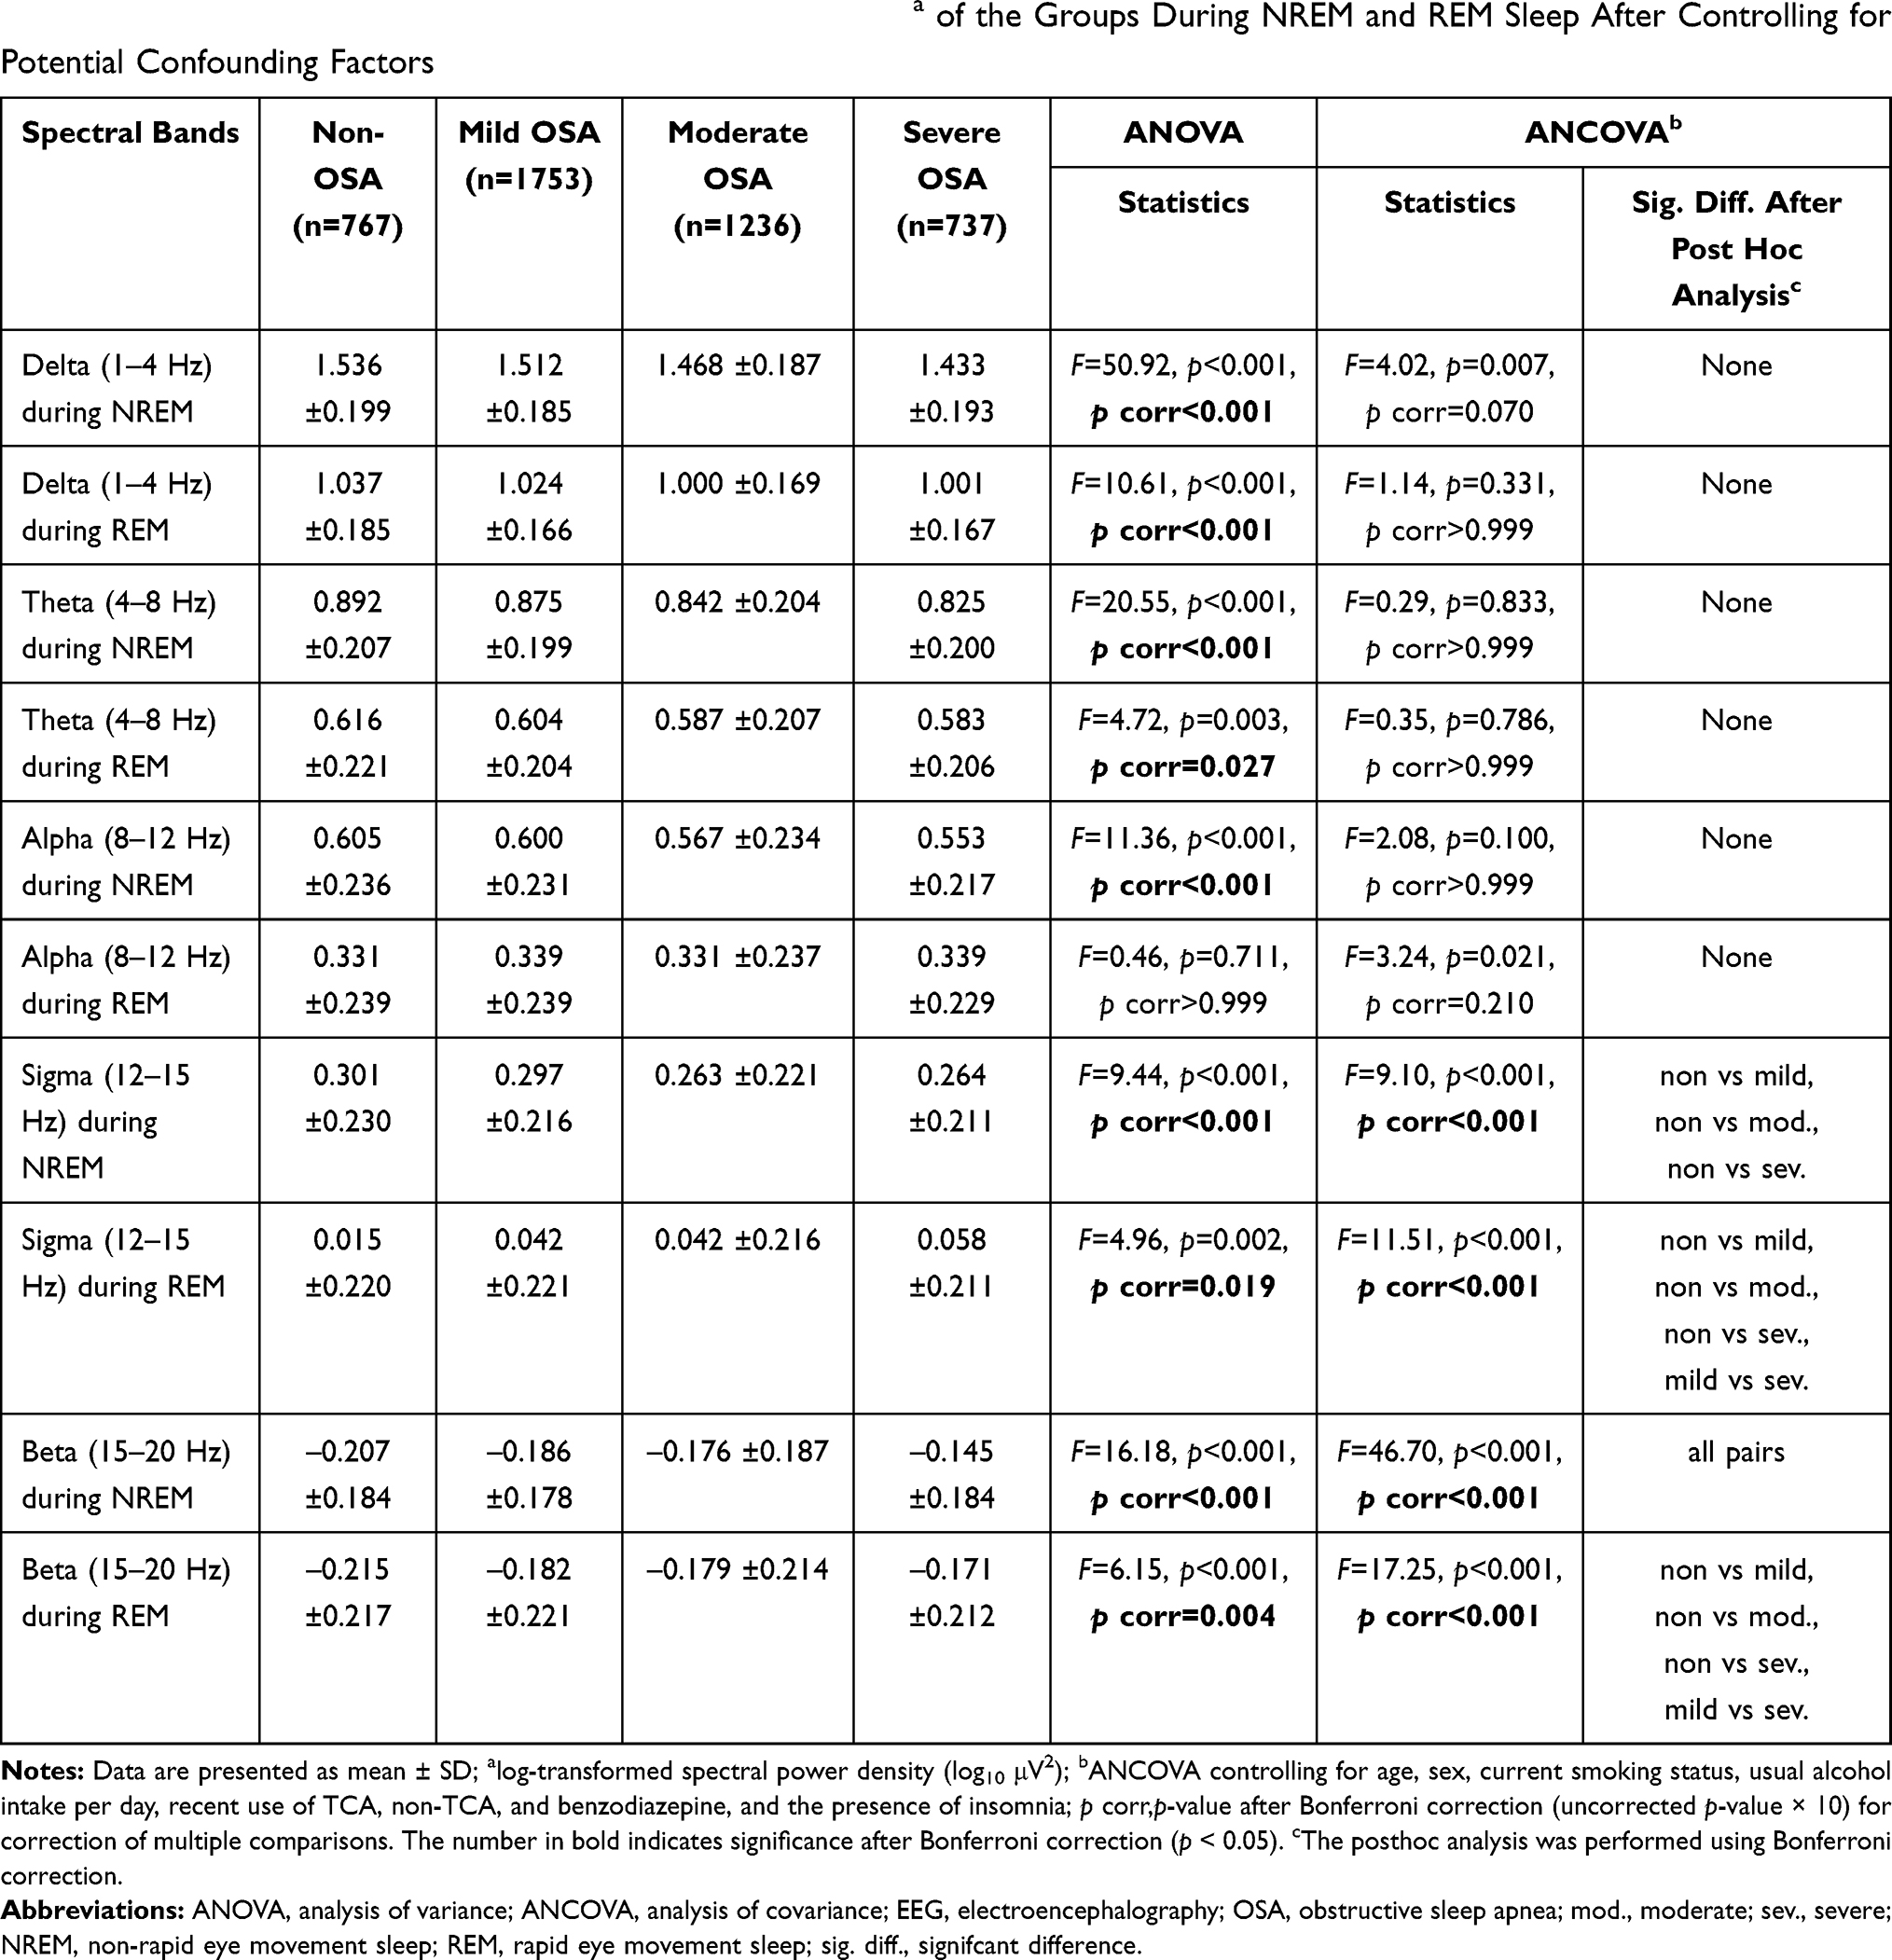 |
Table 4 Comparison of the Absolute Spectral Power Densitiesa of the Groups During NREM and REM Sleep After Controlling for Potential Confounding Factors |
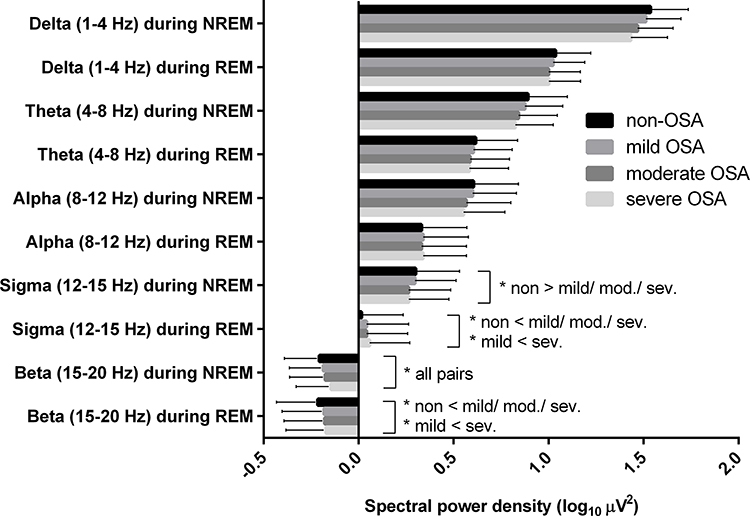 |
Figure 2 Comparisons of the absolute power spectral densities of patients without OSA and those with different severities of OSA during NREM and REM sleep. *p < 0.05 in ANCOVA controlling for age, sex, current smoking, amount of alcohol intake per day, recent use of benzodiazepine, TCA, and non-TCA, and the presence of insomnia after Bonferroni correction (uncorrected p-value × 10) for multiple comparisons. Bars denote mean ± standard deviation. Abbreviations: NREM, non-rapid eye movement; REM, rapid eye movement; OSA, obstructive sleep apnea; ANCOVA, analysis of covariance. |
Discussion
We conducted spectral power analysis of sleep EEG derived from PSG of the general population and compared the spectral powers of the non-OSA, mild OSA, moderate OSA, and severe OSA patients. The major finding of the present study is the spectral power difference in the beta and sigma frequency bands of EEG during total, NREM, and REM sleep. We found a higher beta activity during total sleep in the more severe OSA group than in the less severe OSA and non-OSA groups even after controlling for the potential confounders. In addition, the sigma power activity was lower in all the severity groups of OSA than in the non-OSA group.
The higher beta power in the more severe OSA groups shown in this study—the more severe OSA, the shallower the sleep—was demonstrated by the microstructure of sleep in OSA patients. Beta power increases during N1 and N2 sleep and correlates with cognitive and emotional processes and arousal during sleep.21 The higher beta power in the more severe OSA in our study was consistent across NREM, REM, and total sleep; however, the previous results were inconsistent.11,13,22 Consistent with our study, a recent study found that beta power was higher in the OSA group (n = 129) than in the simple snoring group (n = 42).23 In a study comparing the absolute power during total sleep among patients with OSA (n = 12) and upper airway resistance syndrome (UARS) (n = 12) and normal controls (n = 12), the controls had higher power density within the delta band during all sleep stages and lower power density within the alpha, beta, and sigma bands during NREM sleep than the OSA and UARS patients, which was consistent with the outcomes of our study.13 However, in another study comparing the OSA (n = 11) and the control (n = 8) groups, the relative beta power was higher during stage 3 and lower during stage 2 in the sleep apnea group than in the healthy group, depending on the sleep stage.22 On the other hand, increased delta activity and slowing ratio (delta + theta)/(alpha + beta) in the frontal, central, and parietal regions were observed in the severe OSA group in a study comparing the absolute powers during REM sleep of the severe OSA group (n = 21) and normal controls (n = 10), which differed from our results.11 This study confirmed the difference between the beta powers of the groups using large-scale data and controlled the covariates that could affect the spectral sleep EEG, and the increasing trend of beta power with the severity of OSA may be reproducible. Interestingly, even though the presence of insomnia was controlled, there was a significant difference in spectral power among groups. It can be interpreted that even if OSA patients do not recognize the symptoms of insomnia, they suffer from cortical arousal during sleep.
The lower sigma power (ie, sleep spindle activity) in the OSA groups than in the non-OSA group is a relatively consistent finding in previous small-sample studies that compared the power spectra of OSA patients and controls.13,15,22,24,25 There was a significant decrease in the power of the sigma band in the OSA and UARS groups compared with the control group.13 The relative power of the sigma band during stage 2 was lower in the sleep apnea group than in the healthy group.22 In addition to these, the spectral power of the sigma band was significantly lower in the OSA patients than in the controls during each sleep cycle and the whole night.24 Sleep spindle is known as the hallmark of NREM sleep and the characteristic finding of stage 227; it is also believed to mediate several sleep-related functions, memory consolidation, and cortical development.26,27 The lower sigma power in the OSA groups than in the controls in this study may be attributed to the high degree of sleep fragmentation and dysfunction in the OSA patients.24
The results of the comparison of the spectral powers of the groups showed different patterns during NREM and REM sleep. A significant difference between the alpha powers of the groups was shown only during NREM sleep (no significant difference in REM sleep) by the ANOVA test; no significant difference between the NREM and REM sleep was shown by the ANCOVA with the posthoc test. Inconsistent findings have been reported, including higher alpha activity in OSA than in controls13 and no differences between the alpha powers of the OSA group and controls or simple snoring group.23,24 This study found that OSA patients and normal controls or the simple snoring group showed no differences in the alpha frequency, and this may be attributed to the adjustment of confounding factors because alpha activity during sleep is associated with depressive symptoms, painful conditions, and other psychiatric disorders.28–30 A significant difference between the sigma powers of the groups during NREM and REM sleep was revealed by both ANOVA and ANCOVA tests; there was a lower sigma power during NREM sleep and higher sigma power during REM sleep in OSA patients. An earlier study reported the converse: lower power density in NREM sleep and higher power in REM sleep in patients with primary insomnia than in controls.31 In OSA patients, however, previous studies with small sample sizes showed that sigma power in REM sleep did not differ from that in controls,13,22,24 while lower sigma power in NREM sleep was consistently found as discussed above. The lower sigma power during NREM sleep in this study is assumed to be associated with decreased sleep spindles, sleep fragmentation, and poor cognition in OSA patients.26,27 The novel finding of increased sigma power in REM sleep might be interpreted that REM sleep was interrupted by sleep spindles, which are relatively faster than REM sleep EEG due to greater arousability in OSA patients.31–33 In addition, we believe that OSA patients in this study showed the opposite direction of sigma power between NREM and REM sleep that was found in primary insomnia31 because we adjusted for the presence of insomnia. However, the implication of this result cannot be confirmed in our result, we believe that future studies are needed. Future research using SHHS data to investigate the spectral densities across the sleep stages would be effective in understanding the microstructural pathophysiologic mechanism of OSA. Regarding beta power, both ANOVA and ANCOVA tests showed significant results, and the severe OSA group showed a higher beta power in all the tests. This corresponds with the finding of a positive correlation between the beta power activity and AHI in NREM sleep in previous studies,23,34 which implies that beta power may linearly correlate with increased background activity and arousal in OSA patients compared with normal controls.
In this study, ANOVA showed significantly different spectral powers during NREM, REM, and total sleep for all the frequency bands, except the alpha band during REM sleep. However, we confirmed the difference between the EEG powers of the groups with the ANCOVA test, controlling for the potential covariates. The advantage of this study is that it proved the difference between the powers of the groups by controlling the confounding factors. Another advantage of this study is the significantly larger sample size compared to previous spectral analyses of OSA. The spectral power findings for OSA that were not confirmed due to the several limitations of the previous studies (ie, different spectral analysis methods, the different characteristics of OSA patients, and the small number of subjects) may be established to some extent through the results of this study.
A limitation of this study is that we could use only central EEG electrodes due to the study design of the SHHS, although the information from other EEG channels might reflect different types of EEG waves.35 For example, the alpha rhythm is well observed in the occipital region, slow waves in frontal areas, and the K-complex and sleep spindles in central and frontal areas.35 Since spectral analysis using multi-channel EEG data is a recent development, the research using this method is expected to improve the spatial resolution.
Conclusions
To the best of our knowledge, this is the largest study to investigate and compare the spectral powers of OSA patients and controls to date. Therefore, this study is meaningful. In summary, we found that the qEEG spectral powers of the beta and sigma bands of total sleep differ in patients without OSA and those with different severities of OSA. The beta power was higher and the sigma power was lower in the OSA groups than in the non-OSA group, and the beta power decreased in the order of severe OSA, moderate OSA, mild OSA, and non-OSA. This study indicates that there are differences between the microstructures of PSG-derived sleep EEG of patients without OSA and those with different severities of OSA.
Data Sharing Statement
The data on which this manuscript is based are open to researchers upon appropriate request. The Sleep Heart Health Study (SHHS) 2 database is accessible from the National Sleep Research Resource (https://sleepdata.org/datasets/shhs).
Acknowledgment
These authors contributed equally to this work as first authors: Jae Myeong Kang, Seo-Eun Cho.
Funding
The Sleep Heart Health Study (SHHS) was supported by National Heart, Lung, and Blood Institute cooperative agreements U01HL53916 (University of California, Davis), U01HL53931 (New York University), U01HL53934 (University of Minnesota), U01HL53937 and U01HL64360 (Johns Hopkins University), U01HL53938 (University of Arizona), U01HL53940 (University of Washington), U01HL53941 (Boston University), and U01HL63463 (Case Western Reserve University). The National Sleep Research Resource was supported by the National Heart, Lung, and Blood Institute (R24 HL114473, RFP 75N92019R002). This work was also supported by the National Research Foundation of Korea (NRF) grant funded by the Korea government (MSIT) (grant number: NRF-2020R1A2C1007527).
Disclosure
The authors report no conflicts of interest for this work.
References
1. American Academy of Sleep Medicine. International Classification of Sleep Disorders.
2. Young T, Peppard PE, Gottlieb DJ. Epidemiology of obstructive sleep apnea: a population health perspective. Am J Respir Crit Care Med. 2002;165(9):1217–1239. doi:10.1164/rccm.2109080
3. Shochat T, Pillar G. Sleep apnoea in the older adult. Drugs Aging. 2003;20(8):551–560. doi:10.2165/00002512-200320080-00001
4. Yaffe K, Laffan AM, Harrison SL, et al. Sleep-disordered breathing, hypoxia, and risk of mild cognitive impairment and dementia in older women. JAMA. 2011;306(6):613–619. doi:10.1001/jama.2011.1115
5. Jain V. Clinical perspective of obstructive sleep apnea–induced cardiovascular complications. Antioxid Redox Signal. 2007;9(6):701–710. doi:10.1089/ars.2007.1558
6. Greenberg H, Lakticova V, Scharf SM. Obstructive sleep apnea: clinical features, evaluation, and principles of management. In: Principles and Practice of Sleep Medicine. Elsevier; 2017:1110–1124. e1116.
7. Himanen S-L, Joutsen A, Virkkala J. Visual assessment of selected high amplitude frontopolar slow waves of sleep: differences between healthy subjects and apnea patients. Clin EEG Neurosci. 2004;35(3):125–131. doi:10.1177/155005940403500304
8. Parrino L, Thomas RJ, Smerieri A, Spaggiari MC, Del Felice A, Terzano MG. Reorganization of sleep patterns in severe OSAS under prolonged CPAP treatment. Clin Neurophysiol. 2005;116(9):2228–2239. doi:10.1016/j.clinph.2005.05.005
9. Puskás S, Kozák N, Sulina D, Csiba L, Magyar MT. Quantitative EEG in obstructive sleep apnea syndrome: a review of the literature. Rev Neurosci. 2017;28(3):265. doi:10.1515/revneuro-2016-0064
10. D’Rozario AL, Cross NE, Vakulin A, et al. Quantitative electroencephalogram measures in adult obstructive sleep apnea - Potential biomarkers of neurobehavioural functioning. Sleep Med Rev. 2017;36:29–42. doi:10.1016/j.smrv.2016.10.003
11. Morisson F, Lavigne G, Petit D, Nielsen T, Malo J, Montplaisir J. Spectral analysis of wakefulness and REM sleep EEG in patients with sleep apnoea syndrome. Eur Respir J. 1998;11(5):1135–1140. doi:10.1183/09031936.98.11051135
12. Morisson F, Décary A, Petit D, Lavigne G, Malo J, Montplaisir J. Daytime sleepiness and EEG spectral analysis in apneic patients before and after treatment with continuous positive airway pressure. Chest. 2001;119(1):45–52. doi:10.1378/chest.119.1.45
13. Guilleminault C, Do Kim Y, Chowdhuri S, Horita M, Ohayon M, Kushida C. Sleep and daytime sleepiness in upper airway resistance syndrome compared to obstructive sleep apnoea syndrome. Eur Respir J. 2001;17(5):838–847. doi:10.1183/09031936.01.17508380
14. Saunamäki T, Jehkonen M, Huupponen E, Polo O, Himanen S-L. Visual dysfunction and computational sleep depth changes in obstructive sleep apnea syndrome. Clin EEG Neurosci. 2009;40(3):162–167. doi:10.1177/155005940904000308
15. Himanen SL, Virkkala J, Huupponen E, Hasan J. Spindle frequency remains slow in sleep apnea patients throughout the night. Sleep Med. 2003;4(3):229–234. doi:10.1016/S1389-9457(02)00239-3
16. Quan SF, Howard BV, Iber C, et al. The sleep heart health study: design, rationale, and methods. Sleep. 1997;20(12):1077–1085.
17. Rapoport David H, Smith Philip L, Kiley James P. Methods for obtaining and analyzing unattended polysomnography data for a multicenter study. Sleep. 1998;21(7):759–767. doi:10.1093/sleep/21.7.759
18. Berry RB, Brooks R, Gamaldo CE, Harding SM, Marcus C, Vaughn BV. The AASM manual for the scoring of sleep and associated events rules, terminology technical specifications, Darien, Illinois. Am Acad Sleep Med. 2012;176:2012.
19. Zhang L, Samet J, Caffo B, Bankman I, Punjabi NM. Power spectral analysis of EEG activity during sleep in cigarette smokers. Chest. 2008;133(2):427–432. doi:10.1378/chest.07-1190
20. Gasser T, Sroka L, Möcks J. The transfer of EOG activity into the EEG for eyes open and closed. Electroencephalogr Clin Neurophysiol. 1985;61(2):181–193. doi:10.1016/0013-4694(85)91058-2
21. Benbadis SR. Introduction to sleep electroencephalography. In: Sleep: A Comprehensive Handbook. 2006:989–1024.
22. Abdullah H, Maddage NC, Cosic I, Cvetkovic D. Cross-correlation of EEG frequency bands and heart rate variability for sleep apnoea classification. Med Biol Eng Comput. 2010;48(12):1261–1269. doi:10.1007/s11517-010-0696-9
23. Kang JM, Kim ST, Mariani S, et al. Difference in spectral power density of sleep EEG between patients with simple snoring and those with obstructive sleep apnoea. Sci Rep. 2020;10(1):1–8. doi:10.1038/s41598-019-56847-4
24. Ondze B, Espa F, Dauvilliers Y, Billiard M, Besset A. Sleep architecture, slow wave activity and sleep spindles in mild sleep disordered breathing. Clin Neurophysiol. 2003;114(5):867–874. doi:10.1016/S1388-2457(02)00389-9
25. Huupponen E, Himanen S-L, Hasan J, Värri A. Automatic analysis of electro-encephalogram sleep spindle frequency throughout the night. Med Biol Eng Comput. 2003;41(6):727–732. doi:10.1007/BF02349981
26. Fogel SM, Smith CT. The function of the sleep spindle: a physiological index of intelligence and a mechanism for sleep-dependent memory consolidation. Neurosci Biobehav Rev. 2011;35(5):1154–1165. doi:10.1016/j.neubiorev.2010.12.003
27. Andrillon T, Nir Y, Staba RJ, et al. Sleep spindles in humans: insights from intracranial EEG and unit recordings. J Neurosci. 2011;31(49):17821–17834. doi:10.1523/JNEUROSCI.2604-11.2011
28. Hauri P, Hawkins DR. Alpha-delta sleep. Electroencephalogr Clin Neurophysiol. 1973;34(3):233–237. doi:10.1016/0013-4694(73)90250-2
29. Branco J, Atalaia A, Paiva T. Sleep cycles and alpha-delta sleep in fibromyalgia syndrome. J Rheumatol. 1994;21(6):1113.
30. Jaimchariyatam N, Rodriguez CL, Budur K. Prevalence and correlates of alpha-delta sleep in major depressive disorders. Innov Clin Neurosci. 2011;8(7):35.
31. Merica H, Blois R, Gaillard JM. Spectral characteristics of sleep EEG in chronic insomnia. Eur J Neurosci. 1998;10(5):1826–1834. doi:10.1046/j.1460-9568.1998.00189.x
32. Armitage R. The distribution of EEG frequencies in REM and NREM sleep stages in healthy young adults. Sleep. 1995;18(5):334–341. doi:10.1093/sleep/18.5.334
33. De Gennaro L, Ferrara M. Sleep spindles: an overview. Sleep Med Rev. 2003;7(5):423–440. doi:10.1053/smrv.2002.0252
34. Appleton SL, Vakulin A, D’Rozario A, et al. Quantitative electroencephalography measures in rapid eye movement and nonrapid eye movement sleep are associated with apnea–hypopnea index and nocturnal hypoxemia in men. Sleep. 2019;42(7):zsz092. doi:10.1093/sleep/zsz092
35. Jiang D, Lu Y-N, Ma Y, Wang Y. Robust sleep stage classification with single-channel EEG signals using multimodal decomposition and HMM-based refinement. Expert Syst Appl. 2019;121:188–203. doi:10.1016/j.eswa.2018.12.023
 © 2021 The Author(s). This work is published and licensed by Dove Medical Press Limited. The full terms of this license are available at https://www.dovepress.com/terms.php and incorporate the Creative Commons Attribution - Non Commercial (unported, v3.0) License.
By accessing the work you hereby accept the Terms. Non-commercial uses of the work are permitted without any further permission from Dove Medical Press Limited, provided the work is properly attributed. For permission for commercial use of this work, please see paragraphs 4.2 and 5 of our Terms.
© 2021 The Author(s). This work is published and licensed by Dove Medical Press Limited. The full terms of this license are available at https://www.dovepress.com/terms.php and incorporate the Creative Commons Attribution - Non Commercial (unported, v3.0) License.
By accessing the work you hereby accept the Terms. Non-commercial uses of the work are permitted without any further permission from Dove Medical Press Limited, provided the work is properly attributed. For permission for commercial use of this work, please see paragraphs 4.2 and 5 of our Terms.