")
Back to Journals » Journal of Pain Research » Volume 9
Specific proteins of the trapezius muscle correlate with pain intensity and sensitivity – an explorative multivariate proteomic study of the trapezius muscle in women with chronic widespread pain
Authors Olausson P, Ghafouri B , Ghafouri N, Gerdle B
Received 10 December 2015
Accepted for publication 24 February 2016
Published 2 June 2016 Volume 2016:9 Pages 345—356
DOI https://doi.org/10.2147/JPR.S102275
Checked for plagiarism Yes
Review by Single anonymous peer review
Peer reviewer comments 3
Editor who approved publication: Dr Michael Schatman
Patrik Olausson, Bijar Ghafouri, Nazdar Ghafouri, Björn Gerdle
Pain and Rehabilitation Centre, Department of Medical and Health Sciences, Linköping University, Linköping, Sweden
Abstract: Chronic widespread pain (CWP) including fibromyalgia syndrome (FMS) has a high prevalence and is associated with prominent negative consequences. CWP/FMS exhibits morphological and functional alterations in the central nervous system. The importance of peripheral factors for maintaining the central alterations are under debate. In this study, the proteins from biopsies of the trapezius muscle from 18 female CWP/FMS patients and 19 healthy female controls were analyzed. Pain intensity and pressure pain thresholds (PPT) over the trapezius muscles were registered. Twelve proteins representing five different groups of proteins were important regressors of pain intensity in CWP/FMS (R2=0.99; P<0.001). In the regression of PPT in CWP/FMS, it was found that 16 proteins representing six groups of proteins were significant regressors (R2=0.95, P<0.05). Many of the important proteins were stress and inflammation proteins, enzymes involved in metabolic pathways, and proteins associated with muscle damage, myopathies, and muscle recovery. The altered expression of these proteins may reflect both direct and indirect nociceptive/inflammatory processes as well as secondary changes. The relative importance of the identified proteins and central alterations in CWP need to be investigated in future research. Data from this and the previous study concerning the same cohorts give support to the suggestion that peripheral factors are of importance for maintaining pain aspects in CWP/FMS.
Keywords: chronic widespread pain, proteomics, biomarkers, multivariate data analysis, pain threshold, numeric rating scale
Introduction
Chronic widespread pain (CWP; population prevalence 5%–10%)1–4 including fibromyalgia syndrome (FMS; prevalence 2%–4%)5–7 is associated with pronounced negative personal implications, often treatment resistance and societal consequences. CWP/FMS exhibits morphological and functional alterations in the central nervous system – eg, the pain matrix in the brain and in the descending control of nociception – with clinical signs of central hyperexcitability.5,8–11 Disturbances in neuroendocrine and autonomic nervous systems have also been reported12,13 as well as signs of systemic oxidative stress.14,15 Patients with CWP/FMS generally perceive their pain as originating from the musculoskeletal system, eg, tendons and muscles. The importance of peripheral factors for maintaining the central alterations is under debate; alterations in muscles and nociceptors (ie, small-fiber pathology)16–24 may support a suggestion that peripheral factors act as tonic nociceptive generators and contribute to the maintenance of pain in CWP/FMS.
From a microdialysis study of the painful trapezius muscle in women with CWP/FMS, it was reported that the interstitial concentrations of glutamate and lactate correlated positively with pain intensity and negatively with pressure pain threshold (PPT) of trapezius.25 However, the explained variations (R2) in these regressions were relatively low (15% and 18%, respectively), although significant, which opens up the possibility that the levels of other peripheral factors such as muscle proteins also can be altered in CWP/FMS. Two-dimensional gel electrophoresis (2-DE)26 and mass spectrometry are used for separating and quantifying the protein content of a tissue. Multivariate data analysis (MVDA) including advanced principal component analysis (PCA) and partial least square (PLS) regression are important tools in the field of omics (eg, proteomics and metabolomics). Data sets from the research fields concerning omics are characterized by low subject-to-variables ratios and a large number of intercorrelated molecules/proteins. MVDA has the potential to capture, eg, complex proteome changes that may be present in chronic pain; another advantage is the reduction of multiple testing issues. Even though there are muscle proteomic studies covering different important physiological aspects – eg, aging,27–29 hypoxia,30,31 and exercise32–36 – few studies have explored proteomic alterations in chronically painful muscles.37 Almost a third of the 97 identified proteins from extracellular fluid of the trapezius muscle were at least twofold up- or downregulated in patients with CWP/FMS compared to healthy controls.38 Recently, we reported that certain proteins of muscle biopsies from the trapezius muscle clearly differentiated between CWP/FMS and healthy controls (explained significant variation 85%) in a multivariate manner.39 Registrations of pain intensity and PPT are routine in research and in clinical assessments of patients with pain.40–42 The question arises if these pain characteristics are associated with the proteome of the aching muscle. Hence, this second study of CWP/FMS and healthy controls investigates the relationships between proteins of trapezius muscle biopsies, pain intensity, and PPT.
Material and methods
Subjects
Patients with CWP were recruited for the study, including former patients with CWP at the Pain and Rehabilitation Centre of the University Hospital, Linköping, Sweden, and from an organization for FMS patients. Inclusion criteria were being a female aged between 20 and 65 years and having a diagnosis of CWP and/or FMS according to the American College of Rheumatology criteria.43 Healthy controls (CON) were recruited through advertisement in the local newspaper. Their inclusion criteria were being a female aged between 20 and 65 years and being pain free.
All subjects were clinically examined by either of the two physicians. Exclusion criteria in both groups (CWP and CON) were any kind of anticoagulation use, continuous anti-inflammatory drug use, opioid or steroidal use, bursitis, tendonitis, capsulitis, postoperative conditions in the neck/shoulder area, previous neck trauma, disorder of the spine, neurological disease, rheumatoid arthritis, metabolic disease, malignancy, severe psychiatric illness, or any other systemic diseases, pregnancy, and difficulties understanding the Swedish language. At the end of the recruitment process, 18 women with CWP were included in the study, of whom 15 also fulfilled the criteria for FMS, as were 19 healthy controls. The recruitment process has been described in detail elsewhere.25,44
In our previous proteomic study investigating group differences,39 we reported age and anthropometric data (here presented as mean ±1 standard deviation [SD]): CWP – age (years), 48.6±9.7; height (cm), 167.6±5.1; weight (kg), 76.8±17.3; body mass index (BMI) (kg/m2), 27.2±5.5; CON – age, 41.2±10.6; height, 168.7±7.7; weight, 68.5±12.8; BMI, 23.9±3.1. Significant group differences existed for age (P=0.035) and BMI (P=0.034). Data concerning the included subjects with respect to psychological aspects (anxiety, depression, and catastrophizing) and quality of life have essentially (ie, not exactly equal number of subjects in the two groups in the two studies) been presented elsewhere;25 according to these variables, the CWP group had more intensive psychological symptoms, even though at the group level CWP did not show definite signs of depression or anxiety according to the instrument (Hospital Anxiety and Depression Scale; cut-off values for both subscales depression and anxiety >10) used for capturing this. No significant group difference in quality of life was found.
The number of subjects needed to achieve sufficient power was based on the concentration of interstitial lactate in the trapezius muscle in healthy controls and in patients with chronic trapezius myalgia reported in one of our previous studies.45 Hence, using Power and Sample Size Calculation, version 3.0.2,46 based on the following parameters: α=0.05, power =0.8, difference between groups =1.7, and SD =1.7, we found that 17 subjects in each group were needed. Generally, the number of subjects per group is relatively small in studies within the field of proteomics; for instance, human pain proteomic cerebrospinal fluid studies that report biomarker candidates typically have about ten subjects per group and have hitherto used traditional univariate statistics.47,48
After receiving verbal and written information about the study, all participants signed a consent form that was in accordance with the Declaration of Helsinki. The study was granted ethical clearances by the Regional Ethical Review Board of Linköping (Dnr: M10-08, M233-09, Dnr: 2010/164-32).
Pain intensity
Each subject rated the pain intensity in the neck–shoulder region approximately 2 hours prior to the biopsy using an 11 grade (0–10) numeric rating scale with 2 end points: 0 indicating no pain at all and 10 indicating worst possible pain.49
Pressure pain thresholds
As a part of the clinical examination, PPTs were determined using an electronic pressure algometer (Somedic, Hörby, Sweden). Algometry was conducted approximately 5–7 days before the microbiopsy. The diameter of the contact area was 10 mm, and the pressure was applied perpendicularly to the skin at a speed of 30 kPa/s. The participants were instructed to mark their threshold by pressing a button as the sensation of pressure changed to pain. Algometry was performed bilaterally over the medial, middle, and lateral part of the descending part of the trapezius muscle to determine the PPTs. All measurements were conducted twice in approximately 5-minute intervals. The PPT values were calculated as the mean of these two measurements of lateral, middle, and medial site on the right and left trapezius muscle. In the regression analyses, the mean values of right and left trapezius measurements were used; ie, two Y-variables simultaneously (see “Statistics” section). Before the actual testing, the participants were given instructions and allowed to examine the testing procedure. Note that the PPTs essentially (not exactly the same number of subjects) have been presented elsewhere.25,44
Biopsy collection, preparation, and proteomic analysis
For a full detailed description, see our previous cohort study.39 In short, biopsies were taken using Monopty BARD® microbiopsy instrument (BARD Norden, Helsingborg, Sweden) from the upper trapezius muscle at the midpoint between the seventh cervical vertebra and the acromion for the most painful side; generally the dominant side. If no differences existed the dominant side was used. The tissues were quickly frozen by immersion in isopentane precooled with dry ice and stored at –80°C until analysis. On the day of analysis, the muscle tissues were heat stabilized with Denator Stabilizer T1 (Denator, Göteborg, Sweden), placed in a tube containing urea sample buffer solution, homogenized by sonication, incubated for 2 hours in 4°C, followed by 1 hour centrifugation at 20,000× g. Protein concentration was measured by 2-D Quant Kit (GE Healthcare, Little Chalfont, UK) according to the manufacturer’s instructions.
One hundred micrograms of proteins from each of the samples was analyzed using 2-DE. Separated proteins were detected by silver staining, described elsewhere,50 with a detection limit of about 5 ng/spot.51 The protein patterns were analyzed as digitized images using a charge-coupled device camera (VersaDoc™ Imaging System 4000 MP, Bio-Rad, Hercules, CA, USA) in combination with a computerized imaging 12-bit system designed for evaluations of 2-DE patterns (PDQuest 8.0.1, Bio-Rad). The amount of protein in a spot was assessed as background-corrected optical density, integrated over all pixels in the spot, and expressed as integrated optical density. To correct for differences in total silver stain intensity between different 2-DE images, the amounts of the compared protein spots were quantified as optical density for individual spot per total protein intensity of all valid spots in the same gel. Thereby, ppm values (parts per million) for all proteins were generated and were statistically evaluated.
Significant protein spots were analyzed by mass spectrometry for protein identification using MALDI-TOF (Voyager De Pro, Applied Biosystems, Foster City, CA, USA) and Linear Trap Quadropole Orbitrap Velos Pro hybrid (Thermo Fisher Scientific, Waltham, MA, USA) in conjunction with nanoflow high-performance liquid chromatography system (EASY-Nlc II, Thermo Fisher Scientific). Generated mass spectra were analyzed with MaxQuant Version 1.5 and searched against the human taxonomy of the SwissProt database (released August 2014). Two missed cleavages were allowed, and N-terminal acetylation and methionine oxidation were selected as variable modifications. Fixed modification was carbamidomethylation of cysteine. For mass spectra (MS), an initial mass accuracy of 6 ppm was allowed, and the MS/MS tolerance was set to 0.5 Da. The false discovery rate at the peptide spectrum matched, and protein level was set to 0.01.
Statistics
For comparison of group differences regarding background data, pain thresholds, and pain intensity, one-way analysis of variance (ANOVA) and the nonparametric Mann–Whitney U-test were applied using IBM SPSS v.21.0 (IBM, Armonk, NY, USA) for normal distributed data and for nonnormally distributed data respectively; P<0.05 was considered significant. Effect sizes (Cohen’s d) were calculated using a calculator available on the internet (http://www.uccs.edu/~lbecker/).
The development of Omics methods (ie, large-scale data analysis for the characterization and quantification of biological molecules) has been paralleled by the development of statistical methods like MVDA, which is capable of handling a high number of intercorrelated substances in relatively few individuals.52,53 Traditional univariate statistical methods can quantify level changes of individual substances but disregard interrelationships between them and thereby ignore system-wide aspects. Therefore, when investigating the multivariate correlations between the proteins (X-variables) and pain intensity and pain thresholds (Y-variables), orthogonal partial least squares (OPLS) regression analysis was applied using SIMCA-P+ v.13.0 (UMETRICS, Umeå, Sweden).54 When applying MVDA, we followed the recommendations concerning omics data presented by Wheelock and Wheelock.53
PCA was used prior to this analysis to check for multivariate outliers. PCA can be used to extract and display systematic variation in the data matrix. A cross-validation (CV) technique was used to identify nontrivial components. Variable loading upon the same component is correlated, and variables with high loadings but with different signs are negatively correlated. Significant variables with high loadings (positive or negative) are more important for the component under consideration than variables with lower absolute loadings.54 Two powerful methods are available in SIMCA-P+ for identifying multivariate outliers: 1) score plots in combination with Hotelling’s T2 (identifies strong outliers) and 2) distance to model in X-space (identifies moderate outliers).
OPLS54 was used for the regression analyses using the detected proteins as regressors (X-variables). OPLS separates the systemic variation in X-variables into two parts; one part is correlated and predictive to Y-variable/variables and one is uncorrelated (orthogonal) to Y-variable/variables. Variables were mean centered, scaled for unified variance (UV-scaling), and transformed (log) if necessary. The VIP variable (variable influence on projection) indicates the relevance of each X-variable pooled over all dimensions and Y-variables – the group of variables that best explain Y. VIP>1.0 combined with jack-knifed 95% confidence intervals in the regression coefficients plot not including zero were considered significant. Coefficients (PLS scaled and centered regression coefficients) were used to note the direction of the relationship (positive or negative). In this study, the analysis was made in two steps. First, all proteins were included, and then from this analysis were selected proteins with VIP >1.0 combined with the jack-knifed confidence intervals in the coefficients plot not including zero and used in a new regression presented in the results. The important/significant (VIP >1) proteins were identified. To determine the relative importance of these significant proteins, a separate regression was made only including these proteins as regressors. In the tables, P(corr) for each significant variable is also presented. This is the loading of each variable scaled as a correlation coefficient, and thus standardizing the range from –1 to +1.53 P(corr) is stable during iterative variable selection and comparable between models. An absolute P(corr) >0.4–0.5 is generally considered as significant;53 in the tables absolute P(corr) is presented.
R2 describes the goodness of fit – the fraction of sum of squares of all the variables explained by a principal component.54 Q2 describes the goodness of prediction – the fraction of the total variation of the variables that can be predicted by a principal component using CV methods. R2 should not be considerably higher than Q2. A difference greater than 0.2–0.3 implies overfitting, meaning that the robustness of the model is poor.53 To validate the model, we used cross validated analysis of variance (CV-ANOVA). The returned P-value is indicative of the statistical significance of the investigated model. The presentation of parameters from the MVDA of this study is in accordance with the guidelines presented by Wheelock and Wheelock.53
Multiple linear regression (MLR) could possibly have been an alternative when regressing pain intensity and PPT, but it assumes that the regressor (X) variables are independent. If multicolinearity (ie, high correlations) occurs among the X-variables, the regression coefficients become unstable and their interpretability breaks down. MLR also assumes that a high subject-to-variables ratio is present (eg, >5), and such requirements are not required for PLS; in fact, PLS can handle subject-to-variables ratios <1. Moreover, PLS can, in contrast to MLR, handle several Y-variables simultaneously.
Results
Pain intensity and pain thresholds – univariate statistics
An expected, significant difference in pain intensity with higher levels in CWP was noted (P<0.001). Significantly lower PPTs both at right and left sides of the trapezius in CWP compared to CON (P<0.01) were found (Table 1). PPT of right and left sides showed a high and significant correlation (r=0.94, P<0.001) in all subjects taken together. Cohen’s d clearly showed that PPT was an important variable for separating the two groups of subjects. No significant correlation existed between the two PPTs and pain intensity in CWP (r: 0.23–0.25; nonsignificant).
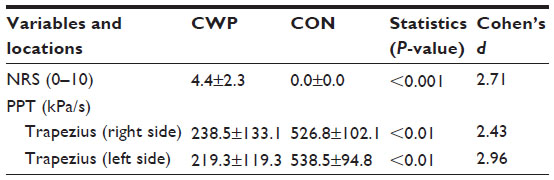 | Table 1 Pain intensity (NRS) and PPT in patients with CWP (n=18) and in CON (n=19) |
Multivariate regression analyses
An unsupervised PCA was performed to check for outliers (three principal components, R2=0.34, Q2=0.08). According to the Hotelling’s T2, T2Crit (0.99%), and the DModX plot (distance to the model in X-space), neither strong nor moderate outliers were found. To evaluate if correlations existed between protein expression (X-variables) and pain characteristics (pain intensity or pain thresholds; Y-variables), OPLS regressions were performed in two steps as already described; in the initial analyses, 216 proteins were included as X-variables (regressors). All analyses except for pain intensity (not possible to perform since CON had no pain.) were done both for all subjects and for the two groups of subjects separately.
To increase the interpretability of the obtained results, proteins of importance for the regressions were schematically divided according to the UniProt database (http://web.expasy.org) definition on biological process in either of six groups: 1) stress and inflammatory (S & I), 2) contractile (C), 3) metabolic (M), 4) structural (S), 5) transport (T), and 6) other (O) proteins.
Regression of pain intensity in CWP
A significant regression – with one predictive component – was found when regressing pain intensity in CWP (R2=0.99, Q2=0.91, CV-ANOVA: P<0.001; Table 2); in the final regression, 12 proteins out of 46 proteins representing five groups (M, C, S, T, and S & I) of proteins were the important regressors. It was found as expected that the majority of the explained variation in pain intensity was due to the significant proteins; when only the significant proteins presented in Table 2 were included in the OPLS regression, a highly significant regression was again obtained (R2=0.79, Q2=0.66, CV-ANOVA: P=0.007).
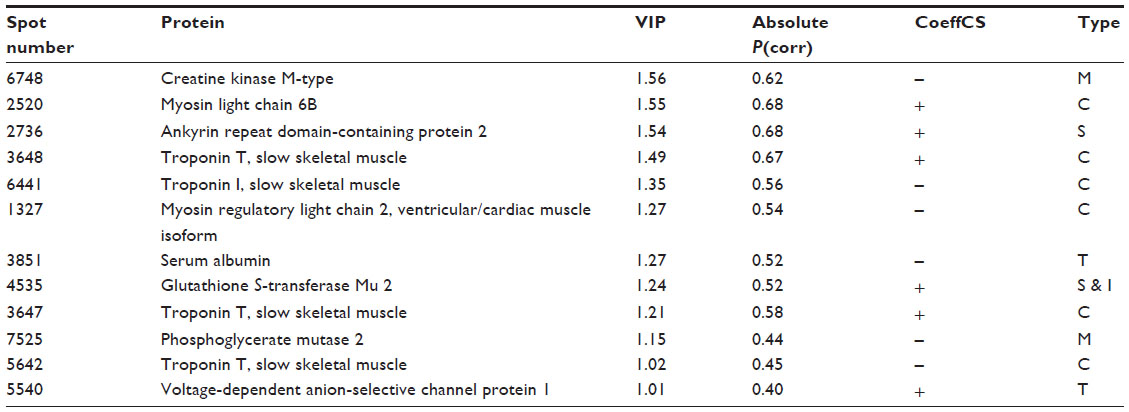 | Table 2 Important/significant proteins found in the significant OPLS model of pain intensity in the CWP group |
Regression of PPTs of trapezius right and left side
A significant regression – with one predictive component – of PPTs bilaterally (ie, 2 Y-variables) was obtained for all subjects taken together (CWP and CON) (R2=0.56, Q2=0.49, CV-ANOVA: P<0.001; Table 3). Hence, in the final model, 11 out of 31 proteins were important regressors representing four different groups of proteins (ie, M, S, T, and S & I). For this regression, it was found that all of the explained variation in PPT was due to the significant proteins; ie, when only the significant proteins (Table 3) were included in the regression, a highly significant regression was obtained (R2=0.56, Q2=0.51, CV-ANOVA: P<0.001).
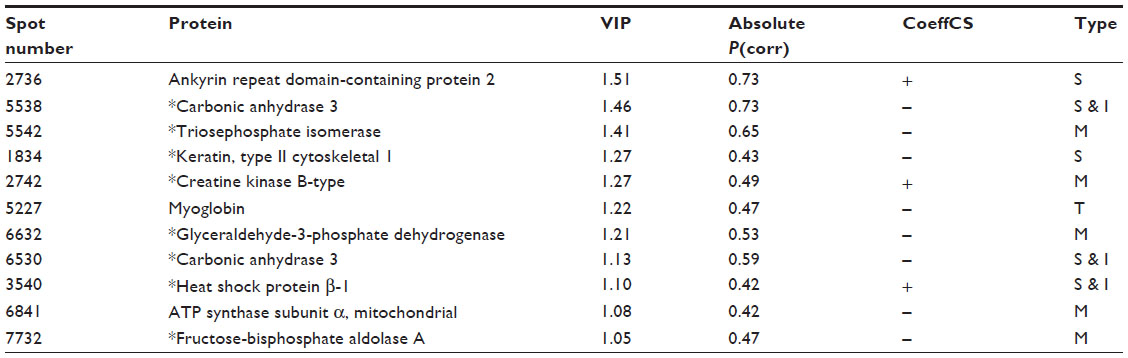 | Table 3 Important/significant proteins found in the significant OPLS regression of PPT of trapezius bilaterally (ie, 2 Y-variables) in all subjects taken together (CWP and CON) |
A significant regression – with two predictive components – was found for PPTs bilaterally in CWP (R2=0.95, Q2=0.81, CV-ANOVA; P<0.05); the main part (>90%) of the explained variation was explained by the first component. In the final regression, 16 out of 45 proteins were significant regressors and represented all six groups of proteins (ie, M, C, S, T, S & I, and O; Table 4). The majority of the explained variation in PPT in CWP was due to the significant proteins; when only the significant proteins (Table 4) were included in an OPLS, a highly significant regression was obtained (R2=0.66, Q2=0.50, CV-ANOVA: P=0.004).
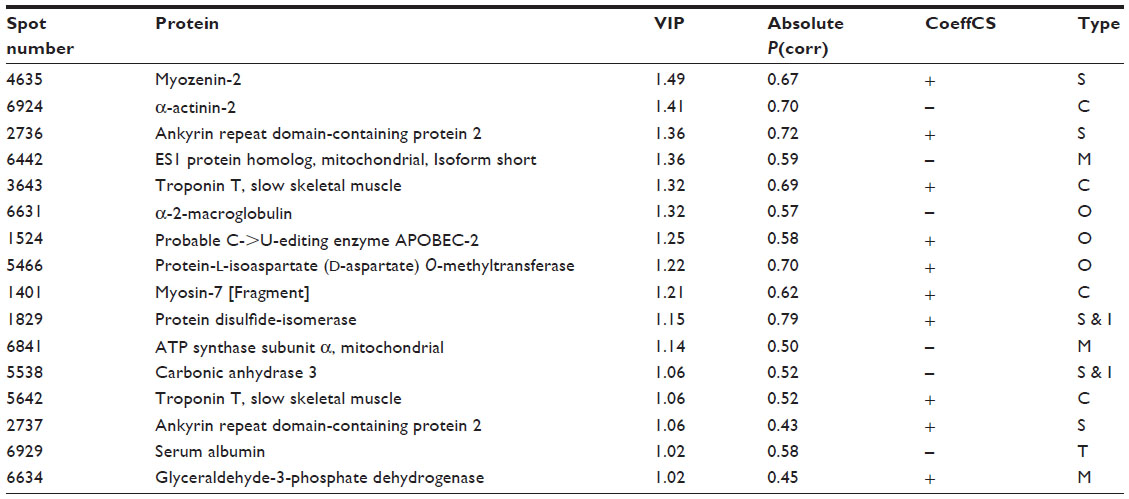 | Table 4 Important/significant proteins found in the significant OPLS model of PPT of trapezius bilaterally (ie, 2 Y variables) in the CWP group |
It was not possible to obtain a significant regression of PPT in CON separately.
Discussion
Proteomics in combination with MVDA were used to determine possible correlations between proteins and pain intensity and pain thresholds for pressure; the following important results were found:
- Pain intensity correlated strongly with 12 proteins from the muscle biopsies of trapezius in CWP (Table 2).
- In all subjects taken together (CWP and CON), 11 proteins representing different functions had the largest importance when regressing PPT (Table 3).
- The variability in PPT of CWP was strongly associated with 16 muscle proteins (Table 4).
In the clinical examination of patients with chronic pain condition pain intensity ratings, basic tests of pain sensitivity, eg, manual palpation of the aching area and tender point examinations, are applied. Psychophysical assessments such as pain thresholds, eg, for pressure, are used additionally for a more detailed assessment of pain sensitivity. Identification of objective biomarkers such as proteins in different tissues has been highlighted as a necessity to facilitate and improve diagnosis of chronic pain conditions.55 It is interesting to note the strong and significant correlations between the muscle protein expressions and the investigated pain characteristics (Tables 2–4). Our results do not exclude that central factors are important for pain intensity and sensitivity; the relative importance of central factors and peripheral protein factors has to be investigated. Even though very strong regressions were obtained in CWP, it must be noted that not only the significant proteins contributed to R2/Q2 (Tables 2–4), but also that the majority of the explained variations were due to the significant proteins. The question may arise if the obtained significant regressions are overfitted. It has been stated that if R2 is substantially greater than Q2 (a difference >0.3 is mentioned in the literature52), the robustness of the regression is poor, implying overfitting.53 In this study, only small differences existed between R2 and Q2 (Tables 2–4). Our results must be critically viewed, and there is certainly a need for confirmatory studies both in men and women, which also include possible confounders such as physical fitness, eg, strength and endurance. When interpreting the results, it must be kept in mind that this is a cross-sectional study and that the significant proteins may represent both direct and indirect nociceptive and inflammatory processes as well as secondary changes due to deconditioning, disuse, etc. This study had an explorative approach, and in future studies it is important to understand the biological constructs underlying the significant proteins. Furthermore, as exemplified below, the characterization of proteins according to the UniProt database, even though good for an overview, do not take into consideration that a certain protein can have several functions.
Regression of PPT in CWP and CON
Marked group differences in PPTs existed as reported elsewhere,25,44 with large effect sizes (Cohen’s d) for PPT (Table 1), ie, PPTs to a large extent can differentiate the two groups of subjects. An assumption that similar patterns of important proteins exist for the regression of group membership39 and the present regression of PPTs in all subjects was confirmed since eight of the significant proteins in Table 3 were also important for group differentiating.39 In the regression of group membership was found eleven upregulated (ATP synthase subunit β, mitochondrial; triosephosphate isomerase; fructose-bisphosphate aldolase A; keratin, type II cytoskeletal 1; fructose-bisphosphate aldolase A; myosin light chain 1/3, skeletal muscle isoform; alpha-crystallin B chain; pyruvate kinase PKM; carbonic anhydrase 3; glyceraldehyde-3-phosphate dehydrogenase; myosin light chain 3.) and six downregulated (Creatine kinase B-type; protein disulfide-isomerase; adenylate kinase isoenzyme 1; desmin; glutathione S-transferase Mu 2; heat shock protein β-1.) proteins in CWP,39 which indicated alterations in stress and inflammation, in metabolic pathways, and in processes associated with muscle damage and recovery.39 In contrast to group membership, PPTs are continuous variables, which may explain the lower explained variation (R2=0.56 vs R2=0.85). Possibly related to these variations, three other proteins had importance, and two of these had greater importance, ie, ankyrin repeat domain-containing protein 2 and myoglobin (Table 3). The former was the most important regressor; low quantities of this protein was associated with low PPTs. Muscle ankyrin repeat proteins are primarily involved in the defense of the cells against injuries (Figure 1).56 Ankyrin repeat domain-containing protein 2 is a negative regulator of myocyte differentiation.57,58 When the muscle cell is induced to oxidative stress, a posttranslational modification, phosphorylation at Ser-99 by AKT2 signaling pathway, is triggered, which in turn induces a translocation of the protein from the sarcomere to the nucleus of myofibers, thus preventing the outcome of muscle differentiation (Figure 1).57,58 Ankyrin repeat domain-containing protein 2 has also been identified as a potent repressor/regulator of inflammatory responses through NF-κB repressor subunit p50.59 The recruitment of p50 by the ankyrin protein is dependent on the AKT2-mediated phosphorylation of ankyrin repeat domain-containing protein 2 upon oxidative stress during myogenic differentiation (Figure 1). Activation of NF-κB results in an increased expression of cytokines, chemokines, growth factors, and adhesion molecules.60,61 Dysregulation of NF-κB pathways is associated with diseases such as arthritis, autoimmunity, and cancer.61 Increased activation of NF-κB has been reported in muscles of FMS patients.60 NF-κB is also an important signaling pathway linked to the loss of skeletal muscle mass.62 Triosephosphate isomerase acts as an enzyme of glycolysis and is important for efficient energy production in the cell (Figure 1). Carbonic anhydrase 363–65 and heat shock protein β-166 are suggested to have antioxidative effects and were also important regressors (Table 3 and Figure 1). Carbonic anhydrase 3 is also a specific marker for skeletal muscle damage and is released into circulation63 (Figure 1).
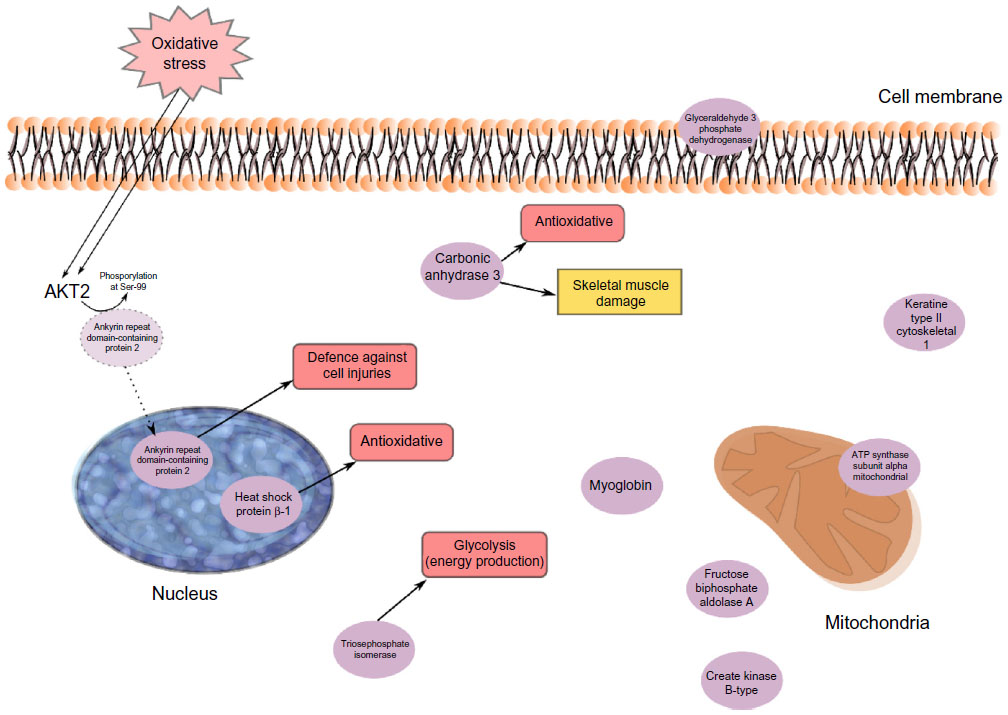 | Figure 1 An overview of the significant proteins from the regression model of PPT in CWP and CON taken together. |
To summarize, the regression of PPTs in all subjects to a great extent confirms the results recently reported for group membership39 and links alterations in stress and inflammatory and metabolic muscle proteins to low PPT.
Regression of PPT in CWP
Contractile, structural, and stress/inflammatory proteins were important for PPTs in CWP separately (Table 4). Two isoforms of ankyrin repeat domain-containing protein 2 (as discussed in the “Regression of PPT in CWP and CON” section) were positively correlated with PPT in CWP. α-2-macroglobulin (negatively correlated) is an acute-phase protein and acts as a protease inhibitor and carrier for several growth factors and cytokines, including TNF-α, IL-1β, IL-6, and TGF-β67 (Figure 2). Protein disulfide-isomerase (positively correlated) catalyzes the sulfide bonds in proteins and also functions as a chaperone, which inhibits the aggregation of other proteins.68 Other important proteins in this regression were myozenin-2 (positively correlated) and α-actinin-2 (negatively correlated). The skeletal muscle isoform α-actinin-2 is mainly concentrated in the Z-band together with proteins like myozenin and is involved in binding myofibrillar actin filaments. Myozenin-2 has an active role in the regulation of calcineurin (a T-cell activator) signaling and has been suggested as being a part of the myofibrillogenesis69 (Figure 2). To conclude, several of the important proteins for PPT in CWP are involved in stress and inflammatory aspects of muscles. How these proteins are related to the contractile proteins warrants further investigations.
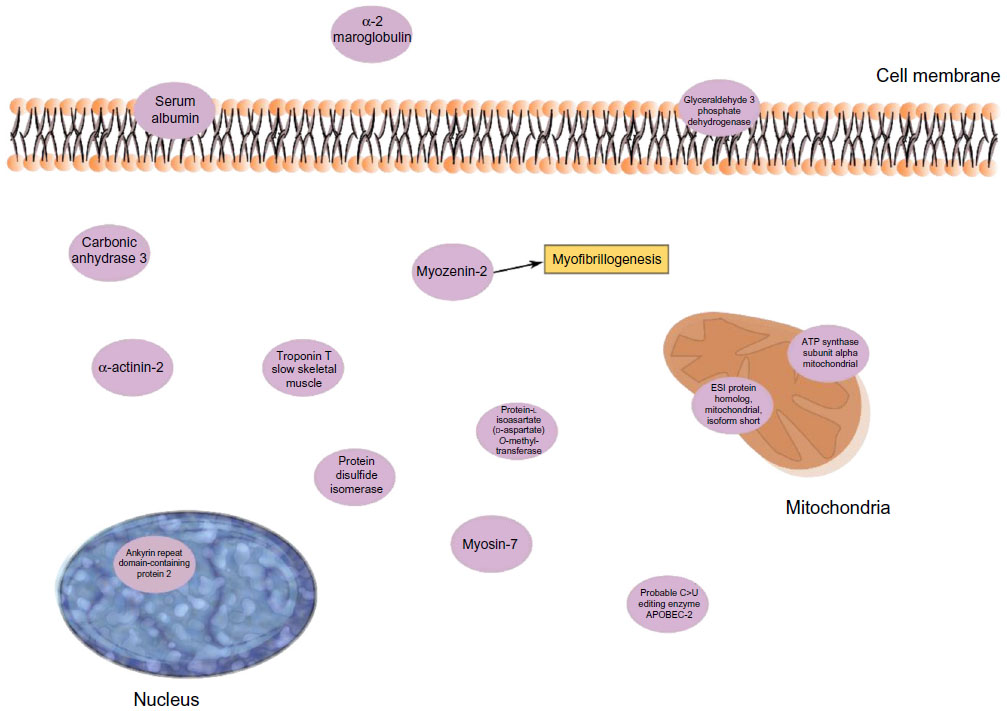 | Figure 2 Important proteins from the regression of PPT of the CWP group. |
Regression of pain intensity in CWP
Also, in this regression, ankyrin repeat domain-containing protein 2 was a significant protein and correlated positively with pain intensity in CWP (Table 2). Glutathione S-transferase Mu 2 (positively correlated) is involved in the detoxification of products from oxidative stress70 (Figure 3). Creatine kinases are expressed in a wide variety of tissue and often those with high energy demands such as skeletal muscle. It catalyzes the conversion of creatine to phosphocreatine, a reaction that consumes a phosphate by reducing adenosine triphosphate (ATP) to adenosine diphosphate (ADP)63 (Figure 3). Decreased levels of one creatine kinase (B-type) in CWP was previously found,39 which may be associated both with lower levels of ATP and low muscle pH. Low ATP and low phosphocreatine levels have been reported from the quadriceps muscle of FMS patients.71 Myosin light chain 6B has been associated with skeletal muscle atrophy in chronic obstructive pulmonary disease.72 Mutations of myosin light chains have also been associated with rare human myopathies73 (Figure 3). Several skeletal isoforms of troponin T together with troponin I were significant regressors of pain intensity. Increased levels of skeletal troponin I and skeletal troponin T have been found in chronic muscle diseases, eg, polymyositis and dermatomyositis.74,75 Three isoforms of troponin T were significant, and those with highest correlations were positively correlated with pain intensity. Furthermore, on measurement of plasma, elevated levels of troponin T have been found in patients with chronic muscle disease.75 To summarize, a complex pattern of stress and inflammatory proteins together with contractile and metabolic proteins correlated with pain intensity in CWP.
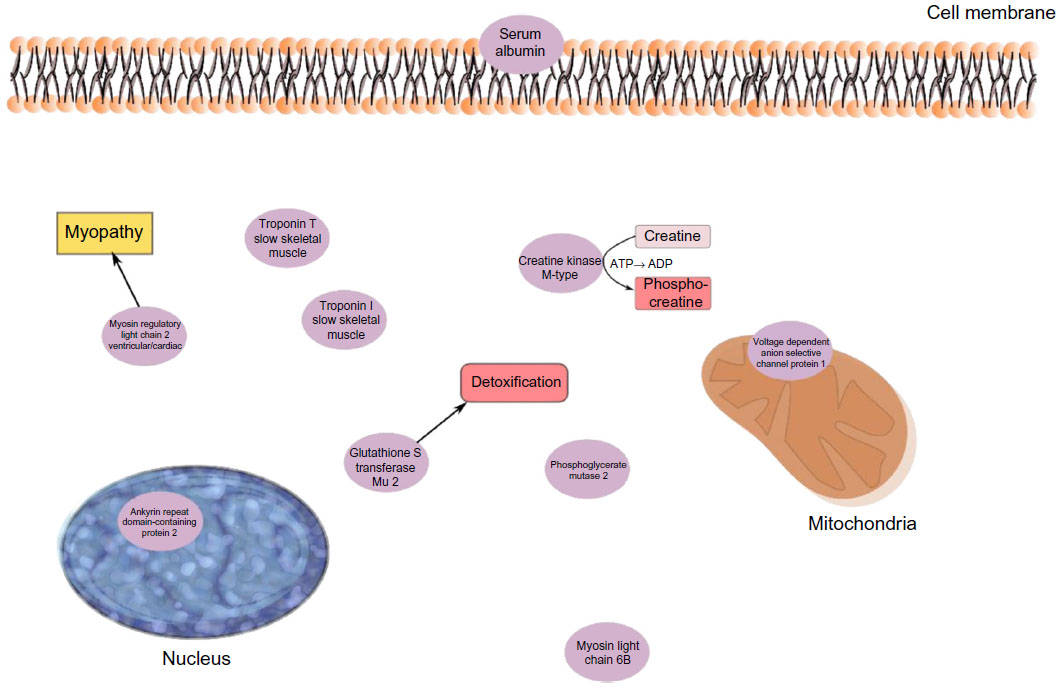 | Figure 3 The significant proteins from the regression model of pain intensity in the CWP group. |
Conclusions and possible clinical implications
Proteomics in combination with MVDA is a potent tool for identifying potential biomarkers or bioclusters in the chronic pain research area; several proteins of the myalgic trapezius muscle were identified that correlated with pain intensity and pain sensitivity in CWP. These proteins were stress and inflammation proteins, enzymes involved in metabolic pathways, and proteins associated with muscle damage, myopathies, and muscle recovery. The altered expression of these proteins reasonably reflects both direct and indirect nociceptive/inflammatory processes as well as secondary changes. Confirmatory studies both in women and men are needed, taking into account possible confounders, and studies of the relative importance of the important proteins and central alterations for pain characteristics in CWP are also needed. Chronic pain is a complex phenomenon, and a biopsychosocial model is applied in clinical practice. This study adds information about the biological aspects, especially in the periphery (muscle). Such information can be of importance for designing treatment and rehabilitation interventions.
Acknowledgments
We gratefully appreciate our tissue donors for this study. Furthermore, we thank research nurse Eva-Britt Lind, Pain and Rehabilitation Centre, UHL, County Council of ØstergØtland, SE-581 85 Linköping, Sweden, for valuable help with the sample collection. This study was supported by the Swedish Council for Working Life and Social Research, the Swedish Research Council Medical Research Council of Southeast Sweden and AFA Insurance. The funders had no role in study design, data collection and analysis, decision to publish, or preparation of the manuscript.
Disclosure
The authors declare no conflicts of interest in this work.
References
Bergman S, Herrstrom P, Hogstrom K, Petersson IF, Svensson B, Jacobsson LT. Chronic musculoskeletal pain, prevalence rates, and sociodemographic associations in a Swedish population study. J Rheumatol. 2001;28(6):1369–1377. | |
Croft P, Rigby AS, Boswell R, Schollum J, Silman A. The prevalence of chronic widespread pain in the general population. J Rheumatol. 1993;20(4):710–713. | |
Cimmino MA, Ferrone C, Cutolo M. Epidemiology of chronic musculoskeletal pain. Best Pract Res Clin Rheumatol. 2011;25(2):173–183. | |
Mourao AF, Blyth FM, Branco JC. Generalised musculoskeletal pain syndromes. Best Pract Res Clin Rheumatol. 2010;24(6):829–840. | |
Staud R. Peripheral pain mechanisms in chronic widespread pain. Best Pract Res Clin Rheumatol. 2011;25(2):155–164. | |
Lindell L, Bergman S, Petersson IF, Jacobsson LT, Herrstrom P. Prevalence of fibromyalgia and chronic widespread pain. Scand J Prim Health Care. 2000;18(3):149–153. | |
Gerdle B, Gronlund C, Karlsson S, Holtermann A, Roeleveld K. Altered neuromuscular control mechanisms of the trapezius muscle in fibromyalgia. BMC Musculoskelet Disord. 2010;11(1):42. | |
Staud R, Craggs JG, Perlstein WM, Robinson ME, Price DD. Brain activity associated with slow temporal summation of C-fiber evoked pain in fibromyalgia patients and healthy controls. Eur J Pain. 2008;12(8):1078–1089. | |
Staud R. Brain imaging in fibromyalgia syndrome. Clin Exp Rheumatol. 2011;29(6 Suppl 69):S109–S117. | |
Schweinhardt P, Bushnell MC. Pain imaging in health and disease – how far have we come? J Clin Invest. 2010;120(11):3788–3797. | |
Napadow V, Kim J, Clauw DJ, Harris RE. Decreased intrinsic brain connectivity is associated with reduced clinical pain in fibromyalgia. Arthritis Rheum. 2012;64(7):2398–2403. | |
Adler GK, Geenen R. Hypothalamic-pituitary-adrenal and autonomic nervous system functioning in fibromyalgia. Rheum Dis Clin North Am. 2005;31(1):187–202, xi. | |
Dessein PH, Shipton EA, Stanwix AE, Joffe BI. Neuroendocrine deficiency-mediated development and persistence of pain in fibromyalgia: a promising paradigm? Pain. 2000;86(3):213–215. | |
Fatima G, Das SK, Mahdi AA. Some oxidative and antioxidative parameters and their relationship with clinical symptoms in women with fibromyalgia syndrome. Int J Rheum Dis. Epub July 14, 2015. | |
Eisinger J, Gandolfo C, Zakarian H, Ayavou T. Reactive oxygen species, antioxidant status and fibromyalgia. J Musculoskelet Pain. 1997;5:5–15. | |
Bengtsson A. Editorial, the muscle in fibromyalgia. Rheumatol. 2002;41:721–724. | |
Sandberg M, Larsson B, Lindberg LG, Gerdle B. Different patterns of blood flow response in the trapezius muscle following needle stimulation (acupuncture) between healthy subjects and patients with fibromyalgia and work-related trapezius myalgia. Eur J Pain. 2005;9(5):497–510. | |
Sandberg M, Lindberg LG, Gerdle B. Peripheral effects of needle stimulation (acupuncture) on skin and muscle blood flow in fibromyalgia. Eur J Pain. 2004;8(2):163–171. | |
Bengtsson A, Henriksson KG, Larsson J. Muscle biopsy in primary fibromyalgia. Light-microscopical and histochemical findings. Scand J Rheumatol. 1986;15(1):1–6. | |
Sprott H, Salemi S, Gay RE, et al. Increased DNA fragmentation and ultrastructural changes in fibromyalgic muscle fibres. Ann Rheum Dis. 2004;63(3):245–251. | |
Visser B, van Dieen JH. Pathophysiology of upper extremity muscle disorders. J Electromyogr Kinesiol. 2006;16(1):1–16. | |
Oaklander AL, Herzog ZD, Downs HM, Klein MM. Objective evidence that small-fiber polyneuropathy underlies some illnesses currently labeled as fibromyalgia. Pain. 2013;154(11):2310–2316. | |
Serra J, Collado A, Sola R, et al. Hyperexcitable C nociceptors in fibromyalgia. Ann Neurol. 2014;75(2):196–208. | |
Uceyler N, Zeller D, Kahn AK, et al. Small fibre pathology in patients with fibromyalgia syndrome. Brain. 2013;136(Pt 6):1857–1867. | |
Gerdle B, Larsson B, Forsberg F, et al. Chronic widespread pain: increased glutamate and lactate concentrations in the trapezius muscle and plasma. Clin J Pain. 2014;30(5):409–420. | |
Gorg A, Drews O, Luck C, Weiland F, Weiss W. 2-DE with IPGs. Electrophoresis. 2009;30(Suppl 1):S122–S132. | |
Marx JO, Kraemer WJ, Nindl BC, Larsson L. Effects of aging on human skeletal muscle myosin heavy-chain mRNA content and protein isoform expression. J Gerontol A Biol Sci Med Sci. 2002;57(6):B232–B238. | |
Terman A, Brunk UT. Lipofuscin: mechanisms of formation and increase with age. APMIS. 1998;106(2):265–276. | |
Boffoli D, Scacco SC, Vergari R, Solarino G, Santacroce G, Papa S. Decline with age of the respiratory chain activity in human skeletal muscle. Biochim Biophys Acta. 1994;1226(1):73–82. | |
Gelfi C, De Palma S, Ripamonti M, et al. New aspects of altitude adaptation in Tibetans: a proteomic approach. FASEB J. 2004; 18(3):612–614. | |
Vigano A, Ripamonti M, De Palma S, et al. Proteins modulation in human skeletal muscle in the early phase of adaptation to hypobaric hypoxia. Proteomics. 2008;8(22):4668–4679. | |
Holloway KV, O’Gorman M, Woods P, et al. Proteomic investigation of changes in human vastus lateralis muscle in response to interval-exercise training. Proteomics. 2009;9(22):5155–5174. | |
Hody S, Leprince P, Sergeant K, et al. Human muscle proteome modifications after acute or repeated eccentric exercises. Med Sci Sports Exerc. 2011;43(12):2281–2296. | |
Burgomaster KA, Howarth KR, Phillips SM, et al. Similar metabolic adaptations during exercise after low volume sprint interval and traditional endurance training in humans. J Physiol. 2008;586(1):151–160. | |
Burniston JG. Changes in the rat skeletal muscle proteome induced by moderate-intensity endurance exercise. Biochim Biophys Acta. 2008;1784(7–8):1077–1086. | |
Takahashi M, Kubota S. Exercise-related novel gene is involved in myoblast differentiation. Biomed Res. 2005;26(2):79–85. | |
Hadrevi J, Ghafouri B, Larsson B, Gerdle B, Hellstrom F. Multivariate modeling of proteins related to trapezius myalgia, a comparative study of female cleaners with or without pain. PLoS One. 2013;8(9):e73285. | |
Olausson P, Gerdle B, Ghafouri N, Larsson B, Ghafouri B. Identification of proteins from interstitium of trapezius muscle in women with chronic myalgia using microdialysis in combination with proteomics. PLoS One. 2012;7(12):e52560. | |
Olausson P, Gerdle B, Ghafouri N, Sjostrom D, Blixt E, Ghafouri B. Protein alterations in women with chronic widespread pain – an explorative proteomic study of the trapezius muscle. Sci Rep. 2015;5:11894. | |
Vanderweeen L, Oostendorp RA, Vaes P, Duquet W. Pressure algometry in manual therapy. Man Ther. 1996;1(5):258–265. | |
Fruhstorfer H, Lindblom U, Schmidt WC. Method for quantitative estimation of thermal thresholds in patients. J Neurol Neurosurg Psychiatry. 1976;39(11):1071–1075. | |
Goransson KE, Heilborn U, Selberg J, von Scheele S, Djarv T. Pain rating in the ED – a comparison between 2 scales in a Swedish hospital. Am J Emerg Med. 2015;33(3):419–422. | |
Wolfe F, Smythe H, Yunus M, et al. The American college of rheumatology 1990 Criteria for the classification of fibromyalgia – report of the multicenter criteria committee. Arthritis Rheum. 1990;33:160–172. | |
Ghafouri N, Ghafouri B, Larsson B, Stensson N, Fowler CJ, Gerdle B. Palmitoylethanolamide and stearoylethanolamide levels in the interstitium of the trapezius muscle of women with chronic widespread pain and chronic neck-shoulder pain correlate with pain intensity and sensitivity. Pain. 2013;154(9):1649–1658. | |
Rosendal L, Larsson B, Kristiansen J, et al. Increase in muscle nociceptive substances and anaerobic metabolism in patients with trapezius myalgia: microdialysis in rest and during exercise. Pain. 2004;112(3):324–334. | |
Dupont WD, Plummer WD Jr. Power and sample size calculations. A review and computer program. Control Clin Trials. 1990;11(2):116–128. | |
Conti A, Ricchiuto P, Iannaccone S, et al. Pigment epithelium-derived factor is differentially expressed in peripheral neuropathies. Proteomics. 2005;5(17):4558–4567. | |
Liu X, Zeng B, Xu J, Zhu H, Xia Q. Proteomic analysis of the cerebrospinal fluid of patients with lumbar disk herniation. Proteomics. 2006;6(3):1019–1028. | |
Ferreira-Valente MA, Pais-Ribeiro JL, Jensen MP. Validity of four pain intensity rating scales. Pain. 2011;152(10):2399–2404. | |
Shevchenko A, Wilm M, Vorm O, Mann M. Mass spectrometric sequencing of proteins silver-stained polyacrylamide gels. Anal Chem. 1996;68(5):850–858. | |
Swain M, Ross NW. A silver stain protocol for proteins yielding high resolution and transparent background in sodium dodecyl sulfate-polyacrylamide gels. Electrophoresis. 1995;16(6):948–951. | |
Eriksson L, Byrne T, Johansson E, Trygg J, Vikström C. Multi- and Megavariate Data Analysis: Basic Principles and Applications. 3rd revised ed. Malmö, Sweden: MKS Umetrics AB; 2013. | |
Wheelock AM, Wheelock CE. Trials and tribulations of ‘omics data analysis: assessing quality of SIMCA-based multivariate models using examples from pulmonary medicine. Mol Biosyst. 2013;9(11):2589–2596. | |
Eriksson L, Johansson E, Kettaneh-Wold N, Trygg J, Wikström C, Wold S. Multi- and Megavariate Data analysis; Part I and II. 2nd ed. Umeå, Sweden: Umetrics AB; 2006. | |
Chizh BA, Greenspan JD, Casey KL, Nemenov MI, Treede RD. Identifying biological markers of activity in human nociceptive pathways to facilitate analgesic drug development. Pain. 2008;140(2):249–253. | |
Proske U, Morgan DL. Muscle damage from eccentric exercise: mechanism, mechanical signs, adaptation and clinical applications. J Physiol. 2001;537(Pt 2):333–345. | |
Belgrano A, Rakicevic L, Mittempergher L, et al. Multi-tasking role of the mechanosensing protein Ankrd2 in the signaling network of striated muscle. PLoS One. 2011;6(10):e25519. | |
Cenni V, Bavelloni A, Beretti F, et al. Ankrd2/ARPP is a novel Akt2 specific substrate and regulates myogenic differentiation upon cellular exposure to H2O2. Mol Biol Cell. 2011;22(16):2946–2956. | |
Bean C, Verma NK, Yamamoto DL, et al. Ankrd2 is a modulator of NF-[kappa]B-mediated inflammatory responses during muscle differentiation. Cell Death Dis. 2014;5:e1002. | |
Ruster M, Franke S, Spath M, Pongratz DE, Stein G, Hein GE. Detection of elevated N epsilon-carboxymethyllysine levels in muscular tissue and in serum of patients with fibromyalgia. Scand J Rheumatol. 2005;34(6):460–463. | |
Oeckinghaus A, Ghosh S. The NF-kappaB family of transcription factors and its regulation. Cold Spring Harb Perspect Biol. 2009; 1(4):a000034. | |
Li H, Malhotra S, Kumar A. Nuclear factor-kappa B signaling in skeletal muscle atrophy. J Mol Med (Berl). 2008;86(10):1113–1126. | |
Brancaccio P, Lippi G, Maffulli N. Biochemical markers of muscular damage. Clin Chem Lab Med. 2010;48(6):757–767. | |
Zimmerman U-JP, Wang P, Zhang X, Bogdanovich S, Forster RE. Anti-oxidative response of carbonic anhydrase III in skeletal muscle. IUBMB Life. 2004;56(6):343–347. | |
Cabiscol E, Levine RL. Carbonic anhydrase III. Oxidative modification in vivo and loss of phosphatase activity during aging. J Biol Chem. 1995;270(24):14742–14747. | |
Matsumoto T, Urushido M, Ide H, et al. Small heat shock protein beta-1 (HSPB1) is upregulated and regulates autophagy and apoptosis of renal tubular cells in acute kidney injury. PLoS One. 2015;10(5):e0126229. | |
Feinman RD. The proteinase-binding reaction of alpha 2M. Ann N Y Acad Sci. 1994;737:245–266. | |
Lumb RA, Bulleid NJ. Is protein disulfide isomerase a redox-dependent molecular chaperone? EMBO J. 2002;21(24):6763–6770. | |
Takada F, Woude DLV, Tong H-Q, et al. Myozenin: an α-actinin- and γ-filamin-binding protein of skeletal muscle Z lines. Proc Natl Acad Sci U S A. 2001;98(4):1595–1600. | |
Baez S, Segura-Aguilar J, Widersten M, Johansson AS, Mannervik B. Glutathione transferases catalyse the detoxication of oxidized metabolites (o-quinones) of catecholamines and may serve as an antioxidant system preventing degenerative cellular processes. Biochem J. 1997;324(Pt 1):25–28. | |
Gerdle B, Forsgren MF, Bengtsson A, et al. Decreased muscle concentrations of ATP and PCR in the quadriceps muscle of fibromyalgia patients – a 31P-MRS study. Eur J Pain. 2013;17(8):1205–1215. | |
Guo W, Fu WP, Yang Y, Dai LM. [Preliminary proteomic analysis of peripheral skeletal muscle atrophy in chronic obstructive pulmonary disease]. Zhonghua Yi Xue Za Zhi. 2012;92(14):948–951. Chinese. | |
Poetter K, Jiang H, Hassanzadeh S, et al. Mutations in either the essential or regulatory light chains of myosin are associated with a rare myopathy in human heart and skeletal muscle. Nat Genet. 1996;13(1):63–69. | |
Kiely PD, Bruckner FE, Nisbet JA, Daghir A. Serum skeletal troponin I in inflammatory muscle disease: relation to creatine kinase, CKMB and cardiac troponin I. Ann Rheum Dis. 2000;59(9):750–751. | |
Prellwitz W, Hafner G, Rupprecht HJ, Meyer J. Diagnostic and differential diagnostic value of troponins. Med Klin (Munich). 1996;91(6):336–342. German. |
 © 2016 The Author(s). This work is published and licensed by Dove Medical Press Limited. The full terms of this license are available at https://www.dovepress.com/terms.php and incorporate the Creative Commons Attribution - Non Commercial (unported, v3.0) License.
By accessing the work you hereby accept the Terms. Non-commercial uses of the work are permitted without any further permission from Dove Medical Press Limited, provided the work is properly attributed. For permission for commercial use of this work, please see paragraphs 4.2 and 5 of our Terms.
© 2016 The Author(s). This work is published and licensed by Dove Medical Press Limited. The full terms of this license are available at https://www.dovepress.com/terms.php and incorporate the Creative Commons Attribution - Non Commercial (unported, v3.0) License.
By accessing the work you hereby accept the Terms. Non-commercial uses of the work are permitted without any further permission from Dove Medical Press Limited, provided the work is properly attributed. For permission for commercial use of this work, please see paragraphs 4.2 and 5 of our Terms.