")
Back to Journals » Diabetes, Metabolic Syndrome and Obesity » Volume 8
Specific cut-off points for waist circumference and waist-to-height ratio as predictors of cardiometabolic risk in Black subjects: a cross-sectional study in Benin and Haiti
Authors El Mabchour A, Delisle H, Vilgrain C, Larco P, Sodjinou R, Batal M
Received 20 May 2015
Accepted for publication 23 July 2015
Published 23 October 2015 Volume 2015:8 Pages 513—523
DOI https://doi.org/10.2147/DMSO.S88893
Checked for plagiarism Yes
Review by Single anonymous peer review
Peer reviewer comments 3
Editor who approved publication: Professor Ming-Hui Zou
Asma EL Mabchour,1 Hélène Delisle,1 Colette Vilgrain,2 Philippe Larco,2 Roger Sodjinou,3 Malek Batal1
1Transition Nutritionnelle (TRANSNUT), WHO Collaborating Centre on Nutrition Changes and Development, Department of Nutrition, Faculty of Medicine, University of Montreal, Montreal, QC, Canada; 2Haitian Foundation for Diabetes and Cardiovascular Diseases (FHADIMAC), Port-au-Prince, Haiti; 3West Africa Health Organization (WAHO), Bobo-Dioulasso, Burkina Faso
Purpose: Waist circumference (WC) and waist-to-height ratio (WHtR) are widely used as indicators of abdominal adiposity and the cut-off values have been validated primarily in Caucasians. In this study we identified the WC and WHtR cut-off points that best predicted cardiometabolic risk (CMR) in groups of African (Benin) and African ancestry (Haiti) Black subjects.
Methods: This cross-sectional study included 452 apparently healthy subjects from Cotonou (Benin) and Port-au-Prince (Haiti), 217 women and 235 men from 25 to 60 years. CMR biomarkers were the metabolic syndrome components. Additional CMR biomarkers were a high atherogenicity index (total serum cholesterol/high density lipoprotein cholesterol ≥4 in women and ≥5 in men); insulin resistance set at the 75th percentile of the calculated Homeostasis Model Assessment index (HOMA-IR); and inflammation defined as high-sensitivity C-reactive protein (hsCRP) concentrations between 3 and 10 mg/L. WC and WHtR were tested as predictors of two out of the three most prevalent CMR biomarkers. Receiver operating characteristic (ROC) curves, Youden's index, and likelihood ratios were used to assess the performance of specific WC and WHtR cut-offs.
Results: High atherogenicity index (59.5%), high blood pressure (23.2%), and insulin resistance (25% by definition) were the most prevalent CMR biomarkers in the study groups. WC and WHtR were equally valid as predictors of CMR. Optimal WC cut-offs were 80 cm and 94 cm in men and women, respectively, which is exactly the reverse of the generic cut-offs. The standard 0.50 cut-off of WHtR appeared valid for men, but it had to be increased to 0.59 in women.
Conclusion: CMR was widespread in these population groups. The present study suggests that in order to identify Africans with high CMR, WC thresholds will have to be increased in women and lowered in men. Data on larger samples are needed.
Keywords: abdominal obesity, ROC curves, Youden’s index, Africans
Introduction
Abdominal obesity (AO) is a central component of the metabolic syndrome (MetS)1 and a predictor of several cardiometabolic abnormalities.2 To assess AO and thereby identify subjects at cardiometabolic risk (CMR), anthropometric indicators such as waist circumference (WC) and waist-to-height ratio (WHtR) remain simple, inexpensive, non-invasive, and validated methods to apply in clinical practice.3 The WC thresholds presently used to detect AO in African and African-descent subjects are those that have been validated primarily in European populations (≥94 cm in men and ≥80 cm in women), in the absence of specific cut-offs.1 This may not be optimal, as several studies have clearly shown that there are differences in patterns of fat distribution between Whites and Blacks.4–6 Furthermore, it has been established that for a given level of overweight/obesity, WC values are lower in Blacks compared with Whites.7 The WHtR has been proposed as an alternative AO indicator which may correct the overestimation or underestimation of CMR with WC in short or tall people by virtue of the adjustment for height. An advantage is that the threshold for WHtR is a single value of 0.5 regardless of age,8 sex, and ethnicity,9 which is promising for Africans. However, it has been largely validated in Caucasians and Asians,10,11 but not Africans. Over the last decades, sub-Saharan Africans have been undergoing a nutrition transition where rates of AO have increased dramatically, yet population-specific standards for classifying individuals remain available.12 More research on AO and its relationship with CMR in various Black population groups is needed in order for specific WC and WHtR thresholds to be identified and for results of recent studies to be supported13–15 as there are undeniable race-ethnicity differences in body composition and associated CMR, as already alluded to. Additionally, many studies have suggested that the MetS as currently defined may not be appropriate to forecast cardiovascular disease and type-2 diabetes risk in Africans.16–18 Indeed, Black Africans tend to show more insulin resistance, and a higher prevalence of hypertension and low high density lipoprotein cholesterol (HDL-C) levels, but lower rates of hypertriglyceridemia than their Whites counterparts.19,20 Hence, it appears relevant to assess AO indicators against the most prevalent biomarkers of CMR in African and African-descent groups rather than against standard MetS components.
The purpose of the present study was to compare the validity of WC and WHtR as AO indicators and to define cut-off points that best predict CMR in West Africans and closely related Black Haitians, based on the most prevalent biomarkers of CMR in these population groups, namely, elevated blood pressure, insulin resistance, and a high atherogenicity index, as described elsewhere by our research group.21,22
Materials and methods
Population samples and data collection
This cross-sectional study is based on data from the Nutrition Transition Multicenter Study conducted in the economic capital of Benin (Cotonou) between 2005 and 2006, with a population of 665,100 according to the last census23 and in the capital city of Port-au-Prince (PAP) in Haiti between 2008 and 2009, with an estimated population of over two million.24,25 The total sample consisted of 452 apparently healthy Black ancestry subjects aged from 25 to 60 years (217 women and 235 men) who had been living in the study area for at least six months prior to the study. The subjects were selected by stratified cluster random sampling within each study setting, with 200 subjects in Cotonou and 252 subjects in PAP (Figure 1). Subjects previously diagnosed or treated for hypertension, diabetes, or a heart condition were excluded from the study, as well as pregnant and lactating women.
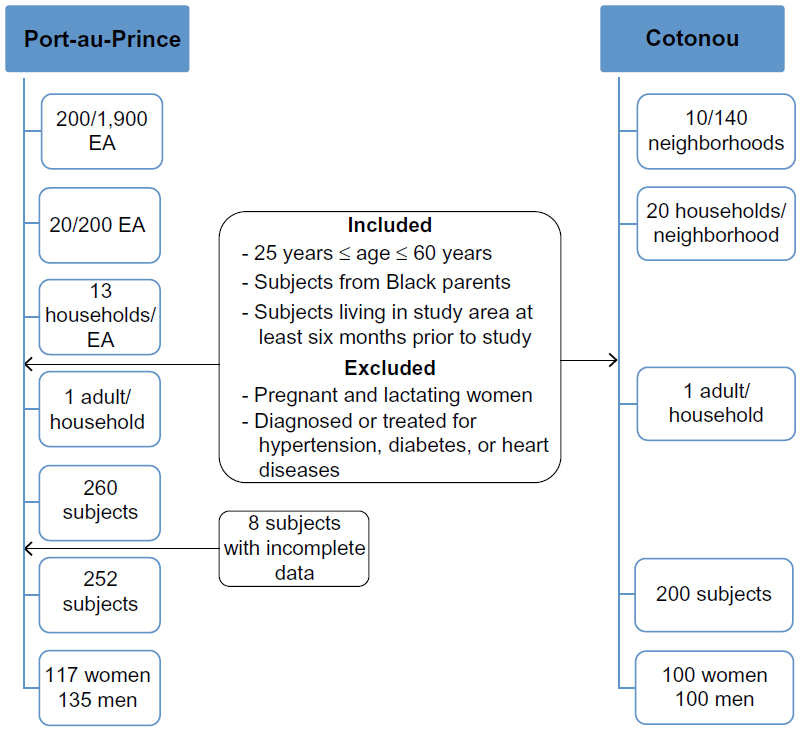 | Figure 1 Subject sampling in Port-au-Prince and in Cotonou. |
Study variables
Weights and heights were used to define body mass index (BMI) as a measure of overall or general obesity (BMI ≥30 kg/m2) according to the World Health Organization.26 WC was measured using a flexible non-stretch tape to the nearest 0.1 cm at midpoint between the lower rib and the iliac crest while subjects were standing and breathing normally.27 The average of two measures of WC was used in statistical analyses. A standardized protocol was used in both cities for anthropometric measurements and for other biological measures, as detailed elsewhere.21 AO indicators were WC and WHtR. The population-specific WC cut-off points were as determined in the present study (see the results section), along with the generic ones for AO in the harmonized MetS definition (WC ≥94 cm in men and ≥80 cm in women).1 The standard cut-off point of 0.5 was used for WHtR10 and it was compared with specific cut-points. The MetS was defined as the presence of any three of the following five components: AO based on WC (generic cut-offs), elevated blood pressure according to the mean value of two readings of systolic blood pressure (SBP) and diastolic blood pressure (DBP) (SBP ≥130 mmHg or DBP ≥85 mmHg), elevated fasting glucose (glycemia ≥5.6 mmol/L), elevated triglyceride (TG) concentrations (≥1.7 mmol/L), and low HDL-C (<1.03 mmol/L in men and <1.29 mmol/L in women).1 As additional risk biomarkers, high-sensitivity C-reactive protein (hsCRP) was assessed by immunonephelometry and subclinical inflammation was considered present when hsCRP concentrations were between 3 and 10 mg/L.28 Serum insulin was measured by radioimmunoassay and insulin resistance was defined as the 75th percentile of the calculated Homeostasis Model Assessment index (HOMA-IR) [(fasting glucose × fasting insulin)/22.5] for the total sample, which was 3.9.29 The atherogenicity index was considered high when total cholesterol (TC)/HDL-C ratio was >5 in men and >4 in women.30 Specific WC and WHtR cut-offs were defined against the most prevalent CMR biomarkers in both groups, that is, high blood pressure, high atherogenicity index, and insulin resistance.
Statistical analysis
Data were processed and analyzed with IBM SPSS (version 21.0, IBM Corporation, Armonk, NY, USA). Statistical analyses were performed with subjects grouped by sex and both sites (Cotonou and PAP) along with separate analysis by sites. The Kolmogorov–Smirnov test was used to test the normal distribution of variables. Mean, standard deviation, median, and centiles were calculated for continuous variables and Mann–Whitney U test or t-test were used when appropriate to compare data between men and women. Comparisons of biomarkers of CMR in men and women were performed using the χ2 test for categorical data and values were expressed by rates. Non-parametric receiver operating characteristic (ROC) curves for continuous variables were generated and the area under the curve (AUC) was measured to summarize the ability of WC and WHtR to detect subjects with at least two CMR biomarkers. The closer the AUC is to 1, the higher the ability of the indicator to discriminate among subjects.31 AUC values of 0.5 indicated no discriminatory power of the tested indicator. The difference between the AUC for WC and WHtR was assessed using the MedCalc statistical software v.15. In defining optimal sex-specific cut-off points for WC and WHtR as predictors of CMR, the Youden’s index (sensitivity + specificity - 1) was used. This index ranges from 0 to 1, with values approaching 1.0 indicating a more performant test and values close to 0 indicating that such a test is worthless.32 The likelihood ratio (LR) was also computed. It is defined as the ratio between the probability of a defined test result in the presence of the disease (or two CMR biomarkers in the present study) and the probability of a defined test result in the absence of the disease.31 Statistical significance was set at P<0.05.
Ethical considerations
The initial studies were approved by the Ethics and Health Research Committees of the Faculty of Medicine, University of Montreal (reference number: CERFM 47 (03) 4#91c), the Ministry of Public Health and Population of Haiti, and the Ministry of Health in Benin (reference number: 5594/MSP). All participants had signed an informed consent form. The subjects in whom hypertension or dysglycemia had been detected in the course of the study were referred to a physician for consultation and the first consultation was covered by project funds. The study results were fed back to research partners, policy-makers, and health practitioners in both Benin and Haiti.
Results
The prevalence of overall obesity based on a BMI ≥30 kg/m2 was 15.2% (24% in women vs 6.4% in men; P<0.001). Metabolic characteristics of study subjects by sex are presented in Table 1. Women had significantly higher WC, WHtR, and BMI than men (P<0.001). High rates of low HDL-C, high TC/HDL-C, and AO (43.5%) were the main CMR biomarkers. Insulin resistance and elevated blood pressure were each present in one out of four subjects. Subclinical inflammation was present in one out of six subjects. Considering the three most prevalent CMR biomarkers other than AO (high TC/HDL-C, elevated blood pressure, and insulin resistance), it was found that 69.9% (n=300) of subjects had at least one marker of risk (79.9% in women and 58.4% in men; P<0.001), 32.2% had at least two (n=140; 42.5% in women and 22.2% in men; P<0.001), and 7.8% (n=34) had all three risk biomarkers (9.8% in women and 5.9% in men; P=0.127). The MetS was present in 18.6% of subjects. For all considered biomarkers of CMR, women showed a significantly higher prevalence rate than men. Hypertriglyceridemia was uncommon in this population group (0% in women and 1.3% in men).
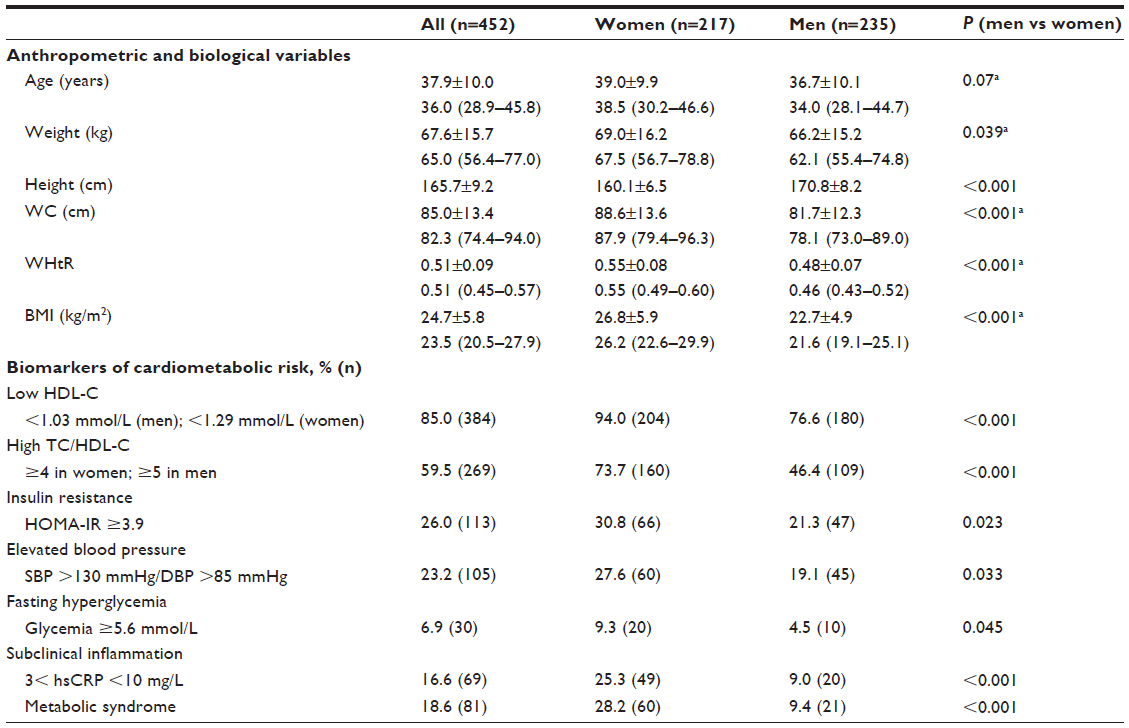 | Table 1 Anthropometric and biomarker data, Benin and Haiti adults |
As shown in Figure 2, there was an overlap of ROC curves for WC and WHtR as predictors of at least two out of the three most frequent CMR biomarkers (high TC/HDL-C, elevated blood pressure, and insulin resistance). As seen in Table 2, AUC values for WC and WHtR were not significantly different.
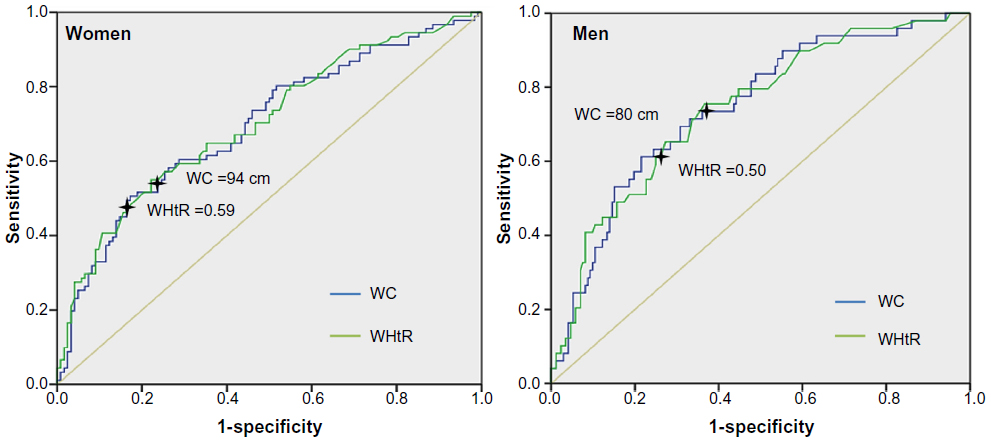 | Figure 2 ROC curves and specific WC or WHtR predicting at least two cardiometabolic risk biomarkers. |
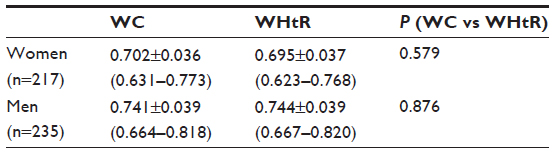 | Table 2 AUC for waist circumference or waist-to-height ratio in women and in men |
Specific WC and WHtR cut-off points with maximum sensitivity and specificity and therefore with the highest Youden’s index were, respectively, 94 cm (Youden’s index =0.328) and 0.59 (Youden’s index =0.331) in women, and 80 cm (Youden’s index =0.389) and 0.5 (Youden’s index =0.397) in men. Youden’s indices for generic WC and WHtR cut-offs were, respectively, 0.215 and 0.196 in women and 0.286 and 0.391 in men (data not shown).
As shown in Table 3, the generic WC and WHtR cut-off points showed lower specificity than the determined cut-off points in women. In men, the generic WC cut-off was less sensitive than the one determined in the study.
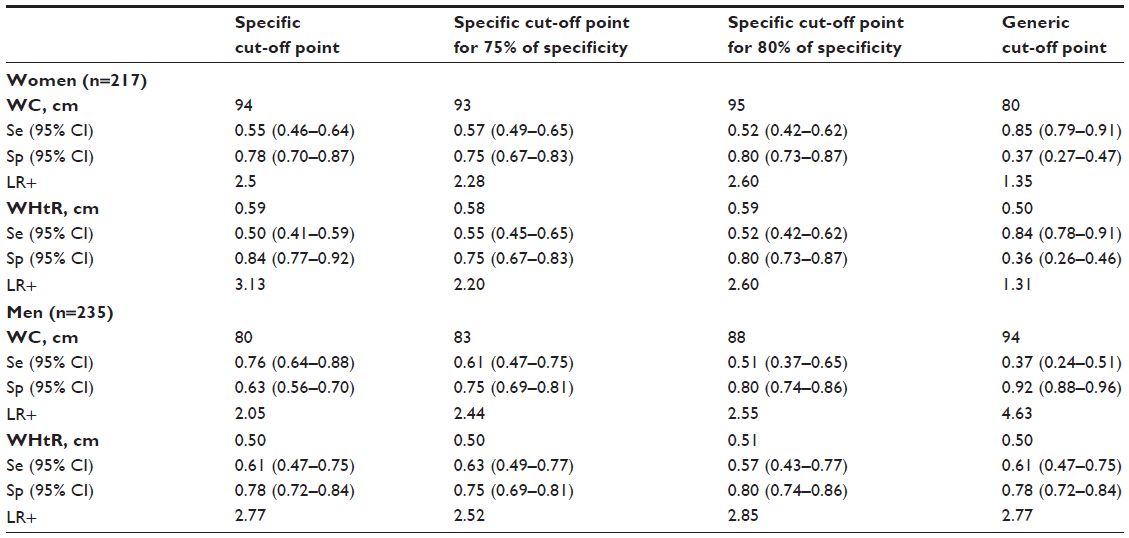 | Table 3 Specific and generic WC and WHtR cut-offs predicting at least two cardiometabolic risk biomarkers |
Computed WC and WHtR thresholds for specificity set at 75% were, respectively, 93 cm and 0.58 in women, and 83 cm and 0.50 in men. When specificity was set higher (80%), WC and WHtR thresholds were also higher, being respectively 95 cm and 0.59 in women, and 88 cm and 0.51 in men. As for the LRs, AO as defined by generic cut-offs was not predictive of CMR in women in our sample. When defining AO according to specific cut-off points as determined in the study, women with AO were two to three times more likely to have two CMR biomarkers compared with those without AO. Men with AO were approximately three to five times more likely than those without AO to have two CMR biomarkers, depending on whether generic or specific cut-off points were considered.
The prevalence rates of AO according to whether we used specifically determined or generic anthropometric cut-offs in men and in women are presented in Table 4. The overall prevalence of AO was not significantly different according to specific or generic WC threshold (P=0.668). However, the generic cut-offs gave a significantly higher prevalence of AO in women (P≤0.001) and a lower one in men (P=0.002) compared with population-specific cut-offs. Regarding high WHtR, the generic cut-offs gave a significantly higher prevalence of AO only in women (P≤0.001) since in men the generic threshold was optimal. Women had significantly higher rates of AO than men when defined by generic WC and WHtR cut-offs, while there was no significant difference between men and women when using the population-specific cut-offs.
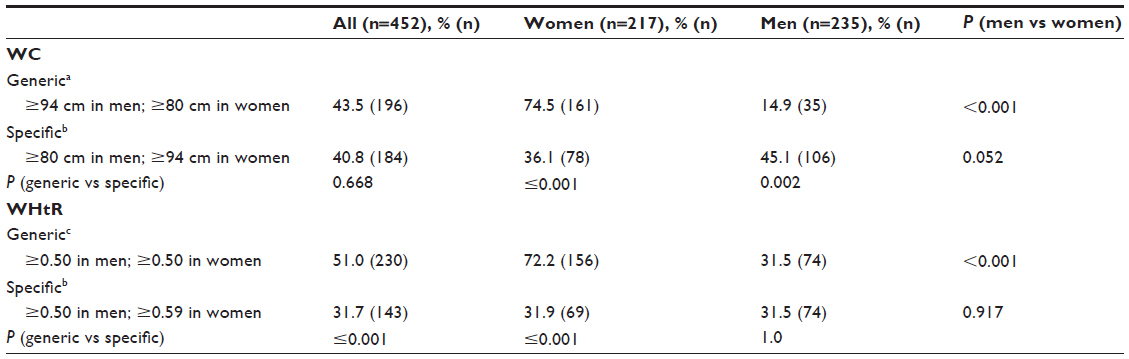 | Table 4 Prevalence of abdominal obesity according to specific and generic waist circumference and waist-to-height ratio cut-off points in men and in women |
Discussion
The present study determined specific WC and WHtR cut-off points based on the most highly prevalent CMR biomarkers in West Africans and African-descent Haitians, namely, elevated blood pressure, insulin resistance, and a high atherogenicity index.21,22 Our results showed that WC and WHtR were equally valid indicators of AO. However, the findings suggested that optimal cut-off points for this population were different from the current generic values, particularly in women.
The main components of the MetS in the study population were AO (as defined with generic WC cut-offs), elevated blood pressure, and a distinct lipid profile with a very high prevalence of low HDL-C and normal TG.21,33 This is in line with the MetS phenotype reported in other studies in Black Africans15,34–36 which is distinct from the common MetS phenotype in Caucasians, the latter being characterized by high triglyceride concentrations as the most prevalent component.2 Our results thus confirmed that the MetS phenotypes vary widely across race-ethnicity groups as reported in other studies.16 Recent studies indeed questioned the relevance of the MetS as currently defined for the assessment of CMR in African populations. Sobngwi et al37 reported that stroke was associated with insulin resistance, low HDL-C, and high TC/HDL-C in Cameroonians. Gaillard et al19 in a study of 255 non-diabetic overweight/obese African-American women reported that MetS was highly prevalent in subjects with low HDL-C and with hyperglycemia compared with subjects with hypertriglyceridemia. Along the same lines, in the population groups of our study, AO (based on generic WC cut values) was associated with significantly higher odds of high blood pressure, high atherogenicity index, and insulin resistance in both men and women of Cotonou22 and PAP (unpublished data). This is why we chose to determine optimal cut-off points for WC and WHtR against these most highly prevalent CMR biomarkers rather than against standard MetS components, in contrast to previous studies among Africans.13,15,38
In the present study, low HDL-C was present in 85% of subjects but it was not considered as such among the CMR biomarkers to define specific AO cut-offs. Such high rates of low HDL-C are astounding and have to be interpreted cautiously. Deterioration of serum samples during storage and shipping cannot be excluded, although particular care was taken to keep the samples well below freezing point until analysis. The contribution of low HDL-C to CMR has been examined in many studies. Keene et al39 questioned the HDL-C protective role since raising HDL-C did not reduce the incidence of cardiovascular events. Additionally, low HDL-C was observed in both underweight and overweight subjects in Benin.40 Low HDL-C may therefore not be a valid CMR marker in African populations. In contrast, the atherogenicity index has been considered as a better predictor of CMR compared with other lipoprotein fractions or its single components.41 It was the most prevalent CMR biomarker in the population of our study and was therefore used to test the anthropometric indicators of AO.
While the ROC curves showed that both WC and WHtR were equally valid indicators of CMR based on the presence of at least two of the three most common biomarkers of risk, cut-offs are the issue. Regarding WC, specifically determined cut-offs for the study population were higher than the generic value of 80 cm in women and lower than the generic value of 94 cm in men. These generic cut-offs are currently used in the absence of ethno-specific values.1 Results of the few studies on optimal WC cut-offs in sub-Saharan Africans varied according to the outcome variables and the study population, but in spite of small differences in the cut-off points, all reported higher thresholds for women, in contrast to values in other race-ethnicity groups. Much like in our study, Motala et al13 defined, in 947 South African Zulu, higher WC cut-offs in women and lower ones in men compared with the generic values: 92 cm in women and 86 cm in men. However, they tested WC cut-offs as predictors of at least two other standard MetS components instead of resorting to those CMR biomarkers that are most prevalent in the population under study. Similarly, in a cohort of 1,251 urban African women, the cut-off point of WC as predictor of the MetS was 91.5 cm and therefore again higher than the generic cut point.15 In a prospective study in South Africa, the WC cut-off points for predicting the MetS in a cohort 152 urban Black African teachers aged between 25 and 65 years were 92 cm in men and 94 cm in women.38 As noted by the authors, however, this study was limited by the small size and the homogeneity of the sample. In a recent study involving 1,099 subjects from Cape Town (South Africa), WC cut-off points were 84 cm in men and 94 cm in women.42 The difference between those WC cut-off points predicting the MetS maybe explained by other risk factors such as urbanization level and lifestyle of the study population.43,44
In the absence of specific cut-off values to define AO in Black Africans, the WHtR appeared promising since the single cut-off of 0.5 was allegedly applicable to adults and adolescents as well,8,45 to men and women, and to various ethnic groups.9,46 This was the main reason behind our comparing this anthropometric indicator with WC. Besides, very few studies examined the specific cut-off points for WHtR in Black Africans. Ware et al14 in a 5-year study in 1,519 sub-Saharan African adults suggested that a threshold of 0.5 for WHtR consistently predicted CMR in both men and women when tested against single biomarkers (hypertension, elevated triglycerides, low HDL-C, impaired fasting blood glucose, and elevated hemoglobin). In the present study, the specific cut-off value for WHtR in women was higher than 0.50, which is consistent with the higher thresholds of WC in women, while in men the generic cut-off point of 0.50 was appropriate.
The ROC curves, Youden’s indices, and LRs showed that the generic cut-off points for both WC and WHtR were much less performant than the population-specific cut-offs particularly for women, as the former had a high sensitivity but low specificity. The resulting overestimated rate of AO in African women may have a negative impact on preventive action since women at relatively low risk would be targeted, which means unnecessary expenditure, and worry for the individuals. This should be of particular concern in resource-poor countries. At the population level, however, high specificity should therefore be given precedence over high sensitivity in order to target subjects with AO at high CMR. This is why we tested the optimal cut-off points for a fixed specificity of 75% or 80%. More seriously, in men, in contrast, specificity of the generic WC cut-off point was acceptable, but sensitivity was low, meaning that quite a large proportion of men (30.2%) who might require health advice or risk monitoring would be missed because they were not identified as having AO. The present study suggests that the currently used WC thresholds for men may need to be revised downward.
The WHtR of 0.5 appeared valid for predicting the aggregation of two CMR biomarkers in men (but not in women) and therefore, it could be useful in men. The use of this cut-off point is largely supported by many studies in different populations. Add to the fact that a single cut-off point is easy to remember.10,11,14
The present study had some limitations that need to be taken into account. First, the study involved only urban people, while the relationship between AO and CMR may be modulated by urbanization and associated factors such as eating and physical activity patterns.43 An important limitation is that we did not control for these potential confounding factors in the present paper. Additionally, we did not consider the menopausal stage of women although it is known that AO increases significantly in postmenopausal women.47,48 The findings can only be extrapolated to other population groups with extreme caution because defined specific cut-off points based on Youden’s index are optimal to the specific population in which they were generated, and at a specific time as previously examined by Cameron et al.49 Studies in larger samples of Africans and controlling for several confounding factors would be needed to confirm our results.
Grouping Benin and Haiti subjects may be regarded as a methodological flaw. However, we considered that it was legitimate because these groups share a common genetic heritage, the methods for anthropometric and blood pressure measurements were standardized and all biochemical analyses were performed in the same laboratory using the same assay procedures. Even studies defining specific WC cut-offs in Caucasians did not consider various ethnic groups separately.50 Additionally, grouping both Haitians and Beninese gave more statistical power. Analyzing data separately for PAP and Cotonou did not alter the conclusion since specific WC and WHtR cut-offs remained higher in women and lower in men than the generic cut-offs, except for the specific WHtR cut-off which was slightly higher than the generic value in Cotonou. Data for specific WC and WHtR cut-offs are provided in Table S1.
Finally, even if we studied subclinical inflammation as a biomarker of CMR in this population group, we did not consider it in defining WC and WHtR threshold. Metabolically, the association of AO with high blood pressure, dyslipidemia, and dysglycemia may be explained by chronic subclinical inflammation and resulting insulin resistance.51,52 Even if the measurement of CRP adds clinically important prognostic information to the MetS, as suggested by a large prospective study,53 the high cost for hsCRP analyses especially in the African context is not easily justified in assessing CMR.54
Conclusion
In Black African subjects and in order to correctly identify subjects at high CMR, the study suggests that WC thresholds as markers of AO would need to be increased in women and to be revised downward in men. The WHtR cut-off point of 0.5 was found appropriate only in men. Defining specific thresholds of AO for Black Africans or African origin groups is important and will significantly influence the intervention strategies for diagnosis, prevention, and management of the overall CMR in these populations. This study also highlights the need for more studies to define an appropriate MetS phenotype in Black Africans.
Acknowledgment
We thank Dr JL Guéant, University Henri Poincaré (Nancy, France) for biochemical analyses.
Author contributions
HD is the principal investigator in charge of the Nutrition Transition Multicenter Study. She designed the study and developed the initial protocol with RS, CV, and PL. RS refined the protocol for Cotonou, collected the data in the field and performed data analyses other than those reported in this paper. CV and PL supervised the data collection in PAP and were involved in manuscript revision. AEM did the data cleaning for PAP, she conducted the statistical analyses, she participated in the feedback of study results in Haiti, and she drafted the manuscript under HD supervision. MB participated in the feedback of study results in Haiti and thoroughly revised and corrected the manuscript. All authors contributed toward data analysis, drafting and revising the paper and agree to be accountable for all aspects of the work.
Disclosure
The authors report no conflicts of interest in this work.
References
Alberti KG, Eckel RH, Grundy SM, et al. Harmonizing the metabolic syndrome: a joint interim statement of the International Diabetes Federation Task Force on Epidemiology and Prevention; National Heart, Lung, and Blood Institute; American Heart Association; World Heart Federation; International Atherosclerosis Society; and International Association for the Study of Obesity. Circulation. 2009;120(16):1640–1645. | |
Despres JP. Body fat distribution and risk of cardiovascular disease: an update. Circulation. 2012;126(10):1301–1313. | |
Carmienke S, Freitag MH, Pischon T, et al. General and abdominal obesity parameters and their combination in relation to mortality: a systematic review and meta-regression analysis. Eur J Clin Nutr. 2013;67(6):573–585. | |
Katzmarzyk PT, Bray GA, Greenway FL, et al. Ethnic-specific BMI and waist circumference thresholds. Obesity (Silver Spring). 2011;19(6):1272–1278. | |
Katzmarzyk PT, Bray GA, Greenway FL, et al. Racial differences in abdominal depot-specific adiposity in white and African American adults. Am J Clin Nutr. 2010;91(1):7–15. | |
Desilets MC, Garrel D, Couillard C, et al. Ethnic differences in body composition and other markers of cardiovascular disease risk: study in matched Haitian and White subjects from Quebec. Obesity (Silver Spring). 2006;14(6):1019–1027. | |
Okosun IS, Tedders SH, Choi S, Dever GE. Abdominal adiposity values associated with established body mass indexes in White, Black and Hispanic Americans. A study from the Third National Health and Nutrition Examination Survey. Int J Obes Relat Metab Disord. 2000;24(10):1279–1285. | |
Garnett SP, Baur LA, Cowell CT. Waist-to-height ratio: a simple option for determining excess central adiposity in young people. Int J Obes (Lond). 2008;32(6):1028–1030. | |
Ashwell M, Hsieh SD. Six reasons why the waist-to-height ratio is a rapid and effective global indicator for health risks of obesity and how its use could simplify the international public health message on obesity. Int J Food Sci Nutr. 2005;56(5):303–307. | |
Ashwell M, Gunn P, Gibson S. Waist-to-height ratio is a better screening tool than waist circumference and BMI for adult cardiometabolic risk factors: systematic review and meta-analysis. Obes Rev. 2012;13(3):275–286. | |
Browning LM, Hsieh SD, Ashwell M. A systematic review of waist-to-height ratio as a screening tool for the prediction of cardiovascular disease and diabetes: 0.5 could be a suitable global boundary value. Nutr Res Rev. 2010;23(2):247–269. | |
Kengne AP, Echouffo-Tcheugui JB, Sobngwi E, Mbanya JC. New insights on diabetes mellitus and obesity in Africa-part 1: prevalence, pathogenesis and comorbidities. Heart. 2013;99(14):979–983. | |
Motala AA, Esterhuizen T, Pirie FJ, Omar MA. The prevalence of metabolic syndrome and determination of the optimal waist circumference cutoff points in a rural South African community. Diabetes Care. 2011;34(4):1032–1037. | |
Ware LJ, Rennie KL, Kruger HS, et al. Evaluation of waist-to-height ratio to predict 5 year cardiometabolic risk in sub-Saharan African adults. Nutr Metab Cardiovasc Dis. 2014;24(8):900–907. | |
Crowther NJ, Norris SA. The current waist circumference cut point used for the diagnosis of metabolic syndrome in sub-Saharan African women is not appropriate. PLoS One. 2012;7(11):e48883. | |
Delisle H, Desilets MC, Vargas ER, Garrel D. Metabolic syndrome in three ethnic groups using current definitions. Appl Physiol Nutr Metab. 2008;33(2):356–360. | |
Longo-Mbenza B, Kasiam Lasi On’kin JB, Nge Okwe A, Kangola Kabangu N. The metabolic syndrome in a Congolese population and its implications for metabolic syndrome definitions. Diabetes Metab Syndr. 2011;5(1):17–24. | |
Ukegbu UJ, Castillo DC, Knight MG, et al. Metabolic syndrome does not detect metabolic risk in African men living in the US. Diabetes Care. 2011;34(10):2297–2299. | |
Gaillard T, Schuster D, Osei K. Differential impact of serum glucose, triglycerides, and high-density lipoprotein cholesterol on cardiovascular risk factor burden in nondiabetic, obese African American women: implications for the prevalence of metabolic syndrome. Metabolism. 2010;59(8):1115–1123. | |
Schuster DP, Gaillard T, Osei K. The cardiometabolic syndrome in persons of the African diaspora: challenges and opportunities. J Cardiometab Syndr. 2007;2(4):260–266. | |
Sodjinou R, Agueh V, Fayomi B, Delisle H. Obesity and cardio-metabolic risk factors in urban adults of Benin: relationship with socio-economic status, urbanisation, and lifestyle patterns. BMC Public Health. 2008;8:84. | |
Sossa C, Delisle H, Agueh V, Makoutode M, Fayomi B. Insulin resistance status and four-year changes in other cardiometabolic risk factors in West-African adults: the Benin study. Eur J Prev Cardiol. 2013; 20(6):1042–1050. | |
insea-bj.org. Cahier des villages et quartiers de ville, Département du LITTORAL; 2002. Available from: http://www.insae-bj.org/recensement-population.html. Accessed June 13, 2015. | |
Joseph M, Wang L, Wang F. Using Landsat imagery and census data for urban population density modeling in Port-au-Prince, Haiti. GISci Rem Sens. 2012;49(2):228–250. | |
Institut Haitian de Statistique et de l’Informatique. Population totale, population de 18 ans et plus, ménages et densités estimés en 2009. Port-au-Prince: Re´publique d’Haiti, Ministe`re de l’e´conomie et des finances, Institut haitien de statistique et d’informatique; 2009. | |
Chalmers J, MacMahon S, Mancia G, et al. 1999 World Health Organization-International Society of Hypertension Guidelines for the management of hypertension. Guidelines sub-committee of the World Health Organization. Clin Exp Hypertens. 1999;21(5–6):1009–1060. | |
Despres JP, Lemieux I, Prud’homme D. Treatment of obesity: need to focus on high risk abdominally obese patients. BMJ. 2001;322(7288):716–720. | |
Pearson TA, Mensah GA, Alexander RW, et al. Markers of inflammation and cardiovascular disease: application to clinical and public health practice: A statement for healthcare professionals from the Centers for Disease Control and Prevention and the American Heart Association. Circulation. 2003;107(3):499–511. | |
Matthews DR, Hosker JP, Rudenski AS, Naylor BA, Treacher DF, Turner RC. Homeostasis model assessment: insulin resistance and beta-cell function from fasting plasma glucose and insulin concentrations in man. Diabetologia. 1985;28(7):412–419. | |
National Cholesterol Education Program Expert Panel on Detection E, Treatment of High Blood Cholesterol in A. Third Report of the National Cholesterol Education Program (NCEP) Expert Panel on Detection, Evaluation, and Treatment of High Blood Cholesterol in Adults (Adult Treatment Panel III) final report. Circulation. 2002;106(25):3143–3421. | |
Zweig MH, Campbell G. Receiver-operating characteristic (ROC) plots: a fundamental evaluation tool in clinical medicine. Clin Chem. 1993;39(4):561–577. | |
Youden WJ. Index for rating diagnostic tests. Cancer. 1950;3(1):32–35. | |
Sossa C, Delisle H, Agueh V, Makoutode M, Fayomi B. Four-year trends in cardiometabolic risk factors according to baseline abdominal obesity status in West-African adults: the Benin study. J Obes. 2012;2012:740854. | |
Sumner AE, Zhou J, Doumatey A, et al. Low HDL-cholesterol with normal triglyceride levels is the most common lipid pattern in West Africans and African Americans with metabolic syndrome: implications for cardiovascular disease prevention. CVD Prev Control. 2010;5(3):75–80. | |
Sumner AE, Vega GL, Genovese DJ, Finley KB, Bergman RN, Boston RC. Normal triglyceride levels despite insulin resistance in African Americans: role of lipoprotein lipase. Metabolism. 2005;54(7):902–909. | |
Taylor H, Liu J, Wilson G, et al. Distinct component profiles and high risk among African Americans with metabolic syndrome: the Jackson Heart study. Diabetes Care. 2008;31(6):1248–1253. | |
Sobngwi E, Kengne AP, Balti EV, et al. Metabolic profile of sub-Saharan African patients presenting with first-ever-in-lifetime stroke: association with insulin resistance. J Stroke Cerebrovasc Dis. 2012;21(8):639–646. | |
Hoebel S, Malan L, Botha J, Swanepoel M. Optimizing waist circumference cut-points for the metabolic syndrome in a South African cohort at 3-year follow-up: the SABPA prospective cohort. Endocrine. 2014;47(3):959–961. | |
Keene D, Price C, Shun-Shin MJ, Francis DP. Effect on cardiovascular risk of high density lipoprotein targeted drug treatments niacin, fibrates, and CETP inhibitors: meta-analysis of randomised controlled trials including 117,411 patients. BMJ. 2014;349:g4379. | |
Delisle H, Ntandou G, Sodjinou R, Couillard C, Despres JP. At-risk serum cholesterol profile at both ends of the nutrition spectrum in West African adults? The Benin study. Nutrients. 2013;5(4):1366–1383. | |
Millan J, Pinto X, Munoz A, et al. Lipoprotein ratios: physiological significance and clinical usefulness in cardiovascular prevention. Vasc Health Risk Manag. 2009;5:757–765. | |
Peer N, Steyn K, Levitt N. Differential obesity indices identify the metabolic syndrome in Black men and women in Cape Town: the CRIBSA study. J Public Health (Oxf). Epub 2015 Jan 24. | |
Ntandou G, Delisle H, Agueh V, Fayomi B. Abdominal obesity explains the positive rural-urban gradient in the prevalence of the metabolic syndrome in Benin, West Africa. Nutr Res. 2009;29(3):180–189. | |
Popkin BM, Gordon-Larsen P. The nutrition transition: worldwide obesity dynamics and their determinants. Int J Obes Relat Metab Disord. 2004;28 Suppl 3:S2–S9. | |
Mokha JS, Srinivasan SR, Dasmahapatra P, et al. Utility of waist-to-height ratio in assessing the status of central obesity and related cardiometabolic risk profile among normal weight and overweight/obese children: the Bogalusa Heart Study. BMC Pediatr. 2010;10:73. | |
Ashwell M, Lejeune S, McPherson K. Ratio of waist circumference to height may be better indicator of need for weight management. BMJ. 1996;312(7027):377. | |
Polesel DN, Hirotsu C, Nozoe KT, et al. Waist circumference and postmenopause stages as the main associated factors for sleep apnea in women: a cross-sectional population-based study. Menopause. 2015; 22(8):835–844. | |
Tchernof A, Despres JP. Pathophysiology of human visceral obesity: an update. Physiol Rev. 2013;93(1):359–404. | |
Cameron AJ, Sicree RA, Zimmet PZ, et al. Cut-points for waist circumference in Europids and South Asians. Obesity (Silver Spring). 2010;18(10):2039–2046. | |
Han TS, van Leer EM, Seidell JC, Lean ME. Waist circumference action levels in the identification of cardiovascular risk factors: prevalence study in a random sample. BMJ. 1995;311(7017):1401–1405. | |
van Greevenbroek MM, Schalkwijk CG, Stehouwer CD. Obesity-associated low-grade inflammation in type 2 diabetes mellitus: causes and consequences. Neth J Med. 2013;71(4):174–187. | |
Fuentes E, Fuentes F, Vilahur G, Badimon L, Palomo I. Mechanisms of chronic state of inflammation as mediators that link obese adipose tissue and metabolic syndrome. Mediators Inflamm. 2013;2013:136584. | |
Ridker PM, Buring JE, Cook NR, Rifai N. C-reactive protein, the metabolic syndrome, and risk of incident cardiovascular events: an 8-year follow-up of 14719 initially healthy American women. Circulation. 2003;107(3):391–397. | |
Schisterman EF, Perkins NJ, Liu A, Bondell H. Optimal cut-point and its corresponding Youden Index to discriminate individuals using pooled blood samples. Epidemiology. 2005;16(1):73–81. |
Supplementary material
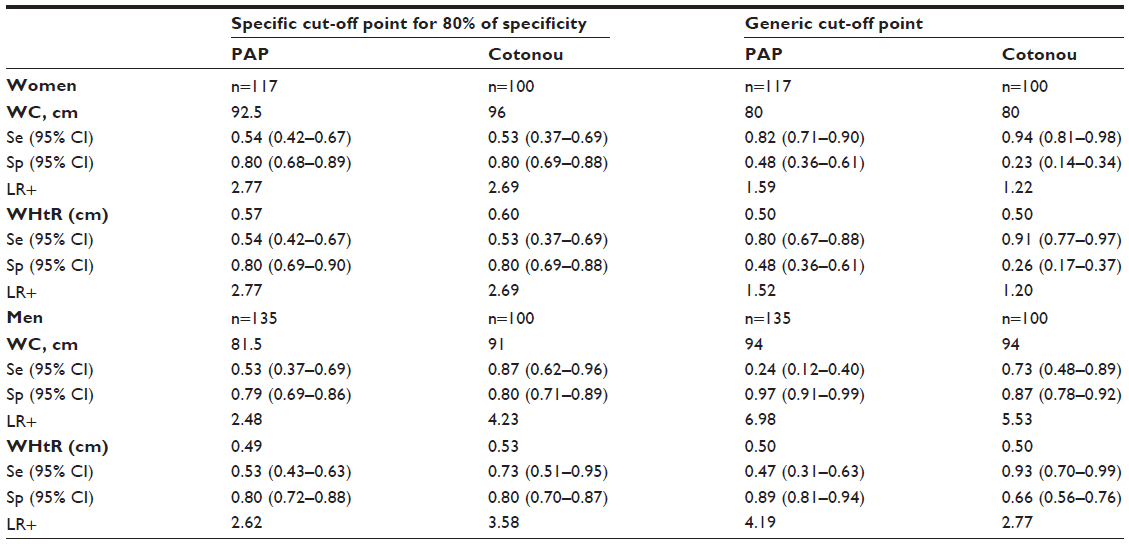 | Table S1 Specific and generic WC and WHtR cut-offs predicting at least two cardiometabolic risk biomarkers by study area in women and in men |
 © 2015 The Author(s). This work is published and licensed by Dove Medical Press Limited. The full terms of this license are available at https://www.dovepress.com/terms.php and incorporate the Creative Commons Attribution - Non Commercial (unported, v3.0) License.
By accessing the work you hereby accept the Terms. Non-commercial uses of the work are permitted without any further permission from Dove Medical Press Limited, provided the work is properly attributed. For permission for commercial use of this work, please see paragraphs 4.2 and 5 of our Terms.
© 2015 The Author(s). This work is published and licensed by Dove Medical Press Limited. The full terms of this license are available at https://www.dovepress.com/terms.php and incorporate the Creative Commons Attribution - Non Commercial (unported, v3.0) License.
By accessing the work you hereby accept the Terms. Non-commercial uses of the work are permitted without any further permission from Dove Medical Press Limited, provided the work is properly attributed. For permission for commercial use of this work, please see paragraphs 4.2 and 5 of our Terms.