")
Back to Journals » International Journal of Nanomedicine » Volume 15
Specific Anti-biofilm Activity of Carbon Quantum Dots by Destroying P. gingivalis Biofilm Related Genes
Authors Liang G , Shi H, Qi Y, Li J , Jing A, Liu Q, Feng W, Li G, Gao S
Received 11 March 2020
Accepted for publication 9 June 2020
Published 31 July 2020 Volume 2020:15 Pages 5473—5489
DOI https://doi.org/10.2147/IJN.S253416
Checked for plagiarism Yes
Review by Single anonymous peer review
Peer reviewer comments 2
Editor who approved publication: Dr Linlin Sun
Gaofeng Liang,1,2 Hao Shi,3 Yijun Qi,1 Jinghua Li,3 Aihua Jing,3 Qiwei Liu,2 Wenpo Feng,1 Guangda Li,3 Shegan Gao1,2
1Medical College, Henan University of Science and Technology, Luoyang 471023, People’s Republic of China; 2Henan Key Laboratory of Cancer Epigenetics, The First Affiliated Hospital of Henan University of Science and Technology, Luoyang 471023, People’s Republic of China; 3School of Medical Technology and Engineering, Henan University of Science and Technology, Luoyang 471023, People’s Republic of China
Correspondence: Gaofeng Liang; Shegan Gao Email [email protected]; [email protected]
Introduction: Biofilms protect bacteria from antibiotics and this can produce drug-resistant strains, especially the main pathogen of periodontitis, Porphyromonas gingivalis. Carbon quantum dots with various biomedical properties are considered to have great application potential in antibacterial and anti-biofilm treatment.
Methods: Tinidazole carbon quantum dots (TCDs) and metronidazole carbon quantum dots (MCDs) were prepared by a hydrothermal method with the clinical antibacterial drugs tinidazole and metronidazole, respectively. Then, TCDs and MCDs were characterized by transmission electron microscopy, UV–visible spectroscopy, infrared spectroscopy and energy-dispersive spectrometry. The antibacterial effects were also investigated under different conditions.
Results: The TCDs and MCDs had uniform sizes. The results of UV–visible and energy-dispersive spectrometry confirmed their important carbon polymerization structures and the activity of the nitro group, which had an evident inhibitory effect on P. gingivalis, but almost no effect on other bacteria, including Escherichia coli, Staphylococcus aureus and Prevotella nigrescens. Importantly, the TCDs could penetrate the biofilms to further effectively inhibit the growth of P. gingivalis under the biofilms. Furthermore, it was found that the antibacterial effect of TCDs lies in its ability to impair toxicity by inhibiting the major virulence factors and related genes involved in the biofilm formation of P. gingivalis, thus affecting the self-assembly of biofilm-related proteins.
Conclusion: The findings demonstrate a promising new method for improving the efficiency of periodontitis treatment by penetrating the P. gingivalis biofilm with preparations of nano-level antibacterial drugs.
Keywords: P. gingivalis, carbon dots, Tinidazole, biofilms, penetration
Introduction
Porphyromonas gingivalis (P. gingivalis), a Gram-negative anaerobic bacterium, is deemed a key oral pathogen, which is related to the occurrence and development of periodontitis. The prevalence of P. gingivalis is very common in adults, and the severity of P. gingivalis-related oral diseases increases with age.1–3 An abnormal increase in P. gingivalis can lead to an imbalance of the oral micro-ecology. In this context, the bacteria are highly pathogenic and spread throughout the body through blood circulation, and can cause systemic diseases and complications such as cardiovascular disease, hypertension, diabetes, preterm birth and pneumonia.4–6 Moreover, the accumulation of P. gingivalis in oral squamous cell carcinoma is significantly higher than that in normal oral mucosa,7,8 suggesting that P. gingivalis is associated with oral squamous cell carcinoma. Our group found that P. gingivalis infection may also be a risk factor for esophageal squamous cell cancer (ESCC).9,10 Another prospective study also showed that P. gingivalis enrichment is highly correlated with ESCC risk.11 In addition, P. gingivalis infection is a high-risk factor for colorectal cancer and pancreatic cancer.12,13 Research has also found that P. gingivalis infection is highly associated with Alzheimer’s disease.14 These investigations suggest that P. gingivalis infection has a close relationship with many diseases and may play an important role in the progression of these diseases. Therefore, it is very important to eliminate P. gingivalis for the treatment of oral and other related diseases.
Most of the drugs currently used to kill bacteria are antibiotics, such as nitroimidazoles and tetracyclines. However, their effect is very limited because most antibiotics used in clinical context can only maintain high efficiency over a short time, and resistant strains will soon arise owing to the continuous use of antibiotics. The main reason for this problem is that the bacteria produce a biofilm, a membrane-like structure composed of microbial cells and extracellular polymer complexes surrounded by exopolysaccharides, on biotic or abiotic surfaces.15–17 Bacteria under the biofilm are protected from antibacterial agents and host defense mechanisms, which leads to drug failure,18 and also, in turn, triggers bacterial resistance.6,19,20 In addition, although antibiotics can inhibit the symptoms of an infection by killing exfoliated zooplankton in vivo, antibiotics cannot eradicate bacteria located deep in the biofilm.21 When antibiotics are discontinued, biofilms can act as a recurrent lesion of infection.21–23 Current research has confirmed that more than 80% of infectious diseases are closely related to biofilms.24–26 For example, dental plaque on the teeth is caused by the presence of biofilm produced by P. gingivalis, which stops antibiotics penetrating the biological barrier and protects the bacteria from eradication by therapeutics.27–29 Even increasing the dose of the drug will only heighten the tolerance to it.24,30 Therefore, the development of a drug capable of breaking down the biofilm is becoming a big challenge.
With the development of nanomedicine, nanomaterials have been developed as antibacterial agents to treat bacterial infectious diseases, including antimicrobial peptides, inorganic nanoparticles and natural drug agents,31,32 and, in particular, carbon quantum dots (CDs), which have an advantage in their small size and display excellent efficiency in dealing with biofilm-related infections.33,34 As a new type of nanomaterial, CDs have attracted considerable attention owing to their unique properties, such as superior optical properties, high photostability, good water solubility, low toxicity, biocompatibility and cell permeability,35–37 as well as convenient preparation and modification. In recent years, CDs have been synthesized using several methods including chemical ablation, electrochemical carbonization, laser ablation, microwave irradiation and hydrothermal treatment. The hydrothermal method for CD preparation is simple and green, and a one-step synthesis.38,39 Lin et al used Lactobacillus plantarum as a single carbon source to prepare CDs through a one-step hydrothermal reaction, which could inhibit the formation of antibiotic biofilms without any modification.40 Similarly, Citrus limetta41 and aminoguanidine42 as the main carbon source have achieved significant antibacterial and anti-biofilm effects. Small-molecule drugs with a complete carbon-framework structure are also being used to prepare functional CDs.12,43 However, novel drugs that selectively target pathogenic species would offer an alternative to currently overused broad-spectrum antimicrobials.44 Liu et al chose metronidazole as the sole carbon source to prepare nontoxic, highly photoluminescent nano-carbon dots with selective antibacterial activity against obligate anaerobes.37 As an upgraded version of metronidazole, tinidazole has good activity against Gram-negative anaerobic bacteria and shows more sensitivity than metronidazole to anaerobic bacteria. Inspired by this, we speculated that the carbon dots from tinidazole would have a uniform nanometer size and similar function to tinidazole, so that the effect of the drug can be maximized, and it could even penetrate the biofilm to kill bacteria owing to its nano-level size.
In this study, we developed a simple hydrothermal method to synthesize CDs from tinidazole (TCDs) and metronidazole (MCDs). Figure 1 shows the schematic of specific anti-biofilm activity of CDs. We also compared the antibacterial effects of TCDs and MCDs. The TCDs and MCDs were characterized by infrared spectroscopy and retained the activity of the nitro group, which had obvious specific toxicity for P. gingivalis. The transmission electron microscope (TEM) images showed that both TCDs and MCDs had uniform sizes and good monodispersity. The results of ultraviolet–visible (UV-vis) and energy-dispersive spectrometry (EDS) confirmed their important carbon polymerization structure, indicating that the nano-drugs had been successfully prepared. Next, the specific antibacterial activity of TCDs and MCDs was evaluated and the anti-biofilm effect of TCDs was further investigated in a P. gingivalis biofilm model in vitro. Using the first biofilm breakthrough model constructed for biofilm penetration by TCDs, we revealed that the specific anti-biofilm activity of TCDs was achieved by inhibiting the major virulence factors and related genes involved in biofilm formation of P. gingivalis, thus affecting the self-assembly of biofilm-related proteins. Ultimately, we found that TCDs can effectively eliminate P. gingivalis following biofilm penetration.
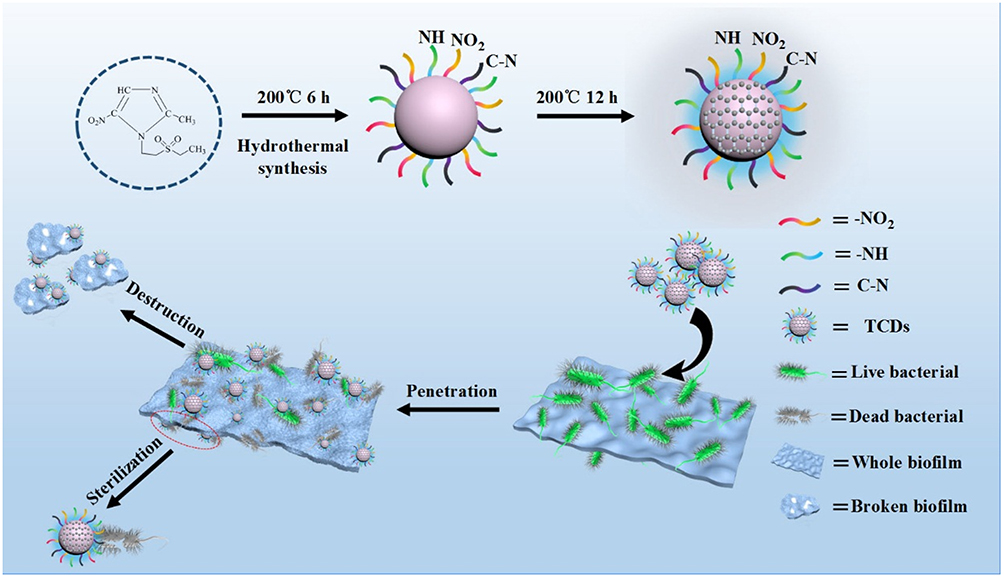 |
Figure 1 Schematic of specific anti-biofilm activity of carbon quantum dots. |
Experimental Section
Materials
Tinidazole and metronidazole (99.0%) were purchased from Shanghai Aladdin Reagent Co. Ltd. The liquid medium for P. gingivalis comprised Gifu Anaerobic Medium broth (GAM; Nissui, Tokyo, Japan) with 5% defibrinated sheep’s blood and 1 mg/mL vitamin K1 (Sigma-Aldrich, St Louis, MO, USA), treated by high-temperature steam sterilization. Luria–Bertani broth was formulated with tryptone (Sigma-Aldrich), yeast extract (Sigma-Aldrich) and NaCl (Sigma-Aldrich) for Escherichia coli and Staphylococcus aureus.
Synthesis of MCDs and TCDs
TCDs and MCDs were prepared by hydrothermal methods according to previous reports.36,37 In brief, 5 mmol of metronidazole or tinidazole was completely dissolved in 20 mL ultra-pure water. After stirring for 15 min, the solution was transferred to a 100 mL Teflon-lined autoclave, which was sealed and incubated at 200°C for 6 h, and then for another 12 h. Subsequently, the mixture was cooled down to room temperature. Afterwards, the pale-brown solution was filtered through a 0.22 μm polyether sulfone membrane to remove agglomerated particles and dialyzed in an 800 Da dialysis bag against ultra-pure water for 24 h. The resultant liquid was freeze-dried overnight to form a solid sample (MCDs and TCDs) for further characterization.
Characterization of MCDs and TCDs
FTIR spectra of TCDs and MCDs were recorded on a Nicolet 200 type Fourier transform infrared spectrometer (Thermo Nicolet, USA). The TEM (JEM-2100; Japan) was employed to characterize the TCDs and MCDs. The scanning electron microscope (SEM) and EDS patterns of the MCDs and TCDs were acquired on an S-3400N SEM (Hitachi, Tokyo, Japan). The size distribution of the nanoparticles was determined by a Zetasizer Nano ZS instrument (Malvern, UK). UV-vis absorption spectra were obtained using a Shimadzu 3100 UV-vis spectrophotometer. The fluorescence emission spectra of TCDs and MCDs were analyzed on a Hitachi FluoroMax-4 fluorescence spectrometer.
Cell Cytotoxicity of MCDs and TCDs
A human immortalized liver cell line (L0-2) was purchased from the Shanghai Cell Bank of the Chinese Academy of Sciences and used for assessment of the cytotoxicity of MCDs and TCDs. The cells were cultured in Roswell Park Memorial Institute-1640 medium (RPMI-1640) supplemented with 10% fetal bovine serum at 37°C under 5% CO2. The 3-(4,5-dimethyl-2-thiazolyl)-2,5-diphenyl-2-H-tetrazolium bromide, methyl thiazolyl tetrazolium (MTT) viability assay was performed to evaluate the cell cytotoxicity of MCDs and TCDs on L0-2 cells. In brief, L0-2 cells (5×10⁴/well) were seeded in a 96-well cell culture plate at 100% humidity, and cultured at 37°C in 5% CO2 for 24 h before exposure to nanoparticles; then, the cells were treated with different concentrations of MCDs or TCDs for another 24 h. Thereafter, 10 μL of 5 mg/mL MTT was added to each well; after incubating, 150 μL of DMSO was added to each well, and shaken until the crystal sufficiently melted. The absorbance of each well was determined by selecting the wavelength of 490 nm on an enzyme-linked immunosorbent monitor and the results were recorded. The MTT assay was repeated twice. The cell viability was calculated as:
Cell viability = ODexperiment/ODControl × 100%
Hemolytic Activity
Fresh rabbit blood with anticoagulant was mixed with an appropriate amount of normal saline. Different concentrations of TCDs and MCDs were placed in a 37°C water bath for 30 min, then 0.1 mL of anticoagulated rabbit blood was added to each tube, which remained in the 37°C water bath for another 60 min. The absorbance value was measured at 545 nm with a UV spectrophotometer.
Hemolysis rate = ODexperiment/ODControl × 100%
Antibacterial Assay of MCDs and TCDs
The minimum inhibitory concentration (MIC) is often used as an important indicator of antibacterial research.45 In this study, we tested the MIC of TCDs or MCDs for selective sterilization in P. gingivalis, Prevotella nigrescens, E. coli and S. aureus. In brief, P. gingivalis was purchased from American Type Culture Collection (ATCC) and cultured using GAM in an anaerobic incubator (atmosphere of 5% CO2, 10% H2, 85% N2, 37°C) for 24 h. The number of P. gingivalis (1×10⁹ CFU/mL) is calculated at OD 600 nm, and a P. gingivalis suspension (5×10⁷ CFU/mL) was prepared. Each well of 96-well flat-bottomed plastic non-tissue culture plates was inoculated with 100 μL of P. gingivalis suspension with GAM, and cultured in an anaerobic incubator (atmosphere of 5% CO2, 10% H2, 85% N2, 37°C) for 24 h. Then, 100 μL of different concentrations of MCDs and TCDs, from 0 to 125 μg/mL, was added to the culture plates. In parallel, 100 μL of liquid medium or 100 μL of MCDs or TCDs was added to the plate serving as the blank control. Bacterial growth was recorded on a full-wavelength microplate reader. Staphylococcus aureus, E. coli ATCC 25,922 and P. nigrescens were treated in a similar manner as above; the P. nigrescens culture conditions were the same as for P. gingivalis, while S. aureus and E. coli were cultivated in a normal environment at 37°C and pH 7.4.
Inhibition (%) =ODexperiment/ODcontrol ×100%
Inhibition zone assays were performed according to previous reports. In brief, 50 μL of P. gingivalis (1×10⁹ CFU/mL) was evenly spread on solid medium in an anaerobic incubator (atmosphere of 5% CO2, 10% H2, 85% N2, 37°C) for 1 h. During cultivation, sterile circular filter papers with a diameter of 10 mm were fully immersed in the solution of nanoparticles for 1 h, then placed on the solid medium plate and cultured for 24 h. Finally, the size of the inhibition zone was measured and the result was recorded by a CCD camera. Assays for S. aureus, E. coli and P. nigrescens were conducted in the same manner as for P. gingivalis.
Biofilm Formation and Detection
The assay for biofilm formation and detection was adapted from the procedure described previously.46 A suspension of P. gingivalis (5×10⁷ CFU/mL) with 1% glucose was prepared and 96-well flat-bottomed non-tissue culture plates(NEST, Wuxi, China) were inoculated with 100 μL of P. gingivalis suspension. Subsequently, 24 h culture in an anaerobic incubator (atmosphere of 5% CO2, 10% H2, 85% N2, 37°C) was allowed for biofilm formation. After cultivation, the 96-well plate was washed three times with phosphate-buffered saline (PBS) to remove the non-adherent P. gingivalis bacteria. Then, 100 μL of methanol was added to each well to fix the biofilms for 10 min. After fixing, the plate was washed three times and air-dried at room temperature, stained with 0.1% (w/v) crystal violet (Sigma-Aldrich, USA) and rinsed thoroughly with PBS until the negative control wells appeared colorless. Then, the plate was decolorized with 150 μL 95% (v/v) ethanol and the absorbance was quantified by measuring the optical density using a microplate reader.
The assay for inhibition of P. gingivalis biofilm formation was adapted from the procedure described previously. In brief, a 96-well flat-bottomed non-tissue culture plate was inoculated with 100 μL of P. gingivalis suspension (5×10⁷ CFU/mL) with 1% glucose and cultured in an anaerobic incubator for 24 h. After that, the plate was treated with different concentrations of TCDs (from 0 to 125 μg/mL) to test the biofilm-forming ability of P. gingivalis for another 24 h, followed by measurement of absorbance, as above.
Confocal Laser Scanning Microscopy (CLSM) Assay
The P. gingivalis suspension (5×10⁷ CFU/mL) with 1% glucose was added to a confocal dish and statically cultured in an anaerobic incubator (atmosphere of 5% CO2, 10% H2, 85% N2, 37°C) for 48 h to form a biofilm on the glass substrate, separately. After the mature biofilm had formed, it was carefully washed twice with sterile PBS, and different concentrations of TCDs were added to the dishes for 24 h. Biofilms and P. gingivalis were detected by the fluorescein isothiocyanate (FITC) staining method; specifically, the dishes were stained in the dark for 30 min at 37°C, and washed three times with PBS after staining. Finally, using a Zeiss LSM780 confocal laser scanning microscope (Carl Zeiss, Jena, Germany), an LSM780 ELYRA PS.1 super-resolution structural lighting system and a 63× flat color oil immersion objective lens (numerical aperture, 1.46), the images were acquired and analyzed using ZEN 2011 software.
Biofilm Penetration Model
To test whether TCDs can penetrate the biofilm and inhibit the growth of P. gingivalis under the biofilm, the biofilm model for the in vitro biofilm penetration assay was constructed. First, a 0.22 μm basement membrane was applied onto the bottom of the upper chamber, followed by perfusion with P. gingivalis (5×10⁶ CFU/mL) and culture for 48 h, allowing biofilm formation in the upper chamber. After successful formation of the biofilm, different concentrations of TCDs were added into the upper chamber overlying the 24-well plate, and the P. gingivalis was cultured in the bottom chamber for another 24 h.
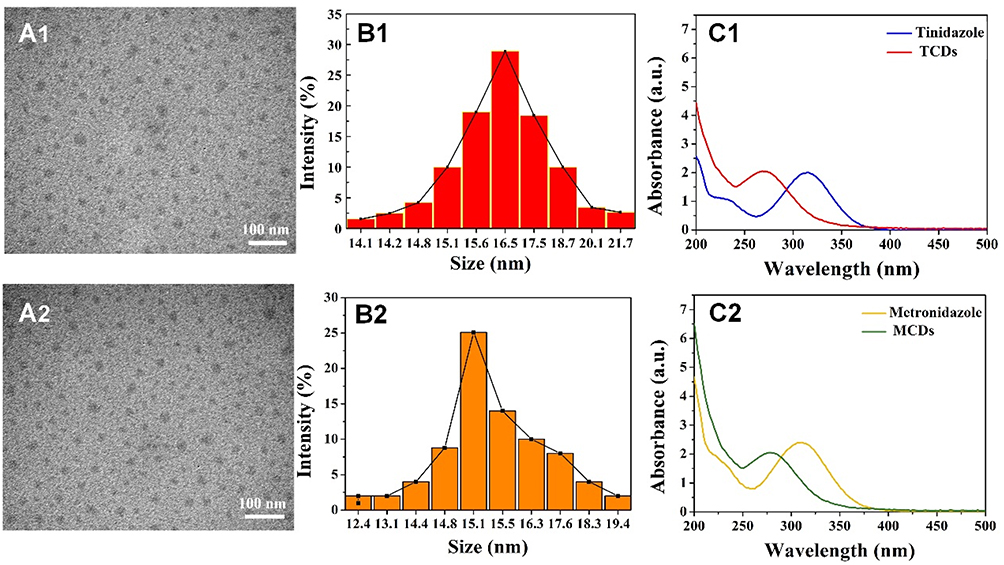 |
Figure 2 Characterization of TCDs and MCDs. TEM images of (A1) TCDs and (A2) MCDs; Size distribution of (B1) TCDs and (B2) MCDs characterized by DLS; UV-vis absorption spectra of (C1) tinidazole and TCDs and (C2) metronidazole and MCDs. Scale bar=100 nm. |
In Vitro Adhesion Model
It is known that P. gingivalis can adhere to teeth and form biofilms in an anaerobic environment, which make up the basis of dental plaque.3,47 Therefore, the effect of TCDs on plaque adherence was determined using single-channel direct-rooted teeth. Teeth from adult cattle were directly washed with saline solution, 3 mL of 25.5% sodium hypochlorite and then 3 mL 17% EDTA to remove the smear layer.48 After washing, the teeth were autoclaved at 121°C for 30 min and then immersed in normal human oral saliva filtered by a 0.22 μm filter. Thereafter, the teeth were added to the P. gingivalis suspension (1×10⁸ CFU/mL) with various concentrations of TCDs and incubated anaerobically for 48 h. Subsequently, the samples were washed with PBS to remove non-adherent bacteria. Finally, the biofilm that formed on the surface of the teeth was measured by staining with 0.1% safranin.
Bacterial Hydrophobicity Assay
The hydrocarbon-xylene test was used to evaluate the bacterial hydrophobicity.49 The surface hydrophobicity of bacteria is one of the non-specific factors contributing to their adherence. The hydrophobic properties of bacteria are responsible for the formation of biofilm and adhesion to host cells. Antibiotic drugs can affect the adhesion of bacteria to a variety of biological and non-biological surfaces by changing the hydrophobicity of the bacterial surface.50 In brief, P. gingivalis was cultured anaerobically in the presence of TCDs. Potassium–urea–magnesium (PUM) buffer was then used to wash the bacteria twice, and the bacteria were diluted to obtain the final ODa (490 nm). Then, the bacterial solution was mixed with an equal volume of xylene and the mixtures were agitated uniformly for 90 s. After allowing 30 min for the hydrocarbon phase to rise completely, the aqueous phase was carefully removed and ODb was determined at 490 nm, using a full-wavelength microplate reader.
Bacterial hydrophobicity (%) = 100% × (ODa – ODb)/ODa
Gene Expression of Biofilm-Related Genes
To evaluate the mechanism by which TCDs inhibit the formation of P. gingivalis biofilm, the key genes involved in biofilm formation by P. gingivalis, namely FimA, RgpA, RgpB and KGP, were investigated.45,51,52 Gel assays were used to investigate the mRNA expression of these genes ( 16s rRNA served as the internal control gene). Overnight-cultured P. gingivalis (1×10⁹ CFU/mL) was diluted 10 times as a bacterial suspension, and seeded in two polystyrene flat-bottomed six-well plates at 100 μL per well. Different concentrations of TCDs were applied, with the PBS-treated group serving as a control, and then cultured under anaerobic conditions until the biofilm formation was detected on the control plate. Then, TriZol was used to extract the total RNA of P. gingivalis. The RNA was reverse transcribed using RTase according to the manufacturer’s protocol (catalog no. 4,374,966; Thermo Fisher Scientific, USA) with DEPC-treated water. The reverse transcript primers used in the reaction system are listed in Table 1.
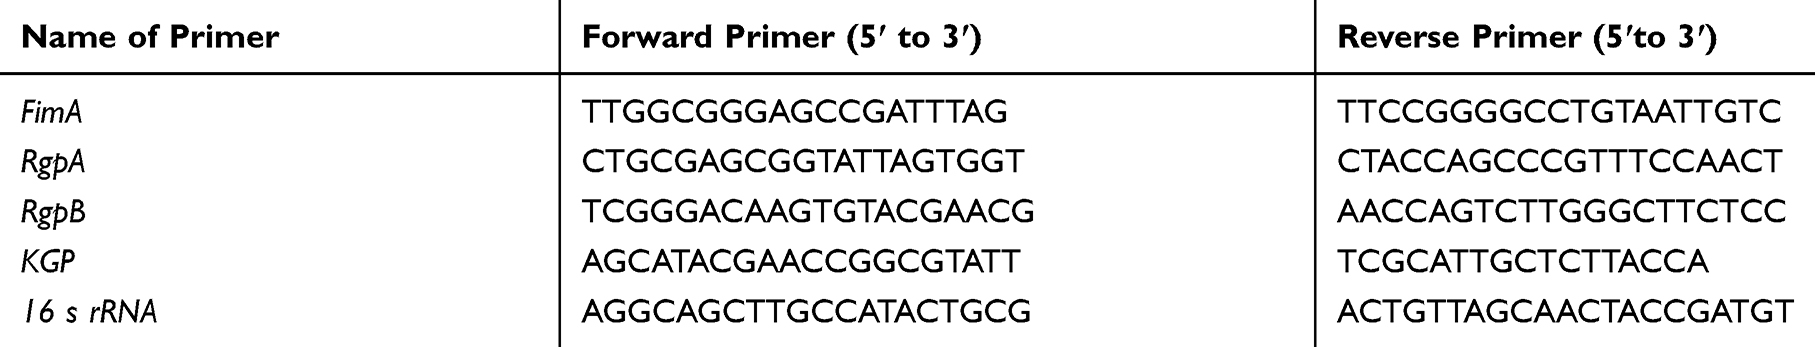 |
Table 1 Gene-Specific Primers Used to Amplify the Biofilm Formation |
Subsequently, 1 μL of the reverse transcript cDNA was added to the PCR system with 1 μL of the forward and reverse primers, respectively, and finally the PCR mix was added to the reaction system up to a total of 20 μL. The reaction system was amplified with 32 cycles at 95°C for 15 s, 60°C for 30 s and 72°C for 30 s.
For PCR product detection, 10 μL of amplified DNA with 5× loading buffer was added to 1% agarose gel for electrophoretic separation at 80 V for 40 min. The intensity of image bands was analyzed by ImageJ software for quantitative analysis.
Statistical Analysis
All statistical analyses of the experimental results were conducted using two-tailed, unpaired Student’s t-tests. The statistical analyses were conducted using SPSS version 23.0 statistical software. A p-value <0.05 was considered statistically significant.
Results and Discussion
Characterization of MCDs and TCDs
In this study, we synthesized TCDs and MCDs based on the anti-anaerobic drugs tinidazole and metronidazole, respectively, through a simple, green, hydrothermal synthetic method.6,53 The TEM images and the size distribution by dynamic light scattering (DLS) of TCDs (Figure 2A1 and B1) and MCDs (Figure 2A2 and B2) illustrated that the predominant diameters of TCDs and MCDs were 16.5 and 15.1 nm, respectively. Furthermore, the nanoparticles retained their uniform hydrodynamic size in water. Figure 2C1 shows the UV-vis spectra of TCDs and tinidazole, and Figure 2C2 shows the UV-vis spectra of MCDs and metronidazole. The pro-drug tinidazole exhibited two broad absorption peaks, at 227 and 315 nm, ascribed to π–π* (C=N) and n–π* (C–N-C), respectively, while the prepared TCDs showed only one peak at 287 nm, which could be credited to n–π* (C–O). The results for MCDs and metronidazole in Figure 2C2 are consistent with previous research reports.37
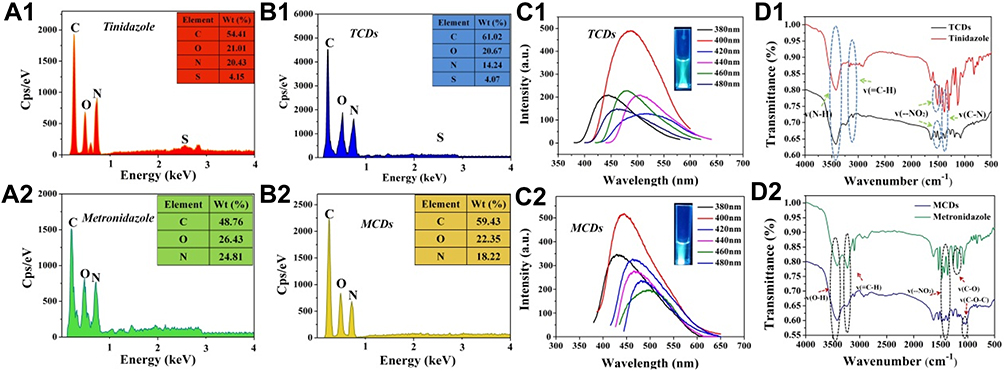 |
Figure 3 EDS spectrum, fluorescence spectrum and FTIR spectra of TCDs and MCDs. Main elemental composition of the (A1) tinidazole and (B1) TCDs, AND (A2) metronidazole and (B2) MCDs; photoluminescent excitation and emission spectra of (C1) TCDs and (C2) MCDs; important functional groups of (D1) tinidazole and TCDs, AND (D2) metronidazole and MCDs. |
The elemental composition and main functional groups of TCDs and MCDs were identified. The EDS spectra of tinidazole and TCDs (Figure 3A1 and B1) indicated that the TCDs mainly consisted of carbon (C; 61.0 atomic percentage [at%]), nitrogen (N; 14.2 at%), oxygen (O; 20.7 at%) and sulfur (S; 4.1 at%). In contrast, tinidazole mainly comprised C (54.1 at%) and N (20.4 at%), which demonstrated that the content of carbon rose after the reaction and that carbon polymerization of TCDs had occurred, indicating the successful synthesis of carbon dots. In addition, as shown in Figure 3A2 and B2, the elemental composition of metronidazole comprised C (48.76 at%), O (26.43 at%) and N (24.81 at%) before reaction, but the MCDs mainly consisted of C (59.43 at%), O (22.35 at%) and N (18.22 at%) after preparation, which was consistent with the results for the TCDs. The photoluminescent properties of TCDs and MCDs were measured with excitation wavelengths from 380 to 480 nm. As shown in Figure 3C1, the TCDs have an excellent emission intensity at the excitation wavelength of 400 nm and the emission wavelength of 492 nm. The inset image in Figure 3C1 demonstrates that the TCDs showed blue–green fluorescence at 492 nm. In Figure 3C2, the optimal emission of TCDs was at 463 nm under 400 nm excitation. The FTIR spectra (Figure 3D1) of tinidazole exhibited absorption bonds at 3420, 3161, 1611–1511, 1369 and 1131–1264 cm−1, which were attributed to the stretching vibrations of v(N–H), v(=C–H), v(–NO2) and v(C–N). Furthermore, some original functional groups were still retained under high temperature and high pressure through the analysis of the FTIR spectrum of the TCDs (Figure 3D1), such as stretching vibrations of N–H at around 3417 cm−1 with strong and broad absorption peaks, which may be caused by the bending vibrations of N–H; the bonds at 1540–1470 and 1010–1090 cm−1 corresponded to C–N and C–H, respectively. The results for metronidazole and MCDs in Figure 3D2 resemble previous findings.37 The formation of these chemical bonds was mainly due to the physical changes and chemical reaction processes. Notably, –NO2 was also detected in TCDs, but its relative content in the nanoparticles was lower than that in tinidazole, perhaps because some of them had been reduced during the process of reaction. It has been reported that anaerobic bacteria can reduce the nitroimidazole nitro group to hydroxylamine by electron transfer proteins, which leads to reactions with bacterial proteins and DNA to prevent the synthesis of all nucleic acids.9,11,37 These results demonstrate that TCDs were successfully prepared through a simple and green hydrothermal method, and that they retained the bacteriostatic group.37
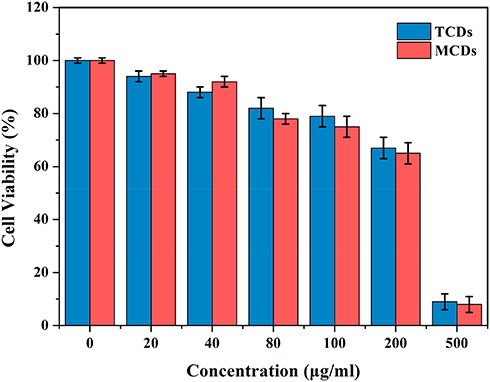 |
Figure 4 Cell viability of L0-2 cell after incubation with various concentrations of TCDs and MCDs for 24 h. Data are shown as mean ± SD (n=3) with significance value *p < 0.05. |
Biocompatibility of TCDs and MCDs
Good biocompatibility and low toxicity of nanomaterials are excellent indicators for biomedical applications. Therefore, normal human liver L0-2 cells were treated with different concentrations of MCDs and TCDs for biocompatibility assays. Figure 4 shows that the viability of L0-2 cells was more than 80% after 24 h of incubation with TCDs, even when the concentration reached 100 μg/mL. The cell viability decreased to 67.3% and 65.6% after treatment with 200 μg/mL TCDs and MCDs, respectively; however, cell viability reduced to 9% and 8.1% at the concentration of 500 μg/mL. These results demonstrate that TCDs exhibited good biocompatibility and low toxicity at a concentration of <200 μg/mL. We also measured the hemolytic activity of red blood cells treated with different concentrations of TCDs and MCDs. A hemolysis rate <5% is considered to demonstrate good blood compatibility. The results in Table 2 show that the hemolysis rates were 4.5% and 4.6% (<5%) when treated with 100 μg/mL TCDs and MCDs, respectively; however, the hemolysis rates increased to 10.9% and 11.1% (>5%), respectively, with a concentration of 200 μg/mL, and were even higher at the concentration of 500 μg/mL, indicating poor blood compatibility at a concentration > 200 μg/mL of TCDs or MCDs, which was consistent with the cytotoxicity results.
 |
Table 2 Erythrocyte Hemolytic Activity After Treatment with Different Concentrations of TCDs and MCDs |
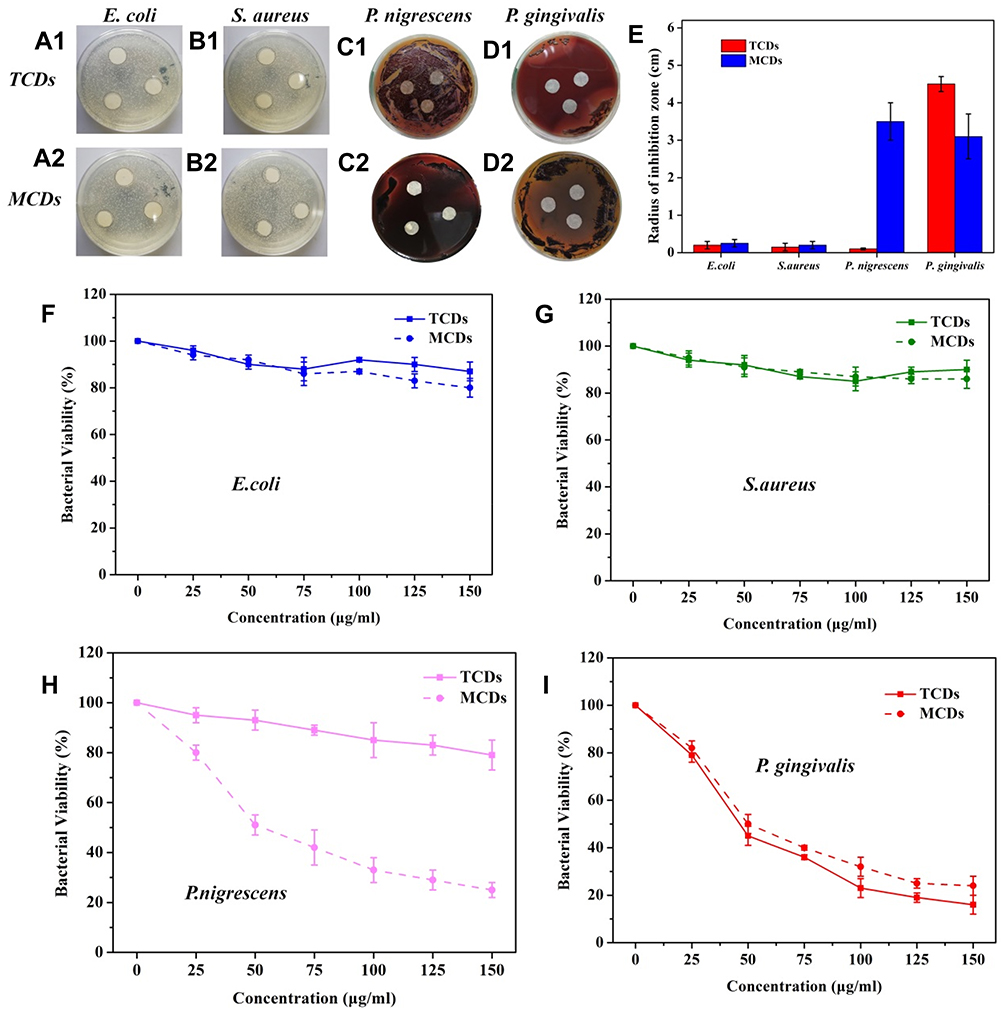 |
Figure 5 Inhibitory effects of TCDs and MCDs on E. coli, S. aureus, P. nigrescens and P. gingivalis growth. Inhibition zone experiments of (A1–D1) TCDs and (A2–D2) MCDs on E. coli, S. aureus, P. nigrescens and P. gingivalis, respectively. (E) Statistical results of the inhibition zone radius. Bacterial inhibition of the different concentration of TCDs and MCDs on (F) E. coli, (G) S. aureus, (H) P. nigrescens and (I) P. gingivalis in liquid media. |
Selective Inhibition of Bacterial Growth by TCDs and MCDs
As commonly used antibacterial drugs, metronidazole and tinidazole are especially effective against Gram-negative and anaerobic bacteria.9,54 Therefore, we tested the specific inhibitory effects of TCDs and MCDs on the proliferation of different bacteria. Thus, E. coli, S. aureus, P. gingivalis and P. nigrescens were selected for testing the inhibitory zone with different concentrations of TCDs or MCDs. As shown in Figure 5A1 and A2 and B1 and B2, no obvious inhibitory zones formed around the filter paper treated with TCDs or MCDs on the (E. coli and S. aureus) bacterial plates. However, obvious inhibitory zones for P. gingivalis were observed around filter papers treated with TCDs and MCDs (Figure 5D1 and D2). It should be noted that the MCDs had a significant inhibitory effect on P. nigrescens (Figure 5C2); however, the TCDs (Figure 5C1) had a weaker effect than MCDs on P. nigrescens. The statistical results of the radius of the inhibition zone (Figure 5E) indicate that TCDs demonstrated an excellent antibacterial effect on P. gingivalis. To further determine the effect of TCDs and MCDs on the inhibition of the bacteria, different concentrations of TCDs and MCDs were added to liquid media by examining the OD value to monitor the growth of the bacteria. The results in Figure 5F–I show that the TCDs and MCDs had no significant inhibitory effect on E. coli (Gram-negative bacteria) and S. aureus (Gram-positive bacteria) growth; however, the TCDs and MCDs both showed significant inhibitory effects against P. gingivalis growth, which is consistent with the results of the above inhibition zone experiments. The MCDs (Figure 5H) still had bactericidal activity against P. nigrescens, while the TCDs showed weaker inhibition on P. nigrescens. It is reported that the oral environment is maintained by a variety of microorganisms, but this characteristic of MCDs would lead to the disruption of the normal oral flora and destruction of the oral microecological environment, which would cause serious damage to body.29,51 These results confirm that TCDs had extraordinary bactericidal activity against P. gingivalis and showed no significant inhibition of other Gram-negative anaerobic bacteria. As expected, TCDs exhibited more specific inhibition than MCDs for P. gingivalis growth; more importantly, the inhibitory effect of TCDs on P. gingivalis reached more than 80%, which is better than the 73% bactericidal effect of carbon dot drugs reported by Liu et al,37 and the antibacterial effects of TCDs depended to a large extent on the antibacterial activity of the nitro group.
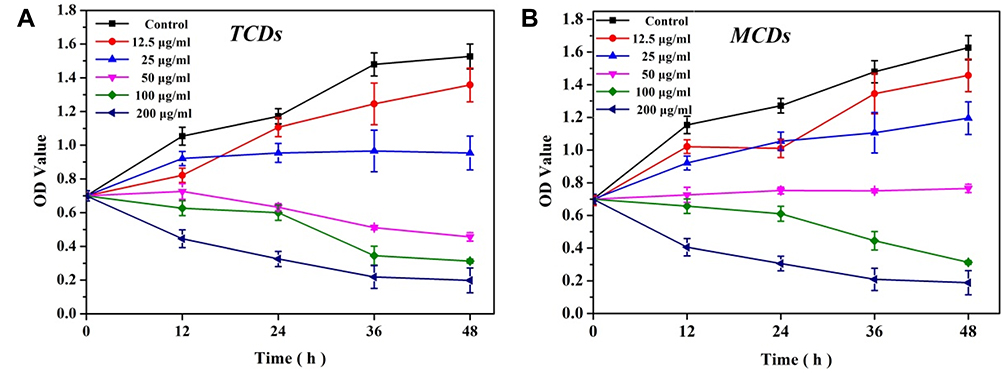 |
Figure 6 Minimum inhibitory concentration test of TCDs and MCDs on P. gingivalis. (A) Growth and proliferation curve of P. gingivalis treated with TCDs with times increased. (B) different concentrations of MCDs against P. gingivalis. |
Furthermore, the antimicrobial susceptibility of P. gingivalis to TCDs and MCDs was evaluated by measuring the MIC values. The results for TCDs (Figure 6A) demonstrated that they had remarkable antibacterial ability against P. gingivalis and provided the minimum concentration for use in further research. We observed that the growth of P. gingivalis at low concentrations was slower than in the control group; even at a concentration of 25 μg/mL, the bacterial growth was nearly completely inhibited and then the growth declined as the concentration was further increased. When the concentration of MCDs reached 50 μg/mL (Figure 6B), the growth of P. gingivalis treated with MCDs became stationary, and no significant bactericidal activity emerged until higher concentrations were used. However, the use of higher drug concentrations could lead to bacterial resistance and a decline in biocompatibility, which would ultimately limite its applications.6 Therefore, the TCDs were selected for further research, and these results laid the foundation for further exploration of the anti-biofilm activity and mechanisms of action of TCDs.
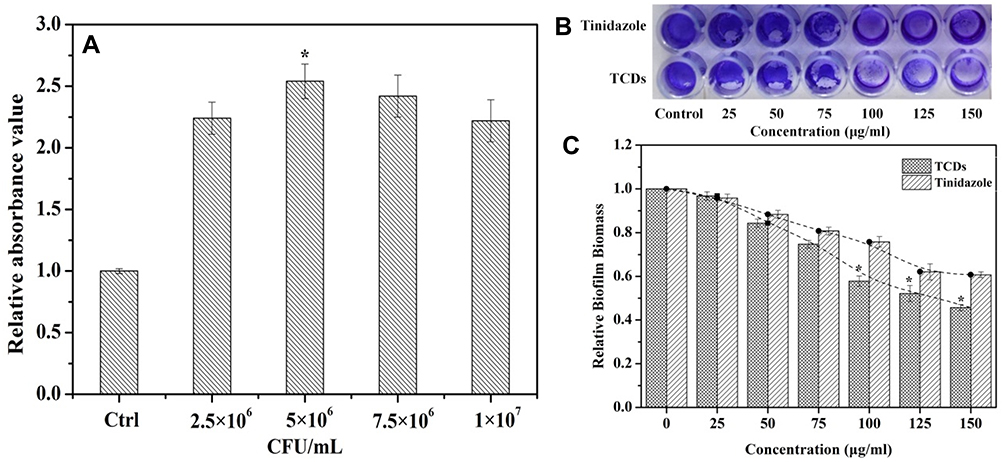 |
Figure 7 Inhibitory effect of TCDs on P. gingivalis biofilm formation. (A) Detection of biofilm produced by different concentrations of P. gingivalis bacteria for 24 h. (B) P. gingivalis biofilm treated with different concentrations of TCDs or tinidazole after staining with crystal violet. (C) Effects of different concentrations of TCDs or tinidazole on the biofilm formation of P. gingivalis. Data are shown as mean ± SD (n=3) with significance value *p<0.05. |
Inhibitory Effect of TCDs on P. gingivalis Biofilm Formation
Biofilms can wrap around microorganisms and protect them from being killed by drugs. The protective function is afforded by the extracellular matrix (ECM) and several types of biomolecules (polysaccharides, DNA and peptides). Because of the protective function of biofilms, P. gingivalis has durable resistance and viability, which increases the difficulty of treating oral-related diseases.2,3 Semi-quantitative analysis of crystal violet staining is a method for judging the amount of biofilm produced by bacteria through the detection of decolorization after staining the biofilm using crystal violet.7 The results of biofilm formation experiments (Figure 7A) illustrated that when the number of P. gingivalis was 5×10⁶ CFU/mL, a greater biomass of biofilm formation was detected compared with the control group; however, the amount of biofilm formation did not increase as the amount of bacteria increased to 7.5×10⁶ or even 1×10⁷ CFU/mL. We speculated that the growth of biofilm was reduced because of the limited space for growth of P. gingivalis. Simultaneously, this provided a reliable reference value for the quantity of bacterial mass required to form a complete biofilm. Images of P. gingivalis biofilms stained with crystal violet after TCD treatment are shown in Figure 7B and C. The first well, without TCD treatment, completely maintained the production of biofilms; then, the production of biofilms gradually decreased with increasing concentrations of TCDs, and TCDs almost completely inhibited the formation of biofilm at the concentration of 150 μg/mL, which is consistent with previous reports.55 Although tinidazole can also inhibit the formation of biofilm, its effect was not as obvious as that of the TCDs (Figure 7B and C).
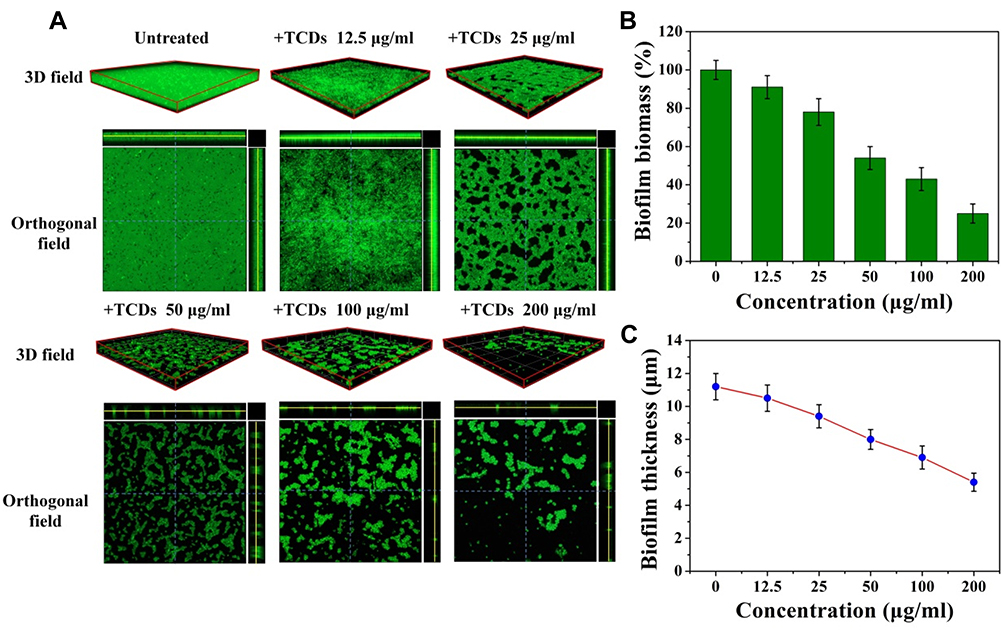 |
Figure 8 Inhibitory effects of TCDs on P. gingivalis biofilm formation monitored by CLSM. (A) 3D and orthogonal fields of the inhibitory effects of different concentrations of TCDs on P. gingivalis and biofilms by CLSM; (B) biomass of biofilms after treatments was quantified by FITC fluorescence intensity; (C) biofilm thickness analysis. |
To more intuitively evaluate the effect of TCDs on P. gingivalis biofilm formation, we employed CLSM to analyze the clearance and permeability of different concentrations of TCDs on FITC-labeled P. gingivalis, and the formation of biofilms in 3D and orthogonal fields.13 As shown in Figure 8A, a dense biofilm was observed in the 3D field of the untreated group, and the corresponding orthogonal field of view also showed a higher biofilm thickness. In contrast, incomplete biofilms were observed on the surface of the confocal dish treated with TCDs at 25 μg/mL. As the concentration increased, the number of biofilms on the bacteria attached to the surface of the dish decreased significantly, and the result of relative quantification for biofilm biomass from fluorescence intensity showed that the biofilms reduced by 75% when the concentration of TCDs reached 200 μg/mL (Figure 8B). In addition, the quantitative results for average biofilm thickness showed that the relative thickness decreased to 5.4 μm (Figure 8C). Therefore, TCDs showed an excellent effect in inhibiting biofilm formation.
Penetration of TCDs into Biofilm and Inhibition of P. gingivalis Growth
Bacteria can escape being killed by large-scale antibiotics because common drug particles are unable to cross the grumous biofilm.8 We constructed a biofilm model for in vitro experiments on biofilm penetration to kill P. gingivalis (Figure 9A). Thus, 0.22 μm filter membranes were pasted on the bottom of the upper chamber, used as a base on which P. gingivalis was cultured, then 1×10⁷ CFU of bacteria were added and cultured for 48 h to form a biofilm on the chamber. When the biofilm model had successfully formed, different concentrations of TCDs were added to the upper chamber. As shown in Figure 9B, the growth of P. gingivalis cultured in the lower chamber was significantly inhibited, suggesting that TCDs could penetrate the biofilm and inhibit the growth of P. gingivalis cultured in the lower chamber. It should be noted that when the concentration of TCDs was below 50 μg/mL, there was no obvious inhibitory effect on the growth of P. gingivalis. Only concentrations of TCDs above 50 μg/mL showed significant antibacterial activity on P. gingivalis compared with the control, while tinidazole did not kill P. gingivalis cultured in the bottom chamber. Therefore, we speculated that the TCDs could cross the biofilm and cause lethality to P. gingivalis at higher concentrations. Furthermore, as shown in Figure 9C1–E1, SEM images of P. gingivalis biofilm treated with different concentrations of TCDs or tinidazole demonstrated that a dense biofilm with many long strips of fibers on the surface was formed after 72 h incubation with P. gingivalis. After treatment with different concentrations of TCDs, small pores were produced, which facilitated the penetration of TCDs into the biofilm. When the concentration of TCDs reached 100 μg/mL, the biofilm was severely destroyed (Figure 9C1–E1). In contrast, tinidazole did not display any drastic effects on the biofilm (Figure 9C2–E2). Therefore, the nanostructures of TCDs may play an important role in penetrating the biofilm by affecting the ability of P. gingivalis to produce fibrin, which is an important component of mature biofilms.17
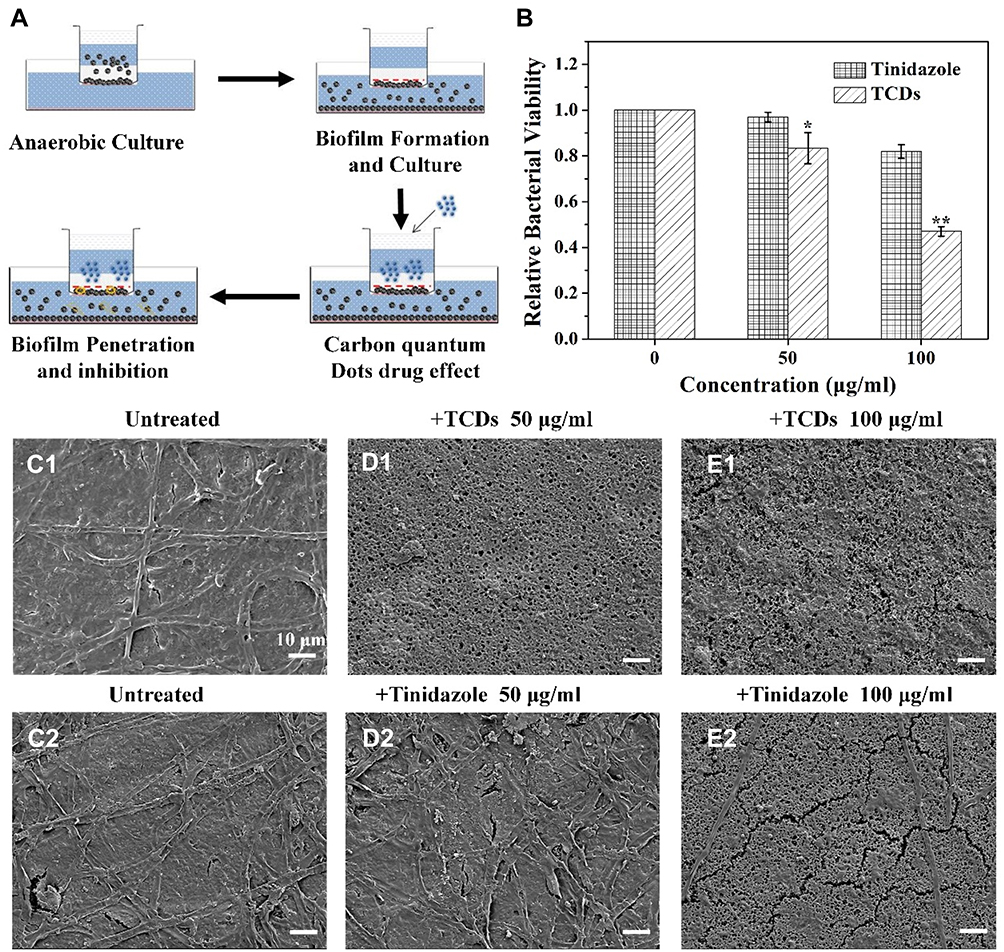 |
Figure 9 Penetration of TCDs into biofilm and inhibition of P. gingivalis growth. (A) Schematic diagram of biofilm penetration sterilization experiment. (B) Effects of different concentrations of TCDs or tinidazole penetrating the biofilm and killing the P. gingivalis bacteria. (C1–E1) SEM images of P. gingivalis biofilm treated with different concentrations of TCDs or (C2–E2) tinidazole; scale bars=10 µm. Data are shown as mean ± SD (n=3) with significance values *p<0.05 and **p<0.01. |
Effect of TCDs on the Adhesion of P. gingivalis
The adhesion of P. gingivalis biofilms on dental surfaces was also tested in the presence of different concentrations of TCDs and tinidazole. As shown in Figure 10A and B, the adhesion of P. gingivalis biofilms was significantly reduced in all the experiments that treated the surface with TCDs from 12.5 to 200 µg/mL, while the bacterial biofilms adhesion in the tinidazole treatment group did not show obvious differences compared with the TCD treatment group. The results revealed that the adherence of P. gingivalis had high sensitivity to the TCDs, while the untreated group showed no inhibitory effect on the adherence activity of P. gingivalis biofilms; similarly, the adhesion was hardly affected in the tinidazole treatment group.
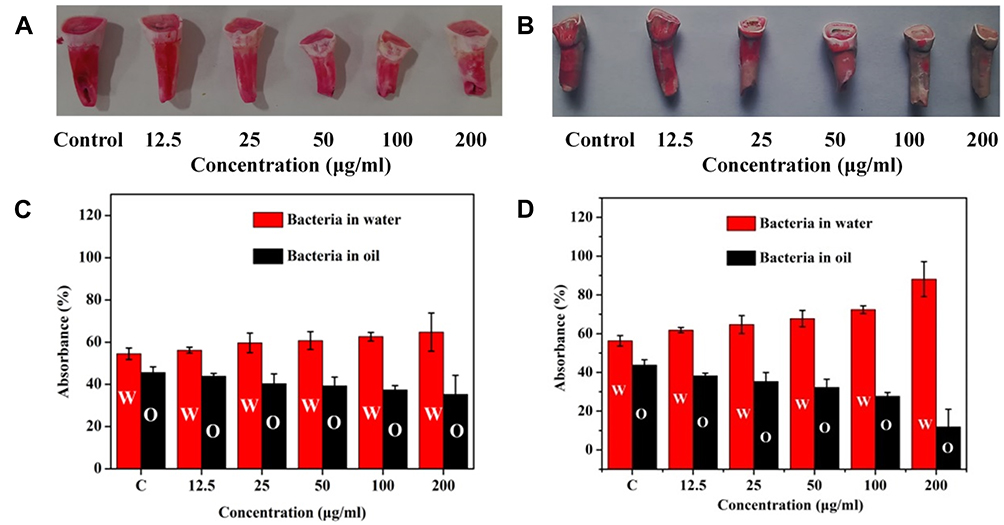 |
Figure 10 In vitro bacterial adhesion model and bacterial hydrophobicity experiments. Detection of P. gingivalis adhesion tooth models with different concentrations of (A) tinidazole or (B) TCDs using 0.1% safranin staining in vitro. Hydrophobicity of P. gingivalis with different concentrations of (C) tinidazole or (D) TCDs for 24 h. |
Studies have shown that changes in bacterial surface hydrophilicity can cause alterations in bacterial adhesion. Therefore, we investigated the effect of TCDs on the hydrophilicity of P. gingivalis.49,50 As shown in Figure 10D, as the concentration of TCDs increased, the concentration of P. gingivalis in the oil phase was reduced, indicating that the surface hydrophobicity of the bacteria was continuously decreasing. Similarly, the absorbance of P. gingivalis in water treated with TCDs was significantly higher than that in oil, which was in stark contrast to the pro-drug tinidazole (Figure 10C), suggesting that hydrophilic TCDs can increase the hydrophilicity of P. gingivalis and thus reduce the adhesion of bacteria on biofilms, consistent with previous reports.49,50
Effect of TCDs on Genes Related to Biofilm Formation of P. gingivalis
Porphyromonas gingivalis biofilm formation is regulated by multiple genes. Among them, the long fimbriae A (Fim A) encoded by the Fim A gene plays a key role in the adhesion of P. gingivalis, and also affects the formation of the biofilm.4,5 In addition, arg-gingipain (RgpA, RgpB) and lysine-specific cysteine proteases (Kgp) are also essential for the processing and maturation of Fim A proteins, thus promoting the adhesion of P. gingivalis to host tissues. The Fim A, Rgp (A, B) and KGP genes are decisive in the pathogenicity of P. gingivalis and also affect the important component of biofilms: lipopolysaccharide.57,58 Therefore, the mRNA expression of the related genes in P. gingivalis treated with different concentrations of TCDs was detected by RT-PCR. As shown in Figure 11, the semi-quantitative analysis results showed that the mRNA expression of Fim A, Rgp A, Rgp B and KGP decreased drastically. Therefore, we speculate that the protein expression of Fim A, Rgp (A, B) and KGP will be decreased correspondingly, thus affecting the self-assembly of proteins and preventing the formation of biofilms.59
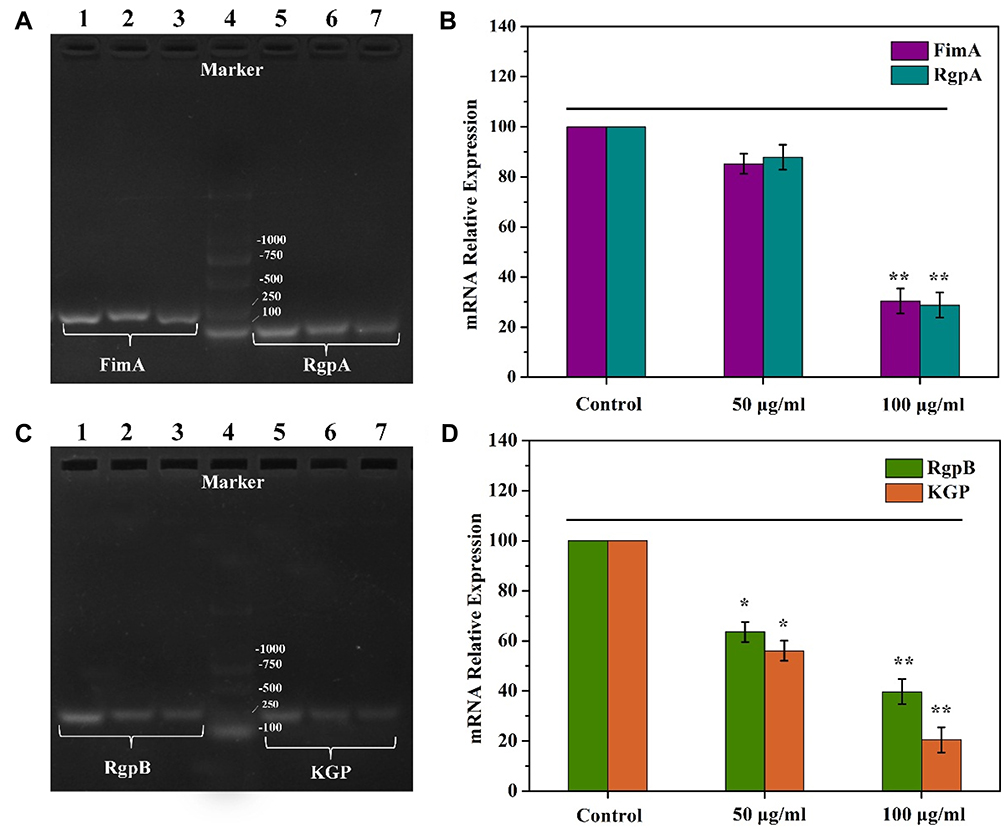 |
Figure 11 The gene expression of biofilm formation regulation by Fim A, Rgp A, Rgp B and KGP in P. gingivalis. (A) Detection of Fim A and Rgp A gene expression by agarose gel electrophoresis. (B) Semi-quantitative analysis with gene expression of Fim A and Rgp A gene corresponding to (A); (C) Detection of Rgp B and KGP gene expression by agarose gel electrophoresis. (D) Semi-quantitative analysis with gene expression of Rgp B and KGP corresponding to (C). Data are shown as mean ± SD (n=3) with significance value *p < 0.05 and **p < 0.01. |
Conclusions
In summary, carbon quantum dot drugs (TCDs and MCDs) were successfully synthesized from the pro-drugstinidazole and metronidazole by a hydrothermal method. The TCDs and MCDs retained the main bactericidal functional group –NO2 and presented low toxicity and good watersolubility. The hydrophilic TCDs exhibited uniquely specific antibacterial properties and excellent effects in inhibiting P. gingivalis biofilm formation. More importantly, we constructed a biofilm model in experiments on biofilm penetration to kill P. gingivalis, for the first time in vitro, and proved that the nanoscale TCDs can pass through the biofilm to induce significant inhibition of P. gingivalis under the biofilm. Consequently, the successful preparation of TCDs may not only develop into promising methods for preparing antibacterial drugs at the nano-level, but also provide new ways of treating P. gingivalis-related diseases.
Acknowledgments
This research was supported by grants from the National Natural Science Foundation of China (81741147), China Postdoctoral Science Foundation funded project (2019M652533), Henan scientific and technological research projects (192102310189) and Innovation Scientists and Technicians Troop Construction Projects of Henan Province (CXTD2017071).
Disclosure
The authors declare no conflicts of interest.
References
1. Capasso C, Supuran CT. Bacterial, fungal and protozoan carbonic anhydrases as drug targets. Expert Opin Ther Targets. 2015;19(12):1689–1704. doi:10.1517/14728222.2015.1067685
2. How KY, Song KP, Chan KG. Porphyromonas gingivalis: an overview of periodontopathic pathogen below the gum line. Front Microbiol. 2016;7. doi:10.3389/fmicb.2016.00053
3. Mikuls TR, Payne JB, Yu F, et al. Periodontitis and Porphyromonas gingivalis in patients with rheumatoid arthritis. Arthritis Rheum. 2014;66(5):1090–1100. doi:10.1002/art.38348
4. Kuboniwa M, Amano A, Hashino E, et al. Distinct roles of long/short fimbriae and gingipains in homotypic biofilm development by Porphyromonas gingivalis. BMC Microbiol. 2009;9(1):13. doi:10.1186/1471-2180-9-105
5. Ito R, Ishihara K, Shoji M, et al. Hemagglutinin/adhesin domains of Porphyromonas gingivalis play key roles in coaggregation with Treponema denticola. FEMS Immunol Med Microbiol. 2010;60(3):251–260. doi:10.1111/j.1574-695X.2010.00737.x
6. Wang YQ, Jin Y, Chen W, et al. Construction of nanomaterials with targeting phototherapy properties to inhibit resistant bacteria and biofilm infections. Chem Eng J. 2019;358:74–90. doi:10.1016/j.cej.2018.10.002
7. Stepanovic S, Vuković D, Dakić I, et al. A modified microtiter-plate test for quantification of staphylococcal biofilm formation. J Microbiol Methods. 2000;40(2):175–179. doi:10.1016/S0167-7012(00)00122-6
8. Bernier SP, Lebeaux D, DeFrancesco AS, et al. Starvation, together with the SOS response, mediates high biofilm-specific tolerance to the fluoroquinolone ofloxacin. PLoS Genet. 2013;9(1):14. doi:10.1371/journal.pgen.1003144
9. Fung HB, Doan T-L. Tinidazole: a nitroimidazole antiprotozoal agent. Clin Ther. 2005;27(12):1859–1884. doi:10.1016/j.clinthera.2005.12.012
10. Liang G, Wang H, Shi H, et al. Porphyromonas gingivalis promotes the proliferation and migration of esophageal squamous cell carcinoma through the miR-194/GRHL3/PTEN/Akt axis. ACS Infect Dis. 2020;6(5):871–881. doi:10.1021/acsinfecdis.0c00007
11. Ingham HR, Selkon JB, Hale JH. The antibacterial activity of metronidazole. J Antimicrob Chemother. 1975;1(4):355–361. doi:10.1093/jac/1.4.355
12. Xu X, Zhang K, Zhao L, et al. Aspirin-based carbon dots, a good biocompatibility of material applied for bioimaging and anti-inflammation. ACS Appl Mater Interfaces. 2016;8(48):32706. doi:10.1021/acsami.6b12252
13. Bae K, Zheng W, Ma Y, Huang Z. Real-time monitoring of pharmacokinetics of antibiotics in biofilms with raman-tagged hyperspectral stimulated raman scattering microscopy. Theranostics. 2019;9(5):1348.
14. Dominy SS, Lynch C, Ermini F, et al. Porphyromonas gingivalis in Alzheimer’s disease brains: evidence for disease causation and treatment with small-molecule inhibitors. Sci Adv. 2019;5(1):eaau3333. doi:10.1126/sciadv.aau3333
15. Neethirajan S, Clond MA, Vogt A. Medical biofilms–nanotechnology approaches. J Biomed Nanotechnol. 2014;10(10):2806–2827. doi:10.1166/jbn.2014.1892
16. Tursi SA, Tükel Ç. Curli-containing enteric biofilms inside and out: matrix composition, immune recognition, and disease implications. Microbiol Mol Biol Rev. 2018;82(4):e00028–18.
17. Wang Y, Kadiyala U, Qu Z, et al. Anti-biofilm activity of graphene quantum dots via self-assembly with bacterial amyloid proteins. ACS Nano. 2019;13(4):4278–4289. doi:10.1021/acsnano.8b09403
18. Sanchez CJ, Akers KS, Romano DR, et al. D-amino acids enhance the activity of antimicrobials against biofilms of clinical wound isolates of Staphylococcus aureus and Pseudomonas aeruginosa. Antimicrob Agents Chemother. 2014;58(8):4353–4361. doi:10.1128/AAC.02468-14
19. Read TRH, Fairley CK, Murray GL, et al. Outcomes of resistance-guided sequential treatment of Mycoplasma genitalium infections: a prospective evaluation. Clin Infect Dis. 2019;68(4):554–560. doi:10.1093/cid/ciy477
20. Wang BL, Ren K-F, Chang H, et al. Construction of degradable multilayer films for enhanced antibacterial properties. ACS Appl Mater Interfaces. 2013;5(10):4136–4143. doi:10.1021/am4000547
21. Stewart PS, Costerton JW. Antibiotic resistance of bacteria in biofilms. Lancet (London, England). 2001;358(9276):135–138. doi:10.1016/S0140-6736(01)05321-1
22. Sanchez CJ, Mende K, Beckius ML, et al. Biofilm formation by clinical isolates and the implications in chronic infections. BMC Infect Dis. 2013;13(1). doi:10.1186/1471-2334-13-47.
23. Akers KS, Mende K, Cheatle KA, et al. Biofilms and persistent wound infections in United States military trauma patients: a case-control analysis. BMC Infect Dis. 2014;14(1). doi:10.1186/1471-2334-14-190.
24. Arciola CR, Campoccia D, Montanaro L. Implant infections: adhesion, biofilm formation and immune evasion. Nat Rev Microbiol. 2018;16(7):397–409. doi:10.1038/s41579-018-0019-y
25. Wang B-L, Liu X-S, Ji Y, et al. Fast and long-acting antibacterial properties of chitosan-Ag/polyvinylpyrrolidone nanocomposite films. Carbohydr Polym. 2012;90(1):8–15. doi:10.1016/j.carbpol.2012.03.080
26. Wang B, Liu H, Sun L, et al. Construction of high drug loading and enzymatic degradable multilayer films for self-defense drug release and long-term biofilm inhibition. Biomacromolecules. 2018;19(1):85–93. doi:10.1021/acs.biomac.7b01268
27. Cekici A, Kantarci A, Hasturk H, et al. Inflammatory and immune pathways in the pathogenesis of periodontal disease. Periodontology 2000. 2014;64(1):57–80. doi:10.1111/prd.12002
28. Fan X, Alekseyenko AV, Wu J, et al. Human oral microbiome and prospective risk for pancreatic cancer: a population-based nested case-control study. Gut. 2018;67(1):120–127. doi:10.1136/gutjnl-2016-312580
29. Kolenbrander PE, Palmer RJ, Periasamy S, et al. Oral multispecies biofilm development and the key role of cell-cell distance. Nat Rev Microbiol. 2010;8(7):471–480. doi:10.1038/nrmicro2381
30. Asally M, Kittisopikul M, Rue P, et al. Localized cell death focuses mechanical forces during 3D patterning in a biofilm. Proc Natl Acad Sci U S A. 2012;109(46):18891–18896. doi:10.1073/pnas.1212429109
31. Loo C-Y, Rohanizadeh R, Young PM, et al. Combination of silver nanoparticles and curcumin nanoparticles for enhanced anti-biofilm activities. J Agric Food Chem. 2016;64(12):2513–2522. doi:10.1021/acs.jafc.5b04559
32. Mu H, Tang J, Liu Q, et al. Potent antibacterial nanoparticles against biofilm and intracellular bacteria. Sci Rep. 2016;6(1). doi:10.1038/srep18877.
33. Liu C, Faria AF, Ma J, et al. Mitigation of biofilm development on thin-film composite membranes functionalized with zwitterionic polymers and silver nanoparticles. Environ Sci Technol. 2017;51(1):182–191. doi:10.1021/acs.est.6b03795
34. Thuy-Khanh N, Lam SJ, Ho KKK, et al. Rational design of single-chain polymeric nanoparticles that kill planktonic and biofilm bacteria. Acs Infect Dis. 2017;3(3):237–248. doi:10.1021/acsinfecdis.6b00203
35. Christensen IL, Sun Y-P, Juzenas P. Carbon dots as antioxidants and prooxidants. J Biomed Nanotechnol. 2011;7(5):667–676. doi:10.1166/jbn.2011.1334
36. Pan L, Sun S, Zhang A, et al. Truly fluorescent excitation-dependent carbon dots and their applications in multicolor cellular imaging and multidimensional sensing. Adv Mater. 2015;27(47):7782–7787. doi:10.1002/adma.201503821
37. Liu J, Lu S, Tang Q, et al. One-step hydrothermal synthesis of photoluminescent carbon nanodots with selective antibacterial activity against Porphyromonas gingivalis. Nanoscale. 2017;9(21):7135–7142. doi:10.1039/C7NR02128C
38. Namdari P, Negahdari B, Eatemadi A. Synthesis, properties and biomedical applications of carbon-based quantum dots: an updated review. Biomed Pharmacother. 2017;87:209–222. doi:10.1016/j.biopha.2016.12.108
39. Liu JJ, Li D, Zhang K, Yang M, Sun H, Yang B. One-step hydrothermal synthesis of nitrogen-doped conjugated carbonized polymer dots with 31% efficient red emission for in vivo imaging. Small. 2018;14(15):10.
40. Lin F, Li C, Chen Z. Bacteria-derived carbon dots inhibit biofilm formation of Escherichia coli without affecting cell growth. Front Microbiol. 2018;9. doi:10.3389/fmicb.2018.00259
41. Shaikh AF, Tamboli MS, Patil RH, et al. Bioinspired carbon quantum dots: an antibiofilm agents. J Nanosci Nanotechnol. 2019;19(4):2339–2345. doi:10.1166/jnn.2019.16537
42. Otis G, Bhattacharya S, Malka O, et al. Selective labeling and growth inhibition of Pseudomonas aeruginosa by aminoguanidine carbon dots. Acs Infect Dis. 2019;5(2):292–302. doi:10.1021/acsinfecdis.8b00270
43. Qian Z, Ma J, Shan X, et al. Highly luminescent N-doped carbon quantum dots as an effective multifunctional fluorescence sensing platform. Chemistry. 2014;20(8):2254–2263. doi:10.1002/chem.201304374
44. Castro HPS, Souza VS, Scholten JD, et al. Synthesis and characterisation of fluorescent carbon nanodots produced in ionic liquids by laser ablation. Chemistry. 2016;22(1):138–143. doi:10.1002/chem.201503286
45. He L, Wang H, Zhang R, et al. The regulation of Porphyromonas gingivalis biofilm formation by ClpP. Biochem Biophys Res Commun. 2019;509(2):335–340. doi:10.1016/j.bbrc.2018.12.071
46. Roy R, Tiwari M, Donelli G, et al. Strategies for combating bacterial biofilms: a focus on anti-biofilm agents and their mechanisms of action. Virulence. 2018;9(1):522–554. doi:10.1080/21505594.2017.1313372
47. Koren O, Spor A, Felin J, et al. Human oral, gut, and plaque microbiota in patients with atherosclerosis. Proc Natl Acad Sci U S A. 2011;108(Supplement_1):4592–4598. doi:10.1073/pnas.1011383107
48. Ashrafi B, Rashidipour M, Marzban A, et al. Mentha piperita essential oils loaded in a chitosan nanogel with inhibitory effect on biofilm formation against S-mutans on the dental surface. Carbohydr Polym. 2019;212:142–149. doi:10.1016/j.carbpol.2019.02.018
49. Sun YH, Qin H, Yan Z, Zhao C, Ren J, Qu X. Combating biofilm associated infection in vivo: integration of quorum sensing inhibition and photodynamic treatment based on multidrug delivered hollow carbon nitride sphere. Adv Funct Mater. 2019;29(14):12.
50. Cozens D, Read RC. Anti-adhesion methods as novel therapeutics for bacterial infections. Expert Rev Anti Infect Ther. 2012;10(12):1457–1468. doi:10.1586/eri.12.145
51. Luis Ayala-Herrera J, Abud-Mendoza C, Gonzalez-Amaro RF, et al. Distribution of Porphyromonas gingivalis fimA genotypes in patients affected by rheumatoid arthritis and periodontitis. Acta Odontol Scand. 2018;76(7):520–524. doi:10.1080/00016357.2018.1469788
52. Sanchez MC, Romero-Lastra P, Ribeiro-Vidal H, et al. Comparative gene expression analysis of planktonic Porphyromonas gingivalis ATCC 33277 in the presence of a growing biofilm versus planktonic cells. BMC Microbiol. 2019;19(1). doi:10.1186/s12866-019-1423-9.
53. Yi H, Huang D, Qin L, et al. Selective prepared carbon nanomaterials for advanced photocatalytic application in environmental pollutant treatment and hydrogen production. Appl Catal B-Environ. 2018;239:408–424. doi:10.1016/j.apcatb.2018.07.068
54. Samanta HS, Ray SK. Controlled release of tinidazole and theophylline from chitosan based composite hydrogels. Carbohydr Polym. 2014;106:109–120. doi:10.1016/j.carbpol.2014.01.097
55. Liang Z, Qi Y, Guo S, et al. Effect of AgWPA nanoparticles on the inhibition of Staphylococcus aureus growth in biofilms. Food Control. 2019;100:240–246. doi:10.1016/j.foodcont.2019.01.030
56. Li JH, Zhang K, Ruan L, et al. Block copolymer nanoparticles remove biofilms of drug-resistant gram-positive bacteria by nanoscale bacterial debridement. Nano Lett. 2018;18(7):4180–4187. doi:10.1021/acs.nanolett.8b01000
57. Kristoffersen AK, Solli SJ, Duy Nguyen T, Enersen M. Association of the rgpB gingipain genotype to the major fimbriae (fimA) genotype in clinical isolates of the periodontal pathogen Porphyromonas gingivalis. J Oral Microbiol. 2015;7:1.
58. Feng XH, Zhang L, Xu L, et al. Detection of eight periodontal microorganisms and distribution of Porphyromonas gingivalis fimA genotypes in Chinese patients with aggressive periodontitis. J Periodontol. 2014;85(1):150–159. doi:10.1902/jop.2013.120677
59. Beikler T, Peters U, Prior K, et al. Sequence variations in rgpA and rgpB of Porphyromonas gingivalis in periodontitis. J Periodontal Res. 2005;40(3):193–198. doi:10.1111/j.1600-0765.2005.00783.x
 © 2020 The Author(s). This work is published and licensed by Dove Medical Press Limited. The full terms of this license are available at https://www.dovepress.com/terms.php and incorporate the Creative Commons Attribution - Non Commercial (unported, v3.0) License.
By accessing the work you hereby accept the Terms. Non-commercial uses of the work are permitted without any further permission from Dove Medical Press Limited, provided the work is properly attributed. For permission for commercial use of this work, please see paragraphs 4.2 and 5 of our Terms.
© 2020 The Author(s). This work is published and licensed by Dove Medical Press Limited. The full terms of this license are available at https://www.dovepress.com/terms.php and incorporate the Creative Commons Attribution - Non Commercial (unported, v3.0) License.
By accessing the work you hereby accept the Terms. Non-commercial uses of the work are permitted without any further permission from Dove Medical Press Limited, provided the work is properly attributed. For permission for commercial use of this work, please see paragraphs 4.2 and 5 of our Terms.