")
Back to Journals » ClinicoEconomics and Outcomes Research » Volume 12
Socioeconomic Inequality in Self-Medication in Iran: Cross-Sectional Analyses at the National and Subnational Levels
Authors Rezaei S , Hajizadeh M, Ahmadi S, Ebrahimi M , Karami Matin B
Received 3 March 2020
Accepted for publication 16 July 2020
Published 31 July 2020 Volume 2020:12 Pages 411—421
DOI https://doi.org/10.2147/CEOR.S252244
Checked for plagiarism Yes
Review by Single anonymous peer review
Peer reviewer comments 2
Editor who approved publication: Dr Xing Lin Feng
Satar Rezaei,1 Mohammad Hajizadeh,2 Sina Ahmadi,3 Mohammad Ebrahimi,4 Behzad Karami Matin1
1Research Center for Environmental Determinants of Health, Health Institute, Kermanshah University of Medical Sciences, Kermanshah, Iran; 2School of Health Administration, Faculty of Health, Dalhousie University, Halifax, NS, Canada; 3Department of Social Welfare Management, University of Social Welfare and Rehabilitation Sciences, Tehran, Iran; 4Student Research Committee, Kermanshah University of Medical Sciences, Kermanshah, Iran
Correspondence: Behzad Karami Matin Research Center for Environmental Determinants of Health
Health Institute, Kermanshah University of Medical Sciences, Kermanshah, Iran
Tel +98 83 38264164
Postal code +98- 6719851351 Email [email protected]
Background: Self-medication (SM) is a public health concern globally. This study aimed to measure socioeconomic inequality in SM and identify its main determinants among Iranian households.
Methods: A total of 38,859 households from the 2018 Household Income and Expenditure Survey (HIES) were included in the study. Data on SM, household size, age, gender and education status of the head of household, monthly household’s expenditures (as a proxy for socioeconomic status), health insurance coverage and living areas and provinces were obtained for the survey. The concentration curve and the normalized concentration index (Cn) were used to quantify the magnitude of socioeconomic inequality in SM among Iranian households. The Cn was decomposed to identify the main determinants of socioeconomic inequality in SM in Iran.
Results: The results indicated that 18.2% (95% confidence interval [CI]: 17.7% to 18.5%) of households in Iran had SM practice in the past month. The results suggested a higher concentration of SM among the rich households (Cn= 0.0466; 95% CI= 0.0321 to 0.0612) in Iran. The concentration of SM among high SES households was also found in urban (0.0311; 95% CI=0.0112 to 0.0510) and rural (= 0.0513; 95% CI=0.0301 to 0.0726) areas. SM was concentrated among the rich households in Tehran, Qom, Esfahan, Ardebil, Golestan, and Sistan and Baluchestan provinces. In contrast, a higher concentration of SM was found among the poor households in Semnan, North Khorasan, Kerman, Bushehr, and South Khorasan provinces. The decomposition revealed SES of household, itself, as the main contributing factor to the concentration of SM among the wealthy households.
Conclusion: This study demonstrated that SM is more concentrated among socioeconomically advantaged households in Iran. Thus, effective evidence-based interventions should be implemented to improve awareness about SM and its negative consequences. Further studies are required to investigate the consequences of SM practice among people.
Keywords: self-medication, inequality, socioeconomic status, Iran
Introduction
Self-medication (SM) is a major health concern across different groups of the population globally.1 As a self-care behavior, SM has remained a common problem globally, and it is more prevalent in developing countries.2 When individuals faced with a minor or severe illness, they react differently to this situation, and one of the available options is SM.3 SM is defined as obtaining and using any medication without getting advice from a medical doctor for their diagnosis or treatment.4 SM can lead to adverse drug reactions, waste of resources, delay in seeking health care as well as adverse health impact due to an increase in the antimicrobial resistance.5–7
Several studies investigated the prevalence of SM and its main determinants among different population (eg medical and non-medical student, general population, elderly, pregnant women) worldwide.7–13 The prevalence of SM varies between and within countries as well as among the different population. The prevalence of SM is reported to be 12.7% −18% in Spain,14,15 53% in Mexico,16 31% in India,17 60% in China,18 and 60% - 90% in Nigeria.19 Previous studies highlighted that SM is influenced by various factors such as age, gender, education level, marital status, socioeconomic status, health insurance coverage, living area, and availability of the medication for individuals. A study carried out in China suggested that economic status, educational level, household size as well as medicine accessibility had significant associations with the probability of SM.13 A systematic review study by Shaghaghi in Iran indicated prior experience, long waiting time to visit a physician, having a minor illness and healthcare costs as the main reasons to SM.3
Iran is among the top twenty countries in drug consumption in the world. SM is considered a major public health concern in Iran.20 The existing studies provided some evidence on the prevalence of SM and its main determinants in Iran.1,3,20,21 In a study conducted by Shaamekhi et al on the sociodemographic determinants of SM in Tabriz city, the overall prevalence of SM was found to be 71% among those who reported a need to medical care in the last month. The latter study also concluded that the probability of SM is higher among younger age, less-educated individuals and housewives.22 Although the current studies provided some insight on the issue of SM in Iran, to date, no study measured socioeconomic inequality in SM at the national and subnational levels. To fill this gap in the literature, this study, aimed to measure and decompose socioeconomic inequality in SM in Iran. The findings of the current study can potentially provide useful information for policymakers to design effective strategies to reduce socioeconomic inequalities in the SM in Iran.
Methods
Study Setting
Iran is a middle-income country located in the Eastern Mediterranean Region (EMR), with an area of 1,648,000 km2. According to the 2016 census data,23 the population of Iran was approximately 80 million people living in 31 provinces.
Data and Variables
We used data from the 2018 Household Income and Expenditure Survey (HIES) conducted by the Iranian Statistical Center24 The HIES is a large cross-sectional survey, and the unit analysis in this survey is the household. The survey collected information using a face-to-face interview with the head of the household during the year of 2018. The questionnaire used to collect data was designed under the supervisions and recommendations of the United Nations (UN). Three-stage cluster sampling method with strata was used in the HIES. The urban and rural blocks were selected in the second stage. In the final stage, households were selected for the survey. The survey contains information on sociodemographic characteristics of household (eg, household size, the age of head of household, the gender of head of household and education status of head of household), household healthcare utilization (eg, SM), income and expenditure of households in the past month. The 2018 HIES collected information from 38,859 (rural: 18,546 and urban: 20,313) households in Iran.
The outcome variable of interest in the study is a binary variable equal to one if the household used any medication without getting advice from a physician for either diagnosis or treatment (eg, tablet, syrup, etc.) in the last month, and 0 otherwise. Based on the availability of information in the HIES and previous studies,11,25-27 we used gender of household head, age of head of household, health insurance coverage, education status of the head of household, monthly households expenditures (as a proxy for households’ socioeconomic status), living areas (urban/rural) and provincial fixed effects as the determinants of SM in the households. Based on total monthly household expenditures (housing, food, transportation, healthcare, clothing, tobacco, education, furniture, etc.), households were classified into five socioeconomic status (SES) groups from the poorest/first to the richest/fifth quintiles.
Statistical Analysis
Measuring Socioeconomic Inequality in Self-Medication
We used the concentration curve and the concentration index28–30 to illustrate and quantify socioeconomic inequalities in SM among households in Iran and its provinces. The concentration curve plots the cumulative proportion of SM in y-axis against the cumulative proportion of the households ordered by a socioeconomic indicator in the x-axis. If the concentration curve lies below the perfect equality line, it means that the health variable is concentrated more among the high SES individuals and vice versa. The value of  ranges between −1 and +1, with the value zero indicating no socioeconomic inequality. A negative sign of the
  indicates that the health variable is more concentrated among the poor and vice versa. As our outcome variable of interest (SM) is binary, the
  does not range between −1 and +1; thus, as per Wagstaff,31 we normalized the
  by dividing it by
  , where µ is the mean of the SM.
Decomposing Socioeconomic Inequality in Self-Medication
We decomposed the  to identify the main factors affecting the observed socioeconomic inequality in SM. As shown by Wagstaff et al, if we have the following regression model that links SM,
  , to a set of its determinants,
  :
:
The  for SM can be decomposed as:
where  is the mean of
  ,
,  presents the mean of
 shows the
  for
for  ,
,  is the elasticity of SM with respect to the
  . Elasticity indicates the amount of change in SM associated with a one-unit change in the explanatory variable. A positive elasticity for a factor in our study implies as the value of the explanatory variable increases, the probability of SM among households also increases. The share of explanatory factors,
 , to the overall
  for SM denotes by
  . The last term,
 , is the residuals component and indicates the portion of the
  for SM, which cannot be determined by the included explanatory variables in the model.
The normalized concentration index, , for SM can be decomposed using the following formula:
A positive (negative) absolute contribution of an explanatory factor to the  indicates that the socioeconomic distribution of the respective factor and its association with SM leads to higher (lower) SM among the richer households. The relative contribution of each explanatory factor was computed by dividing the absolute contribution for each explanatory factor by the
  and then multiplying by 100. As SM is a binary variable, we used the marginal effect of determinants obtained from non-linear logit regression as
  in our decomposition analysis. All the analyses were performed using Stata Version 14. P-values less than 0.05 considered statistically significant.
Results
Descriptive Statistics
Table 1 presents the descriptive characteristics of the study population. Of the total 38,859 households included in this study, 33,752 (86.8%) headed by men. The mean age of the head of households was 50.4 years (standard deviation [SD]= 15.1). The majority (76%, n=29,524) of the households’ head was literate, and 88.4% of the study population had health insurance coverage. On average, the prevalence of SM among households was 18.2% (95% confidence interval [CI]: 17.7% to 18.5%). The variation of SM among households across the 31 provinces of Iran is shown in Figure 1. As indicated in Figure 1, there is a great variation among the provinces in SM in Iran. While the prevalence of SM in Khuzestan province was 2.4%, the corresponding figure for Kohgiluyeh Buyer Ahmad was 42.8%. The proportion of households with SM varied across different socioeconomic groups of households. The prevalence of SM was 16.1% (95% CI: 15.2% to 16.9%) and 19.1% (95% CI: 18.3% to 20.0%) among the poorest and richest households, respectively.
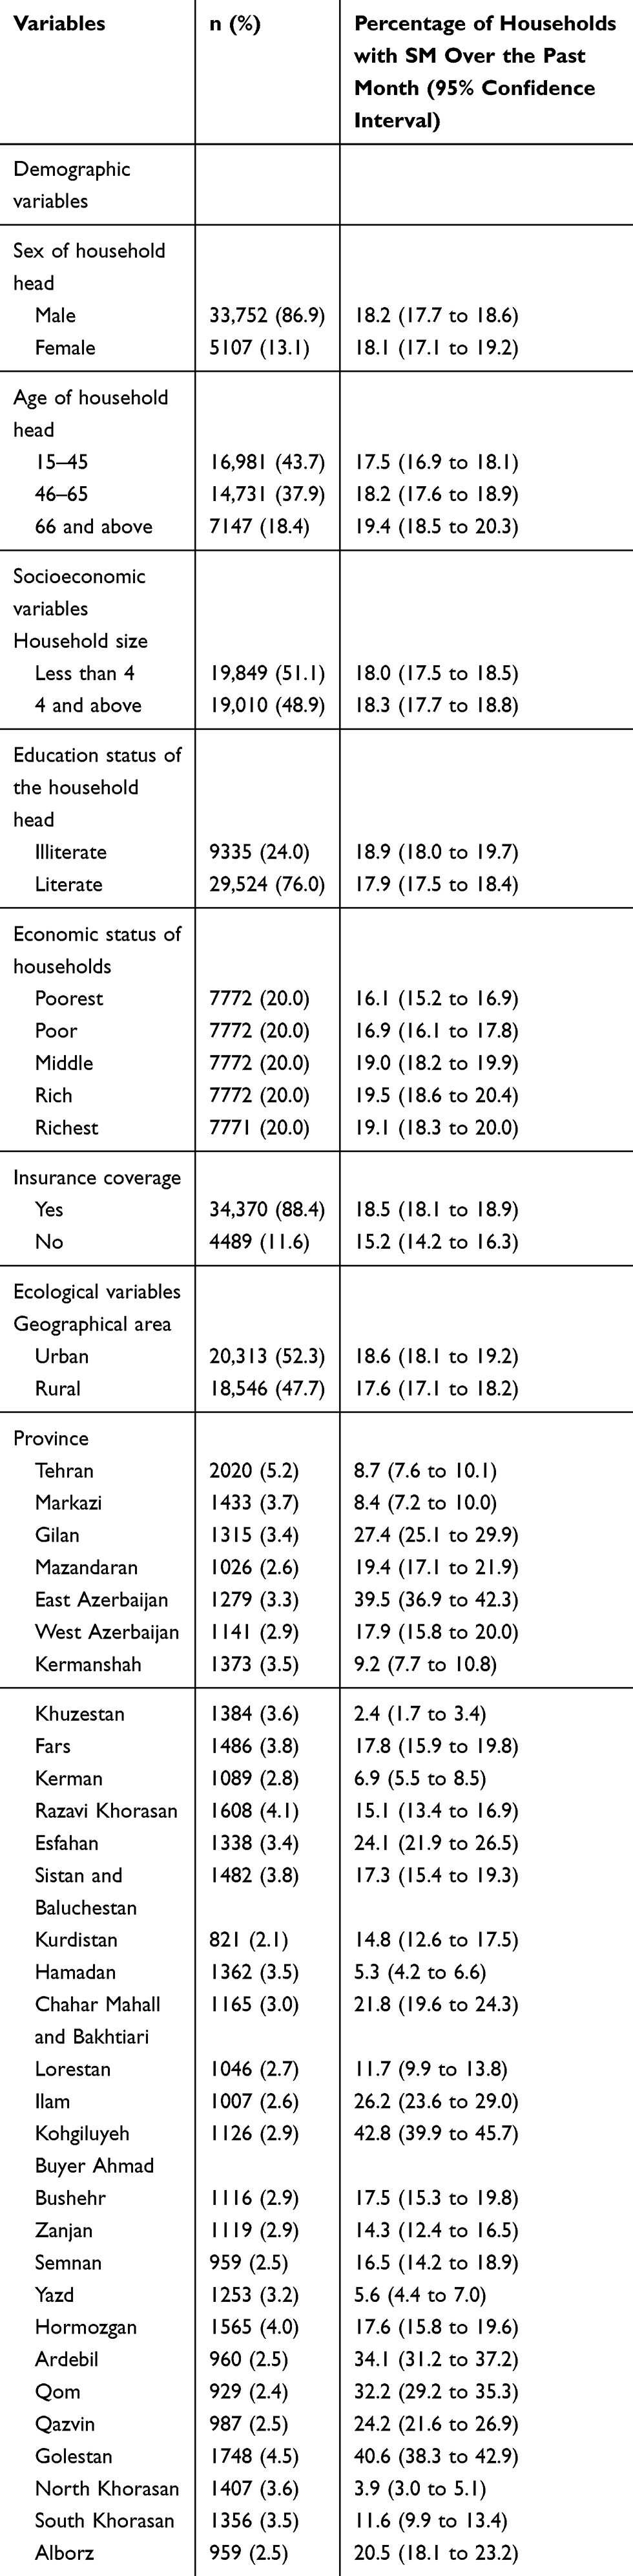 |
Table 1 Descriptive Characteristics of Households Included in the Analysis, 2018 |
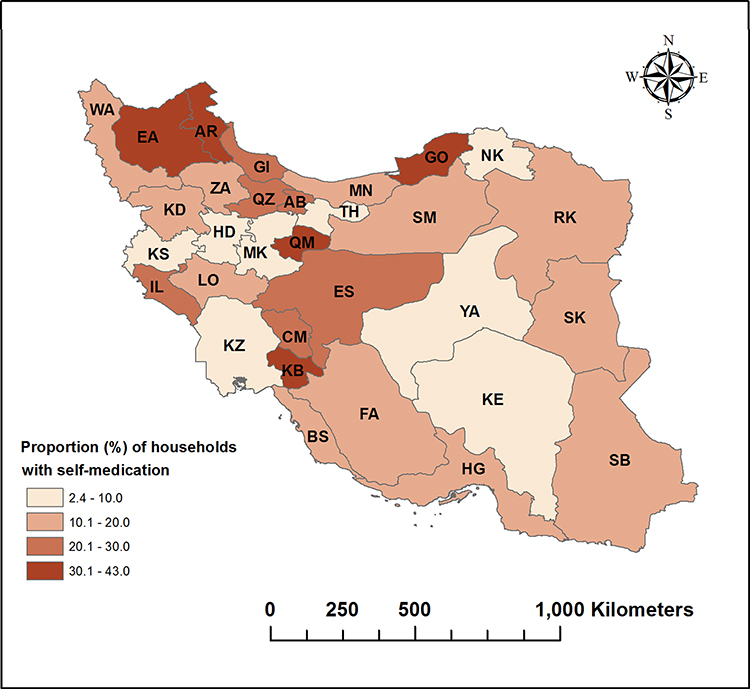 |
Figure 1 Proportion of households with self-medication over the last month across provinces in Iran, 2018. |
Socioeconomic Inequality in Self-Medication
Figure 2 shows the concentration curve for SM among households for the whole of samples, rural and urban areas. As illustrated in Figure 2, the concentration curve lies below the 45-degree line; indicating that the SM more concentrated among the rich. The same result also observed in urban and rural areas.
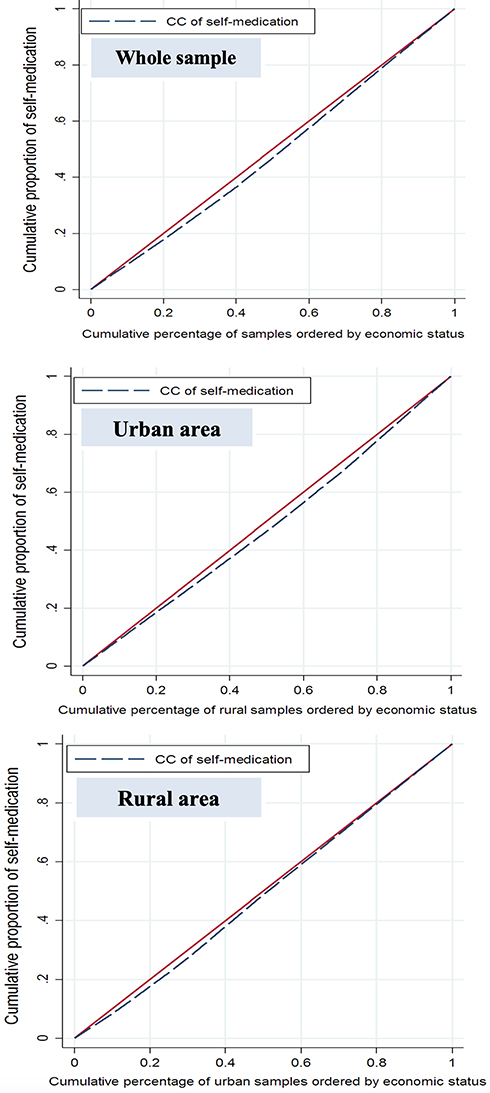 |
Figure 2 The Concentration curve for self-medication in Iran for the whole sample, rural and urban areas, 2018. |
The results of the  for whole of sample, urban and rural areas are reported in Table 2. As indicated in the table, the value of the
 for the whole of sample is positive, indicating that SM is more concentrated among richer households (
 = 0.0466; 95% CI= 0.0321 to 0.0612) in Iran. Similar results also found in urban (
 = 0.0311; 95% CI=0.0112 to 0.0510) and rural (
 = 0.0513; 95% CI=0.0301 to 0.0726) areas.
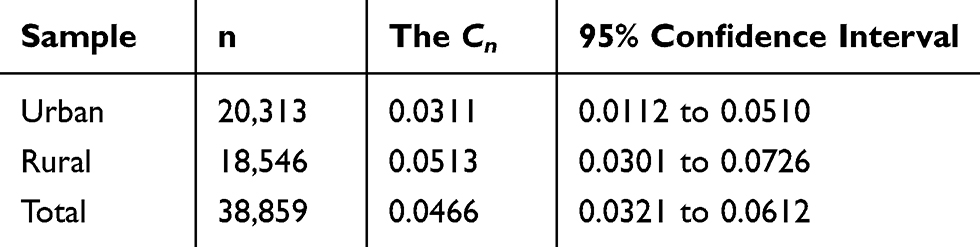 |
Table 2 The Normalized Concentration Indices for Self-Medication for the Whole Sample, and Rural and Urban Areas in Iran, 2018 |
The  also suggested some variation in socioeconomic inequality in SM across provinces in Iran (Figure 3). While SM was found to be concentrated among richer households in the provinces of Tehran, Qom, Esfahan, Ardebil, Golestan, and Sistan and Baluchestan, a higher concentration of SM was found among poorer households in Semnan, North Khorasan, Kerman, Bushehr, and South Khorasan provinces.
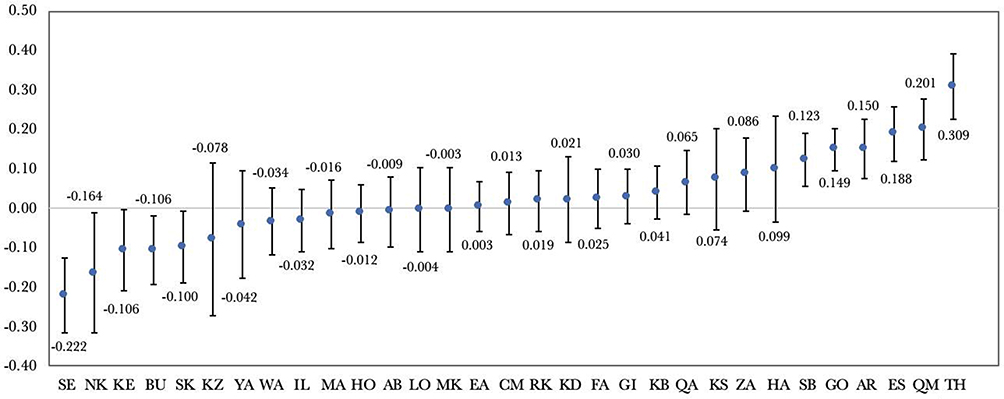 |
Figure 3 The normalized concentration index (Cn) for self-medication across Iranian provinces, 2018. |
Determinants of Socioeconomic Inequality in Self-Medication
Table 3 contains the results of the decomposition analysis of socioeconomic inequality in SM among households in Iran. Based on the results of marginal effects of explanatory variables, the probability of SM was higher in households headed with older adults, larger household size, illiterate-headed households and household with health insurance coverage. The probability of SM was also found to be lower among rural household and in male-headed households as compared to their respective counterparts. The probability of SM among the richest quintile households was 3.4% higher than the poorest households.
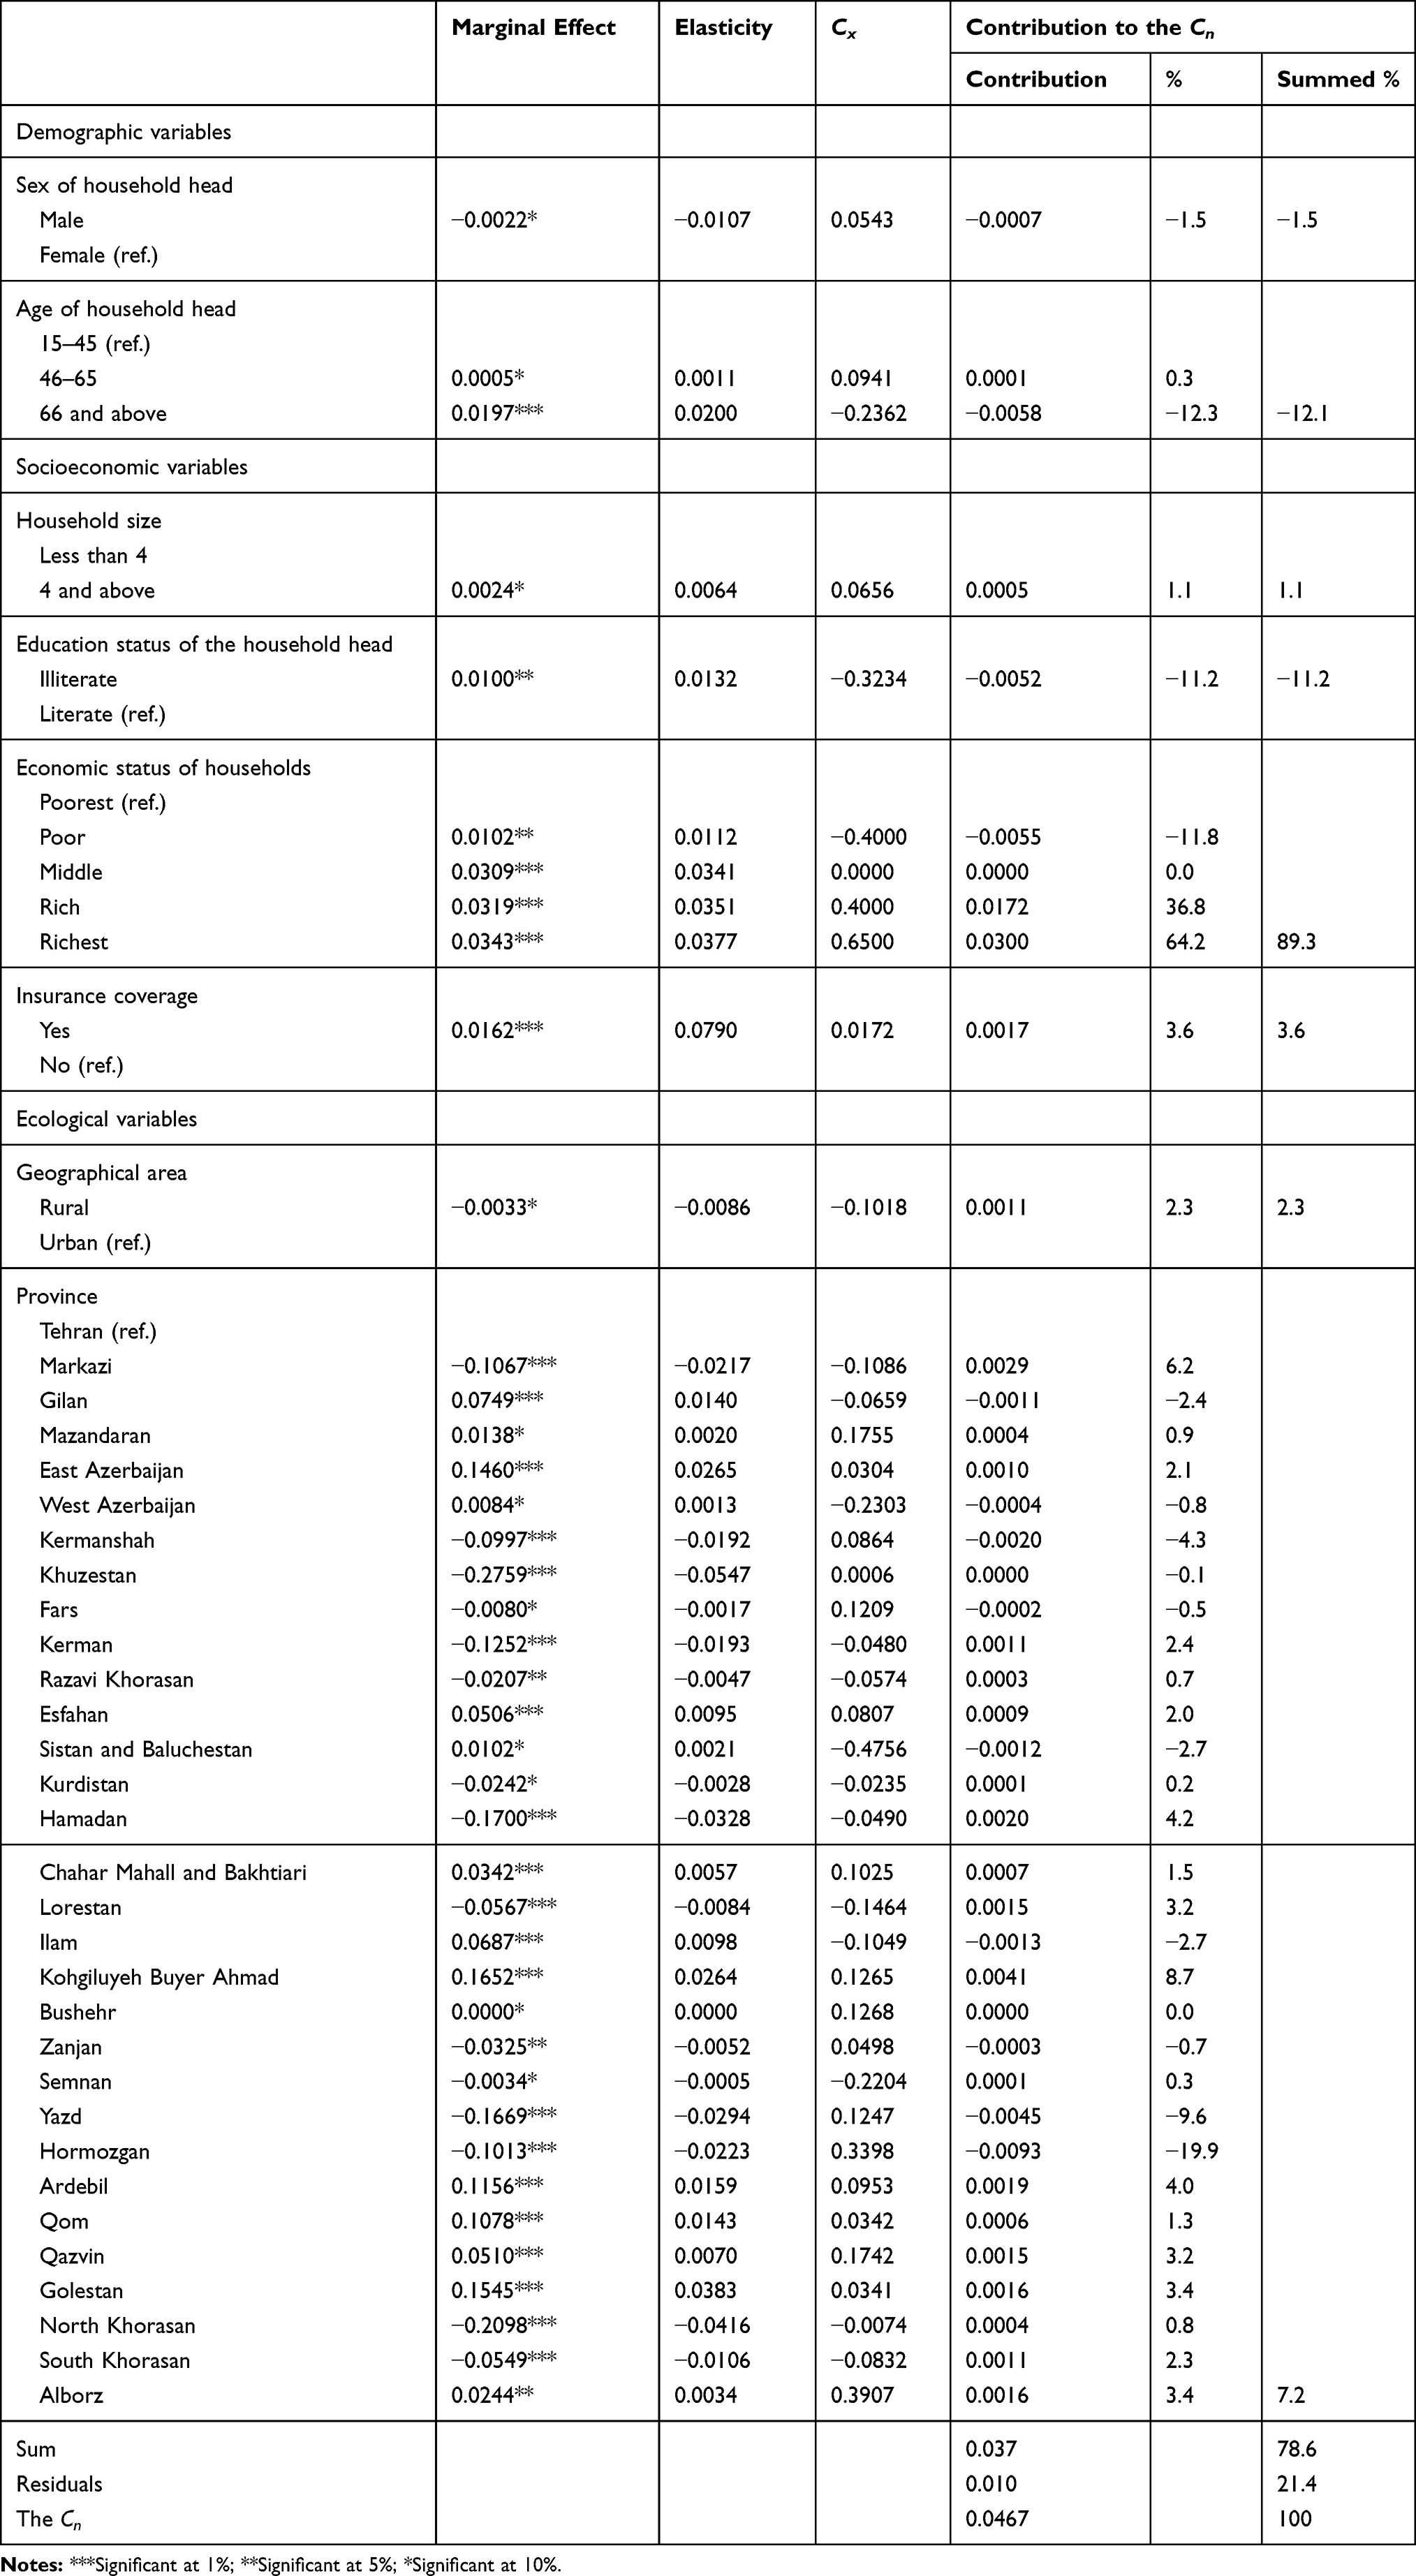 |
Table 3 Decomposition of Socioeconomic Inequality in Self-Medication (SM) Among Iranian Households, 2018 |
The absolute and percentage contribution of determinants to socioeconomic inequality in SM in Iran are reported in the fifth and sixth columns of Table 3. The decomposition analysis showed that SES of households, itself, was the main contributing factor to the concentration of SM among the richer households in Iran. The results also showed that the concentration of households with illiterate and senior heads among low SES households increased the concentration of SM among the poorer households.
As reported in Table 3, 78.6% of socioeconomic inequality in SM was explained by the determinants included in the analysis. The remaining 21.4% of socioeconomic inequality in SM is explained by other variables that are not included in the study.
Discussion
The use of medicines without physician supervision for diagnosis and/or treatment32,33 is a common problem and one of the health concerns worldwide. Despite several efforts to reduce SM, the practice of SM is significantly higher among developing countries.27 Inappropriate use of drugs through SM may cause significant adverse effects such as bacterial resistance, drugs’ interactions, serious side effects, intentional and unintentional poisoning, an increase of malignant and lethal diseases, death and drug dependency.3,33,34 Iran is among the top twenty countries with drug consumption in the world, and the prevalence of the SM in Iran has been increasing.20,27 In this study, for the first time, we measured the extent of socioeconomic inequalities in SM and its main determinants in Iran. The results of the study contributed to a better understanding of SM at national and subnational levels in Iran.
The prevalence of SM among Iranian household in the last month was found to be 18.2%. The magnitude of SM practice was found to be 23.3% in Egypt,35 51% in Slovenia,32 25.4% in the United States,36 27.5% in Kuwait,37 7.3% in Indonesia, and 11.9% in India.38,39 The reasons for the variation in the practice of SM across different countries and regions could be due to the levels of awareness about the rational use of drugs, accessibility of modern health facilities, cultural preferences and beliefs of the study participants. Our results also showed a significant variation in the prevalence of SM across provinces in Iran. While the prevalence of SM in Khuzestan province was 2.4%, 42.8% of households in Kohgiluyeh Buyer Ahmad had SM in the past month. This variation could also be explained by the sociodemographic composition of communities, differences in beliefs and awareness among the Iranian provinces.
The results revealed that SM was more concentrated among richer households in Iran. The observed socioeconomic inequality in SM can potentially be explained by the accessibility of drugs among high SES households as they may afford to purchase over the counter (OTC) medications and prescription drugs without a prescription. Our results also suggested a higher concentration of SM among richer households in both urban and rural regions in Iran. We found a wide variation in socioeconomic inequality in SM among Iranian provinces. The higher prevalence of SM was found among richer households in the provinces of Tehran, Qom, Esfahan, Ardebil, Golestan, and Sistan and Baluchestan. In contrast, compared to richer households, poor households in Semnan, North Khorasan, Kerman, Bushehr and South Khorasan provinces had a higher prevalence of SM. Differential findings across provinces suggest that effective strategies for reducing SM in Iran should be province-specific. Differences in the prevalence of SM across socioeconomic groups can be explained by several reasons including poor access to doctors, differences in beliefs and health literacy as well as ease of drugs’ purchase without having a prescription. A systematic review study indicated that lack of sufficient time to visit a doctor, easy purchase of drugs and high costs of visiting a physician are among the main factors affecting SM behaviors.3 Our decomposition analysis indicated that SES of households, itself, is the main factor contributing to the concentration of SM among richer households. A study by Amaha et al (2019) in Ethiopia reported that high-income individuals were more likely to practice SM compared to their low-income counterparts.40 A study from China also reported that there is a positive association between self-treating and socioeconomic status.13
Our findings showed a higher probability of SM among households headed by older adults. The probability of SM was also found to be higher among households with health insurance coverage, headed by married, illiterate or female adults, living in an urban area, and with larger household size. In contrast to our results, some studies showed a higher prevalence of SM among people with high education.41 For example, a study by Gillani et al42 showed a higher tendency to SM among households with high educational attainment in Pakistan. Similar to the findings of our study, a study conducted by Akram et al25 showed a high prevalence of SM in urban areas in India. The latter study found that 60% of people reported that they indulged in SM practice because medicines were readily available at pharmacies in urban areas. In contrast, a study by Horumpende et al43 highlighted higher accessibility of medicine in rural areas in Tanzania. Similar to our study, a study by Karimy et al (2019) in Iran also reported a higher probability of SM among households living in rural areas and with health insurance coverage.44 Several studies have reported a significant positive relationship between old age and the practice of SM in different countries.32,33,40,45 Klemenc & Kersnik45 reported that older adults use SM because they usually have more chronic diseases.
Some limitations should be considered when interpreting the findings of the current study. First, this study is a cross-sectional in design; thus, we cannot establish any causality between SM and its determinants. Second, data on SM are self-reported and may introduce some systematic error such as accuracy of the responses due to recall bias. Third, although socioeconomic inequalities in SM measured for different types of medications could have provided a better picture about SM in Iran, we could not examine these inequalities in our study due to unavailability of this information in the HIES.
Conclusion
Identifying factors related to SM among different social groups is important for implementing the SM preventative programs. This study revealed that SM is more concentrated among socioeconomically advantaged households in Iran. The findings suggested the SES of households as the main contributing factors to the concentration of SM among richer households in Iran. Since we found positive and negative socioeconomic gradients in SM across Iranian provinces, programs designed to address SM in Iran should be province-specific. In other words, while the prevention program should focus on the increase of awareness about the side effects of SM among the richer households in Tehran, Qom, Esfahan, Ardebil, Golestan, and Sistan and Baluchestan. These programs should mainly focus on the poor households in Semnan, North Khorasan, Kerman, Bushehr, and South Khorasan provinces. The use of mass media and local authorities are also required to improve health literacy about the negative side effect of SM among Iranian households.
Abbreviations
SM, self-medication; SES, socioeconomic status; HIES, Household Income and Expenditure Survey; Cn, relative concentration index; CI, confidence interval; ISC, Iranian Statistical Center.
Data Sharing Statement
The data used in the study were extracted from the Household Income and Expenditure Surveys (HIESs) collected by the Iranian Statistical Center (ISC). The HIES are publicly available at https://www.amar.org.ir/english/Statistics-by-Topic/Household-Expenditure-and-Income#2220530-releases.
Ethics Approval and Consent to Participate
The study was approved by the Ethics Review Committee (ERC) of the Deputy of Research at Kermanshah University of Medical Sciences (KUMS) (IR.KUMS.REC.1398.1163).
Consent for Publication
Not applicable.
Acknowledgments
The authors wish to thank Dr. Yahya Salimi from Kermanshah University of Medical Sciences for his help to conduct this study.
Author Contributions
All authors made a significant contribution to the work reported, whether that is in the conception, study design, execution, acquisition of data, analysis and interpretation, or in all these areas; took part in drafting, revising or critically reviewing the article; gave final approval of the version to be published; have agreed on the journal to which the article has been submitted; and agree to be accountable for all aspects of the work.
Disclosure
The authors declare no competing interests.
References
1. Azami-Aghdash S, Mohseni M, Etemadi M, Royani S, Moosavi A, Nakhaee M. Prevalence and cause of self-medication in Iran: a systematic review and meta-analysis article. Iran J Public Health. 2015;44(12):1580.
2. Helal R, Abou-ElWafa H. Self-medication in university students from the city of Mansoura, Egypt. J Environ Public Health. 2017;2017.
3. Shaghaghi A, Asadi M, Allahverdipour H. Predictors of self-medication behavior: a systematic review. Iran J Public Health. 2014;43(2):136.
4. Organization WH. Guidelines for the Regulatory Assessment of Medicinal Products for Use in Self-Medication. Geneva: World Health Organization; 2000.
5. Saba H, Shivananda K, Jayan M, Hussain CA. Prevalence of self-medication practices and its associated factors in rural Bengaluru, Karnataka, India. Int J Commun Med Public Health. 2017;3(6):1481–1486.
6. Pandya RN, Jhaveri KS, Vyas FI, Patel VJ. Prevalence, pattern and perceptions of self-medication in medical students. Int J Basic Clin Pharmacol. 2013;2(3):275–280. doi:10.5455/2319-2003.ijbcp20130608
7. Skliros E, Merkouris P, Papazafiropoulou A, et al. Self-medication with antibiotics in rural population in Greece: a cross-sectional multicenter study. BMC Fam Pract. 2010;11(1):58. doi:10.1186/1471-2296-11-58
8. Alavi NM, Alami L, Taefi S, Gharabagh GS. Factor analysis of self-treatment in diabetes mellitus: a cross-sectional study. BMC Public Health. 2011;11(1):761. doi:10.1186/1471-2458-11-761
9. Yousef A-M-M, Al-Bakri AG, Bustanji Y, Wazaify M. Self-medication patterns in Amman, Jordan. Pharm World Sci. 2008;30(1):24–30. doi:10.1007/s11096-007-9135-x
10. Abay S, Amelo W. Assessment of self-medication practices among medical, pharmacy, health science students in Gondar University, Ethiopia. J Young Pharm. 2010;2(3):306–310. doi:10.4103/0975-1483.66798
11. Afolabi A. Factors influencing the pattern of self-medication in an adult Nigerian population. Ann Afr Med. 2008;7(3):120–127. doi:10.4103/1596-3519.55666
12. Garofalo L, Di Giuseppe G, Angelillo IF. Self-medication practices among parents in Italy. Biomed Res Int. 2015;2015.
13. Yuefeng L, Keqin R, Xiaowei R. Use of and factors associated with self-treatment in China. BMC Public Health. 2012;1(12):1–9.
14. Figueiras A, Caamano F, Gestal-Otero JJ. Sociodemographic factors related to self-medication in Spain. Eur J Epidemiol. 2000;16(1):19–26. doi:10.1023/A:1007608702063
15. Carrasco‐Garrido P, Jiménez‐García R, Barrera VH, Gil de Miguel A. Predictive factors of self‐medicated drug use among the Spanish adult population. Pharmacoepidemiol Drug Saf. 2008;17(2):193–199.
16. Balbuena FR, Aranda AB, Figueras A. Self-medication in older urban mexicans. Drugs Aging. 2009;26(1):51–60. doi:10.2165/0002512-200926010-00004
17. Zafar SN, Syed R, Waqar S, et al. Self-medication amongst university students of Karachi: prevalence, knowledge and attitudes. J Pak Med Assoc. 2008;58(4):214.
18. Li J, Feng XL. Health care-seeking behaviours and health expenditures in adults aged 45 years and older in China, 2011-2013. Trop Med Int Health. 2017;22(5):638–654. doi:10.1111/tmi.12865
19. Babatunde OA, Fadare JO, Ojo OJ, et al. Self-medication among health workers in a tertiary institution in South-West Nigeria. Pan Afr Med J. 2016;24.
20. Rafiee A, Moradi Gomyek H, Haghighizade MH. Self-treatment during pregnancy and its related factors. J Holistic Nurs Midwifery. 2018;28(2):129–135. doi:10.29252/hnmj.28.2.129
21. Abdi A, Faraji A, Dehghan F, Khatony A. Prevalence of self-medication practice among health sciences students in Kermanshah, Iran. BMC Pharmacol Toxicol. 2018;19(1):36. doi:10.1186/s40360-018-0231-4
22. Shaamekhi HR, Jafarabadi MA, Alizadeh M. Demographic determinants of self-medication in the population covered by health centers in Tabriz. Health Promotion Perspect. 2019;9(3):181. doi:10.15171/hpp.2019.26
23. https://www.amar.org.ir/english/Population-and-Housing-Censuses/Census-2016-Detailed-Results.
24. https://www.amar.org.ir/english/Statistics-by-Topic/Household-Expenditure-and-Income.
25. Akram A, Maqsood U, Latif MZ, Arshad HS, Riaz H, Qureshi MA. Self-medication phenomenon; a population based study from Lahore. Cough. 2019;402:
26. El Nimr N, Wahdan I, Wahdan A, Kotb R. Self-medication with drugs and complementary and alternative medicines in Alexandria, Egypt: prevalence, patterns and determinants. EMHJ Eastern Mediterranean Health J. 2015;21(4):256–265. doi:10.26719/2015.21.4.256
27. Jalilian F, Mehdi Hazavehei S, Vahidinia AA, Jalilian M, Moghimbeig A. Prevalence and related factors for choosing self-medication among pharmacies visitors based on health belief model in Hamadan Province, west of Iran. J Res Health Sci. 2013;13(1):81–85.
28. Wagstaff A, Paci P, Van Doorslaer E. On the measurement of inequalities in health. Soc Sci Med. 1991;33(5):545–557. doi:10.1016/0277-9536(91)90212-U
29. Koolman X, Van Doorslaer E. On the interpretation of a concentration index of inequality. Health Econ. 2004;13(7):649–656. doi:10.1002/hec.884
30. O’Donnell O, O’Neill S, Van Ourti T, Walsh B. Conindex: estimation of concentration indices. Stata J. 2016;16(1):112–138. doi:10.1177/1536867X1601600112
31. Wagstaff A. The concentration index of a binary outcome revisited. Health Econ. 2011;20(10):1155–1160. doi:10.1002/hec.1752
32. Klemenc-Ketis Z, Mitrovic D. Patients’ use of and attitudes towards self-medication in rural and remote Slovenian family medicine practices: a cross-sectional multicentre study. Rural Remote Health. 2017;17:2. doi:10.22605/RRH3893
33. Bogale AA, Amhare AF, Chang J, et al. Knowledge, attitude, and practice of self-medication with antibiotics among community residents in Addis Ababa, Ethiopia. Expert Rev Anti Infect Ther. 2019;1–8.
34. Zhu X, Pan H, Yang Z, Cui B, Zhang D, Ba-Thein W. Self-medication practices with antibiotics among Chinese university students. Public Health. 2016;130:78–83. doi:10.1016/j.puhe.2015.04.005
35. Sabry NA, Farid SF, Dawoud DM. Antibiotic dispensing in Egyptian community pharmacies: an observational study. Res Soc Admin Pharm. 2014;10(1):168–184. doi:10.1016/j.sapharm.2013.03.004
36. Zoorob R, Grigoryan L, Nash S, Trautner BW. Nonprescription antimicrobial use in a primary care population in the United States. Antimicrob Agents Chemother. 2016;60(9):5527–5532. doi:10.1128/AAC.00528-16
37. Awad AI, Aboud EA. Knowledge, attitude and practice towards antibiotic use among the public in Kuwait. PLoS One. 2015;10(2):e0117910. doi:10.1371/journal.pone.0117910
38. Widayati A, Suryawati S, de Crespigny C, Hiller JE. Self medication with antibiotics in Yogyakarta City Indonesia: a cross sectional population-based survey. BMC Res Notes. 2011;4(1):491. doi:10.1186/1756-0500-4-491
39. Selvaraj K, Kumar SG, Ramalingam A. Prevalence of self-medication practices and its associated factors in Urban Puducherry, India. Perspect Clin Res. 2014;5(1):32. doi:10.4103/2229-3485.124569
40. Amaha MH, Alemu BM, Atomsa GE. Self-medication practice and associated factors among adult community members of Jigjiga town, Eastern Ethiopia. PLoS One. 2019;14:6. doi:10.1371/journal.pone.0218772
41. Kuriachan KE, George GS, Cherian J, Cheriyan SM, Paul L. A cross-sectional study on the prevalence of self-medication practices and its associated factors among housewives in rural areas of Ernakulam district. J Evol Med Dental Sci. 2016;5(46):3009–3013.
42. Gillani A, Ji W, Hussain W, et al. Antibiotic self-medication among non-medical university students in Punjab, Pakistan: a cross-sectional survey. Int J Environ Res Public Health. 2017;14(10):1152. doi:10.3390/ijerph14101152
43. Horumpende PG, Said SH, Mazuguni FS, et al. Prevalence, determinants and knowledge of antibacterial self-medication: a cross sectional study in North-eastern Tanzania. PLoS One. 2018;13(10):e0206623. doi:10.1371/journal.pone.0206623
44. Karimy M, Rezaee-Momtaz M, Tavousi M, Montazeri A, Araban M. Risk factors associated with self-medication among women in Iran. BMC Public Health. 2019;19(1):1033. doi:10.1186/s12889-019-7302-3
45. Klemenc-Ketiš Z, Kersnik J. The effect of demographic characteristics on self-medication patterns: a cross-sectional nationwide study from Slovenia. Coll Antropol. 2011;35(4):1237–1242.
 © 2020 The Author(s). This work is published and licensed by Dove Medical Press Limited. The full terms of this license are available at https://www.dovepress.com/terms.php and incorporate the Creative Commons Attribution - Non Commercial (unported, v3.0) License.
By accessing the work you hereby accept the Terms. Non-commercial uses of the work are permitted without any further permission from Dove Medical Press Limited, provided the work is properly attributed. For permission for commercial use of this work, please see paragraphs 4.2 and 5 of our Terms.
© 2020 The Author(s). This work is published and licensed by Dove Medical Press Limited. The full terms of this license are available at https://www.dovepress.com/terms.php and incorporate the Creative Commons Attribution - Non Commercial (unported, v3.0) License.
By accessing the work you hereby accept the Terms. Non-commercial uses of the work are permitted without any further permission from Dove Medical Press Limited, provided the work is properly attributed. For permission for commercial use of this work, please see paragraphs 4.2 and 5 of our Terms.