")
Back to Journals » Risk Management and Healthcare Policy » Volume 13
Socioeconomic Inequality in Health Outcomes Among the Elderly: Evidence from a Cross-Sectional Study in China
Received 1 February 2020
Accepted for publication 24 April 2020
Published 14 May 2020 Volume 2020:13 Pages 397—407
DOI https://doi.org/10.2147/RMHP.S248019
Checked for plagiarism Yes
Review by Single anonymous peer review
Peer reviewer comments 2
Editor who approved publication: Dr Kent Rondeau
Jian Sun,1 Shoujun Lyu,1,2 Rui Zhao3
1School of International and Public Affairs, Shanghai Jiao Tong University, Shanghai 200030, People’s Republic of China; 2China Institute for Urban Governance, Shanghai Jiao Tong University, Shanghai 200030, People’s Republic of China; 3Affiliated Hospital of Hebei University, Hebei 071000, People’s Republic of China
Correspondence: Shoujun Lyu
School of International and Public Affairs, China Institute for Urban Governance, Shanghai Jiao Tong University 1954 Huashan Road, Xuhui District, Shanghai 200030, People’s Republic of China
Tel +86-159-2108-3352
Email [email protected]
Background and Aim: Health is viewed as a form of human capital and a necessary basis for people to realize capabilities. Moreover, socioeconomic inequality in health outcome widens income inequality and exacerbates social inequality. The aim of this study is to measure socioeconomic inequality in health outcomes among the elderly in China.
Methods: The data used in this study were sourced from China Health and Retirement Longitudinal Study in 2015, including 5643 participants aged 60 and above. Concentration curve and concentration index were applied to measure the extent of socioeconomic inequality in health outcomes among older adults. Furthermore, the decomposition method of concentration index proposed by Wagstaff was employed to quantify each determinant’s contribution to the measured socioeconomic inequality in health outcomes.
Results: The concentration index of Activity of Daily Living Scale and Center of Epidemiological Survey-Depression Scale score were − 0.0064 and − 0.0158, respectively, indicating pro-rich inequality in physical and mental health among the elderly. The decomposition analysis revealed that household income (41.15%), aged 70– 79 (17.37%), being male (8.38%), and living in urban area (5.78%) were key factors to explain the pro-rich inequality in physical health. Furthermore, the results also suggested that household income (68.41%), being male (17.55%), having junior high school education (10.67%), and living in urban area (6.49%) were key factors to explain the pro-rich inequality in mental health.
Conclusion: This study revealed that there are pro-rich inequalities in physical and mental health among the elderly in China, and the degree of pro-rich inequality in mental health is higher than that in physical health. Moreover, the results also suggested that household income is the biggest contributor to socioeconomic inequality in physical and mental health. Furthermore, this study found that educational attainment makes a substantial contribution to socioeconomic inequality in health outcomes, while the contribution of health insurance to health inequality is limited.
Keywords: socioeconomic inequality, health outcomes, elderly, decomposition of concentration index, China
Introduction
With the rapid development of the economy, income inequality in China is constantly growing and has reached very high levels.1 Some studies have revealed that income inequality could have a negative effect on health outcomes,2–5 which will in turn further widen income inequality and create a vicious cycle.3 China, as one of the largest developing countries in the world, has witnessed increased health inequality.6 Health is viewed as a form of human capital and a necessary basis for people to realize capabilities.7,8 Moreover, socioeconomic inequality in health outcomes widens income inequality and exacerbates social inequality. Furthermore, socioeconomic inequality in health outcomes also causes many social problems, such as unemployment and poverty problems,9 which are not conducive to social stability.
In January 2009, Opinions on Deepening Health System Reform was issued by the Chinese government, beginning a new round of health care system reform. The core concept of this round of reform is to provide basic medical and health care system to all of the Chinese population as a public good. An important goal of this round of reform is to reduce health disparities among residents.10 The central government has increased health investment in underdeveloped areas. Furthermore, the central government has invested more than RMB 70 billion (US$ 9.93 billion) to support the development of county-level hospitals and community-level health institutions.11 As an important national strategic plan in the health sector, the Healthy China 2030 Plan was released in October 2016, with an emphasis on providing fair, accessible, systematic, and continuous health services to all of the Chinese population in order to improve the national health.
With the constant decline of birth rate and the steady increase in life expectancy, the aging population has become an important problem in China. Furthermore, improving the health outcome of the elderly has become a focus of health policymakers. China, which has the largest number of older people, has entered a period of population ageing since 2000. By the end of 2017, the number of older people aged 60 and above reached 240.90 million, accounting for 17.3% of the total population.12 Furthermore, it is estimated that the number of older people aged 60 and above will exceed 400 million and account for more than 30% of the total population by 2050.13 As physical function declines with age, older adults are more likely to suffer from health problems than their younger counterparts.14–16 Most older adults have some kinds of chronic diseases, such as hypertension, heart disease, stroke, diabetes, osteoporosis, hearing loss, visual loss, and Alzheimer's. Furthermore, older adults are usually lonely and some of them suffer from severe depression due to the fact that their sons and daughters have left home for study or work. In general, a person’s health care expenditure at the age of 65 and above accounts for approximately 70% of his or her lifetime health care expenditure.17 Indeed, those health problems pose a daunting challenge to the health care system in China. In 1990, Healthy Aging was put forward by the World Health Organization, and its core notion is to improve the health outcomes of the elderly.
The past few years have witnessed a growing number of researches undertaken to explore socioeconomic inequality in health outcomes. Van Doorslaer et al used the data of nine industrialized countries to construct concentration curves of self-assessed health, and his study revealed that inequalities in health favoured the higher income groups.18 Xu et al decomposed the socioeconomic inequalities in depressive symptoms among the elderly in China and discovered that there was a pro-rich inequality in depressive symptoms.19 A study conducted by Xie revealed that there is a strong pro-rich inequality in health outcomes, and the higher-income people tend to have better health outcomes.20 In addition, the research of Gu et al suggested that there is a pro-rich inequality in health outcomes in Jiangsu Province of China, while health service utilization is more concentrated among poor people.21 Moreover, the study of Su et al demonstrated that the pro-rich health inequity was much higher for the rural health insurance scheme than that for the urban ones by using decomposition analysis.22 Furthermore, Peng and Wang used the data obtained from China Health and Nutrition Survey (CHNS) and found that there was a pro-rich inequality in health outcomes among children in China.23 Overall, previous studies on socioeconomic inequality in health outcomes in China are quite limited. On the one hand, previous studies mainly used self-assessed health as health outcome variable, whilst they ignored the decomposition of socioeconomic inequality in physical health. On the other hand, few empirical studies used the determinants of health model to select independent variables in order to investigate the socioeconomic inequality in health outcomes.
This study aimed to fill the gaps by measuring socioeconomic inequality in health outcomes among the elderly in China. The results of this study could shed light on future socioeconomic inequality in health outcome studies in China. This study highlighted some important strengths. To the best of our knowledge, this is the first empirical study to decompose the concentration index of Activity of Daily Living Scale (ADL) score using a nationwide database. Furthermore, this study employed the determinants of health model to guide the selection of independent variables to ensure a reasonable selection of variables.
Methods
Data Source
The data used in this study were sourced from China Health and Retirement Longitudinal Study (CHARLS), which was conducted by National School of Development at Peking University in 2015. CHARLS data is freely available at http://charls.pku.edu.cn/. The CHARLS is a nationally representative survey on adults aged 45 and above in China. Its aim is to collect a set of high-quality microdata to analyze the current status of the aging population and promote interdisciplinary research on the aging problem in China. This study was conducted every 2 years. Its national baseline survey was performed in 2011, approximately 17,000 respondents were sampled from 450 communities or villages in 150 counties or districts. The third wave of the survey was performed between July and August in 2015, which is the latest data of CHARLS at the time of this study. By using multistage probability-proportional-to-size (PPS) sampling method, 21,095 respondents aged 45 and above were sampled from 450 communities or villages in 28 provinces in China. The data questionnaire contains information about older adults’ demographics, health outcomes, health insurance, lifestyle, location and income, etc., which is quite suitable for this study. Considering the fact that this study focused on the socioeconomic inequality in health outcomes among the elderly, we removed respondents under 60. After data cleaning, a total of 5643 participants aged 60 and above were included in this study.
Variables
Outcome Variables
The World Health Organization defines health as a state of complete physical, mental, and social well-being, not merely the absence of disease or infirmity.24 According to this definition, physical and mental health were adopted to measure the health outcome of older adults.
The physical health of respondents was assessed using the Activity of Daily Living Scale (ADL), which is a generic instrument developed by Lawton and Brody in 1969.25 The scale includes the older adults’ status of using the toilet, eating, dressing, controlling urination and defecation, getting into or out of bed, bathing or showering. These questions have four response levels, ranging from I do not have any difficulty, I have difficulty but can still do it, I have difficulty and need help, to I can not do it. These questions were scored from 1 for I do not have any difficulty to 4 for I can not do it. The 8 questions were summed to get an ADL score for each older adult, which ranges from 6 to 24, with a higher ADL score indicating a weaker ability of daily living.
In addition, considering the fact that the Center of Epidemiological Survey-Depression Scale (CES-D) is a useful instrument to screen for depressive symptoms,26 this study employed a Chinese-version CES-D 10-question form to measure the mental health of older adults. A study has demonstrated that this scale has a good internal consistency reliability among middle-aged and older adults in China.27 This scale has ten questions, including eight negatively oriented and two positively oriented questions, such as “I had trouble keeping my mind on what I was doing” and “I was happy”. These questions have four response levels, which range from rarely or none of the time (<1 day), some or a little of the time (1–2 days), occasionally or a moderate amount of the time (3–4 days), to most or all of the time (5–7 days). Furthermore, the negatively oriented questions were scored from 1 for rarely or none of the time (<1 day) to 4 for most or all of the time (5–7 days), while the positively oriented questions were scored from 1 for most or all of the time (5–7 days) to 4 for rarely or none of the time (<1 day). These 10 questions were summed to get a CES-D score for each older adult, ranging from 10 to 40, with a higher CES-D score indicating severer depressive symptoms.
Independent Variables
The determinants of health model, which is put forward by the World Health Organization, revealed the factors that influence the health outcome and impact mechanism. This model has been widely adopted to determine factors that influence the health outcome of residents.28–30 According to this model, we selected the independent variables, and description of independent variables is listed in (Table 1). Independent variables used in this study were classified into five categories. The first type of independent variable describes the biology and genetics of older adults, including two variables: age and gender. The second type of independent variable describes the health behaviors of older adults, including three variables: smoking, drinking, and social interaction, indicating whether the older adult had these behaviors or not. The third type of independent variable describes the socioeconomic characteristics of older adults, including three variables: marital status, educational attainment, and household income. The fourth type of independent variable describes the communities and regions, including two variables: geographic location and residency location. The fifth type of independent variable focuses on health policy, including a variable: health insurance, which indicates whether or not the older adult was insured by health insurance.
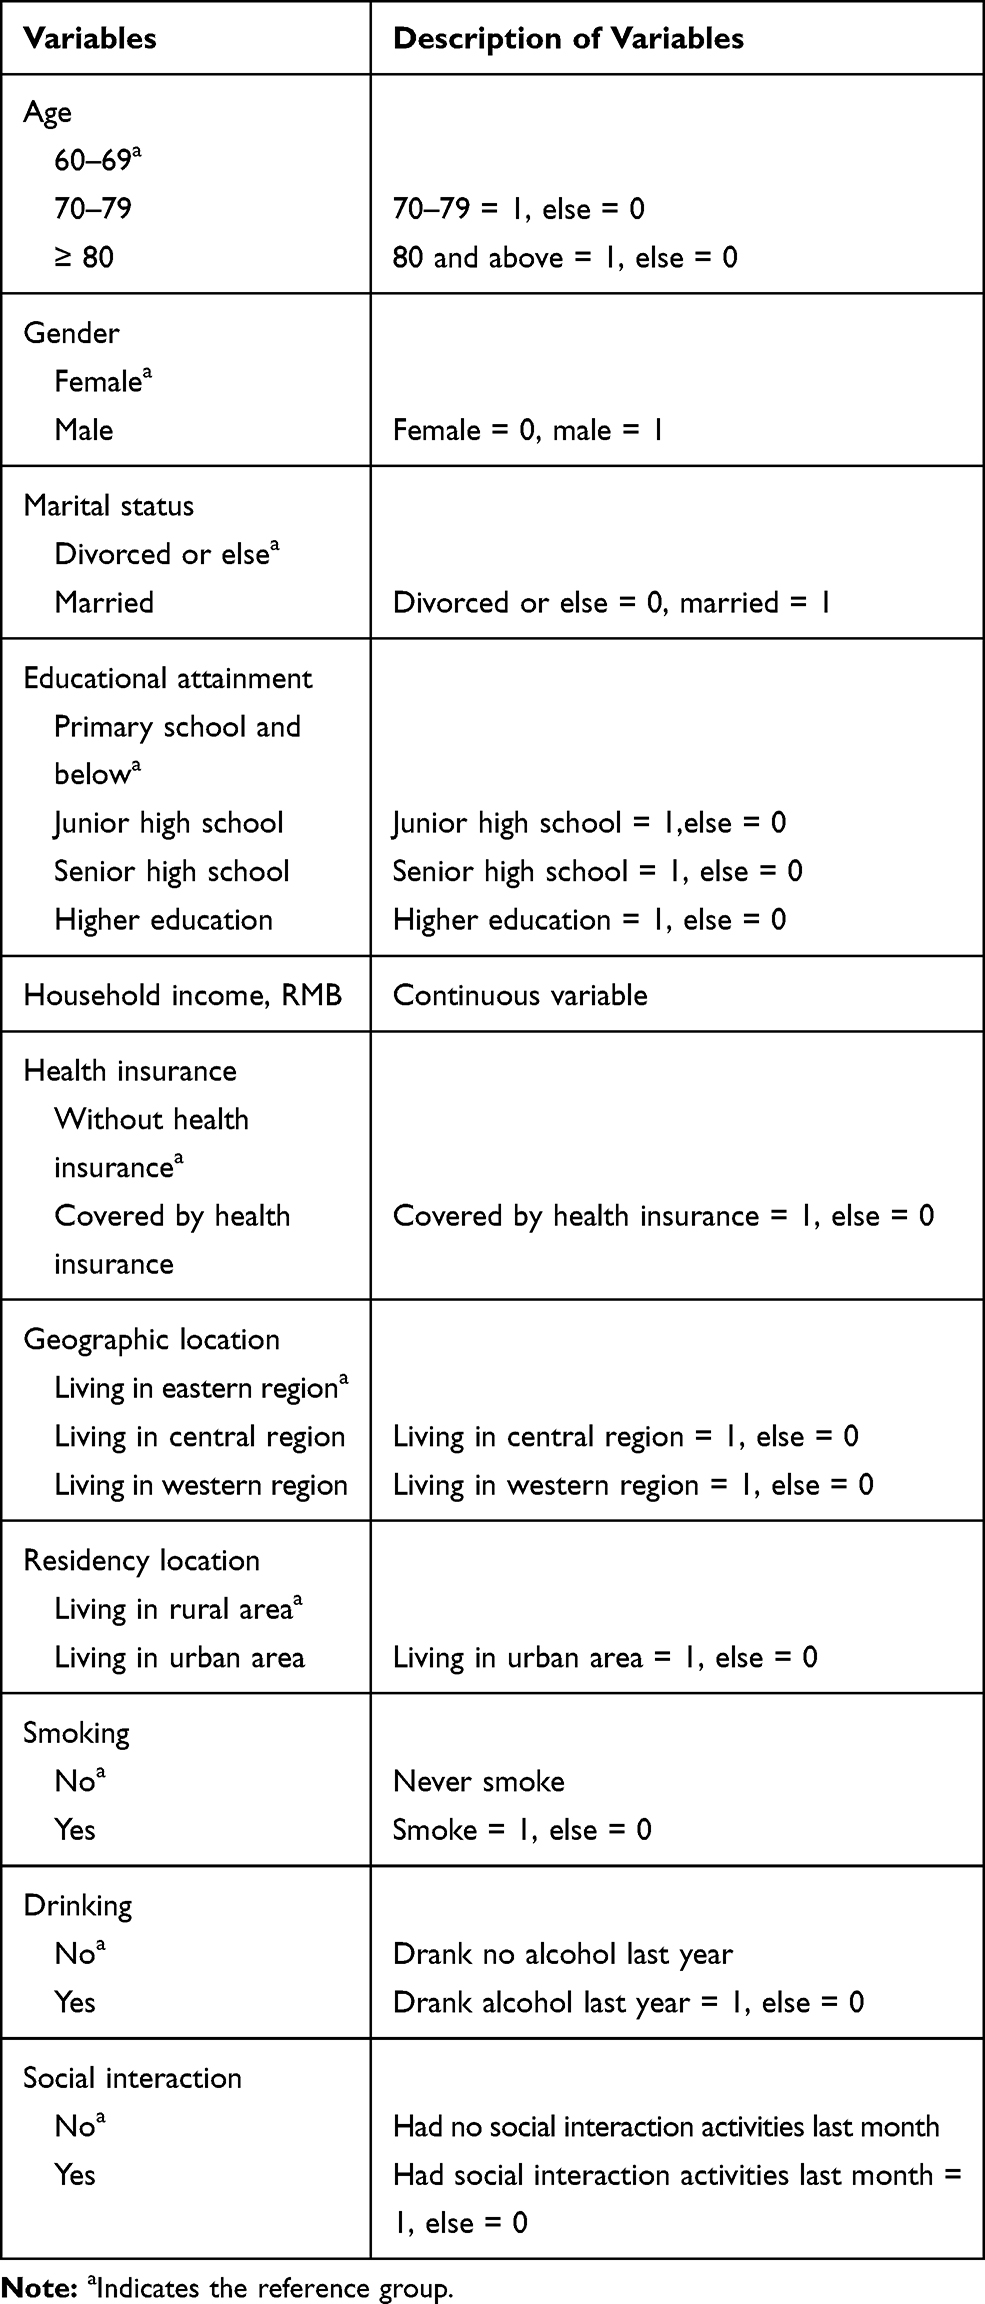 |
Table 1 Description of Independent Variables |
Statistical Analysis
In this study, concentration curve and concentration index were applied to measure the extent of socioeconomic inequality in health outcomes among older adults. The concentration curve provides a visual impression of socioeconomic inequality in the distribution of health outcomes and depicts how shares of the health outcome variable (y-axis) are accounted for by the cumulative percentage of adults ranked by household income from the poorest to the richest (x-axis).19 In addition, the concentration index is a standard tool to assess the degree of socioeconomic inequality in the field of health care, which is defined as twice the area between the concentration curve and the line of equality (the diagonal).31,32 Moreover, the concentration index ranges between −1 and +1.33–36 When the concentration curve lies above the line of equality, the concentration index ranges from −1 to 0, which indicates that this outcome variable is more concentrated among the lower income group and vice versa.37 Furthermore, when the concentration curve farther lies above the line of equality, the absolute value of concentration index is larger, which suggests a greater degree of socioeconomic inequality in health outcomes.38 If there is no socioeconomic inequality, the concentration index will take the value of zero and the concentration curve will coincide with the line of equality.39,40 In addition, the formula used for calculating the concentration index is:
(1)
where C denotes the concentration index of health outcome, μ indicates the mean of health outcome, y is the health outcome indicator, and r is the fractional rank of household income.
The decomposition method of concentration index proposed by Wagstaff was employed to quantify each determinant’s contribution to the measured socioeconomic inequality in health outcomes. A study suggested that the decomposition method based on OLS regression model is commonly used when the health outcome is a continuous variable.41 Given the fact that health outcomes used in this study are continuous variables, we employed the decomposition method based on OLS regression model to conduct the decomposition of concentration index.
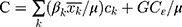
The linear relationship between health outcome and independent variables could be specified as:
(2)
where y denotes the health outcome indicator, α represents the intercept term, βk are the coefficients, xki stands for the factors that influence the health outcome of the elderly, and εi is the error term.
The decomposition of concentration index could be written as:
(3)
where C is the concentration index of health outcome,  are the coefficients,
  represents the mean of
 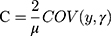 ,
,  stands for the mean of health outcome,
  is the concentration index for
  , and
, and  denotes the generalized concentration index for ε.
All statistical analyses used in this study were performed with the Stata 15.1 software (Stata Corp LP, College Station, TX, USA).
Ethical Considerations
The study received ethical approval from the Ethics Committee of Shanghai Jiao Tong University.
Results
Characteristics of the Study Population
(Table 2) displays the characteristics of the study population. In this study, more than 60% of the respondents aged between 60 and 69. In addition, 58.11% of the elderly were male, and most of them were married. Moreover, only 2.62% of them had higher education, and the mean f household income was RMB 14,201.93 (US$ 2015.63). Furthermore, approximately 80% of the elderly were covered by health insurance. 42.05% of the older adults lived in the eastern region, and more than 70% of them lived in rural area. The proportion of smoking, drinking last year, and engaging in social interaction last month was 35.18%, 34.47%, and 49.48%, respectively.
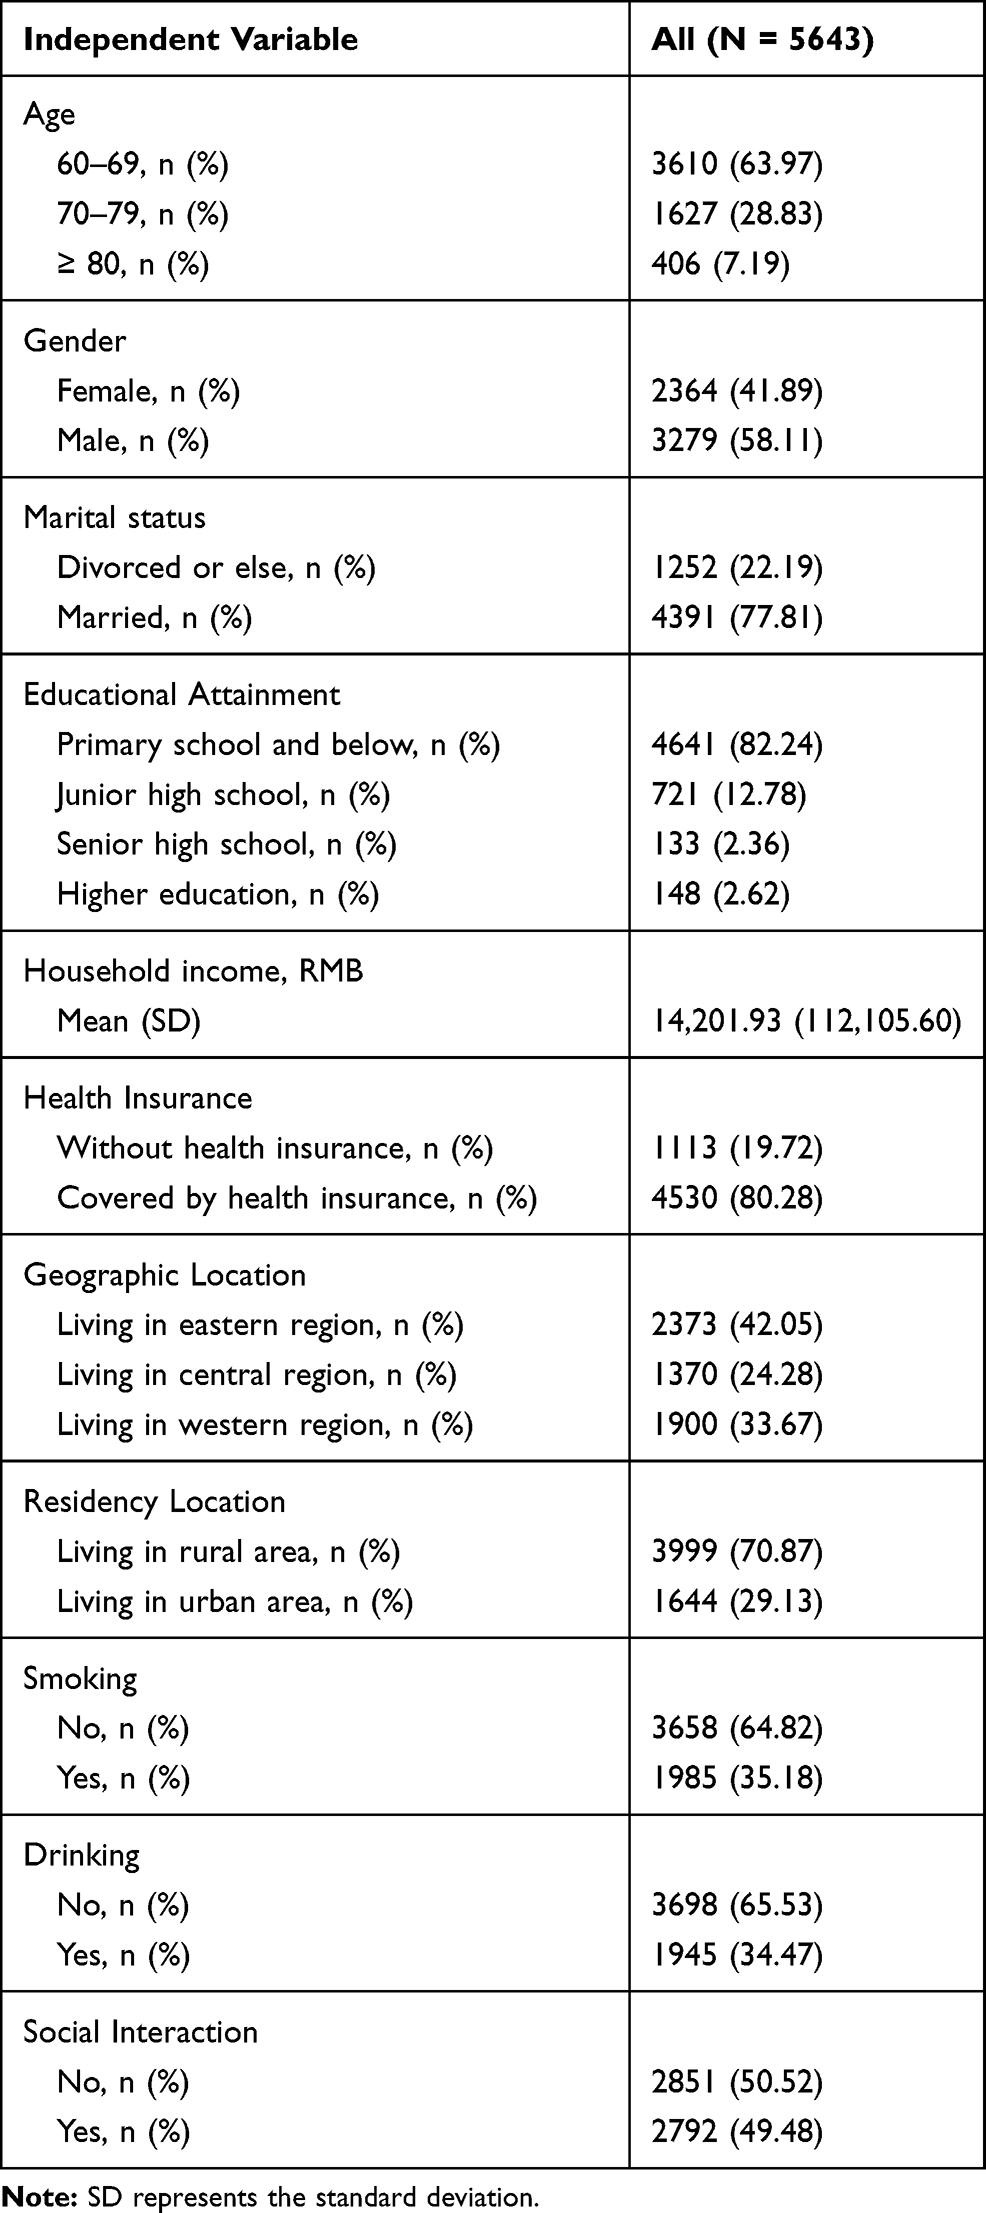 |
Table 2 Characteristics of the Study Population |
Socioeconomic Inequality in Health Outcomes
The concentration index of ADL score was −0.0064. Given the fact that the health outcome variable employed in this study is an indicator of ill health, the negative concentration index value suggests that low-income people are more likely to have higher ADL scores than high-income people. That is to say, poor people tend to have worse physical health outcomes than rich people. Furthermore, Figure 1 presents the concentration curve of ADL score. The concentration curve mainly lay above the line of equality, which is consistent with the result of concentration index.
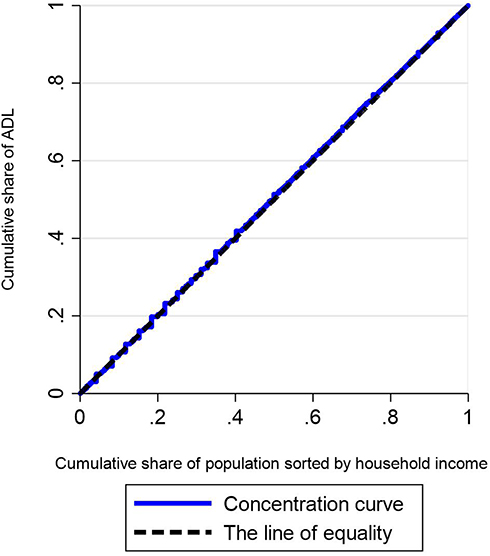 |
Figure 1 Concentration curve of ADL score. |
In addition, the concentration index of CES-D score among the elderly was −0.0158. Similar to the concentration index of ADL score, the negative concentration index value of CES-D score indicates that poor people in China are more likely to suffer from depressive symptoms than rich people. In other words, poor people tend to have worse mental health outcomes than rich people. (Figure 2) reports the concentration curve of CES-D score. The concentration curve lay above the line of equality, which indicates that depressive symptoms were more concentrated among poor people than rich people, and this result is consistent with the value of concentration index.
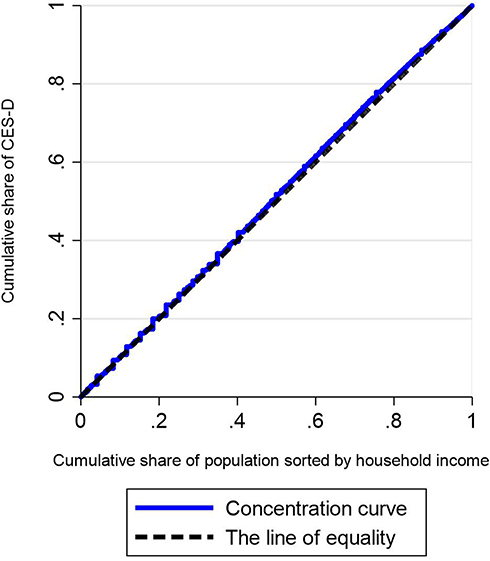 |
Figure 2 Concentration curve of CES-D score. |
Decomposition of Inequality in Physical Health
(Table 3) reports the result of decomposition analysis of concentration index in ADL score. As can be seen, the concentration index values of living in urban area, smoking, and drinking were positive, which indicates that these variables are more concentrated among rich people. Considering the fact that health outcome variable used in this study is an indicator of ill health, the negative contribution to concentration index suggests that this independent variable increases the degree of pro-rich inequality in health outcomes. Decomposition analysis results revealed that household income (41.15%), aged 70–79 (17.37%), being male (8.38%), and living in urban area (5.78%) were key factors to explain the pro-rich inequality in physical health. In addition, having a junior high school education aggravated the pro-rich inequality, and the decomposed value for ADL score was 4.41%. On the contrary, the contribution rate of health insurance to concentration index was only 0.46%, which indicates that being covered by health insurance made a relatively smaller contribution to the pro-rich inequality in physical health.
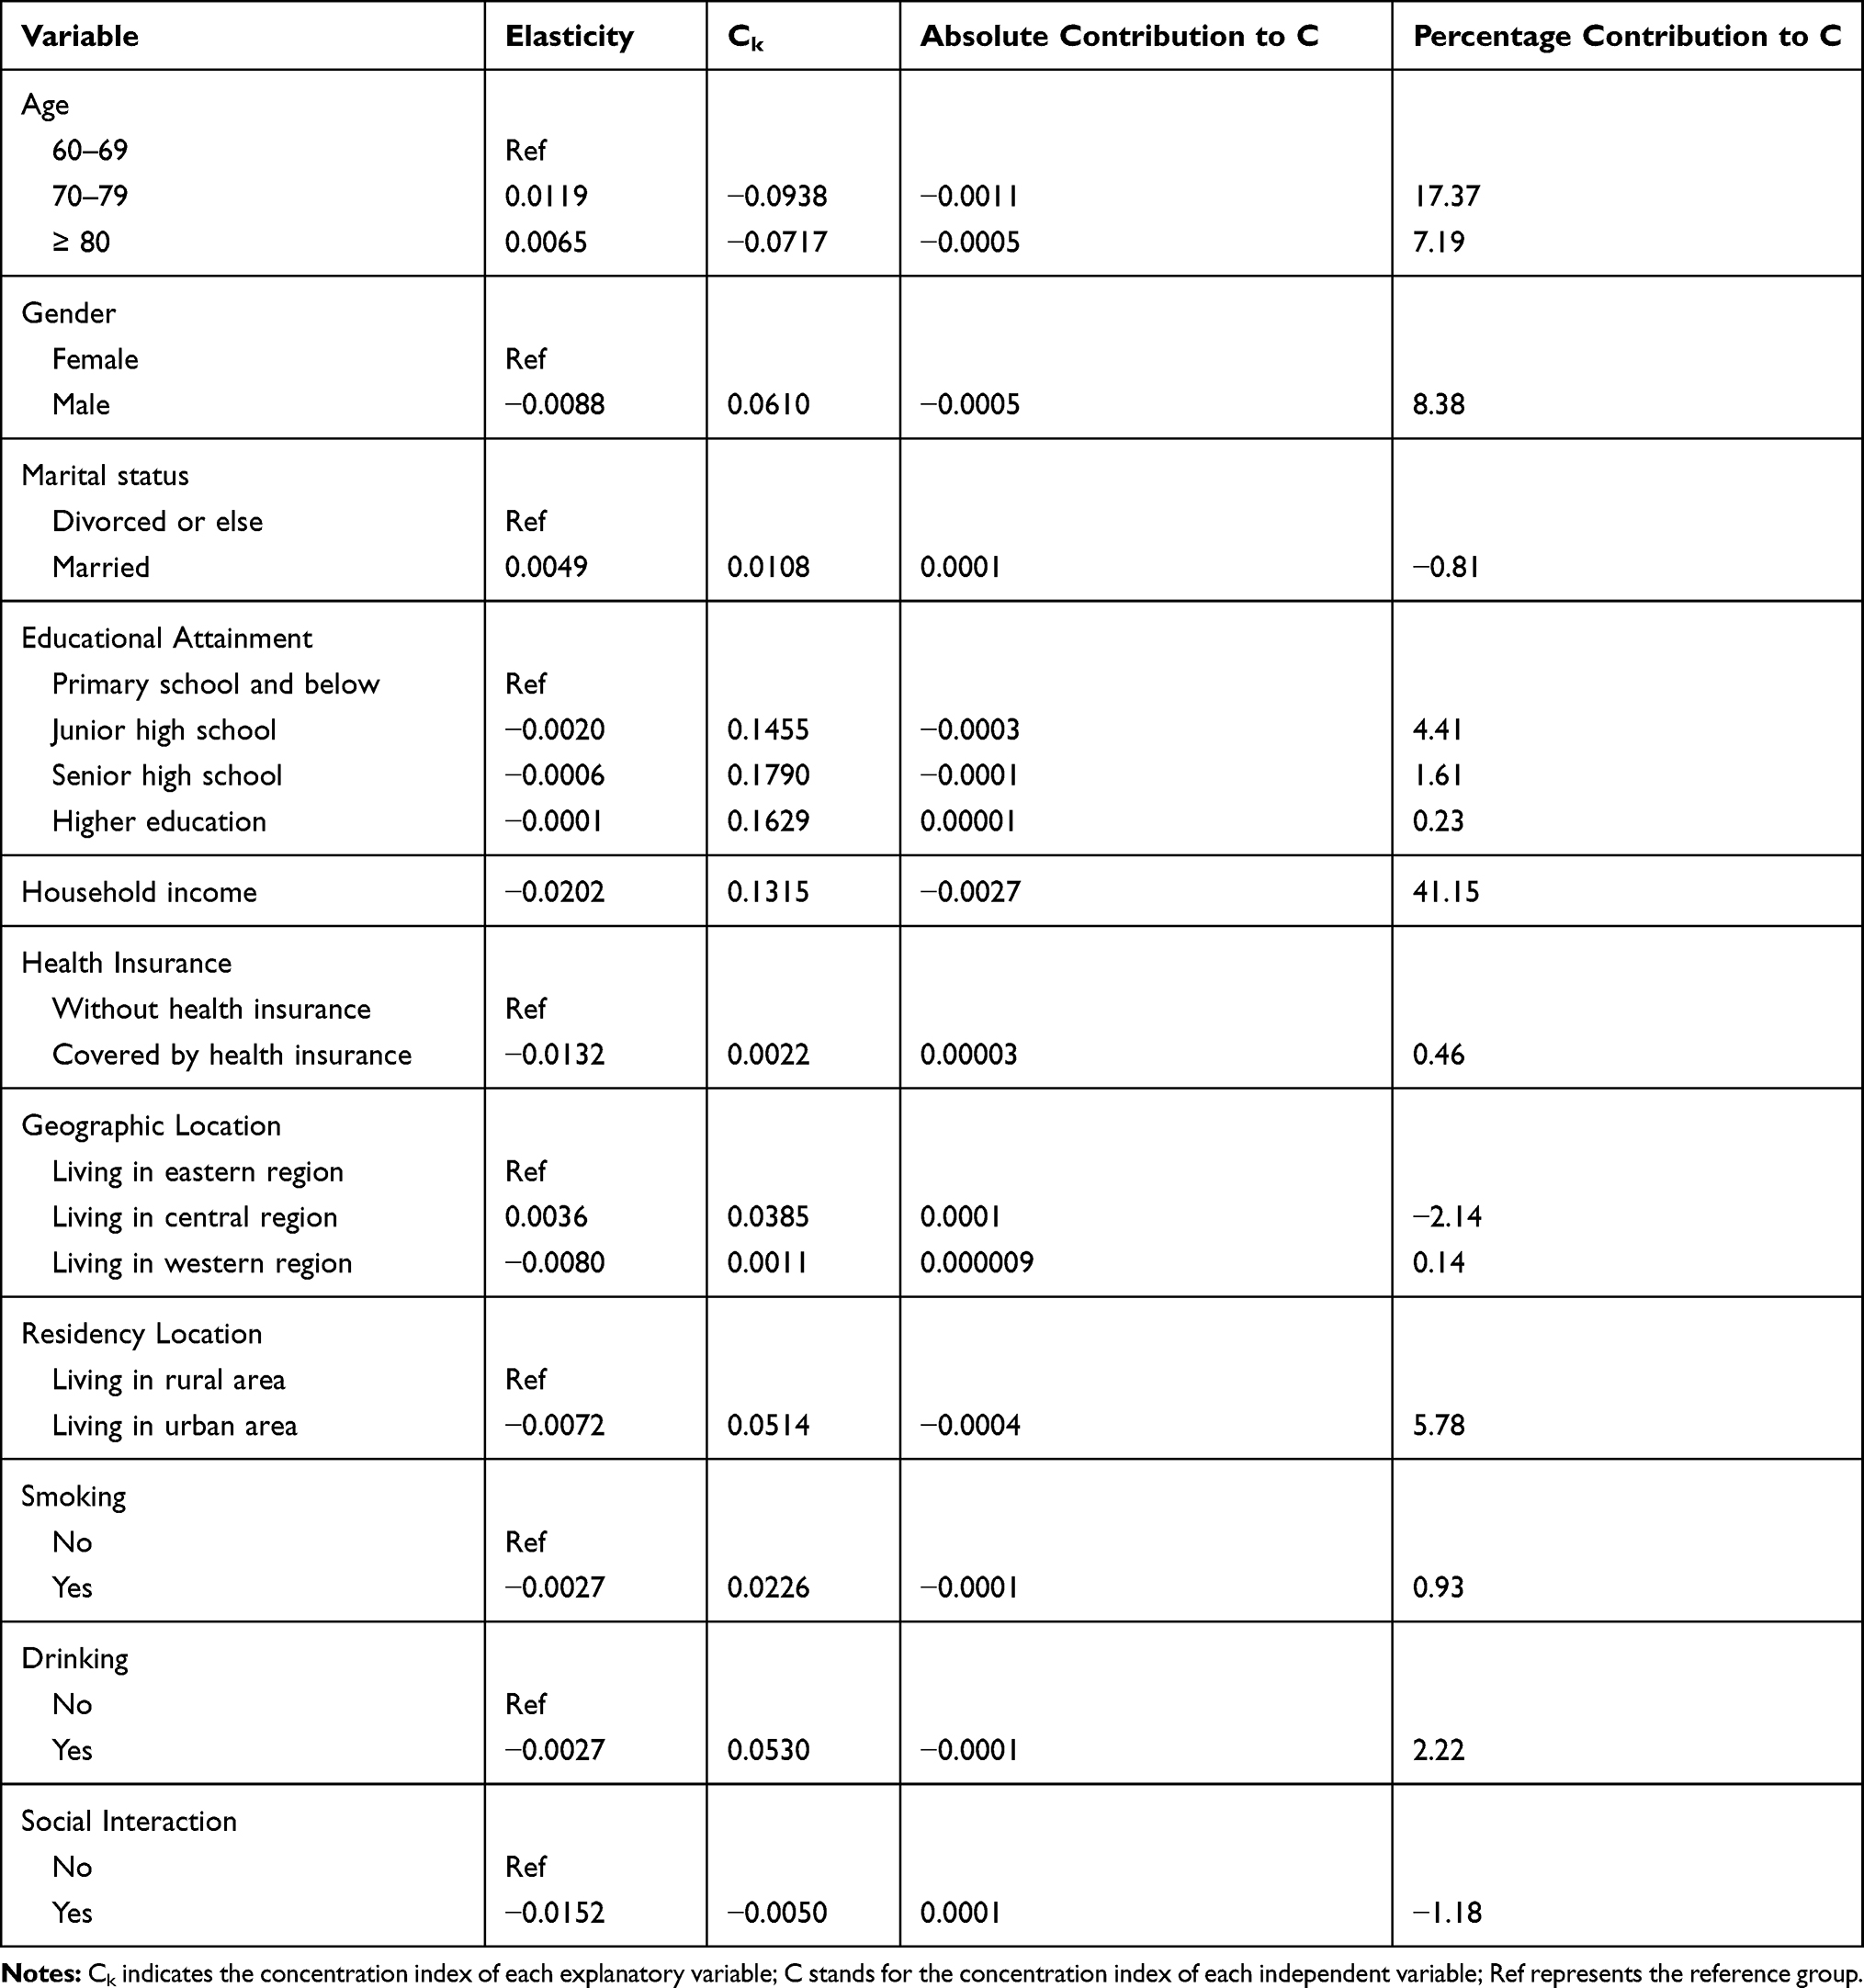 |
Table 3 Decomposition Analysis of Concentration Index in ADL Score |
Decomposition of Inequality in Mental Health
(Table 4) shows the result of decomposition analysis of concentration index in CES-D score. The decomposition analysis indicated that household income (68.41%), being male (17.55%), having junior high school education (10.67%), and living in urban area (6.49%) were key factors to explain the pro-rich inequality in mental health. In addition, those contributions were offset by positive contributions from aging 70–79 (−5.61%), above 80 years of age (−3.26%), living in central region (−3.78%).
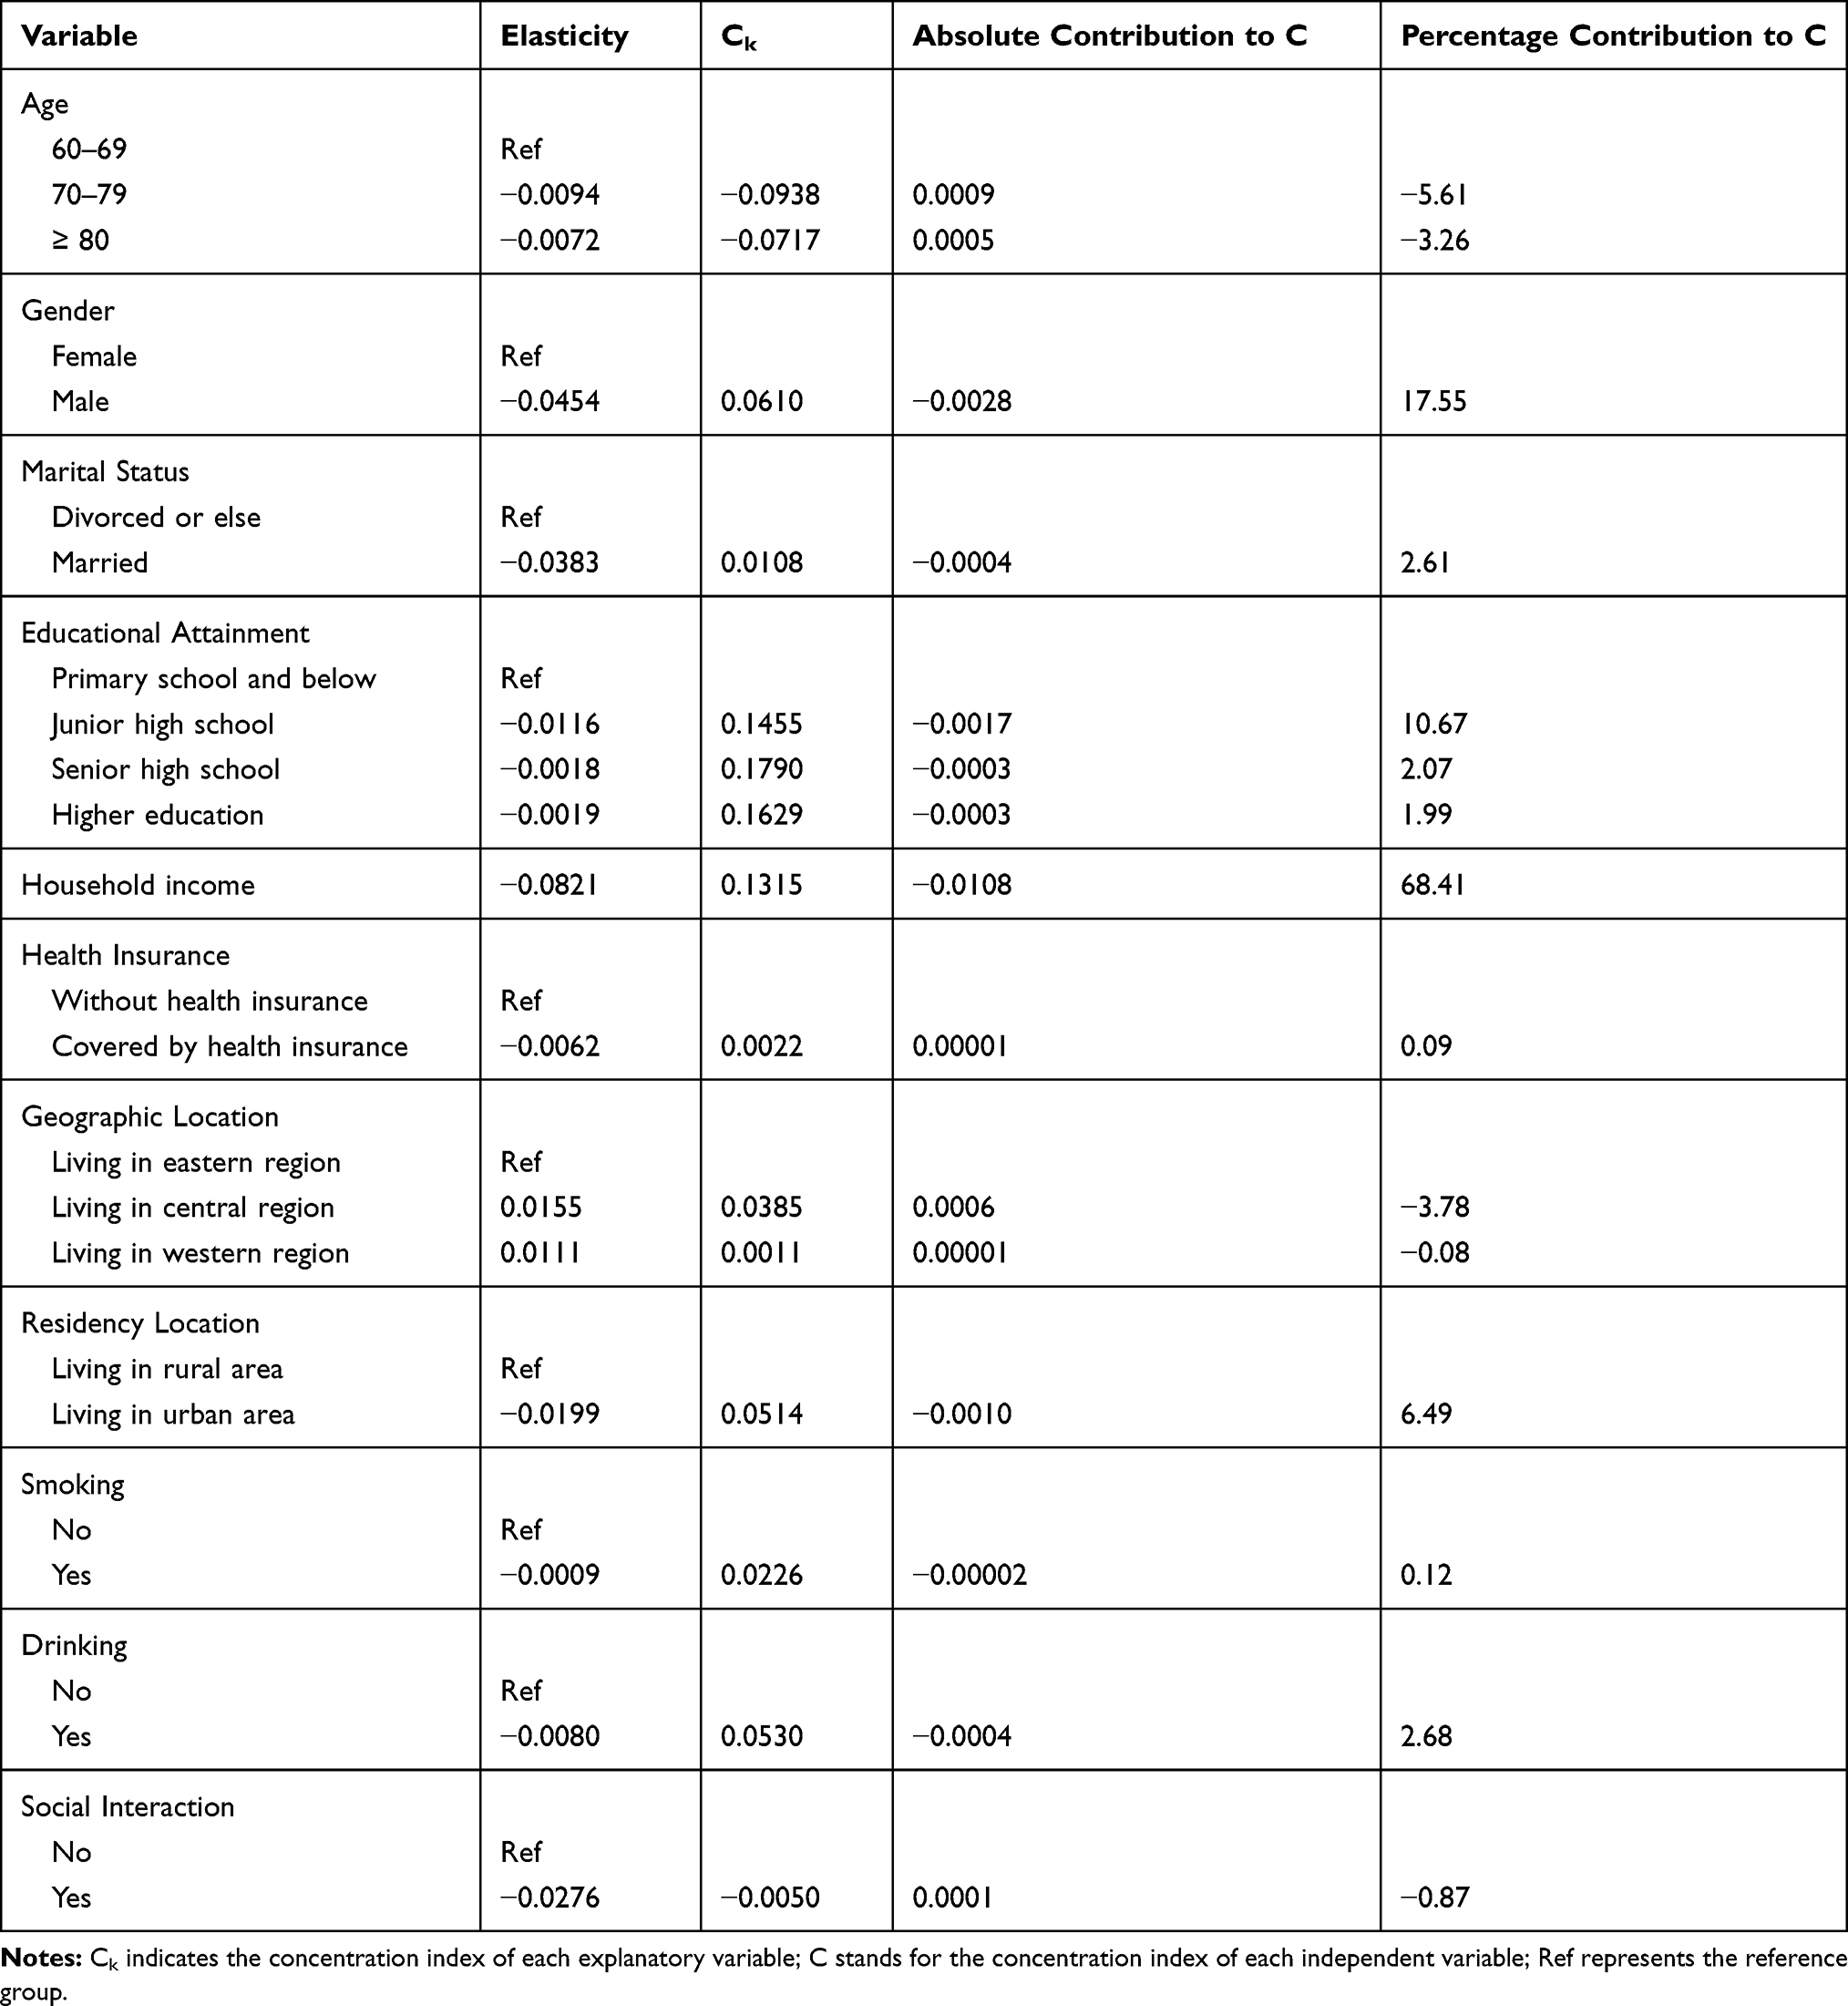 |
Table 4 Decomposition Analysis of Concentration Index in CES-D Score |
Discussion
This study investigated socioeconomic inequality in health outcomes among the elderly by using the data from CHARLS which was conducted in 2015. This study found that the concentration index values of both ADL and CES-D scores were negative, which suggests that there are pro-rich inequalities in physical and mental health among the elderly in China. This result is consistent with the finding of Gu et al.42 who found that there existed significant pro-rich inequality in health among the elderly in China. Furthermore, we observed that the absolute values of concentration index in health outcomes in this study were lower than those in nine industrialized countries,18 indicating a lower level of health inequality in China. Moreover, this study also revealed that the absolute value of concentration index in CES-D score is obviously higher than that in ADL score, which indicates that the degree of pro-rich inequality in mental health is higher than that in physical health.
Results from the decomposition analysis suggested that household income was identified as the biggest contributor to the pro-rich inequality in physical health. Moreover, this study also found that household income was identified as the most important factor for the pro-rich inequality in mental health, which is consistent with the finding of Xu et al.19 Furthermore, another important finding in this study is that educational attainment makes a substantial contribution to socioeconomic inequality in health outcomes, indicating that people with a higher level of educational attainment tend to have better health outcome, which is consistent with the finding of Xie20 and Zhou et al.43 The reason can be divided into two aspects. On the one hand, people with higher educational attainment are more likely to have more health knowledge and attach more importance to the prevention of diseases. On the other hand, people with higher educational attainment tend to have higher income and can invest more resources in health, leading to better health outcomes. Moreover, the results of this study also revealed that the contribution of health insurance to health inequality is relatively lower, which is consistent with the findings of Liu et al.44 who discovered that the contribution rate of health insurance to concentration index was only 0.13%. The reason may lie in the fact that the insured rate of health insurance is extremely high and people are mainly insured by it. In addition, we found that residency location was a key factor to explain the pro-rich inequality in physical and mental health, which suggests that urban residents are more likely to have better health outcomes than their rural counterparts. The reason is that urban residents have more access to high-quality health services than rural residents.
This research highlighted several recommendations that might be helpful to narrow socioeconomic inequality in health outcomes among the elderly. Firstly, it is quite necessary for the Chinese government to perfect the income distribution mechanism and intensify efforts in poverty alleviation to narrow the gap in household income, thereby reducing income-related health outcome inequality. Secondly, the Chinese government ought to pay increased attention to the health-related quality of life and access to health services among older adults with lower income. Moreover, the Chinese government also needs to perfect the urban and rural medical assistance program and improve the protection level of medical assistance for older adults living in poverty. Thirdly, the Chinese government should strengthen health education, improve health awareness to promote healthy lifestyles, and strengthen the prevention of diseases, which can eventually lead to the improvement of socioeconomic equality in health outcomes among the elderly. Last but not least, there is also a great need for China to increase investment in basic and higher education and improve residents’ level of educational attainment, which could relieve inequality in educational attainment between low-income and high-income people.
This study suffered from several limitations that warrant mention. Firstly, given the fact that this study only uses a cross-sectional data for decomposition analysis of concentration index, we cannot explore the findings based on causal relationships. Secondly, some important independent variables which may significantly affect health outcomes of the elderly, such as the regional air pollution45 and individual health literacy,46 cannot be included in this study due to the unavailability of data. Thirdly, self-reported information on health outcomes may be subject to recall bias, which may negatively affect the accuracy of estimation in this study. In CHARLS, different recall periods were used to reduce recall bias; thus, this problem is not serious.
Conclusions
In summary, this study revealed that there are pro-rich inequalities in physical and mental health among the elderly in China, and the degree of pro-rich inequality in mental health is higher than that in physical health. Moreover, the results also suggested that household income is the biggest contributor to socioeconomic inequality in physical and mental health. Furthermore, this study found that educational attainment makes a substantial contribution to socioeconomic inequality in health outcomes, while the contribution of health insurance to health inequality is limited.
Abbreviations
CHARLS, China Health and Retirement Longitudinal Study; ADL, Activity of Daily Living; CES-D, Center of Epidemiological Survey-Depression Scale.
Acknowledgment
This study was funded by National Social Science Foundation of China (15BJL003), Shanghai Philosophy and Social Science Planning Project (2014BJL002), Research Foundation of Shanghai Municipal Development and Reform Commission of 2018, Scientific Research Foundation of Outstanding Young Teachers of Shanghai Jiao Tong University and SMC of 2016, and Urban Governance Foundation in Humanities and Social Sciences in Shanghai Jiao Tong University (16JCCS16).
Author Contributions
SL designed the study. JS analyzed the data and drafted the manuscript. RZ analyzed the data. All authors contributed to data analysis, drafting or revising the article, gave final approval of the version to be published, and agree to be accountable for all aspects of the work.
Disclosure
The authors report no conflict on interest in this work.
References
1. Xie Y, Zhou X. Income inequality in today’s China. Proc National Acad Sci. 2014;111(19):6928–6933. doi:10.1073/pnas.1403158111
2. Kawachi I, Kennedy BP. Income inequality and health: pathways and mechanisms. Health Serv Res. 1999;34:215–227.
3. Qi L, Li Z. The income-related mobility of health and health care utilization. Econ Res J. 2011;46(9):83–95.
4. Blakely TA, Kennedy B, Glass R, et al. What is the lag time between income inequality and health status?. J Epidemiol Community Health. 2000;54(4):318–319. doi:10.1136/jech.54.4.318
5. Subramanian SV, Kawachi I. Income inequality and health: what have we learned so far?. Epidemiol Rev. 2003;26(1):78–91. doi:10.1093/epirev/mxh003
6. Tang S, Meng Q, Chen L, et al. Tackling the challenges to health equity in China. Lancet. 2008;372:1493–1501. doi:10.1016/S0140-6736(08)61364-1
7. Becker GS. Human Capital. New York: Columbia University Press; 1964.
8. Sen A. Why health equity? Health Econ. 2002;11(8):659–666. doi:10.1002/hec.762
9. Xie E. On the Equalization in Health and Medical Service in Urban and Rural Areas. Beijing: Economic Science Press; 2009.
10. Meng Q, Mills A, Wang L, et al. What can we learn from China’s health system reform? BMJ. 2019;365:l2349. doi:10.1136/bmj.l2349
11. Meng Q, Wang J, Wei J, et al. Research on Deepening the Reform of Healthcare System. Beijing: Economic Science Press; 2016.
12. National Bureau of Statistics, People’s Republic of China. China Statistical Yearbook 2018. Beijing: China Statistics Press; 2018.
13. Banister J, Bloom DE, Rosenberg L. Population aging and economic growth in china. the program on the global demography of aging working paper no.53; 2010. Available from: http://www.hsph.harvard.edu/program-on-the-global-demography-of-aging/WorkingPapers/2010/PGDA_WP_53.pdf.
14. Shiroiwa T, Fukuda T, Ikeda S, et al. Japanese population norms for preference-based measures: EQ-5D-3L, EQ-5D-5L, and SF-6D. Qual Life Res. 2016;25:707–719. doi:10.1007/s11136-015-1108-2
15. Sun S, Chen J, Johannesson M, et al. Population health status in China: EQ-5D results, by age, sex and socio-economic status, from the national health services survey 2008. Qual Life Res. 2011;20:309–320. doi:10.1007/s11136-010-9762-x
16. Huang W, Yu H, Liu C, et al. Assessing health-related quality of life of Chinese adults in Heilongjiang using EQ-5D-3L. Int J Environ Res Public Health. 2017;14:224. doi:10.3390/ijerph14030224
17. Zeng Y, Lu J, Lei X, et al. Healthy Aging in China: Trends and Determinants. Beijing: Science Press; 2018.
18. Van Doorslaer E, Wagstaff A, Bleichrodt H, et al. Income-related inequalities in health: some international comparisons. J Health Econ. 1997;16(1):93–112. doi:10.1016/S0167-6296(96)00532-2
19. Xu Y, Yang J, Gao J, et al. Decomposing socioeconomic inequalities in depressive symptoms among the elderly in China. BMC Public Health. 2016;16(1):1214. doi:10.1186/s12889-016-3876-1
20. Xie E. Income-related inequality of health and health care utilization. Econ Res J. 2009;44(2):92–105.
21. Gu H. Coordinating urban and rural medical insurance systems, income-related access to health services, and health inequalities. Soc Sci J. 2019;2:88–97.
22. Su M, Zhou Z, Si Y, et al. Comparing the effects of China’s three basic health insurance schemes on the equity of health-related quality of life: using the method of coarsened exact matching. Health Qual Life Outcomes. 2018;16:41. doi:10.1186/s12955-018-0868-0
23. Peng X, Wang T. Does health insurance relive health inequality among children?. China Ind Eco. 2017;12:59–77.
24. World Health Organization.
25. Lawton MP, Brody EM. Assessment of older people: self-maintaining and instrumental activities of daily living. Gerontologist. 1969;9:179–186. doi:10.1093/geront/9.3_Part_1.179
26. Moon JR, Huh J, Song J, et al. The center for epidemiologic studies depression scale is an adequate screening instrument for depression and anxiety disorder in adults with congenital heart disease. Health Qual Life Outcomes. 2017;15:176. doi:10.1186/s12955-017-0747-0
27. Huang Q, Wang X, Chen G. Reliability and validity of 10-item CES-D among middle aged and older adults in China. Chin J Health Psychol. 2015;7:1036–1041.
28. Marmot M, Friel S, Bell R, et al. Closing the gap in a generation: health equity through action on the social determinants of health. Lancet. 2008;372(9650):1661–1669. doi:10.1016/S0140-6736(08)61690-6
29. Solar O, Irwin A. A Conceptual Framework for Action on the Social Determinants of Health. Geneva, Switzerland: World Health Organization (WHO); 2010.
30. Yao Q, Liu C, Zhang Y. Health-related quality of life of people with self-reported hypertension: a national cross-sectional survey in China. Int J Environ Res Public Health. 2019;16(10):1721. doi:10.3390/ijerph16101721
31. Wagstaff A, Paci P, Van Doorslaer E. On the measurement of inequalities in health. Soc Sci Med. 1991;33(5):545–557. doi:10.1016/0277-9536(91)90212-U
32. Wagstaff A, Doorslaer E, Watanabe N. On decomposing the causes of health sector inequalities with an application to malnutrition inequalities in Vietnam. J Econom. 2003;112(1):207–223. doi:10.1016/S0304-4076(02)00161-6
33. Wang Z, Chen Y, Pan T, et al. The comparison of healthcare utilization inequity between URRBMI and NCMS in rural China. Int J Equity Health. 2019;18:90. doi:10.1186/s12939-019-0987-1
34. Wagstaff A. The bounds of the concentration index when the variable of interest is binary, with an application to immunization inequality. Health Econ. 2005;14(4):429–432. doi:10.1002/hec.953
35. Cao D, Zhou Z, Si Y, et al. Prevalence and income-related equity in hypertension in rural China from 1991 to 2011: differences between self-reported and tested measures. BMC Health Serv Res. 2019;19:437. doi:10.1186/s12913-019-4289-5
36. Su M, Si Y, Zhou Z, et al. Comparing the income-related inequity of tested prevalence and self-reported prevalence of hypertension in China. Int J Equity Health. 2018;17:82. doi:10.1186/s12939-018-0796-y
37. Si Y, Zhou Z, Su M, et al. Socio-economic inequalities in tobacco consumption of the older adults in China: A decomposition method. Int J Environ Res Public Health. 2018;15(7):1466. doi:10.3390/ijerph15071466
38. Zhou Y, Yao X. Improving health equity: changes in self-assessed health across income groups in China. Int J Equity Health. 2018;17:94. doi:10.1186/s12939-018-0808-y
39. Fu X, Sun N, Xu F, et al. Influencing factors of inequity in health services utilization among the elderly in China. Int J Equity Health. 2018;17:144. doi:10.1186/s12939-018-0861-6
40. Zhang T, Liu C, Liu L, et al. General practice for the poor and specialist services for the rich: inequality evidence from a cross-sectional survey on Hangzhou residents, China. Int J Equity Health. 2019;18:69. doi:10.1186/s12939-019-0966-6
41. O’Donnell O, Van Doorslaer E, Wagstaff A, Lindelow M. Analyzing Health Equity Using Household Survey Data. Washington, DC: The World Bank; 2008.
42. Gu H, Kou Y, You H, et al. Measurement and decomposition of income-related inequality in self-rated health among the elderly in China. Int J Equity Health. 2019;18:4. doi:10.1186/s12939-019-0909-2
43. Zhou Z, Fang Y, Zhou Z, et al. Assessing income-related health inequality and horizontal inequity in China. Soc Indic Res. 2017;132:241. doi:10.1007/s11205-015-1221-1
44. Liu R, Li J, Wang J. Analyzing the health equity of rural residents in China and its decomposition. Chin Heal Serv Manage. 2016;33(8):611–614.
45. Liu C, Chen R, Sera F, et al. Ambient particulate air pollution and daily mortality in 652 cities. New Eng J Med. 2019;381(8):705–715. doi:10.1056/NEJMoa1817364
46. YI C, Lee SYD, Arozullah AM, et al. Effects of health literacy on health status and health service utilization amongst the elderly. Soc Sci Med. 2008;66(8):1809–1816. doi:10.1016/j.socscimed.2008.01.003
 © 2020 The Author(s). This work is published and licensed by Dove Medical Press Limited. The full terms of this license are available at https://www.dovepress.com/terms.php and incorporate the Creative Commons Attribution - Non Commercial (unported, v3.0) License.
By accessing the work you hereby accept the Terms. Non-commercial uses of the work are permitted without any further permission from Dove Medical Press Limited, provided the work is properly attributed. For permission for commercial use of this work, please see paragraphs 4.2 and 5 of our Terms.
© 2020 The Author(s). This work is published and licensed by Dove Medical Press Limited. The full terms of this license are available at https://www.dovepress.com/terms.php and incorporate the Creative Commons Attribution - Non Commercial (unported, v3.0) License.
By accessing the work you hereby accept the Terms. Non-commercial uses of the work are permitted without any further permission from Dove Medical Press Limited, provided the work is properly attributed. For permission for commercial use of this work, please see paragraphs 4.2 and 5 of our Terms.