")
Back to Journals » Journal of Pain Research » Volume 11
Sleep quality and covariates as predictors of pain intensity among the general population in rural China
Authors Liu XK, Xiao SY, Zhou L , Hu M , Zhou W , Liu HM
Received 10 November 2017
Accepted for publication 10 January 2018
Published 26 April 2018 Volume 2018:11 Pages 857—866
DOI https://doi.org/10.2147/JPR.S156731
Checked for plagiarism Yes
Review by Single anonymous peer review
Peer reviewer comments 2
Editor who approved publication: Professor E Alfonso Romero-Sandoval
Xiao-kun Liu,1 Shui-yuan Xiao,1,2 Liang Zhou,3 Mi Hu,2 Wei Zhou,4 Hui-ming Liu5
1Mental Health Center, Xiangya Hospital, Central South University, Changsha, Hunan, China; 2Department of Social Medicine and Health Management, Xiangya School of Public Health, Central South University, Changsha, Hunan, China; 3Affiliated Brain Hospital of Guangzhou Medical University, Guangzhou, Guangdong, China; 4Hospital Administration Institute, Xiangya Hospital, Central South University, Changsha, Hunan, China; 5Shenzhen Kangning Hospital, Shenzhen, Guangdong, China
Purpose: The aims of this study were to investigate the distribution of sleep quality and its relationship with the prevalence of pain among rural Chinese people and to explore the association between sleep quality and pain intensity among the general population in real-life settings.
Methods: This cross-sectional survey included a total of 2052 adults from rural areas in Liuyang, Hunan Province, recruited through random multistage sampling. The distributions of sleep quality and pain prevalence among the participants over a 4-week period were described. Because of multicollinearity among variables, the influence of self-rated sleep quality and psychosocial covariates on pain intensity was explored using a ridge regression model.
Results: The data showed that participants reporting all categories of sleep quality experienced some degree of pain. Sleep quality, along with physical and mental health, was a negative predictor of pain intensity among the general population. Symptoms of depression positively predicted pain intensity.
Conclusion: Poor sleep quality increased pain intensity among the participants. Both previous research and the present data suggest that improving sleep quality may significantly decrease pain intensity in the general population. The relationship between sleep and pain may be bidirectional. This finding also suggests that treatment for sleep disorders and insomnia should be addressed in future efforts to alleviate pain intensity.
Keywords: sleep, pain, depression symptoms, mental health
Introduction
Pain is highly prevalent in the general population. According to 2011 global estimates, one-fifth of the general population suffered from pain and one-tenth was diagnosed with chronic pain annually.1 In the USA, Hardt et al estimated that 21.3% of adults (>20 years old) were living with chronic pain from 1999 to 2002.2 In a 2003 survey of participants sampled from 15 European countries and Israel, 19% of the participants in the general population had experienced pain for longer than 6 months.3 In South Australia, the prevalence of chronic pain in the general population was 17.9% between September and December in 2006.4 In a review of 122 publications dated up to December 31, 2013, Jackson et al reported that about 33% of adults in 28 low- and middle-income countries suffered from some type of chronic pain.5 Vos et al reported that from 1990 to 2010 lower back and neck pain were among the leading causes of years lived with disability.6
Many articles have addressed the influence of sleep on pain. First, epidemiological studies have suggested that poor sleep increases the risk of experiencing pain. For example, Ayeni et al reported that craftsmen with poor sleep were more likely to experience lower back pain.7 In a longitudinal study, Mork and Nilsen found that sleep difficulties increased the risk of fibromyalgia in adult women from 1995 to 1997.8 Boardman et al suggested that poor sleep was a risk factor for headaches.9 Choy suggested that poor sleep quality may increase the risk of developing chronic widespread pain.10 Second, experimental data have shown that poor sleep or sleep deprivation can reduce one’s pain threshold. Sivertsen et al tested 10,412 participants to explore the link between sleep and pain, using a cold-pressor pain tolerance test and found that poor sleep significantly increased experimental pain sensitivity.11 Kundermann et al found that sleep deprivation reduced pain threshold.12 Third, poor sleep may be the cause of pain. Valrie et al found that children and adolescents with persistent pain suffered from sleep disturbance.13
Although the influence of sleep on pain has been reported in many articles, few of them have addressed the association between sleep quality and pain intensity in the general population. Most laboratory-based pain research reflects pain sensitivity or acute pain tolerance11,12 and has not tested pain intensity. Current epidemiological surveys are mainly concerned with poor sleep quality increasing the risk of experiencing pain rather than its effects on pain intensity.7–9,14–17 In addition, although a few studies on this topic have addressed pain intensity, they are hospital-based studies on specific samples. For example, Alsaadi et al found that poor sleep quality was negatively associated with pain intensity among acute lower back pain patients (even after controlling for depression symptoms)18 and Raymond et al found that sleep quality had an adverse relationship with pain intensity among hospitalized burn patients.19 Bromberg et al found that sleep quality influenced pain intensity among children with arthritis.20 Few studies have considered the effects of potential psychosocial covariates with sleep quality on pain intensity among the general population in real-life settings, such as gender, age, health status, education, emotional distress (e.g., depression, anxiety), and cognition (perceived stress and self-efficacy).
To the authors’ knowledge, the influence of sleep quality on pain intensity among the general population has not been investigated. An understanding of this relationship would have potential therapeutic and public health value in terms of pain treatment and prevention. In light of this research gap, a population-based, cross-sectional study was conducted in the rural areas of Liuyang, China. The aim was to investigate the distribution of sleep quality and the prevalence of pain among adults and to examine the influence of sleep quality, along with psychosocial variables and health status on pain intensity among the general population in everyday settings.
Materials and methods
Study setting
Liuyang City, located in Hunan Province in southern central China, is representative of rural cities in China and is classified as one of the national development and reform pilot cities. It had a total population of 1,423,525 citizens in 2011, across 4 urban districts and 33 rural towns.
Design
This was a population-based, cross-sectional study. Initially, 2 of the 33 rural towns in Liuyang were selected (Gaoping and Yong’an). Next, 2 villages from each town were selected (Shiwan and Ma’an from Gaoping; Lutang and Shuishan from Yong’an). Finally, 2 blocks were randomly selected from each village, for a total of 8 samples. All residents in the targeted blocks were invited to participate in the study.
Participants
Participants were identified using multistage cluster-sampling. Initially, the authors attempted to recruit all the 2377 adults from the 8 sample areas who had lived in the rural areas of Liuyang for >6 months prior to beginning of the study. Subsequently, the following were excluded: 1) participants who could not be located after 3 visits by the investigators, 2) individuals who had severe mental disorders or severe cognitive impairment, and 3) individuals who had physical illnesses or injuries. In total, 219 individuals were excluded. Additionally, 78 declined to participate and 28 withdrew from the study. The final sample consisted of 2052 adults.
Ethical considerations
Ethical approval for this project was obtained from the Institutional Review Board of the School of Public Health, Central South University.
Procedure
This cross-sectional survey was conducted from November 1, 2010 to August 31, 2011. The research team included 1 principal investigator (a PhD student), 11 graduate students, and 3 undergraduates. The principal investigator provided training to all the investigators prior to data collection. The training included the objectives of the survey, the content of the instruments, the skills required to administer the instruments, and the assessment criteria. The whole team was divided into 3 interviewing groups.
This study was supported by local government administrators and each potential family was visited at home by an interviewing team (1 team member underwent specific training and was appointed as a quality control person) and a local guide. At the beginning of the visit, one of the interviewers introduced the purpose of the survey to all participants in the household. When necessary, the local guide explained the interviewer’s remarks in the local dialect (Mandarin Chinese is not commonly spoken in rural China). Next, informed consent forms were provided by the investigators. After the consent forms were signed by the participants, each eligible participant in the household was invited by an interviewer to complete a series of questionnaires individually and that interviewer was responsible for the data collection from that participant.
All questionnaires were completed in a single visit, and each participant was reimbursed with a small gift. The quality control appointee remained present throughout the entire interview and checked the answers to all the questions after the questionnaire had been completed. If any missing item was identified, the question was asked again and the answer recorded.
Data collection instruments
Pain intensity
Pain intensity was assessed using the visual analog scale (VAS). The VAS has been used in psychological and medical research since the 1920s21 and has demonstrated reliability and validity for measuring pain intensity.22,23 The 2 ends of the VAS are anchored by extremes of pain intensity: 0 (no pain) and 10 (worst pain imaginable). Participants were asked to recall and select the point on the line that best represented their overall condition of pain intensity in the preceding month.
Sleep quality
Sleep quality was also assessed by VAS, using a 10-cm straight line with bilateral limits that indicated the worst sleep quality on one end, and the best on the other. The reliability and validity of the VAS for measuring subjective experience have been verified24–27 and it is widely used in assessing global sleep quality.28,29 The participant selected the place best representing the overall condition of his/her sleep quality from 0 (the worst sleep quality) to 10 (the best sleep quality) in the preceding 4 weeks.
Sociodemographic information
Sociodemographic information was collected, including gender (male=1, female=2), age, education, income, and religion. Education was categorized as 1=primary school or illiterate, 2=middle school, and 3=high school and above. Participants reported their typical monthly income and the annual total were calculated. Religion was categorized as 1=follower of a certain religion and 2=not a follower of any religion.
Health status
The Self-Rated Health Measurement Scale (SRHMS), developed and revised by Xu et al30 was administered to assess 3 dimensions of health: physical, mental, and social. The SRHMS contains 48 items used to assess health systems, and each item was measured on an 11-point Likert scale. Physical health refers to physical mobility, daily physical activities, and organ function (such as digestion function). Mental health denotes the individual’s level of happiness and perceived cognitive function. The relevant scale items asked questions such as the following: 1) do you feel happy about your life; 2) are you optimistic about your future; 3) are you confident about your memory; and 4) can you concentrate when needed. Social health refers to social contacts and networks, such as one’s communication level with family members or the availability of a support network when needed. The highest possible scores for physical, mental, and social health were 170, 150, and 120, respectively, for a possible total of 440.31 Higher scores indicated better health. The reliability of the SRHMS was indicated by a Cronbach’s α coefficient of 0.93 overall, and 0.80–0.82 for its 3 subscales.32
Depressive symptoms
The Chinese version of the Patient Health Questionnaire Depression Module (PHQ-9) was utilized to identify participants’ depressive symptoms. Nine items on the scale were based on the depression diagnostic symptoms in the Diagnostic and Statistical Manual of Mental Disorders (the major depressive disorder symptoms given in the DSM-4 and DSM-5 are identical33,34). Each item was accompanied by a rating scale for the frequency of symptom occurrence, with values ranging from 0 (“not at all”), to 3 (“nearly every day”).35 A higher total score (possible range 0–27) indicated more prevalent depressive symptoms. The Chinese version of the PHQ-9 has been reported to have a Cronbach’s α coefficient of 0.86.36
Anxiety symptoms
The Generalized Anxiety Disorder (GAD) scale is a 7-item self-reporting scale, developed by Spitzer et al.37 Participants evaluated how often they had been troubled by anxiety, on a 4-point Likert scale from 0 (not at all) to 3 (nearly every day).37 The total score can range from 0 to 21 (the sum of the ratings for each item);38 a higher score indicates a greater prevalence of anxiety symptoms. The GAD-7 has been validated for the general population39 as well as psychiatric patients.40 The reported Cronbach’s α coefficient of the GAD-7 is 0.92.37
Self-efficacy
The General Self-Efficacy Scale (GSES) was employed to assess participant’s self-efficacy. The scale was originally developed by Schwarzer and Jerusalem in 1979 in Germany and has since been confirmed and validated in multicultural settings and translated into more than 25 languages.41 The GSES includes 10 self-statements about perceived ability to face life’s difficulties. Each item is reported on a 5-point Likert scale. For example, the last item is “I can usually handle whatever comes my way” and the participants selected the number from 1 (“I never believe this to be true”) to 5 (“I always believe this to be true”) that best represented his or her perception. The total score, obtained by adding the scores for all 10 items, ranged from 10 to 50. The reported Cronbach’s α coefficients for the Chinese GSES range from 0.89 to 0.92.42
Perceived stress
The Perceived Stress Scale (PSS), originally developed by Cohen et al in 1983, is a 14-item stress measurement tool.43 A shortened 10-item version (PSS-10) has been reported to have a Cronbach’s α coefficient of 0.74.44 Each item is rated on a 5-point Likert scale ranging from 0 (“never”) to 4 (“very often”). For example, the third item is “experience stress” and the participant selected the number from 0 to 4 that best represented his or her condition. The 4 positive items are reverse coded and their scores are added to those of the 6 negative items. The total score for the PSS-10 can range from 0 to 40, with higher total scores indicating greater perceived stress. The Chinese PSS-10 was employed in this study, which has a Cronbach’s α coefficient of 0.70.45
Statistics
Statistical analyses were performed using SPSS version 18.0. Sample characteristics were summarized using basic descriptive statistics. The relationships between variables were calculated using Pearson’s correlation coefficients. A regression model was used to predict the impact of sleep quality on pain intensity. Linear regression was derived from ordinary least squares estimation and requires that variables not have multicollinearity, which is a common occurrence in real-life situations. In 1970, Hoerl and Kennared proposed the technique of ridge regression analysis to overcome the problem of data collinearity.46,47 Given the existence of multicollinearity among the predictive variables in this study, ridge regression analysis was utilized to explore the influence of self-rated sleep quality and psychosocial covariates on pain intensity. The following steps were used to determine the ridge regression model: 1) choose the appropriate ridge parameter-k for the full model, 2) select appropriate variables to set up the final model, and 3) determine the overall fit and the significance of each predictor in the final model.
Results
Sample characteristics
Table 1 shows the sociodemographic characteristics of the 2052 participants. Notably, the sample included more women (1065, 51.90%) than men (987 males, 48.10%). Most participants were middle aged at 46–55 (33.87%) with relatively few young adults (18–25 years old, 1.8%). Most participants were of Han ethnicity (99.50%), married (90.98%), and non-religious (90.01%). A total of 61.11% of the participants were employed (43.42% in agriculture and 17.69% in non-agriculture) and 38.89% were unemployed. Less than half (39.70%) of the participants had only a primary school education or were illiterate and 45.10% participants had attended only middle school. Only 15.30% of the participants had a high school education or more. In 2009, the national rural poverty line was defined as below 1992 yuan/year. In Hunan province in 2010, the average income of each farmer was 5523 yuan/year. Income level was divided into 3 groups: low (1992 yuan/year or less), middle (1993–5523 yuan/year), and high (>5524 yuan/year). A total of 241 participants (0.25%) were below the poverty level, 513 participants (25%) had a middle income, and 1298 (63.26%) had a high income.
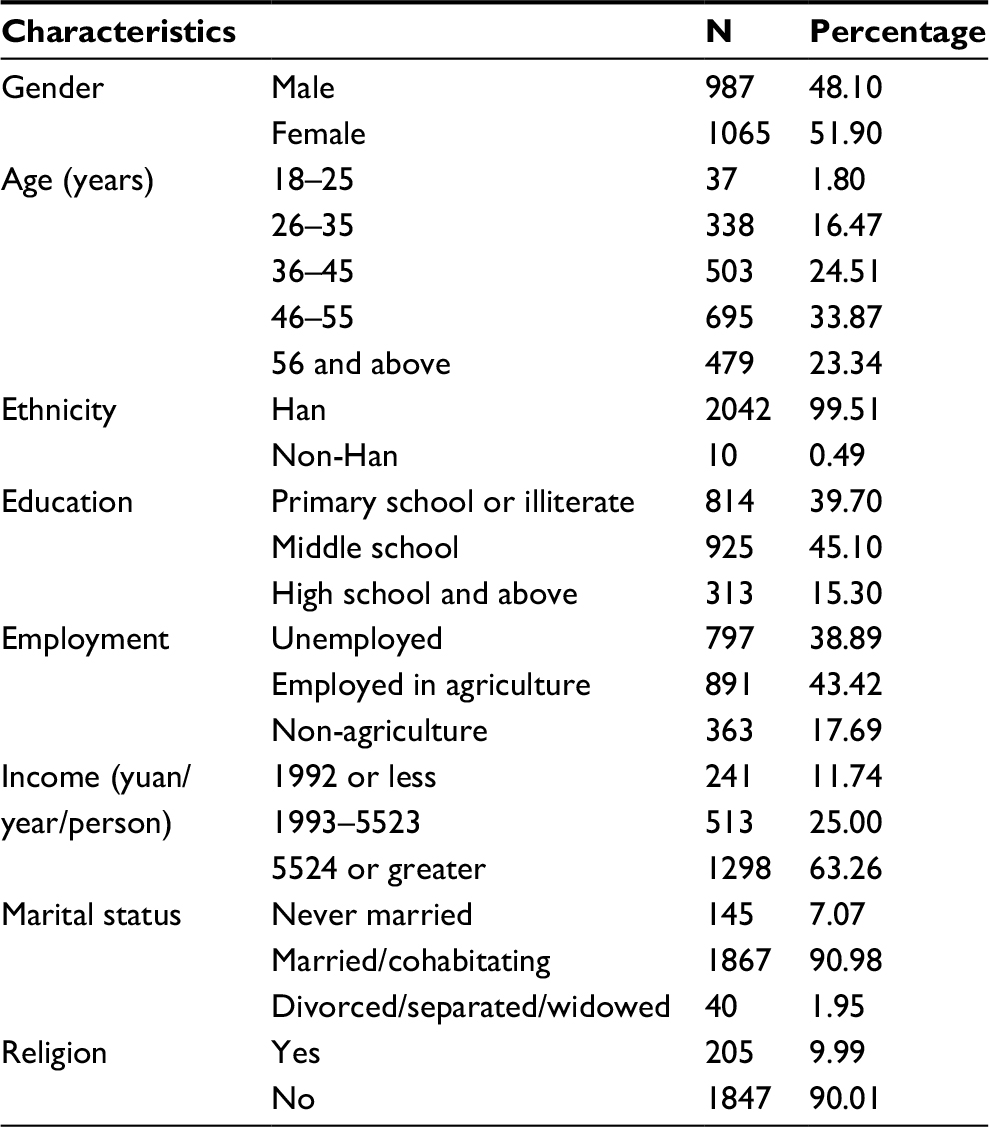 | Table 1 Sociodemographic characteristics of the participants (N=2052) |
The psychological characteristics of the 2052 participants are shown in Table 2. The participants’ average sleep quality and pain intensity scores were 7.28±2.55, 3.27±3.08, respectively. Their average scores for depression and anxiety symptoms were 3.64±3.92 and 2.73±3.56, respectively. The mean ± SD scores for physical, mental, and social health were 142.58±18.68, 117.17±21.44, and 85.12±18.76, respectively. The average scores for self-efficacy and perceived stress were 27.09±4.36 and 18.33±6.47, respectively.
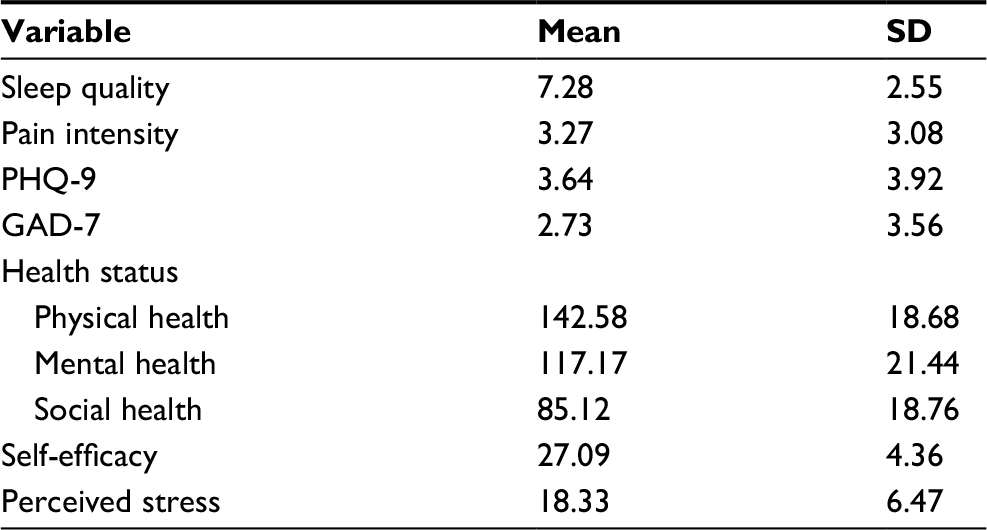 | Table 2 Psychological characteristics of the participants (N=2052) Abbreviations: GAD-7, 7-item Generalized Anxiety Disorder scale; PHQ-9, Patient Health Questionnaire Depression Module. |
Sleep quality and 4-week pain prevalence
The sleep quality scores were recoded into 5 categories. The distributions of different levels of sleep quality and 4-week pain prevalence among all the participants are shown in Table 3. All categories of sleep quality were associated with reported pain to some extent. More than one-third (38.55%) of the participants indicated that they had experienced the best sleep quality and among them, the 4-week pain prevalence was 52.72%. Only 4.78% had experienced the worst sleep and among them, the pain prevalence was 85.17%. As indicated in Table 3, the lower the sleep quality, the higher the pain prevalence. There was a tendency for participants who indicated higher sleep quality to be less likely to have experienced pain.
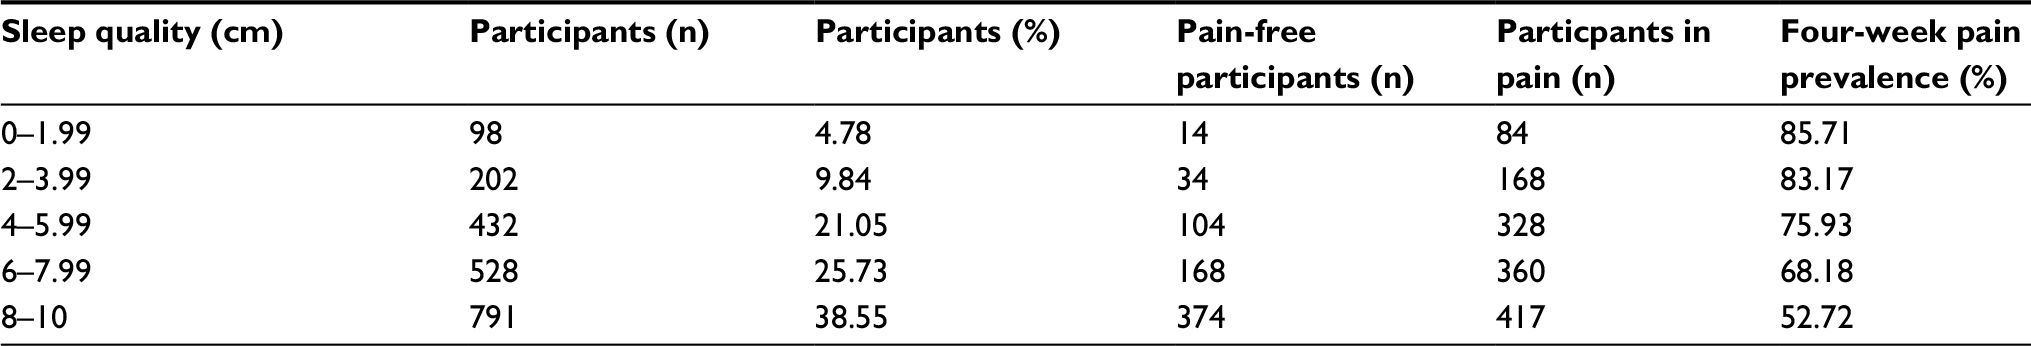 | Table 3 Distributions of sleep quality and pain prevalence among rural Chinese people |
Associations between sleep quality, psychosocial covariates, and pain intensity
The dependent variable was pain intensity, ranging from pain-free to extreme pain. Independent variables included: sleep quality; sociodemographic variables: such as gender, age, income, level of education, and religion; physical, mental, and social health; and psychological variables, including self-reported self-efficacy, symptoms of depression and anxiety, and perceived stress. Pearson’s correlation coefficients were calculated for the pairs of variables (Table 4). Significant correlations were found between the independent variables.
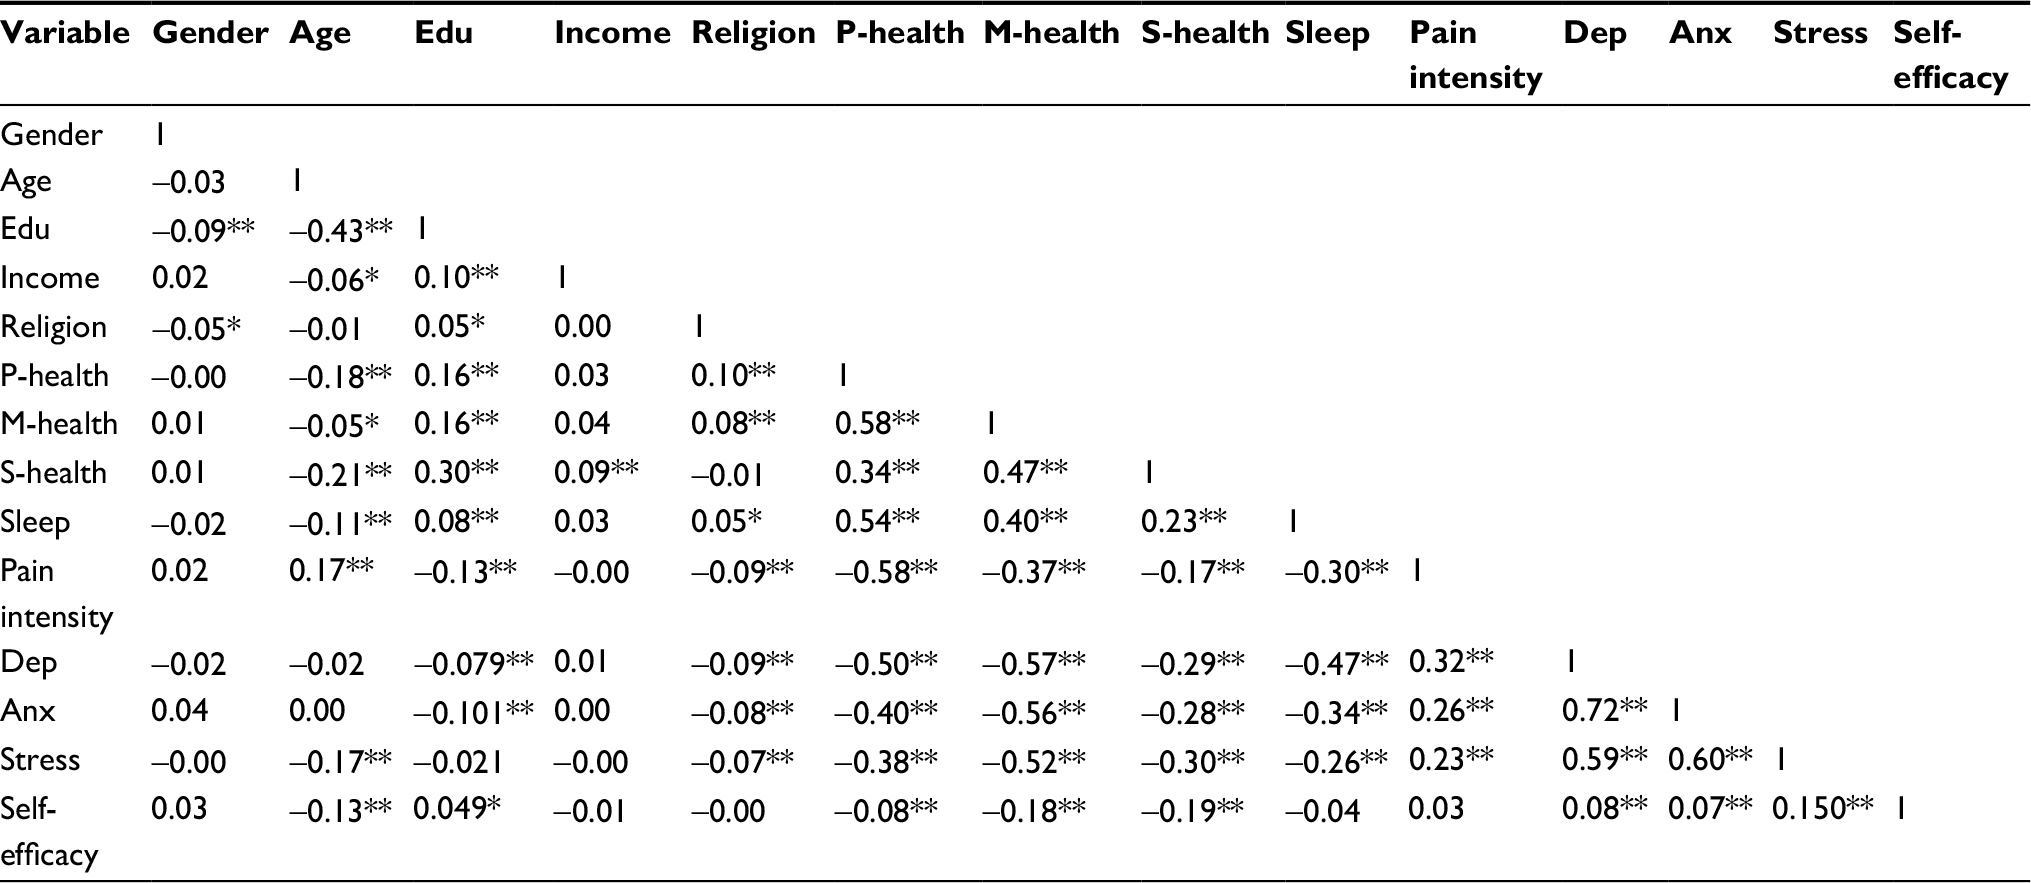 | Table 4 Correlations between variables Notes: **Significant at p=0.01; *significant at p=0.05. Abbreviations: anx, scores for anxiety symptoms scores; dep, scores for depressive symptoms; edu, highest level of education; m-health, mental health; p-health, physical health; s-health, social health. |
To explore the influence of sleep and covariates on pain severity in the case of multicollinearity, a linear ridge regression model was applied, which employs a shrinkage constant-k, to make the regression coefficients more stable.48 The ridge trace is shown in Figure 1. The horizontal axis represents the value of the ridge parameter-k, which determines how much the correlation matrix varies, and the vertical axis represents the coefficients of the variables in the ridge regression model with that value of k. As shown in the graph, when k<0.3, the regression coefficients fluctuate and when k=0.3, the regression coefficients tend to stabilize. Thus, k=0.3 was set as the ridge parameter.
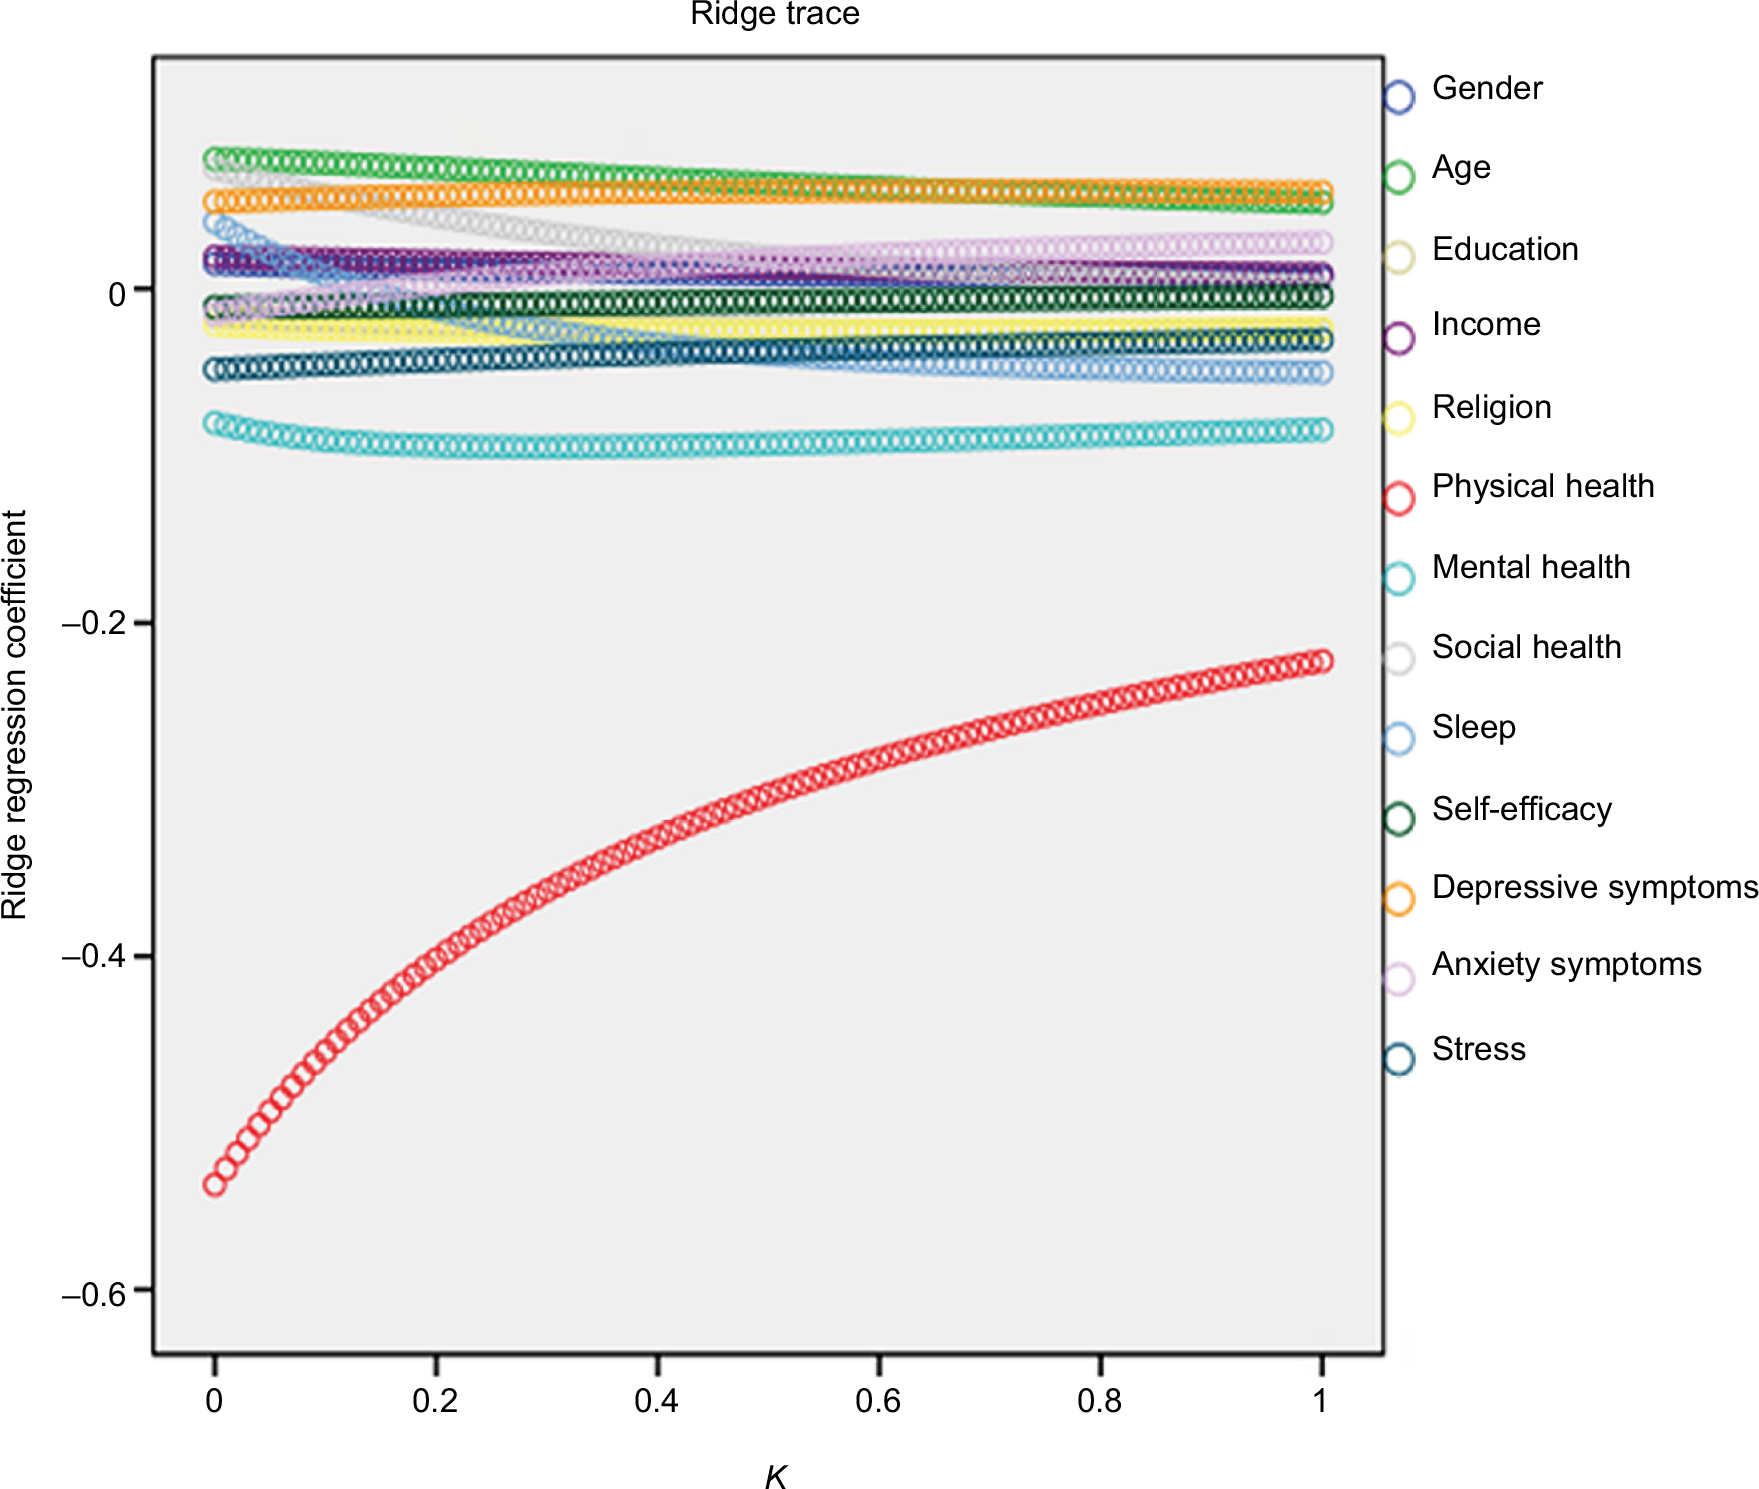 | Figure 1 The first ridge trace (K; including all the independent variables). |
In the initial ridge regression model described previously, in which all the independent variables were included (Figure 1), the regression coefficients for some variables approached zero, whereas others substantially overlapped with one another. Three steps were taken to determine the final regression model. First, the sleep quality variable was retained because the purpose was to identify its influence on pain intensity. Second, the variables with coefficients that were close to zero, were eliminated from the regression model, these included gender, education, income, religion, physical and social health, self-efficacy, perceived stress, and symptoms of anxiety. Third, although the age and symptoms of depression variables overlapped each other, the depression variable was retained and age omitted based on previous research that has established a clear relationship between depressive symptoms and pain intensity49–53 and on the fact that the correlations between symptoms of depression and pain in the present study (Table 4) was much more pronounced than the correlation between age and pain (r1=0.32; r2=0.17). The final ridge path comprised 4 variables: physical health, mental health, symptoms of depression, and sleep quality, which is shown in Figure 2.
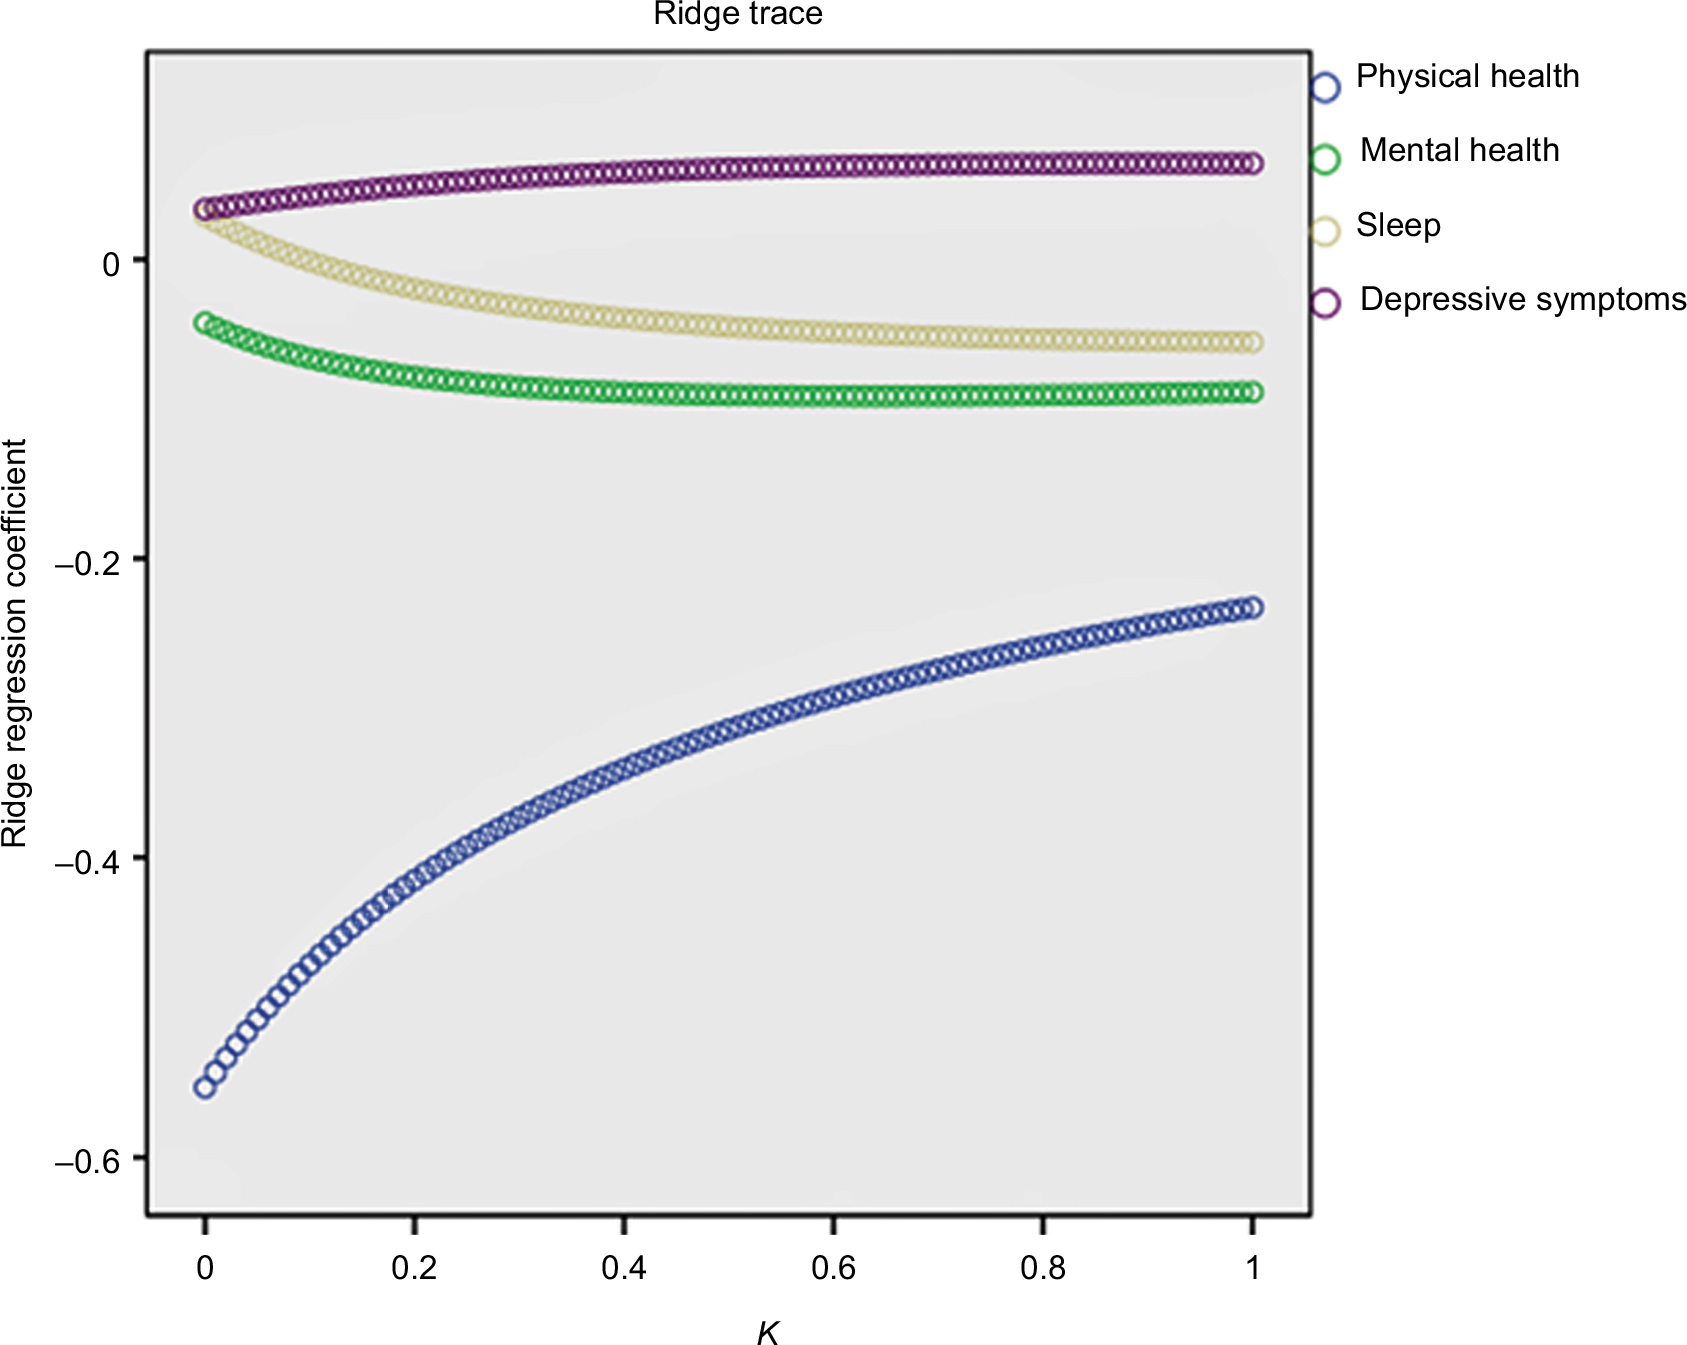 | Figure 2 The second ridge trace (K; including the final 4 explanatory variables). |
Significance tests were conducted for the final model and the coefficient estimates for each of the independent variables retained in the model. A matrix procedure was used with the criterion for significance set at a p-value below 0.05. The results showed that: 1) the overall model yielded significance (Table 5: p<0.00); and 2) all the 4 predictor variables included in the model were significant predictors of pain intensity (Table 6: the coefficient B and standardized coefficient α were both significant for all predictors).
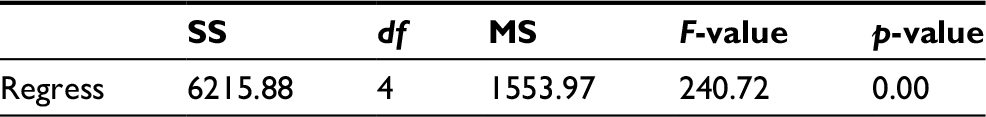 | Table 5 Analysis of variance table for the final ridge regression model Note: Ridge parameter K=0.3. Abbreviations: MS, mean square; SS, sum of squares. |
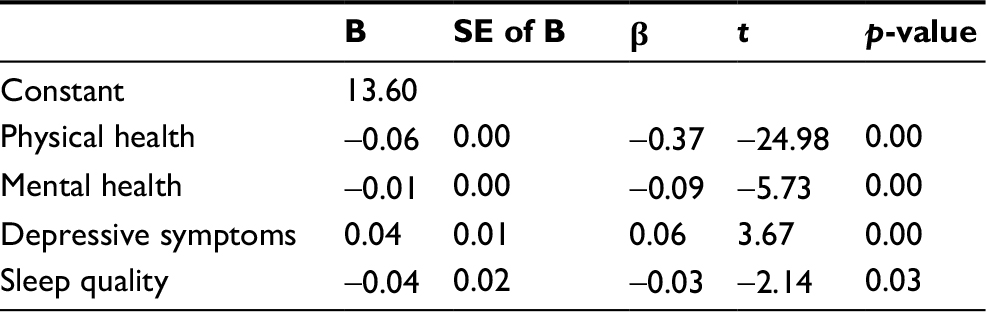 | Table 6 Predictors of pain intensity in the general population Abbreviations: B, coefficient value; SE, standard error; b, standardized coefficient. |
Discussion
This research provided a description of the distributions of sleep quality and 4-week pain prevalence among the general population in their daily lives. Among the general population in rural China, 38.55% reported high-quality sleep and 4.78% had poor sleep. Among these groups, the 4-week prevalence of pain was 52.72% and 85.71%, respectively. At the same time, associations were found between self-reported pain intensity and sleep quality, physical and mental health, and depressive symptoms.
Sleep quality and pain intensity
This study investigated 2052 adults’ self-rated sleep quality and pain intensity under everyday circumstances during a 4-week period. Sleep quality was found to be negatively associated with pain intensity in the general population (in particular, the study focused on Chinese adults, living in rural environments). Sleep is crucial for optimal physical functioning. People who sleep well may feel better about their physical condition, and consequently report lower pain intensity. In addition, sleep is crucial for restoring optimal cognitive function,54 and poor sleep probably leads to deterioration of the cognitive ability needed to manage pain intensity. The results showed that sleep quality was not the most prominent predictor of pain intensity; there were stronger associations of the latter with physical and mental health, and depressive symptoms. However, the influence of sleep quality was probably underestimated because the PHQ-9 includes an item that assesses sleep quality. These findings, both from previous research7,9,10,17–19,55 and the present data, jointly suggest that improving sleep quality may prove to be a useful approach for mitigating pain intensity in the general population.
These results demonstrated that poor sleep in adults was associated with significantly increased pain intensity. More efforts are needed to increase public awareness of the importance of improving sleep quality for pain prevention and management. Complementary therapies, such as breathing techniques to prepare for sleep, and slow or moderate exercise before sleep are useful and practical for the general population. Education on sleep hygiene helps to set a healthy sleep–wake cycle among the general population for improved sleep quality. Clinically, some “seemingly healthy” people (without obvious injury or disease) are troubled by pain probably resulting from their poor quality of sleep. Clinicians could consider assessing and improving patients’ quality of sleep in the treatment of pain symptoms. Sleep quality can be improved through medication and psychotherapy.
Furthermore, the relationship between sleep and pain may be bidirectional. Studies have shown that patients with serious pain symptoms (such as those with rheumatoid arthritis or lower back pain) are likely to have sleep disorders.18,56,57 In clinical trials, reduction in pain intensity has produced substantial benefits for sleep.58 Complaints of poor sleep among adults warrant consideration and assessment with regard to whether the problems stem from pain symptoms. Social workers could focus on alleviation of pain intensity as a viable approach to treat poor sleep in the general population.
Other predictors of pain intensity
The comorbidity of pain and depression has already been recognized.59 Keefe et al addressed depression and physical status as the most prominent predictors of the experience of pain.52 Lerman et al reported that latent depression predicted pain longitudinally.53 Pinheiro et al reported that symptoms of depression were associated with a higher prevalence of lower back pain.60 This present study adds additional evidence to previous studies that depression predicts both the experience and the intensity of pain.
Physical health is related adversely with pain intensity, which is consistent with previous studies61–64 and common sense. The predictive role of mental health in pain intensity has seldom attracted the attention of clinicians and scholars. The finding presented here revealed that better mental health predicts lower pain intensity. In the present work, mental health referred to emotional well-being, positivity, and perceived cognitive ability. Fredrickson proposed that positive emotions broaden attention span and boost cognitive ability.65 Improved mental health, with the accompanying positive emotions may increase participants’ attention span and cognitive ability, helping them to cope with pain intensity, leading to a negative correlation with pain intensity.
Limitations
Several limitations of this study should be mentioned. First, the cross-sectional design makes it impossible to identify the direction of cause and effect between sleep and pain. Thus, additional longitudinal studies are necessary to further clarify any causal relationship. Second, sleep quality was measured by means of a single VAS. In future research, more detailed information (e.g., the extent to which the participant has difficulty falling asleep, sleep duration, insomnia, sleep apnea) would be useful for a more nuanced exploration of the dimensions of sleep quality. Third, the sample was taken from rural China, and the study’s validity for a different demographic would have to be explored carefully.
Conclusion
This study aims to enhance our understanding of sleep quality as a predictor of pain intensity among the general population in the real-life settings. The study’s finding with regard to sleep quality and pain intensity is consistent with the results for patients in previous studies. Relief for pain intensity in the general population might be achieved by addressing ways to improve sleep quality.
Data sharing statement
All data underlying the findings in our study are freely available on request; please contact [email protected] for the dataset and analysis commands.
Acknowledgments
The authors thank Dr Lulu Qin for giving advice on submission.
This study was funded by the National Science and Technology Support Program, China (Number 2009BAI77B01; Number 2009BAI77B08).
Author contributions
All authors contributed toward data analysis, drafting and critically revising the paper, gave final approval of the version to be published, and agree to be accountable for all aspects of the work.
Disclosure
The authors report no conflicts of interest in this work.
References
Goldberg DS, McGee SJ. Pain as a global public health priority. BMC Public Health. 2011;11:770. | ||
Hardt J, Jacobsen C, Goldberg J, Nickel R, Buchwald D. Prevalence of chronic pain in a representative sample in the United States. Pain Med. 2008;9(7):803–812. | ||
Breivik H, Collett B, Ventafridda V, Cohen R, Gallacher D. Survey of chronic pain in Europe: Prevalence, impact on daily life, and treatment. Eur J Pain. 2006;10(4):287–333. | ||
Currow DC, Agar M, Plummer JL, Blyth FM, Abernethy AP. Chronic pain in South Australia - population levels that interfere extremely with activities of daily living. Aust N Z J Public Health. 2010;34(3):232–239. | ||
Jackson T, Thomas S, Stabile V, Han X, Shotwell M, McQueen K. Prevalence of chronic pain in low-income and middle-income countries: A systematic review and meta-analysis. Lancet. 2015;385(Suppl 2): S10. | ||
Vos T, Flaxman AD, Naghavi M, et al. Years lived with disability (ylds) for 1160 sequelae of 289 diseases and injuries 1990–2010: a systematic analysis for the global burden of disease study 2010. Lancet. 2012;380(9859):2164–2196. | ||
Ayeni GO, Olaniyi O, Ayeni OA. Sleep habits and occurrence of lowback pain among craftsmen. Int J Public Health Sci. 2014;3(2):101–106. | ||
Mork PJ, Nilsen TI. Sleep problems and risk of fibromyalgia: longitudinal data on an adult female population in Norway. Arthritis Rheum. 2012;64(1):281–284. | ||
Boardman HF, Thomas E, Millson DS, Croft PR. The natural history of headache: predictors of onset and recovery. Cephalalgia. 2006;26(9):1080–1088. | ||
Choy EH. The role of sleep in pain and fibromyalgia. Nat Rev Rheumatol. 2015;11(9):513–520. | ||
Sivertsen B, Lallukka T, Petrie KJ, Steingrimsdottir OA, Stubhaug A, Nielsen CS. Sleep and pain sensitivity in adults. Pain. 2015;156(8):1433–1439. | ||
Kundermann B, Spernal J, Huber MT, Krieg JC, Lautenbacher S. Sleep deprivation affects thermal pain thresholds but not somatosensory thresholds in healthy volunteers. Psychosom Med. 2004;66(6):932–937. | ||
Valrie CR, Bromberg MH, Palermo T, Schanberg LE. A systematic review of sleep in pediatric pain populations. J Dev Behav Pediatr. 2013;34(2):120–128. | ||
Kundermann B, Krieg JC, Schreiber W, Lautenbacher S. The effects of sleep deprivation on pain. Pain Res Manag. 2004;9(1):25–32. | ||
Sampaio RA, Sewo Sampaio PY, Yamada M, Tsuboyama T, Arai H. Self-reported quality of sleep is associated with bodily pain, vitality and cognitive impairment in Japanese older adults. Geriatr Gerontol Int. 2014;14(3):628–635. | ||
Tang NKY, McBeth J, Jordan KP, Blagojevic-Bucknall M, Croft P, Wilkie R. The role of pain, physical disability, and reduced social participation in insomnia onset in community dwelling older adults: a prospective cohort study. Lancet. 2013;382:S95. | ||
Hamilton NA, Pressman M, Lillis T, Atchley R, Karlson C, Stevens N. Evaluating evidence for the role of sleep in fibromyalgia: a test of the Sleep and Pain Diathesis Model. Cognit Ther Res. 2012;36(6):806–814. | ||
Alsaadi SM, McAuley JH, Hush JM, et al. Poor sleep quality is strongly associated with subsequent pain intensity in patients with acute low back pain. Arthritis Rheumatol. 2014;66(5):1388–1394. | ||
Raymond I, Nielsen TA, Lavigne G, Manzini C, Choinière M. Quality of sleep and its daily relationship to pain intensity in hospitalized adult burn patients. Pain. 2001;92(3):381–388. | ||
Bromberg MH, Gil KM, Schanberg LE. Daily sleep quality and mood as predictors of pain in children with juvenile polyarticular arthritis. Health Psychol. 2012;31(2):202–209. | ||
Phan NQ, Blome C, Fritz F, et al. Assessment of pruritus intensity: prospective study on validity and reliability of the visual analogue scale, numerical rating scale and verbal rating scale in 471 patients with chronic pruritus. Acta Derm Venereol. 2012;92(5):502–507. | ||
Patel R, Biros MH, Moore J, Miner JR. Gender differences in patient-described pain, stress, and anxiety among patients undergoing treatment for painful conditions in the emergency department. Acad Emerg Med. 2014;21(12):1478–1484. | ||
Price DD, McGrath PA, Rafii A, Buckingham B. The validation of visual analogue scales as ratio scale measures for chronic and experimental pain. Pain. 1983;17(1):45–56. | ||
Wagner DR, Tatsugawa K, Parker D, Young TA. Reliability and utility of a visual analog scale for the assessment of acute mountain sickness. High Alt Med Biol. 2007;8(1):27–31. | ||
Dimitriadis Z, Strimpakos N, Kapreli E, Oldham J. Validity of visual analog scales for assessing psychological states in patients with chronic neck pain. J Musculoskelet Pain. 2014;22(3):242–246. | ||
Lara-Munoz C, De Leon SP, Feinstein AR, Puente A, Wells CK. Comparison of three rating scales for measuring subjective phenomena in clinical research. I. Use of experimentally controlled auditory stimuli. Arch Med Res. 2004;35(1):43–48. | ||
Appukuttan D, Vinayagavel M, Tadepalli A. Utility and validity of a single-item visual analog scale for measuring dental anxiety in clinical practice. J Oral Sci. 2014;56(2):151–156. | ||
Hamza MA, White PF, Craig WF, et al. Percutaneous electrical nerve stimulation: a novel analgesic therapy for diabetic neuropathic pain. Diabetes Care. 2000;23(3):365–370. | ||
Liedberg GM, Björk M, Börsbo B. Self-reported nonrestorative sleep in fibromyalgia – relationship to impairments of body functions, personal function factors, and quality of life. J Pain Res. 2015;8:499–505. | ||
Xu J, Wang B, Hu M. The development and evaluation of self-rated health measurement scale-prior test version. Chin J Behav Med Sci. 2000;9(1):65–68. Chinese. | ||
Xu J, Xie Y, Li B, Hu M. The study of validity on self-rated health measurement scale-the revised version 1.0. Chin J Clin Rehab. 2002;6(14):2082–2085. Chinese. | ||
Xu J, Tan J, Wang Y, Hu M. Evaluation of the self-rated health measurement scale-the revised version 1.0. Chin Ment Health J. 2003;17:301–305. Chinese. | ||
Fried EI, Nesse RM, Zivin K, Guille C, Sen S. Depression is more than the sum score of its parts: individual DSM symptoms have different risk factors. Psychol Med. 2014;44(10):2067–2076. | ||
Zimmerman M. Symptom severity and guideline-based treatment recommendations for depressed patients: implications of DSM-5’s potential recommendation of the PHQ-9 as the measure of choice for depression severity. Psychother Psychosom. 2012;81(6):329–332. | ||
Chen TM, Huang FY, Chang C, Chung H. Using the PHQ-9 for depression screening and treatment monitoring for Chinese Americans in primary care. Psychiatr Serv. 2006;57(7):976–981. | ||
Wang W, Bian Q, Zhao Y, et al. Reliability and validity of the Chinese version of the Patient Health Questionnaire (PHQ-9) in the general population. Gen Hosp Psychiatry. 2014;36(5):539–544. | ||
Spitzer RL, Kroenke K, Williams JB, Lowe B. A brief measure for assessing generalized anxiety disorder: the GAD-7. Arch Intern Med. 2006;166(10):1092–1097. | ||
Garcia-Campayo J, Zamorano E, Ruiz MA, et al. Cultural adaptation into Spanish of the generalized anxiety disorder-7 (GAD-7) scale as a screening tool. Health Qual Life Outcomes. 2010;8(8):8. | ||
Lowe B, Decker O, Muller S, et al. Validation and standardization of the generalized anxiety disorder screener (GAD-7) in the general population. Med Care. 2008;46(3):266–274. | ||
Beard C, Bjorgvinsson T. Beyond generalized anxiety disorder: psychometric properties of the GAD-7 in a heterogeneous psychiatric sample. J Anxiety Disord. 2014;28(6):547–552. | ||
Luszczynska A, Scholz U, Schwarzer R. The general self-efficacy scale multicultural validationstudies. J Psychol. 2005;139:439–457. | ||
Leung DY, Leung AY. Factor structure and gender invariance of the Chinese General Self-efficacy Scale among soon-to-be-aged adults. J Adv Nurs. 2011;67(6):1383–1392. | ||
Cohen S, Kamarck T, Mermelstein R. A global measure of perceived stress. J Health Soc Behav. 1983;24:385–396. | ||
Chaaya M, Osman H, Naassan G, Mahfoud Z. Validation of the Arabic version of the Cohen perceived stress scale (PSS-10) among pregnant and postpartum women. BMC Psychiatry. 2010;10:111. | ||
Ng SM. Validation of the 10-item chinese perceived stress scale in elderly service workers: One-factor versus two-factor structure. BMC Psychol. 2013;1(1):9. | ||
Hoerl AE, Kennard RW. Ridge regression: biased estimation for non-orthogonal problems. Techometrics. 1970;12(1):55–67. | ||
Hoerl AE, Kennard RW. Ridge regression: application for nonorthogonal problems. Techometrics. 1970;12(1):69–82. | ||
Inman RA, da Silva SMG, Bayoumi RR, Hanel PHP. Cultural value orientations and alcohol consumption in 74 countries: a societal-level analysis. Front Psychol. 2017;8:1963. | ||
Cabral DM, Bracher ES, Depintor JD, Eluf-Neto J. Chronic pain prevalence and associated factors in a segment of the population of São Paulo City. J Pain. 2014;15(11):1081–1091. | ||
Fischer B, Lusted A, Roerecke M, Taylor B, Rehm J. The prevalence of mental health and pain symptoms in general population samples reporting nonmedical use of prescription opioids: a systematic review and meta-analysis. J Pain. 2012;13(11):1029–1044. | ||
Hauser W, Schmutzer G, Hilbert A, Brahler E, Henningsen P. Prevalence of chronic disabling noncancer pain and associated demographic and medical variables: a cross-sectional survey in the general German population. Clin J Pain. 2015;31(10):886–892. | ||
Keefe FJ, Wilkins RH, Cook WA Jr, Crisson JE, Muhlbaier LH. Depression, pain, and pain behavior. J Consult Clin Psychol. 1986;54(5):665–669. | ||
Lerman SF, Rudich Z, Brill S, Shalev H, Shahar G. Longitudinal associations between depression, anxiety, pain, and pain-related disability in chronic pain patients. Psychosom Med. 2015;77(3):333–341. | ||
Porter VR, Buxton WG, Avidan AY. Sleep, cognition and dementia. Curr Psychiatry Rep. 2015;17(12):97. | ||
Afolalu EF, Ramlee F, Tang NKY. Effects of sleep changes on pain-related health outcomes in the general population: a systematic review of longitudinal studies with exploratory meta-analysis. Sleep Med Rev. Epub 2017 Aug 18. | ||
Artner J, Cakir B, Spiekermann JA, et al. Prevalence of sleep deprivation in patients with chronic neck and back pain: a retrospective evaluation of 1016 patients. J Pain Res. 2013;6:1–6. | ||
Purabdollah M, Lakdizaji S, Rahmani A. Relationship between sleep, pain and inflammatory markers in patients with rheumatoid arthritis. J Caring Sci. 2017;6(3):249–255. | ||
Straube S, Heesen M. Pain and sleep. Pain. 2015;156(8):1371–1372. | ||
Li JX. Pain and depression comorbidity: a preclinical perspective. Behav Brain Res. 2015;276:92–98. | ||
Pinheiro MB, Ferreira ML, Refshauge K, et al. Genetics and the environment affect the relationship between depression and low back pain: a co-twin control study of Spanish twins. Pain. 2015;156(3):496–503. | ||
Gatchel RJ, Peng YB, Peters ML, Fuchs PN, Turk DC. The biopsychosocial approach to chronic pain: scientific advances and future directions. Psychol Bull. 2007;133(4):581–624. | ||
Bernfort L, Gerdle B, Rahmqvist M, Husberg M, Levin LA. Severity of chronic pain in an elderly population in Sweden–impact on costs and quality of life. Pain. 2015;156(3):521–527. | ||
Parreira Pdo C, Maher CG, Latimer J, et al. Can patients identify what triggers their back pain? Secondary analysis of a case-crossover study. Pain. 2015;156(10):1913–1919. | ||
Lohman D, Schleifer R, Amon JJ. Access to pain treatment as a human right. BMC Med. 2010;8:8. | ||
Fredrickson BL, Branigan C. Positive emotions broaden the scope of attention and thought-action repertoires. Cogn Emot. 2005;19(3):313–332. |
 © 2018 The Author(s). This work is published and licensed by Dove Medical Press Limited. The full terms of this license are available at https://www.dovepress.com/terms.php and incorporate the Creative Commons Attribution - Non Commercial (unported, v3.0) License.
By accessing the work you hereby accept the Terms. Non-commercial uses of the work are permitted without any further permission from Dove Medical Press Limited, provided the work is properly attributed. For permission for commercial use of this work, please see paragraphs 4.2 and 5 of our Terms.
© 2018 The Author(s). This work is published and licensed by Dove Medical Press Limited. The full terms of this license are available at https://www.dovepress.com/terms.php and incorporate the Creative Commons Attribution - Non Commercial (unported, v3.0) License.
By accessing the work you hereby accept the Terms. Non-commercial uses of the work are permitted without any further permission from Dove Medical Press Limited, provided the work is properly attributed. For permission for commercial use of this work, please see paragraphs 4.2 and 5 of our Terms.