")
Back to Journals » Nature and Science of Sleep » Volume 12
Sleep-disordered breathing and comorbidities: role of the upper airway and craniofacial skeleton
Authors Brennan LC, Kirkham FJ, Gavlak JC
Received 12 October 2018
Accepted for publication 11 April 2019
Published 9 November 2020 Volume 2020:12 Pages 907—936
DOI https://doi.org/10.2147/NSS.S146608
Checked for plagiarism Yes
Review by Single anonymous peer review
Peer reviewer comments 2
Editor who approved publication: Dr Sutapa Mukherjee
Lucy Charlotte Brennan,1 Fenella Jane Kirkham,1– 3 Johanna Cristine Gavlak2
1Developmental Neurosciences Section, UCL Great Ormond Street Institute of Child Health, London, UK; 2Department of Child Health, University Hospital Southampton NHS Foundation Trust, Southampton, UK; 3Clinical and Experimental Sciences, University of Southampton, Southampton, UK
Correspondence: Fenella Jane Kirkham
Developmental Neurosciences Section, UCL Institute of Child Health, 30 Guilford Street, London WC1N 1EH, UK
Tel +44 207 905 4114
Email [email protected]
Abstract: Obstructive sleep-disordered breathing (SDB), which includes primary snoring through to obstructive sleep apnea syndrome (OSAS), may cause compromise of respiratory gas exchange during sleep, related to transient upper airway narrowing disrupting ventilation, and causing oxyhemoglobin desaturation and poor sleep quality. SDB is common in chronic disorders and has significant implications for health. With prevalence rates globally increasing, this condition is causing a substantial burden on health care costs. Certain populations, including people with sickle cell disease (SCD), exhibit a greater prevalence of OSAS. A review of the literature provides the available normal polysomnography and oximetry data for reference and documents the structural upper airway differences between those with and without OSAS, as well as between ethnicities and disease states. There may be differences in craniofacial development due to atypical growth trajectories or extramedullary hematopoiesis in anemias such as SCD. Studies involving MRI of the upper airway illustrated that OSAS populations tend to have a greater amount of lymphoid tissue, smaller airways, and smaller lower facial skeletons from measurements of the mandible and linear mental spine to clivus. Understanding the potential relationship between these anatomical landmarks and OSAS could help to stratify treatments, guiding choice towards those which most effectively resolve the obstruction. OSAS is relatively common in SCD populations, with hypoxia as a key manifestation, and sequelae including increased risk of stroke. Combatting any structural defects with appropriate interventions could reduce hypoxic exposure and consequently reduce the risk of comorbidities in those with SDB, warranting early treatment interventions.
Keywords: obstructive sleep apnea, sickle cell, polysomnography, desaturation, MRI, airway, adenoids
Introduction
This review aims to explore the relationship between sleep-disordered breathing (SDB) and health in the general population, and to focus on anemias, including sickle cell disease (SCD). We address three key areas. Firstly, we review reports including polysomnography (PSG) and limited channel sleep studies undertaken in the general population of adults and normally developing children. We subsequently compare these sleep studies against those in children and young adults with anemia, specifically SCD. Secondly, we review MRI head and neck studies to compare structural anatomical variations in the upper airway in populations exhibiting a high prevalence of SDB. We identify and summarise potential targets for treatment for SDB in patients with anemia such as SCD. Finally, we discuss the implications of SDB for patients with SCD to understand the importance of managing this population.
Normal respiratory physiology in sleep
In typically developing children, as well as in adults, small changes in arterial oxygen saturations (SaO2; ≤2% decrease), typically measured by pulse oximetry (SpO2), and partial pressure of carbon dioxide (pCO2; 4–6 mmHg increase), from end-tidal capnography, are common during sleep. This is related to the reduced metabolic demands of sleep, resulting in lower respiratory and pulse rates, and changes in breathing patterns and muscle tone,1 which differ between wakefulness and sleep, and during the different stages of sleep. To limit physical activity in response to the vivid dreams of rapid eye movement sleep, inhibition of tonic muscle tone in respiratory intercostal muscles occurs in this stage of sleep, reducing lung capacity to its lowest levels and making the upper airway more susceptible to resistance and collapse. This is usually not a problem in children with adequate upper airway space and normal sleep. However, even in typically developing children, average oxygen saturations are lower during sleep than when awake.
Clinical algorithms have relatively low sensitivity and specificity for diagnosing SDB.2 PSG is the gold standard for monitoring sleep, and includes measurements of electroencephalography (EEG), electrooculography (EOG), and electromyography (EMG), to determine sleep stages and limb movements. Respiration in sleep is also assessed, with measurements of electrocardiography (ECG), oronasal airflow, thoracic and abdominal respiratory effort, pulse oximetry, and snoring. End-tidal pCO2 from capnography and video recordings are also often made. Many centers now use cardiorespiratory or limited polygraphy studies as screening or diagnostic tools, as PSGs are expensive. The limited polygraphy studies exclude EEG, EOG, and EMG, so cannot specifically define sleep stage or sleep quality, but give a reasonable estimation of SDB severity and response to treatment.3 Oxygen saturation studies (pulse oximetry), sometimes recorded with a measure of pCO2 (oxicapnography), cannot be used to diagnose SDB, but are used for screening and risk assessment in some circumstances.4,5
The limited population-based normative data, lack of consensus regarding respiratory event scoring parameters between full PSG and limited channel studies, and changes in standards over time6,7,8 have been significant barriers to description of respiration in normal sleep in infants,9,10 children11,12 and adults.13,14 However, the American Academy of Sleep Medicine (AASM) now have consensus definitions for scoring polysomnographic studies,6–8 and overnight oximetry, particularly for mean or median across the whole night. These can be compared across studies using oximeters that reduce motion artifact, although summary statistics may not fully describe hypoxic exposure and thus graphical solutions are under development.15 We will present here literature using pre-AASM and post-AASM scoring.
There are few daytime or overnight oxygen saturation data from the general population living at sea level. In a population-based study of adults in Tromsø, Norway, 6.3% of 6317 adults aged 38–87 years had a daytime saturation of ≤95%16 and mortality over the subsequent 10 years was higher in this group than in those with SpO2>96%.17 In 350 normal adults, minimum overnight saturation was 90.4±3.1% with a median of 96.5%±1.5%.18 Overnight saturation does appear to decrease with age (Table 1).
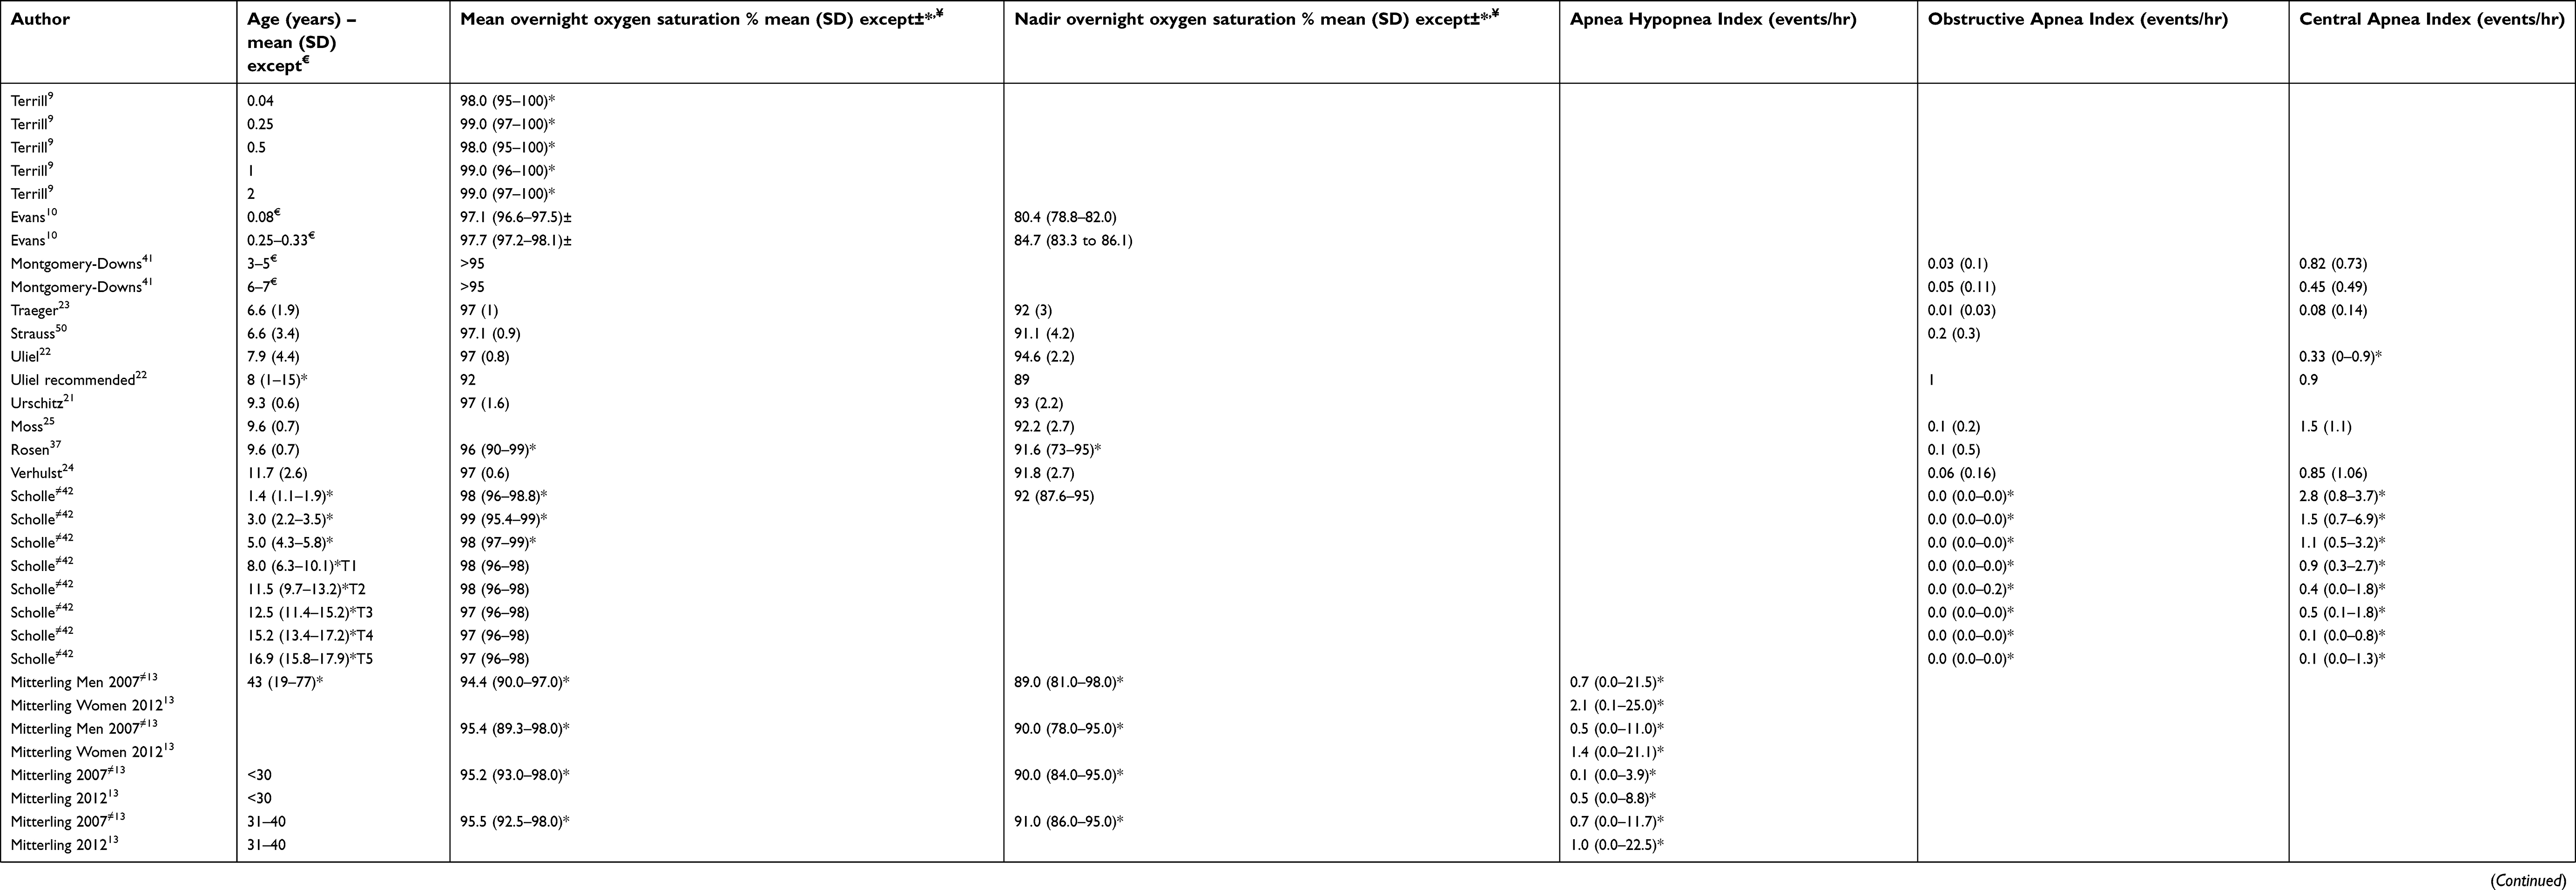 |
Table 1 Normal data for mean and minimum overnight oxygen saturation and polysomnography variables in infants, children, and adults |
In children, average daytime oxygen saturations ≥95% are considered normal,19 and values below this seen acutely are associated with signs suggesting illness.20 Overnight medians or means are typically ≥97% in infants9,10 and children,21–24 rarely dipping to less than 90% in sleep in typically developing children,21–25 although lower minimum values are seen in normal infants.10 Nocturnal oxygen desaturation (NOD) is not the norm in infants, children, or adults under the age of 60 years (Table 1).
Sleep-disordered breathing
Defining normal respiratory patterns in sleep paves the way for the definition of abnormal respiratory patterns in sleep. PSG features of pediatric OSAS differ from adults. Children may have obstructive hypoventilation (persistent partial upper airway closure, sometimes with paradoxical breathing or increased work of breathing, with elevated pCO2) rather than frank obstructive apneas or hypopneas.26, In addition, they are less likely to arouse from apnea, hypopnea, or oxygen desaturation. In both adults and children, severity of OSAS is classified according to the number of obstructive apneas and hypopneas recorded per hour of sleep and reported as an Apnea/Hypopnea Index (AHI) or Obstructive Apnea/Hypopnea Index (OAHI).
Obstructive SDB/OSAS is a condition caused by narrowing or obstruction of the upper airways that disrupts ventilation, causing oxyhemoglobin desaturation and often reduced sleep quality. There is a spectrum of obstructive SDB,27 ranging from primary snoring through upper airways resistance syndrome, to the more severe obstructive sleep apnea syndrome (OSAS).28 Identifying obstructive SDB is important as there are significant impacts on health related to the condition, and thus a significant global burden on health care services. In adults, OSAS correlates with increased incidence of cardiovascular and autonomic dysfunction, cerebrovascular complications, metabolic derangements, insulin resistance, malignancy, and overall reduced quality of life,29 while the effect on cognition and behavior30 is of concern in children.
The prevalence of SDB in the general adult population ranges between 9% and 38% and may be as high as 49%.29,31–35 Risk factors for development of the condition include obesity, male gender, increasing age, menopause, genetics, ethnicity, craniofacial abnormalities, as well as lifestyle factors such as alcohol consumption and smoking.31,32 OSAS is a worldwide condition with remarkably similar prevalence profiles across continents, including North America, Europe, Australia, and Asia.31 There seem to be distinct associations, however, between geographical regions related to the condition – population demographics may play a role.
SDB is less common in typically developing children than in adults, with prevalence of obstructive SDB in the general pediatric population ranging from 1% to 5%11,36–40 and depending in part on the diagnostic method and threshold, both of which continue to be debated.
Archetypally most studies, regardless of methodology and populations studied, have found that central apneas (pauses in breathing, typically not related to airway obstruction) are more common than obstructive apneas and hypopneas in children, with indices (number of events/hours of sleep) of close to 1/hr and <0.5/hr, respectively. This is highlighted in Table 1, which shows the normal ranges for PSG variables in children from a selection of studies using pre-AASM scoring.23,25,37,41 AHIs >1 are probably abnormal, as are pCO2 values of >50mmHg.
In addition to the tabulated pre-AASM studies, the Scholle studies42–44 were particularly pertinent in attempting to clearly describe sleep using AASM criteria in typically developing children according to Tanner developmental stages across different age groups. In this prospective study of PSG in 209 healthy German children of White ethnicity, aged 1–18 years, obstructive apneas and hypopneas were very rare, with mean OAHI of 0.0 across all age groups. Central apneas were more common but decreased with increasing age.
Obesity is the primary risk factor associated with OSAS in adults and is an increasing component factor in children. Upper body obesity may directly augment narrowing of the upper airway45 Studies have shown that the dimensions of neck and waist circumference predict OSAS severity in adults.46
The most common cause of OSAS in children is considered to be narrowing of the upper airway due to adenotonsillar hypertrophy,11 with more recent data indicating that it may also be related to airway size and structure.47–51 During childhood growth and development, the upper airway is a site for progressive alteration, including changes in growth of tissues52–54 as well as functional adaptations in neuromuscular tone and ventilatory drive.55–58 Within this time, augmented growth of the adenoids or tonsils could predispose children to upper airway obstruction, principally during sleep.53,54 It has been proposed in studies that assessed the mechanical properties of the upper airway, including ventilatory responses to resistive loading, that the upper airway of children is more resistant to collapse compared to adults.58–60 Conversely, the dysfunctional soft palate, due to relative hypotonia, in young children without concomitant disorders could also be considered as a cause of obstructive sleep apnea, mostly resolving spontaneously with increasing age. There could be additional contributing factors to developing OSAS and therefore anatomical dimensions of tissues may play a more significant role in maintaining airway patency, particularly during different stages of growth and development.
Regardless of the variability of the diagnostic criteria for obstructive SDB, the prevalence is elevated in certain pediatric populations. This includes children with anemia, such as SCD, in which previously reported prevalence rates range from 5% to 79%.61–63
There is arguably a three-pronged approach to understanding the pathophysiological factors involved in OSAS by addressing: i) anatomical factors, ii) upper airway collapsibility, and iii) obesity.64 There have been challenges in exploring these factors and thus identifying the genetic and environmental risk factors associated with SDB in these populations, due to relatively few studies that include contemporaneous controls assessed against the gold standard polysomnography.
Effect of ethnicity on SDB
There are few data comparing the prevalence of SDB between ethnic groups, with lack of data in important populations, including people of African origin, who are typically reported in manuscripts as Black. Several of the studies enrolled a relatively high proportion of people of African origin23,36,37 but not all reported any differences in SDB prevalence across ethnicities. Traeger23 included 48% Black children, Montgomery-Downs41 included 23.1% and 38.3% Black children in respective age brackets, Rosen37 included 41% Black children, and Bixler39 included 13.8% Black children. However, Verhulst24 included 95% White children while the studies of Uliel22 and Moss25 involved only White children.
There are potentially important differences in prevalence of SDB in populations of various ethnicities.36,37 Rosen reported an increased prevalence of SDB in Black children in her prospective, cross-sectional, population-based study.37 Eight hundred and fifty children aged 8–11 years of age, 41% Black and 46% pre-term (<36 weeks gestation), were enrolled, with equal numbers of White and Black pre-term children. Home cardiorespiratory polygraphy studies and Child Sleep Questionnaires were collected. Defined as an OAHI ≥5 or an OAI ≥1, Black children were four to six times more likely to have OSAS (8.7%) than White children (2.2%). Regardless of race, OSAS was three to five times more likely in pre-term (7.4%) than full-term (2.4%) children. Black children were more likely to snore and tended to have higher body mass index. There are relatively few data in populations from the Indian subcontinent or China, in whom craniaofacial anatomy may play a more important role than obesity.65
“Normal” sleep is different in children of different ethnicities,37 as well as for different ages,23,66 and socio-economic circumstances. However, due to lack of awareness or other limitations, many published studies have not taken into account these factors, making the classification of “normal sleep” in children problematic. When interpreting literature findings for a specific demographic, we must take into account all confounding factors present within that population – including confounders that the authors may not have addressed. This requires particular attention if comparing ethnicities exposed to different environments, eg, Africans living in Africa vs people of African origin living in a Western country. This highlights a significant limitation in our assessment of this topic but highlights the need for further, well-designed studies that take into consideration confounding factors and the reflection of a “true” demographic.
Genetic factors, including underlying conditions, may be responsible in part for the association between ethnicity and increased prevalence of obstructive SDB. For instance, the underlying mechanisms for adenotonsillar hypertrophy and differences in airway size and structure might be different for particular populations and ethnicities that exhibit a higher prevalence of OSAS. Alterations in the dimensions and shape of the airway may occur in people with anemia secondary to hemoglobinopathies61 eg, SCD,50 and other anemias, including thalassemia,63 as well as Down syndrome67 and disorders of bone, such as achondroplasia and osteogenesis imperfecta, or of soft tissue, such as mucopolysaccharidoses.68
In order to explore this, we present an overview of some of these conditions, particularly illustrated by an array of anemia-related disorders and their association with obstructive SDB, before focusing upon SCD and the implications involved with this condition.
Populations with higher prevalence of OSAS
Down syndrome
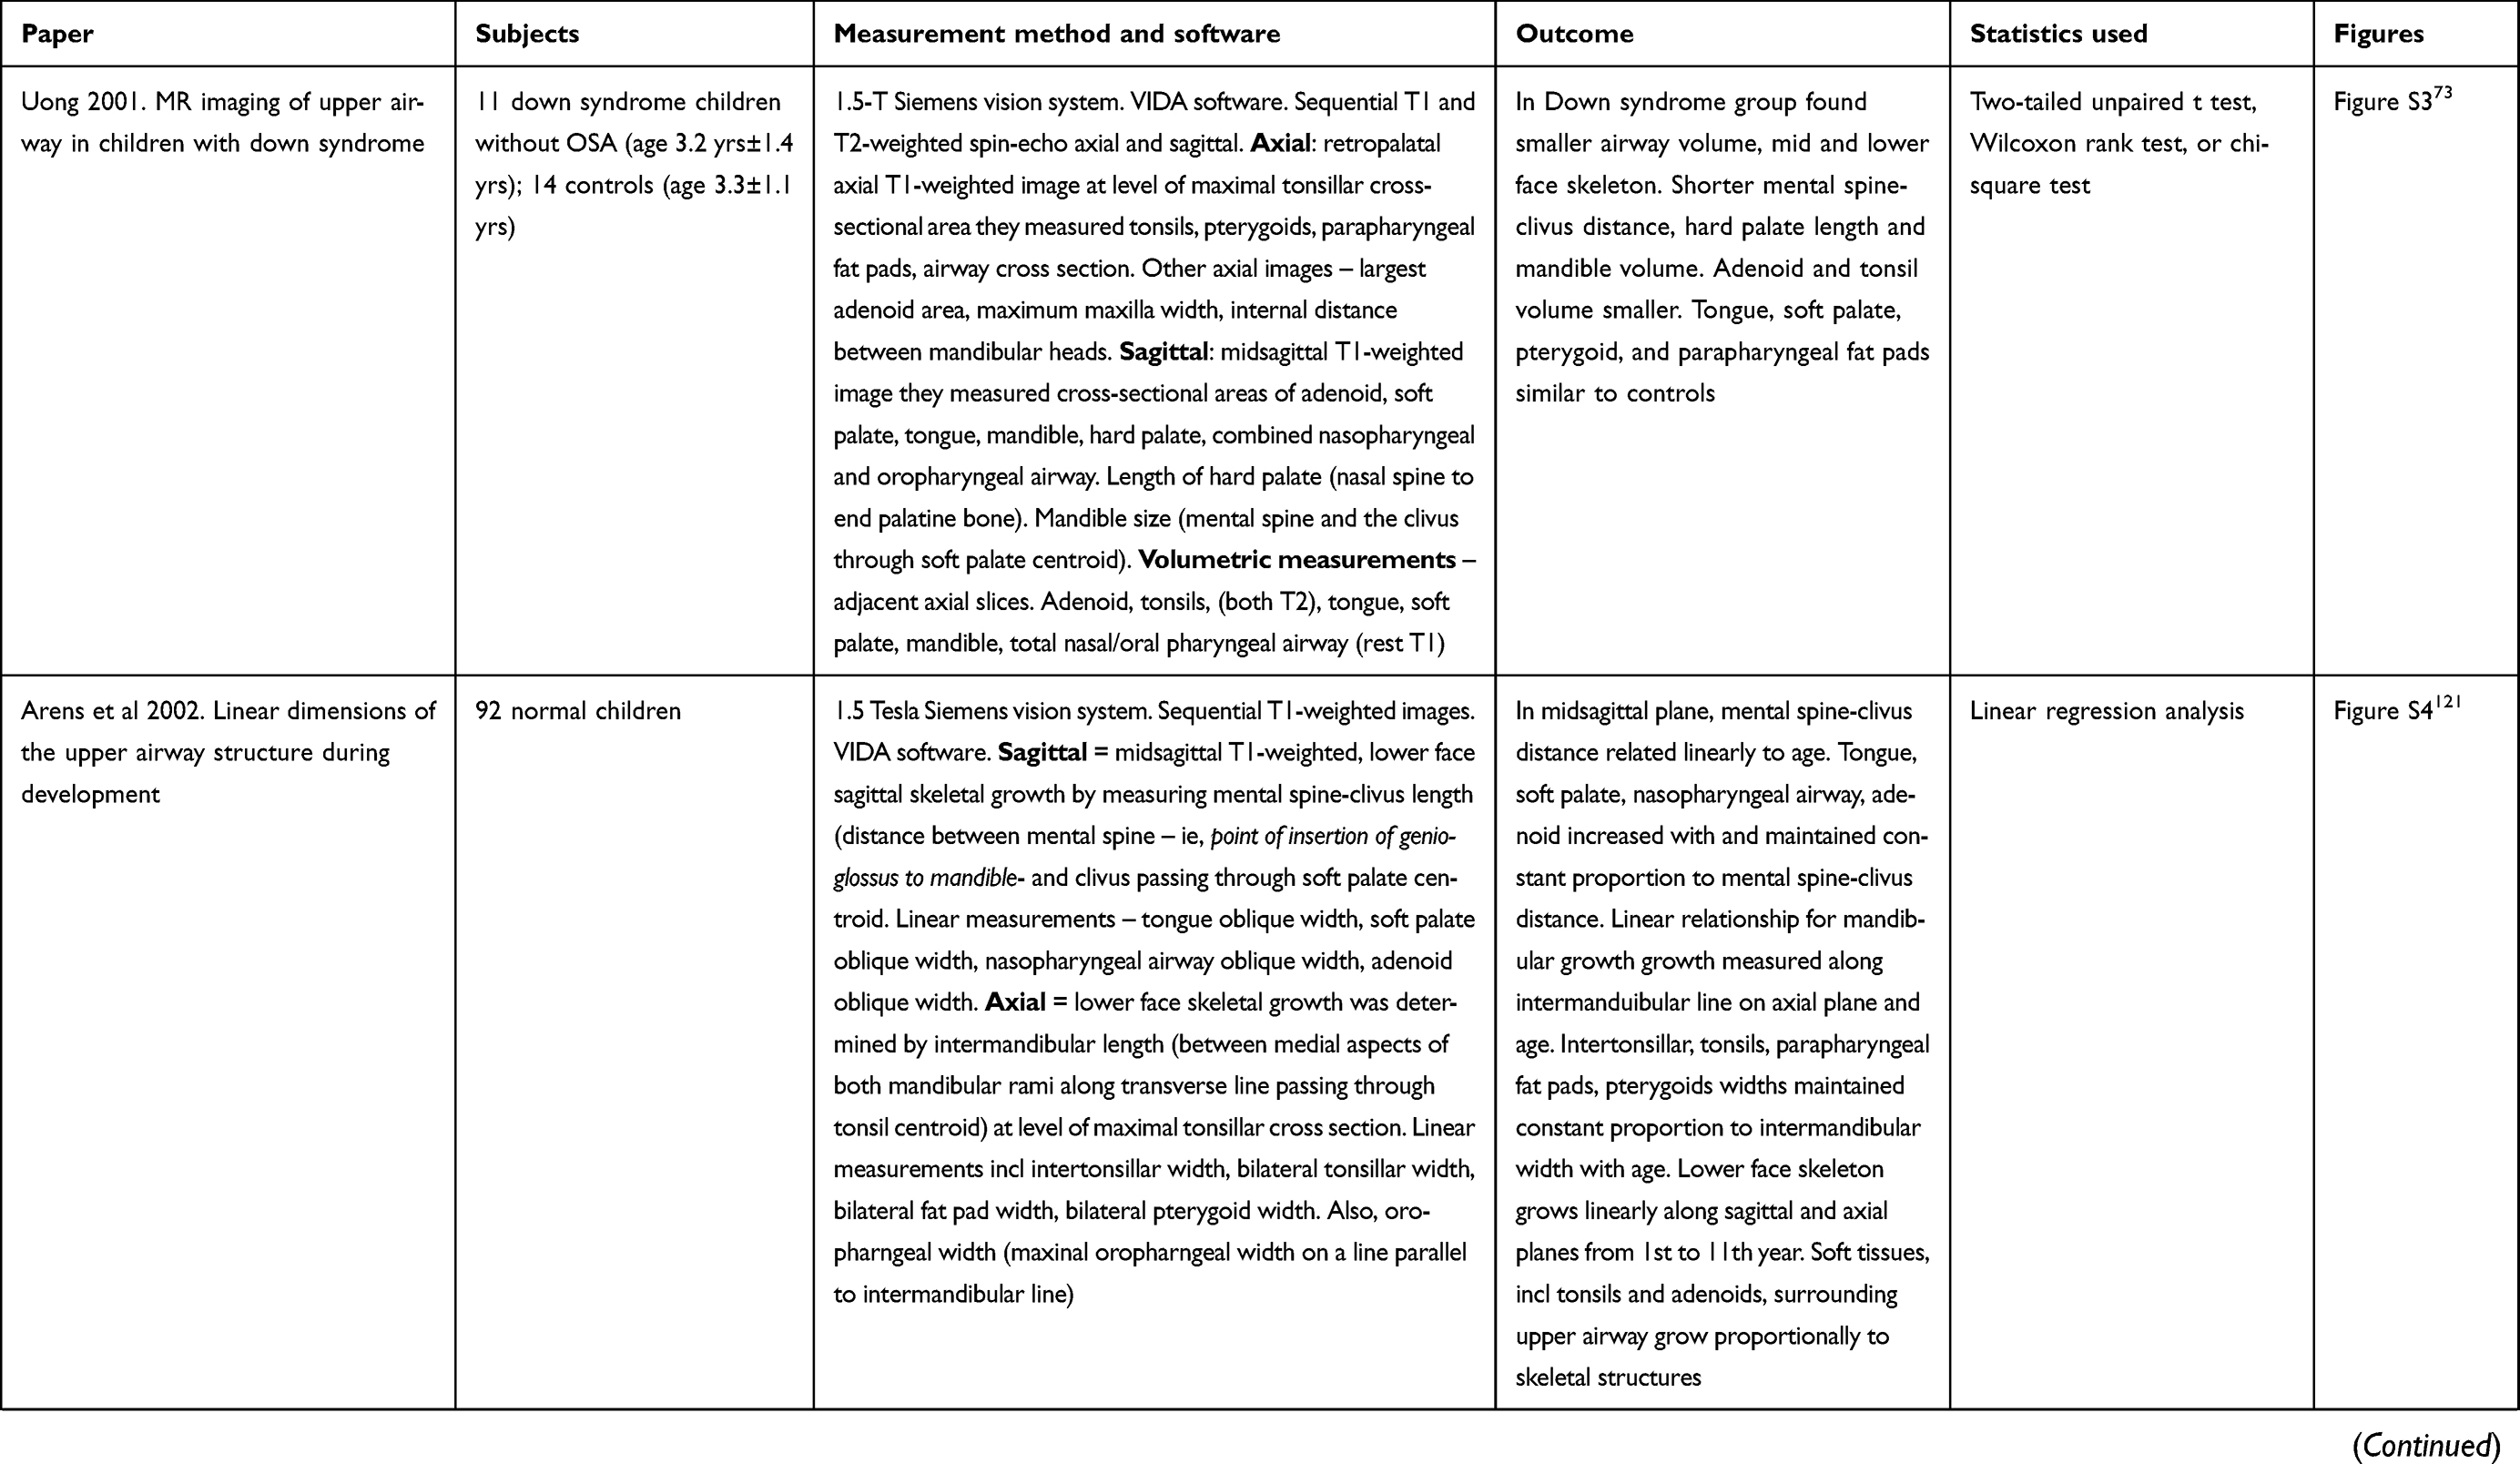
Children with Down syndrome have a high incidence of OSAS,69,70 considered to be related to a combination of adenotonsillar hypertrophy and reduction in the size of the airway in relation to midface hypoplasia and a small jaw. There is some evidence for an effect of OSAS on memory consolidation71 and attention72 in this population. Uong studied a Down syndrome population without OSAS to assess this population for predisposition to OSAS.73 They found a smaller mid and lower face skeleton – ie, smaller mental spine to clivus length, hard palate length, and mandible volume in the Down syndrome group. They also found a smaller airway volume in Down syndrome compared to healthy children.73 Adenoid and tonsil volumes were smaller in the Down syndrome group, whereas the tongue, soft palate, pterygoid, and parapharyngeal fat pads were of a similar size to healthy children. Hence, the size of the upper airway is proportionate to soft tissue crowding due to these smaller craniofacial dimensions.
Conditions with abnormal bone or connective tissue
Other conditions involving abnormal development of bone or connective tissue from an early age, including achondroplasia, Pierre–Robin syndrome, and Prader–Willi syndrome, may be associated with a small airway related to differences in growth of the mandible and maxilla. In addition to the effect of large tonsils and adenoids, these anatomical differences may play a role in the development of central SDB,68,74 but the pathophysiology may be complex.75,76 Central apneas may be related to pressure on the brainstem and cervical spinal cord related to foramen magnum stenosis. However, there are relatively few large series comparing the anatomy of the upper airway in these patients to matched controls.
Anemias
Iron deficiency, chronic renal failure, and other chronic diseases, such as β-thalassaemia and SCD, are common causes of anemia. Defects of red cell stability, deformability, and metabolism cause a wide range of anemia for which the genetic basis is understood. β-thalassemia and SCD affect 400,000 newborns each year, with several million affected worldwide. Hereditary spherocytosis and pyruvate kinase deficiency are less common, but for all anemias, a wide variety of comorbidities are well recognized and are considered to occur via a variety of mechanisms. The possibility that OSAS and/or NOD play a role has received only modest consideration. The association between anemia and SBD, however, is not well understood.
The normal adult hemoglobin (HbA) consists of two α and two β globin chains combined with a heme molecule. Modifications of the normal structure of hemoglobin can occur through point mutations in the globin gene.77 Heme production requires adequate iron stores. Anemia is defined as a hemoglobin concentration below 10–13 g/dL, dependent on gender, age, race,78 and with a higher threshold at altitude.79 It affects 1.6 billion people worldwide80 and is frequently associated with poor health. Red cell disorders are therefore a significant burden to health services, with complications impacting quality-of-life and employment opportunities. Low hemoglobin, red cell destruction, and disturbed iron homeostasis lead to alterations in tissue oxygenation and chronic damage to the kidneys, brain, lungs, and heart. However, despite the overlap in the range of complications,61,81 the possibility that comorbid SDB might play a role in complications of anemia has received relatively little attention.
Iron deficiency anemia
There are very few reports including sleep studies in iron-deficient patients in any age group, although there is a probable association with periodic leg movements.82 In adults with newly diagnosed OSAS, iron levels were lower and hepcidin levels were higher compared with controls.83 Treatment of anemia with erythropoietin and/or iron was associated with improvement in SDB in adults with chronic heart failure.84
Thalassemia
Homozygous α-thalassemia is typically lethal. In β-thalassemia, erythropoiesis is limited because of a genetically determined (due to many autosomal recessive genes) inability of the bone marrow to synthesize beta globin chains. The condition is common in the Mediterranean. OSAS has been described in a child with β-thalassemia intermedia.85 Extramedullary hematopoiesis appeared to have obstructed the nasopharynx on the CT scan. Treatment with hydroxyurea and blood transfusion was associated with relief of symptoms after six weeks.85 In a study of 10 Israeli patients with β-thalassemia major (n=6) or intermedia (n=4), arousals were common and were induced by periodic limb movements. There was no evidence for OSAS. Multiple sleep latency tests demonstrated that there was objective daytime sleepiness.86 In another study of 120 children with severe β-thalassemia, 19 (15.8%) snored habitually, of whom 16 had PSG. Ten had OSAS on PSG, which was moderate to severe in six. All 10 had adenoidal hypertrophy and eight had tonsillar enlargement. Those with OSAS had higher serum ferritin compared to those without OSAS. Reactive lymphoid hyperplasia was seen in all six patients who had adenotonsillectomy.63 Thalassemia patients have typical craniofacial characteristics with a relatively wide maxilla and nose. In one study, three features, including two involving the position of the hyoid bone, as well as tongue length, were shorter in patients with β-thalassemia.87 The middle airway space was also significantly wider and there was a trend for a wider inferior airway space in these patients.
Congenital dyserythropoietic anemia
Congenital dyserythropoietic anemias are rare autosomal recessive disorders of erythropoiesis typically requiring frequent transfusion. Type 1 is common in Bedouin Arabs living in the Negev desert in Israel. One study looking at 10 of these children and adolescents from one extended Bedouin family found that arousals were common in this condition, mainly related to periodic limb movements, but there was little evidence for OSAS.86 A PubMed search found no papers on OSAS in other rare hereditary anemia, namely Fanconi anemia, Diamond-Blackfan syndrome, hereditary spherocytosis, or pyruvate kinase deficiency.
Sickle cell disease
SCD is a multi-organ disease with multifaceted pathophysiological mechanisms – the simplicity of the genetic mutation that causes SCD belies the complexity of the disease’s pathophysiology.88 The sickle cell trait, which originated in West and Central Africa centuries ago, appears to have arisen as an evolutionary adaptation of natural selection on genetic resistance to malaria.89 From Africa, the gene spread along the Mediterranean, through Persia and India, and across the Atlantic. More recently, with migration, it has spread to Europe.90 SCD is now the most common genetic condition at birth in England, affecting 1 in every 2000 live births.91 Pre-conception counseling and invasive prenatal diagnosis are available but not all couples want these options for a condition with a wide spectrum of outcomes. With increased migration rates and successive generations of people living with SCD, there will be an increasing prevalence of SCD in many countries. Considering the morbidity and mortality associated with SCD, a greater understanding of the complications of the disease and the development of new interventions and therapies is paramount in order to treat this population adequately.
SCD is caused by a genetic mutation of a single base pair change, adenine to thymine, in the 6th codon of the β chain, which results in the alteration of one amino acid (glutamine acid to valine) in position 6 of the β chain of hemoglobin, producing hemoglobin S (HbS; sickle hemoglobin).92 SCD is an autosomal recessive genetic condition. “Sickle cell anemia” is the term used when both β globin chains exhibit the abnormal HbS (ie, homozygous for sickle hemoglobin (HbSS)). These patients tend to have a worse prognosis and are often symptomatic. The expression “sickle cell disease” includes any genotype where one abnormal HbS β globin chain is inherited with a different abnormal β globin chain that commonly interacts with it. There are many identified hemoglobin variants, but the most common are HbC or Hb β-thalassemia (β+ or β0), HbO Arab, HbD Punjab, and HbS Antilles. An abnormal HbS beta globin chain plus a normal HbA beta globin chain constitutes “sickle cell trait” (HbAS). Heterozygotes, ie, those with sickle cell trait, typically do not exhibit symptoms and may not be aware they carry the gene. Hbβ0-thalassaemia may be as severe as HbSS, whereas HbSC and Hbβ+ thalassemia tend to be milder. With increasing global migration, there is an increase in combination traits, such as HbβSth, HbE/αth, for which the full range of phenotypic traits is yet to be determined.
When sickle red blood cells (RBCs) become deoxygenated, the HbS becomes insoluble and produces polymers that aggregate into tubular fibers. These enlarge and deform the RBCs, giving the RBC the characteristic sickle shape. Upon restoration of normal oxygen tension, the cells do not necessarily return to normal shape and are left with reduced solubility and elasticity. In addition, RBCs in SCD are typically stiffer compared with normal RBCs. In SCD, RBCs may become dehydrated, which increases the propensity of HbS to polymerize when deoxygenated.
There are three broad ways that HbS contributes to the pathophysiology of the disease. Firstly, the deformed shape and rigidity can lead to vascular obstruction and consequently ischemia. Secondly, the membrane damaged RBCs lead to increased adherence to, and damage of, the vascular endothelium and thus promote a proliferation of white blood cells, cytokines, growth factors, and coagulation proteins, which together increase vascular obstruction. Thirdly, membrane damage causes hemolysis – RBC breakdown. In a healthy person, an RBC survives 90–120 days in the circulation. However, due to the abnormal structure, sickle red blood cells only survive 10–20 days until they are sequestered by the spleen, thus resulting in hemolysis.
The cardinal features of SCD are chronic hemolytic anemia and complications related to recurrent vaso-occlusion. One of the strongest precipitants of vaso-occulsion (or polymerization of sickle hemoglobin) is oxygen desaturation, which has been associated with increased risk of a number of complications,61 including central nervous system events.93,94 Oxygen desaturation in SCD is in part due to the presence of dyshaemoglobins such as carboxyhemoglobin and methemoglobin, which are increased during intravascular hemolysis but fail to transport oxygen. SDB/OSAS is often comorbid with SCD, potentially exposing patients to additional hypoxia. Many adults and children with SCD experience at least some degree of nocturnal oxyhaemoglobin desaturation, which could be as a consequence of OSAS; other potential causes include pulmonary disease, shunting at cardiac or pulmonary level95 or the decreased oxygen affinity for hemoglobin S.96 There is a good case for diagnosing obstructive SDB and NOD in SCD as evidence is accumulating that upper airway obstruction and the degree of oxygen desaturation affects cognitive function97,98 as well as the rate of complications,61,99 including stroke.93,100,101
Pathophysiology of sleep-disordered breathing in sickle cell anemia
Our knowledge of the pathophysiology of SDB and NOD in the SCD population is limited. Hypotheses, which are not mutually exclusive, include the following:
- hypoventilation due to chronic lung disease,102
- presence of OSAS,62
- left ventricular diastolic dysfunction,103
- pulmonary hypertension104
- shunting at cardiac or pulmonary level,95
- presence of dyshemoglobins105
The most common cause of OSAS in children with SCD is adenotonsillar hypertrophy,50,106,107 the same primary cause identified for the general pediatric population. However, the underlying mechanisms for adenotonsillar hypertrophy and differences in airway size and structure might be different for SCD with OSAS compared with non-SCD children with OSAS, hence the higher prevalence in this specific pediatric SCD population. For instance, in SCD, adenoid and tonsillar hypertrophy might be as a consequence of a compensatory mechanism for functional asplenia,108,109 or as a consequence of upper respiratory infections due to limited opsonization of bacterial pathogens.108,109 Differences in craniofacial development due to atypical growth trajectories or extramedullary hematopoiesis should be considered. This includes variants of maxillary structure in the vertical, horizontal, and transverse planes; poor lip seal; and imbalance in the function of the orofacial muscles, particularly the mandibular elevator and depressor muscles, which may lead to upper airway obstruction and mouth breathing.
There are two crucial questions related to OSAS in children with SCD that are yet to be resolved:
- What factors differ between children with SCD with and without OSAS, after matching for adenotonsillar size?
- When similar groups of children undergo adenotonsillectomy, why is the outcome better in some children than others?
Literature exploring OSAS in adults with SCD is markedly limited in comparison to OSAS in children with SCD.110–112 Sharma110 and Whitesell111 conducted small studies evaluating SDB in adults with SCD suggesting prevalences of 44% and 50%. Due to improvements in genetic screening and clinical management, the trend in life expectancy for SCD is increasing. Our knowledge of SDB in an adult SCD population, therefore, needs to be broadened to appropriately treat this novel population; extrapolating data from childhood studies is inadequate.
There may be other contributory factors within the upper airway to SDB in the SCD population that could be targeted for potential therapy. For example, central sleep apnea (CSA), or central sleep apnea syndrome (CSAS), distinct from obstructive SDB, is a sleep-related disorder which is also associated with a reduction in blood oxygen saturation. In CSA, the effort to breathe is diminished or absent, typically for 10–30 s either intermittently or in cycles. There are very few data on CSA or CSAS in SCD and the possibility that coincidental Chiari malformation plays a role has received little attention.113,114 Further discussion of this is beyond the scope of this review but warrants further research.
Regarding sleep studies in children with SCD, Strauss et al reported a novel study on the prevalence of SDB in Black children with and without SCD, measuring PSG outcomes in 36 subjects with SCD (aged 6.9±4.3 years) and 36 presumably Black control subjects (aged 6.6±3.4 years).50 It was part of a more comprehensive investigation on the prevalence, contributory mechanisms, and pulmonary and vascular consequences of oxygen desaturation in children with SCD at the Children’s Hospital of Philadelphia (CHOP). Strauss et al identified a greater prevalence of OSAS in SCD (7/36; 19.4%) compared to healthy children (0/2; 0%), with increased arousals (13.7±4.7 events/hr vs 10.8±3.8 events/hr, P<0.05), lower arterial oxygen saturation nadir (84.3%±12.3% vs 91.2%±4.2%, p<0.05), and increased peak end-tidal CO2 (53.4±8.5 mm Hg vs 42.3±5.3 mm Hg, P<0.001) in the SCD group.50 In contrast to the data from Rosen’s population-based study37 but in line with the previous data from CHOP,23 none of these, presumably Black, control children had OSAS.
The Sleep Asthma cohort (SAC)62,103 is an ongoing longitudinal study of children with SCD aged 4–18 years, resident in the United States of America or the United Kingdom, who have undergone PSG regardless of symptoms related to sleep. A cross-sectional analysis of baseline data was collected as part of the SAC study from eligible patients aged 4–18 years who were HbSS or compound heterozygotes for HbSβ0-thalassaemia zero (HbSβ0). The study was designed to evaluate the contribution of sleep abnormalities and asthma to SCD-related morbidity. Of 243 children (median age 10 years, 50% male, 99% Black, 95% HbSS), OSAS defined by obstructive AHI at cut points of ≥1 or ≥5, was present in 100 (41%) or 25 (10%) children, respectively. In multivariable analyses, habitual snoring and lower daytime oxygen saturation were risk factors for OSAS.
OSAS therefore appears to be four to six times more common in Black children than White children37 and is particularly prevalent in those with SCD. Based on data available, in addition to adenotonsillar hypertrophy, differences in facial features and upper airway anatomical structure50,115,116 probably play a role in the prevalence of OSAS.
Anatomy of the airway
Anatomical dimensions were compared between ethnic groups in a study that found increased tongue area and soft palate length in adult African-Americans.117 OSAS may be more closely related to these soft tissue dimensions in Black adults,118 who have generalized leptoprosopic facial shape (longer facial height with less depth) while White adults with OSAS tend to have brachycephaly (shorter, wider skull and pharynx dimensions). Investigating anatomical variation of the upper airway and related structures is therefore a fundamental area of OSAS research in all populations.
We will now review studies that have explored structural components of the upper airway using imaging, primarily MRI, as well as other clinical methods. Again, we need to be mindful when interpreting these studies as the literature on SDB in SCD rarely includes matched control children of African origin without SCD. Additionally, the majority of PSG studies of children with SCD have selected patients with symptoms.61,96,109,119 Socioeconomic and environmental factors should also be taken into account,37 including air pollution,120 smoking, and poor nutrition, as well as the genetic influences which apply to all populations.
Anatomical variations of the upper airway and associated structures
Imaging the upper airway in normal growth and development
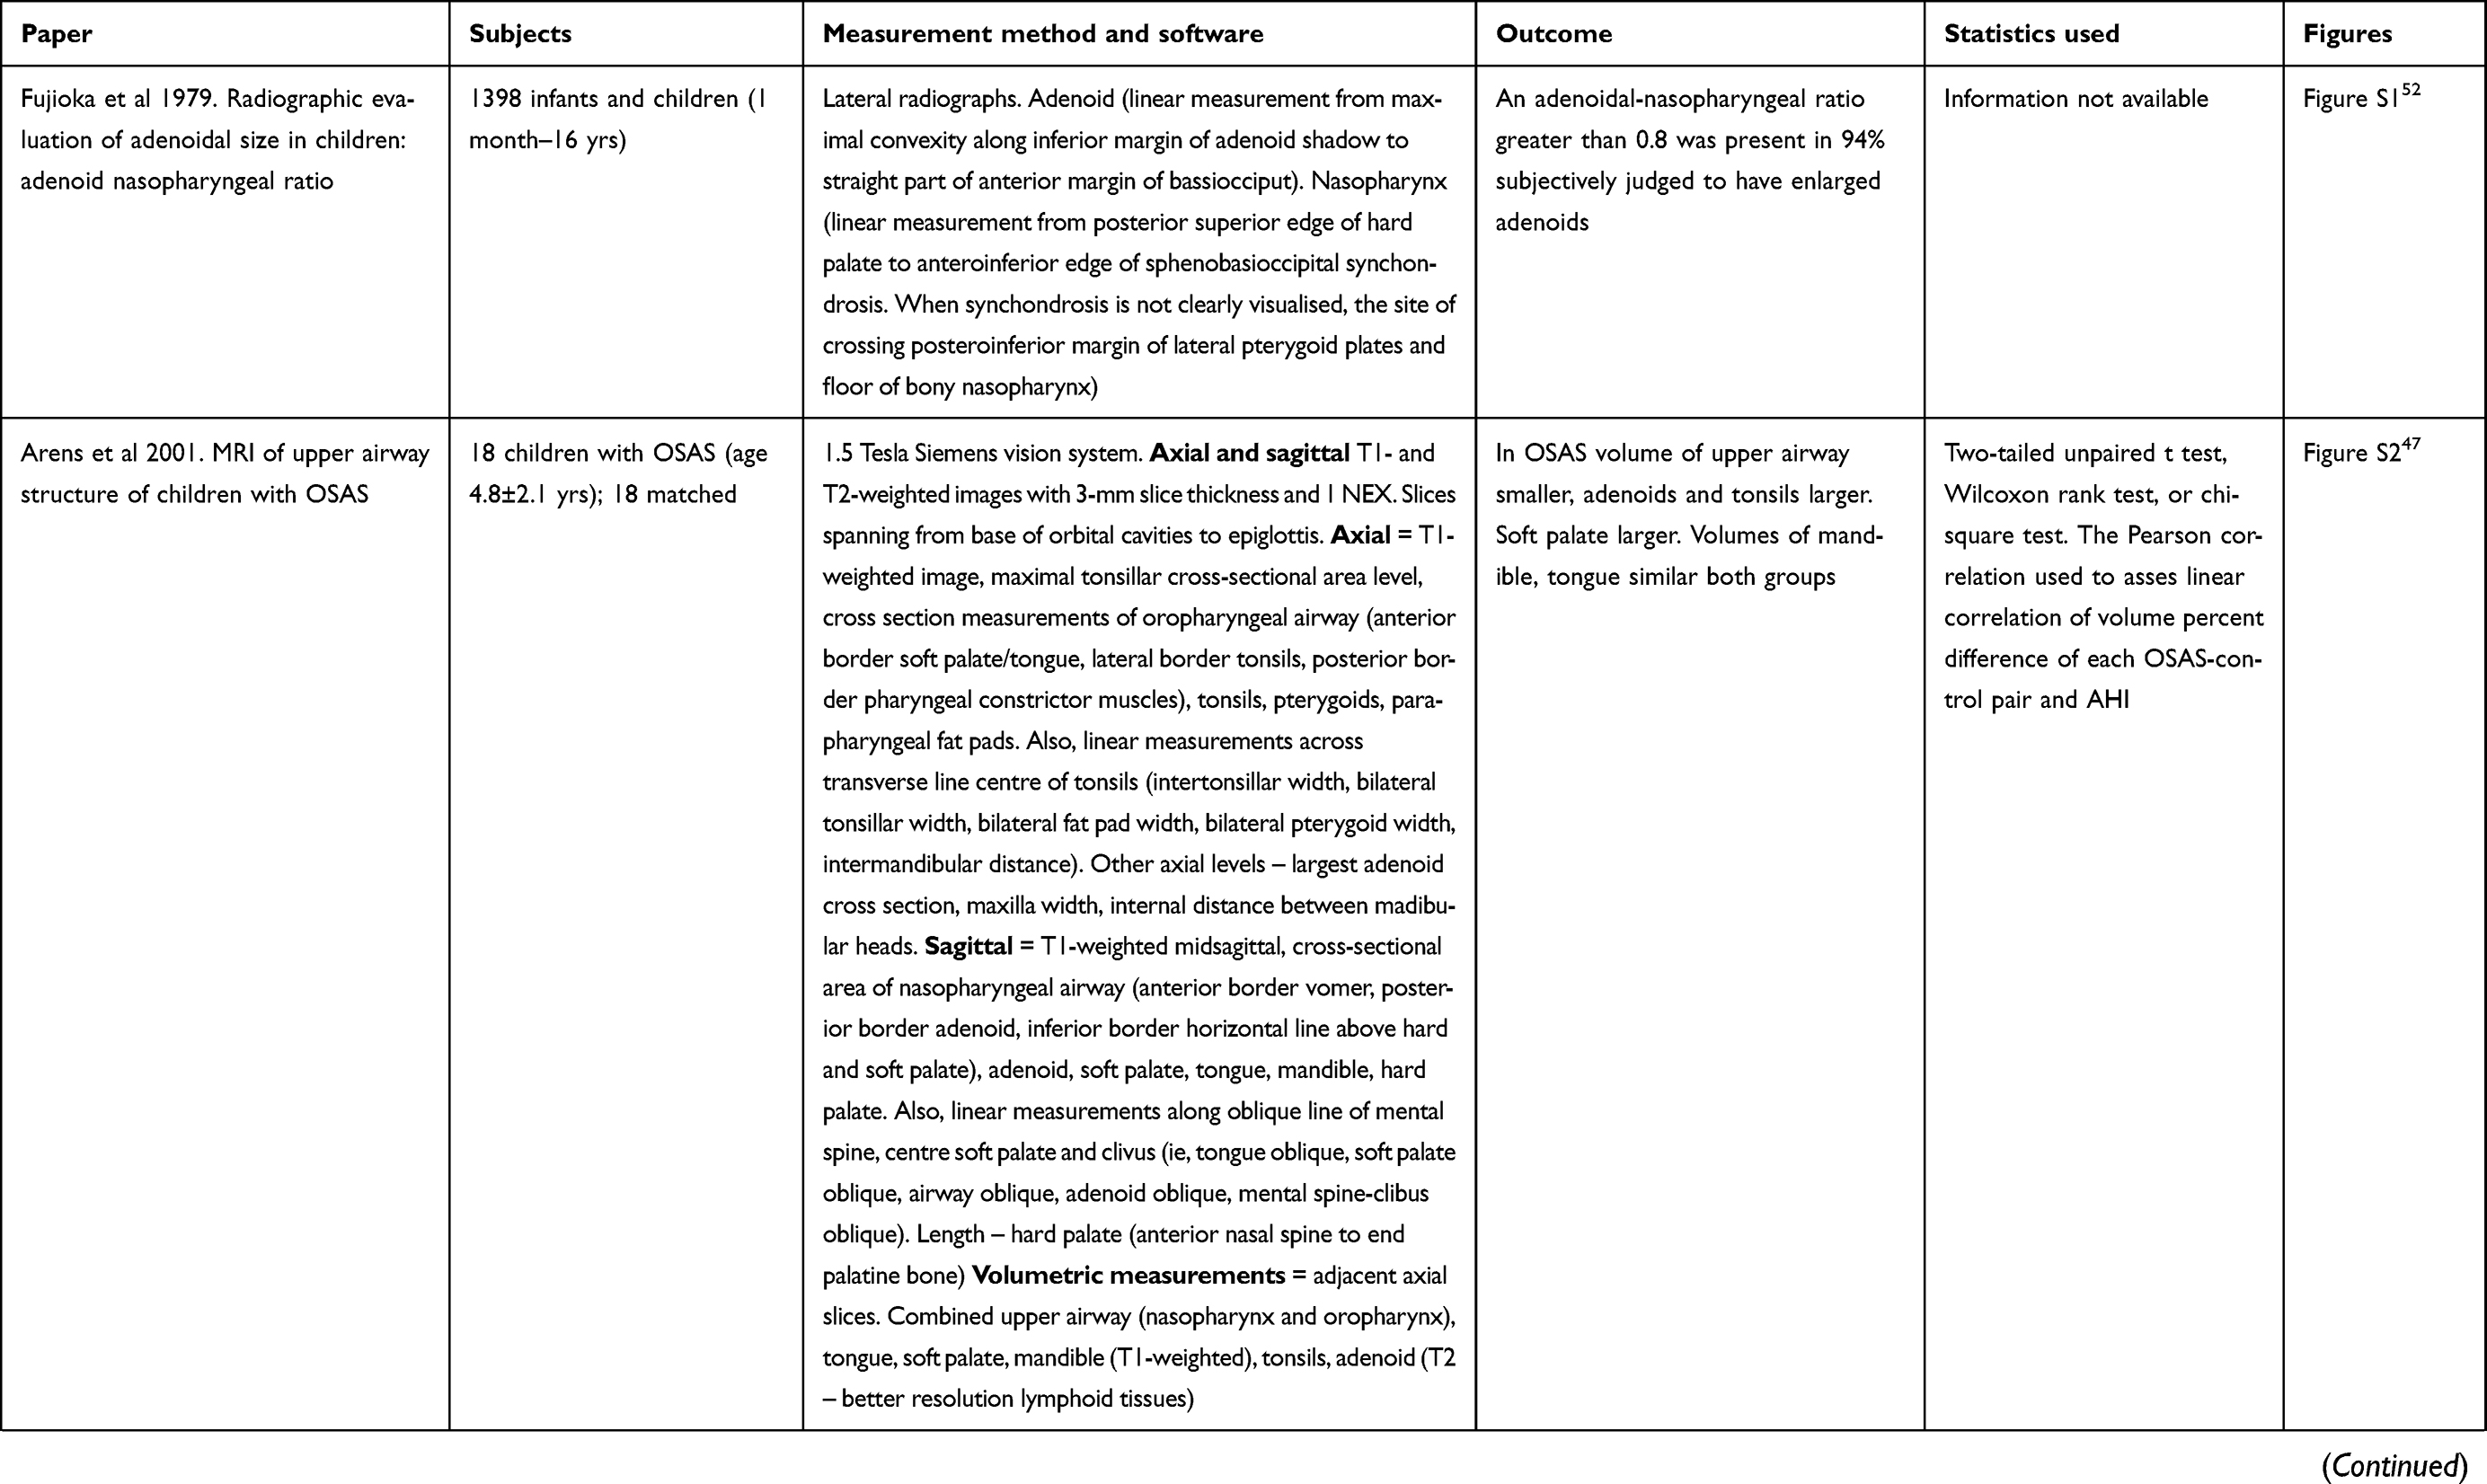
There are relatively few studies that explore developmental changes of the upper airway in normally developing children and they exhibit some contradictory findings. Arens et al found that the lower face skeleton had a strong linear correlation with age and height of their healthy subjects aged 1–11 years.121 The measurements for mental spine to clivus length and intermandibular length delineated the mid and lower face skeletal dimensions. As the mid and lower face skeletal dimensions increased in size with increasing age and/or height, the size of the upper airway tissues within this demarcated space also grew at a constant proportion. Therefore, no age-related growth velocities for any tissue contributing the airway were found; this included adenoidal and tonsillar tissues, as well as the size of the tongue, soft palate, tonsils, parapharyngeal fat pads, and pterygoids. Additionally, nasopharyngeal airway dimension grew at a constant proportion to skeletal growth. A study with similar outcomes for this age group by Vogler et al (2000), using comparable methodology, also found that the adenoid pad grew at a constant proportion to age, up to 10 years, with the largest size reached aged 7–10 years.122 Their study, however, continued beyond this age and subsequently the growth velocity diminished until 60 years old.
In contrast to these findings are studies by Fujioka et al and Jeans.52 Fujioka et al found that adenoid:nasopharyngeal (AN) ratio, demarcated on lateral skull radiograph, did exhibit some age-related growth velocity during childhood.52 The AN ratio typically increased from 1.5 months to 1 year 3 months, reaching its highest value at 4 years 6 months, after which it gradually decreased until 12 years 6 months and subsequently decreased dramatically at 15 years 6 months. The study also proposed that linear measurements of the adenoids and nasopharyngeal airway that generate an AN ratio greater than 0.8 were related to a subjective assessment of subjects with enlarged adenoids. These findings were corroborated by Jeans et al using lateral neck cephalometry.53 Although they found a constant growth velocity of the total nasopharynx area between 3 and 11 years, they noted a mild reduction in the area of the nasopharyngeal airway between 3 and 5 years that occurred simultaneously with a mild increased growth velocity of the soft tissues. Thereafter, nasopharyngeal airway continued to grow linearly with no further increase in soft tissue within the nasopharyngeal distribution. This AN ratio measurement could warrant further research, particularly with the advent and accessibility of superior imaging modalities compared to the standard plain radiograph that was used originally.
While there are some discrepancies, these studies generally show a similar trend of constant proportion of growth of the upper airway and its structures up to 10 years old. It is interesting to note the reduction of nasopharyngeal airway with simultaneous increase in soft tissues at age 3–5 years, considering that OSAS is commonly diagnosed around a similar age.11,37,39 This may indicate a mechanism that predisposes to OSAS – a narrowed nasopharynx due to overgrowth of soft tissues, such as the adenoids. Hence, making the AN airway measurement is important.
It would be interesting to see whether the growth trajectory for SCD children matches the growth trajectory for normal, healthy children. Any apparent age-related growth velocities in SCD could provide further information for risk stratifying for SDB. Imaging of the anatomical dimensions of the upper airway in developing children and young adults may provide insight into structural growth changes linked with SDB and specific populations – focusing upon the aforementioned regions of interest, including the nasopharyngeal airway, AN airway ratio, and mid to lower face skeletal dimensions, eg, mental spine to clivus length. The imaging modality that is widely available and most appropriate in reproducing three-dimensional innate images of soft tissues, such as those comprising the upper airway structure, is MRI. This generates a medium for comparison of upper airway anatomical measurements between patient groups.
Employing MRI to assess the structure of the upper airway in OSAS populations
The advent of MRI has led to greater understanding of growth and development of the upper airway during childhood. MRI provides an innately scaled, three-dimensional image of the tissues of the upper airway. Advantages include the avoiding of ionizing radiation in a pediatric population and the superior resolution for soft tissues compared to radiographs.52,53 There are limitations including the comparatively long acquisition time of an MRI scan compared with a lateral neck X-ray or CT scan, which may precipitate motion artifact. Additionally, some studies used sedation or anesthesia as part of their protocol in young children, which could potentially lead to diminution of muscle tone impacting on airway measurements.
A literature search using the terms “obstructive sleep apnea”, “adenoids”, “airway”, and “MRI” was performed to explore methods used for measuring regions of interest in the upper airway in pediatric OSAS populations.
Table 2 compares the anatomical landmarks used by each study to demarcate the upper airway with particular regions of interest, and Table 3 describes the key features of each of these studies. The previously mentioned imaging studies have been included for comparison.
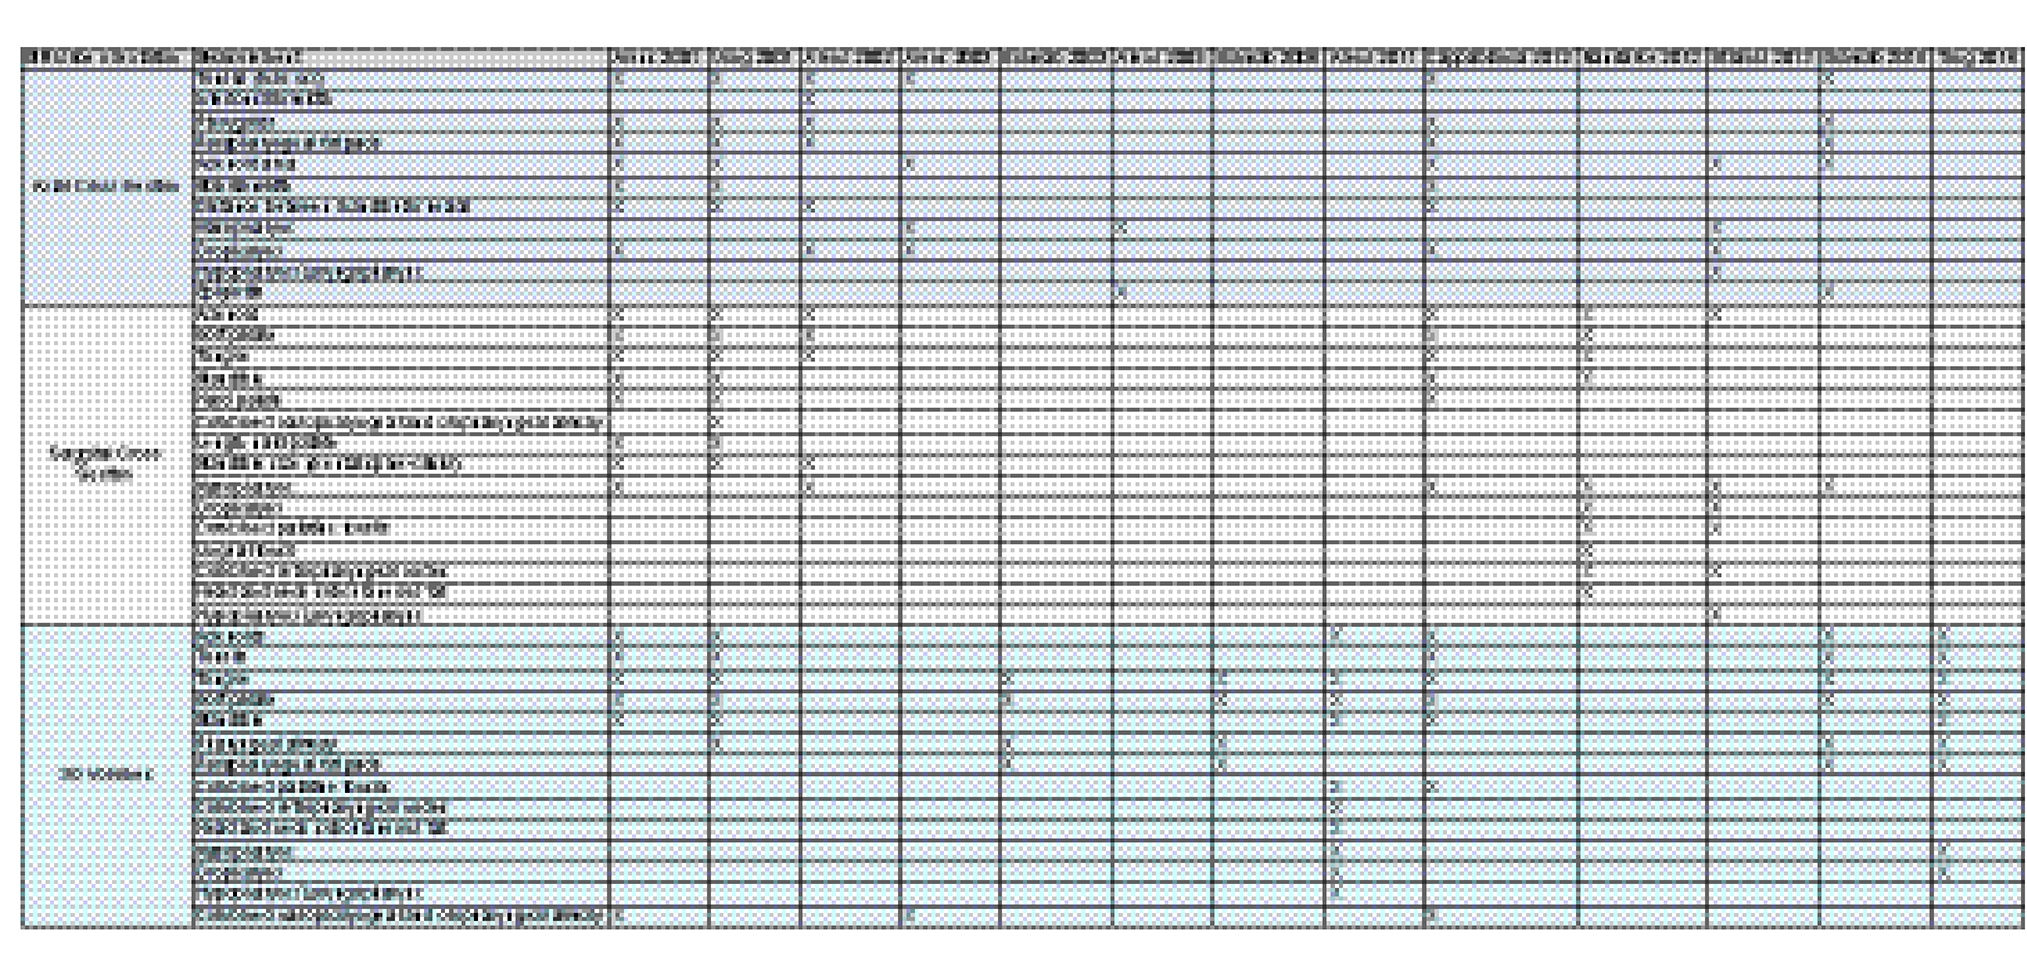 |
Table 2 Highlights which anatomical landmarks were used by studies using MRI as the modality for measuring regions of interest |
 |
 |
 |
 |
 |
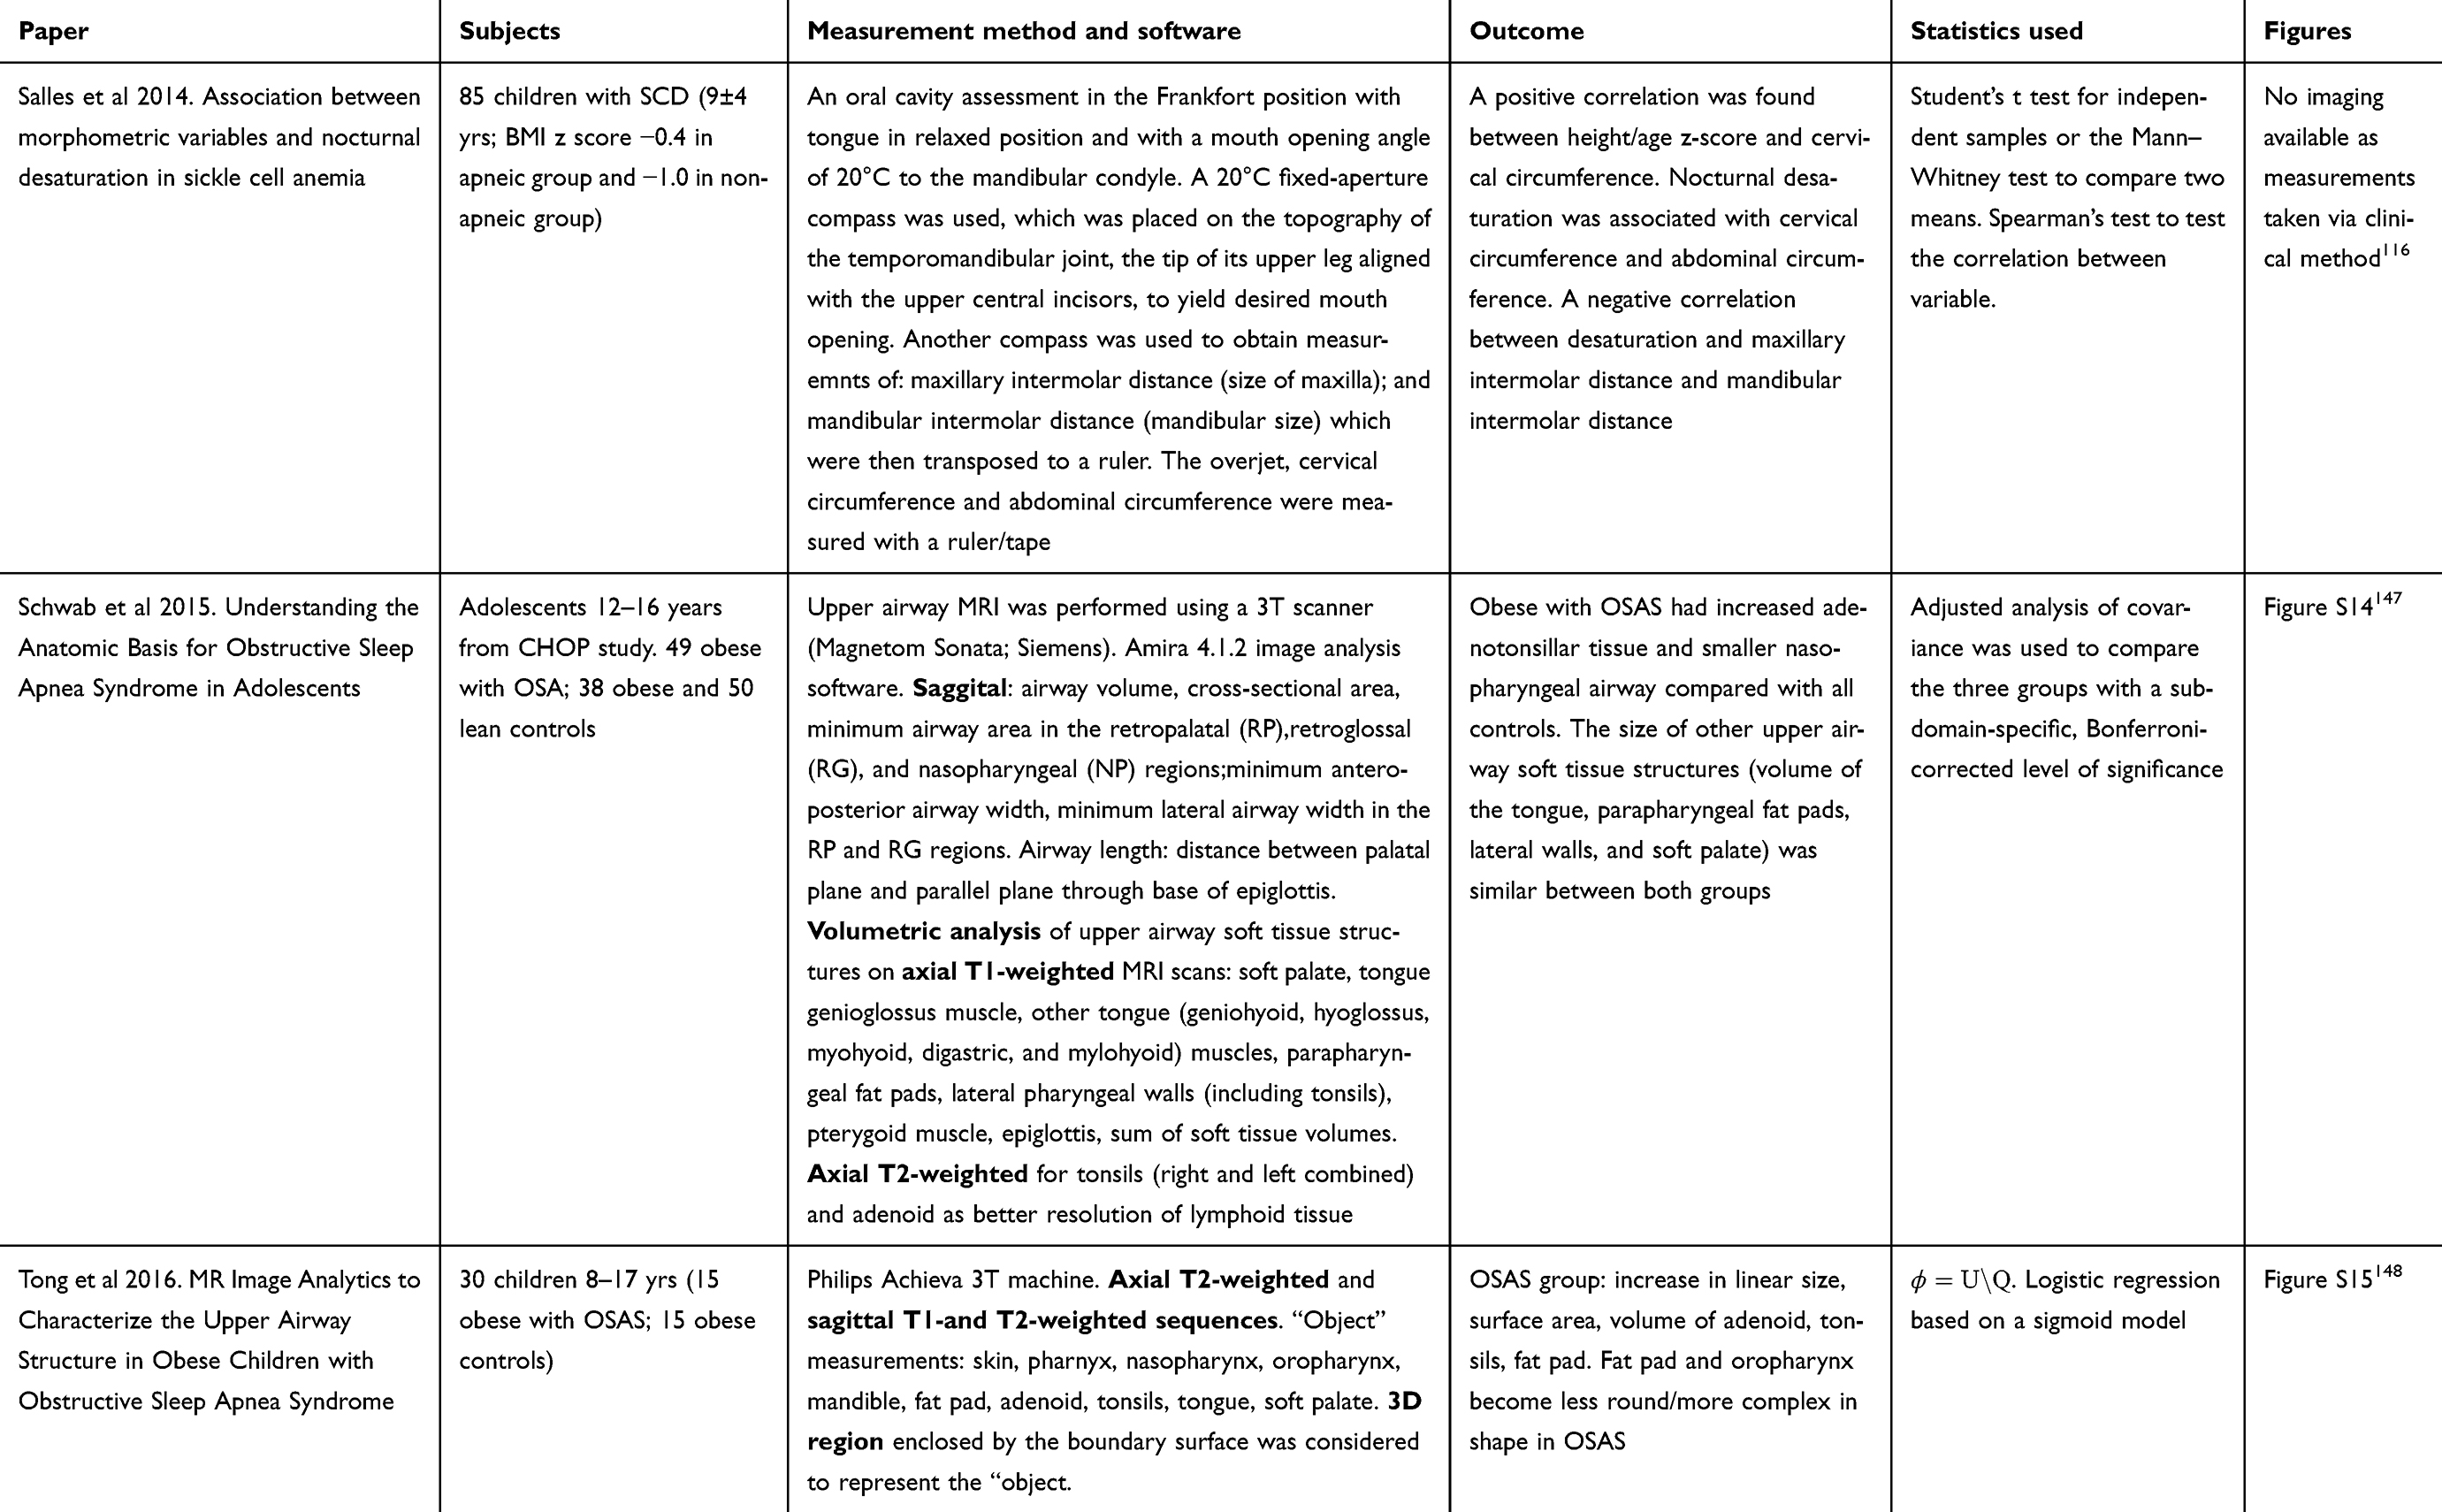 |
Table 3 Describes these studies found |
MRI of the upper airway: comparison between healthy controls against OSAS populations
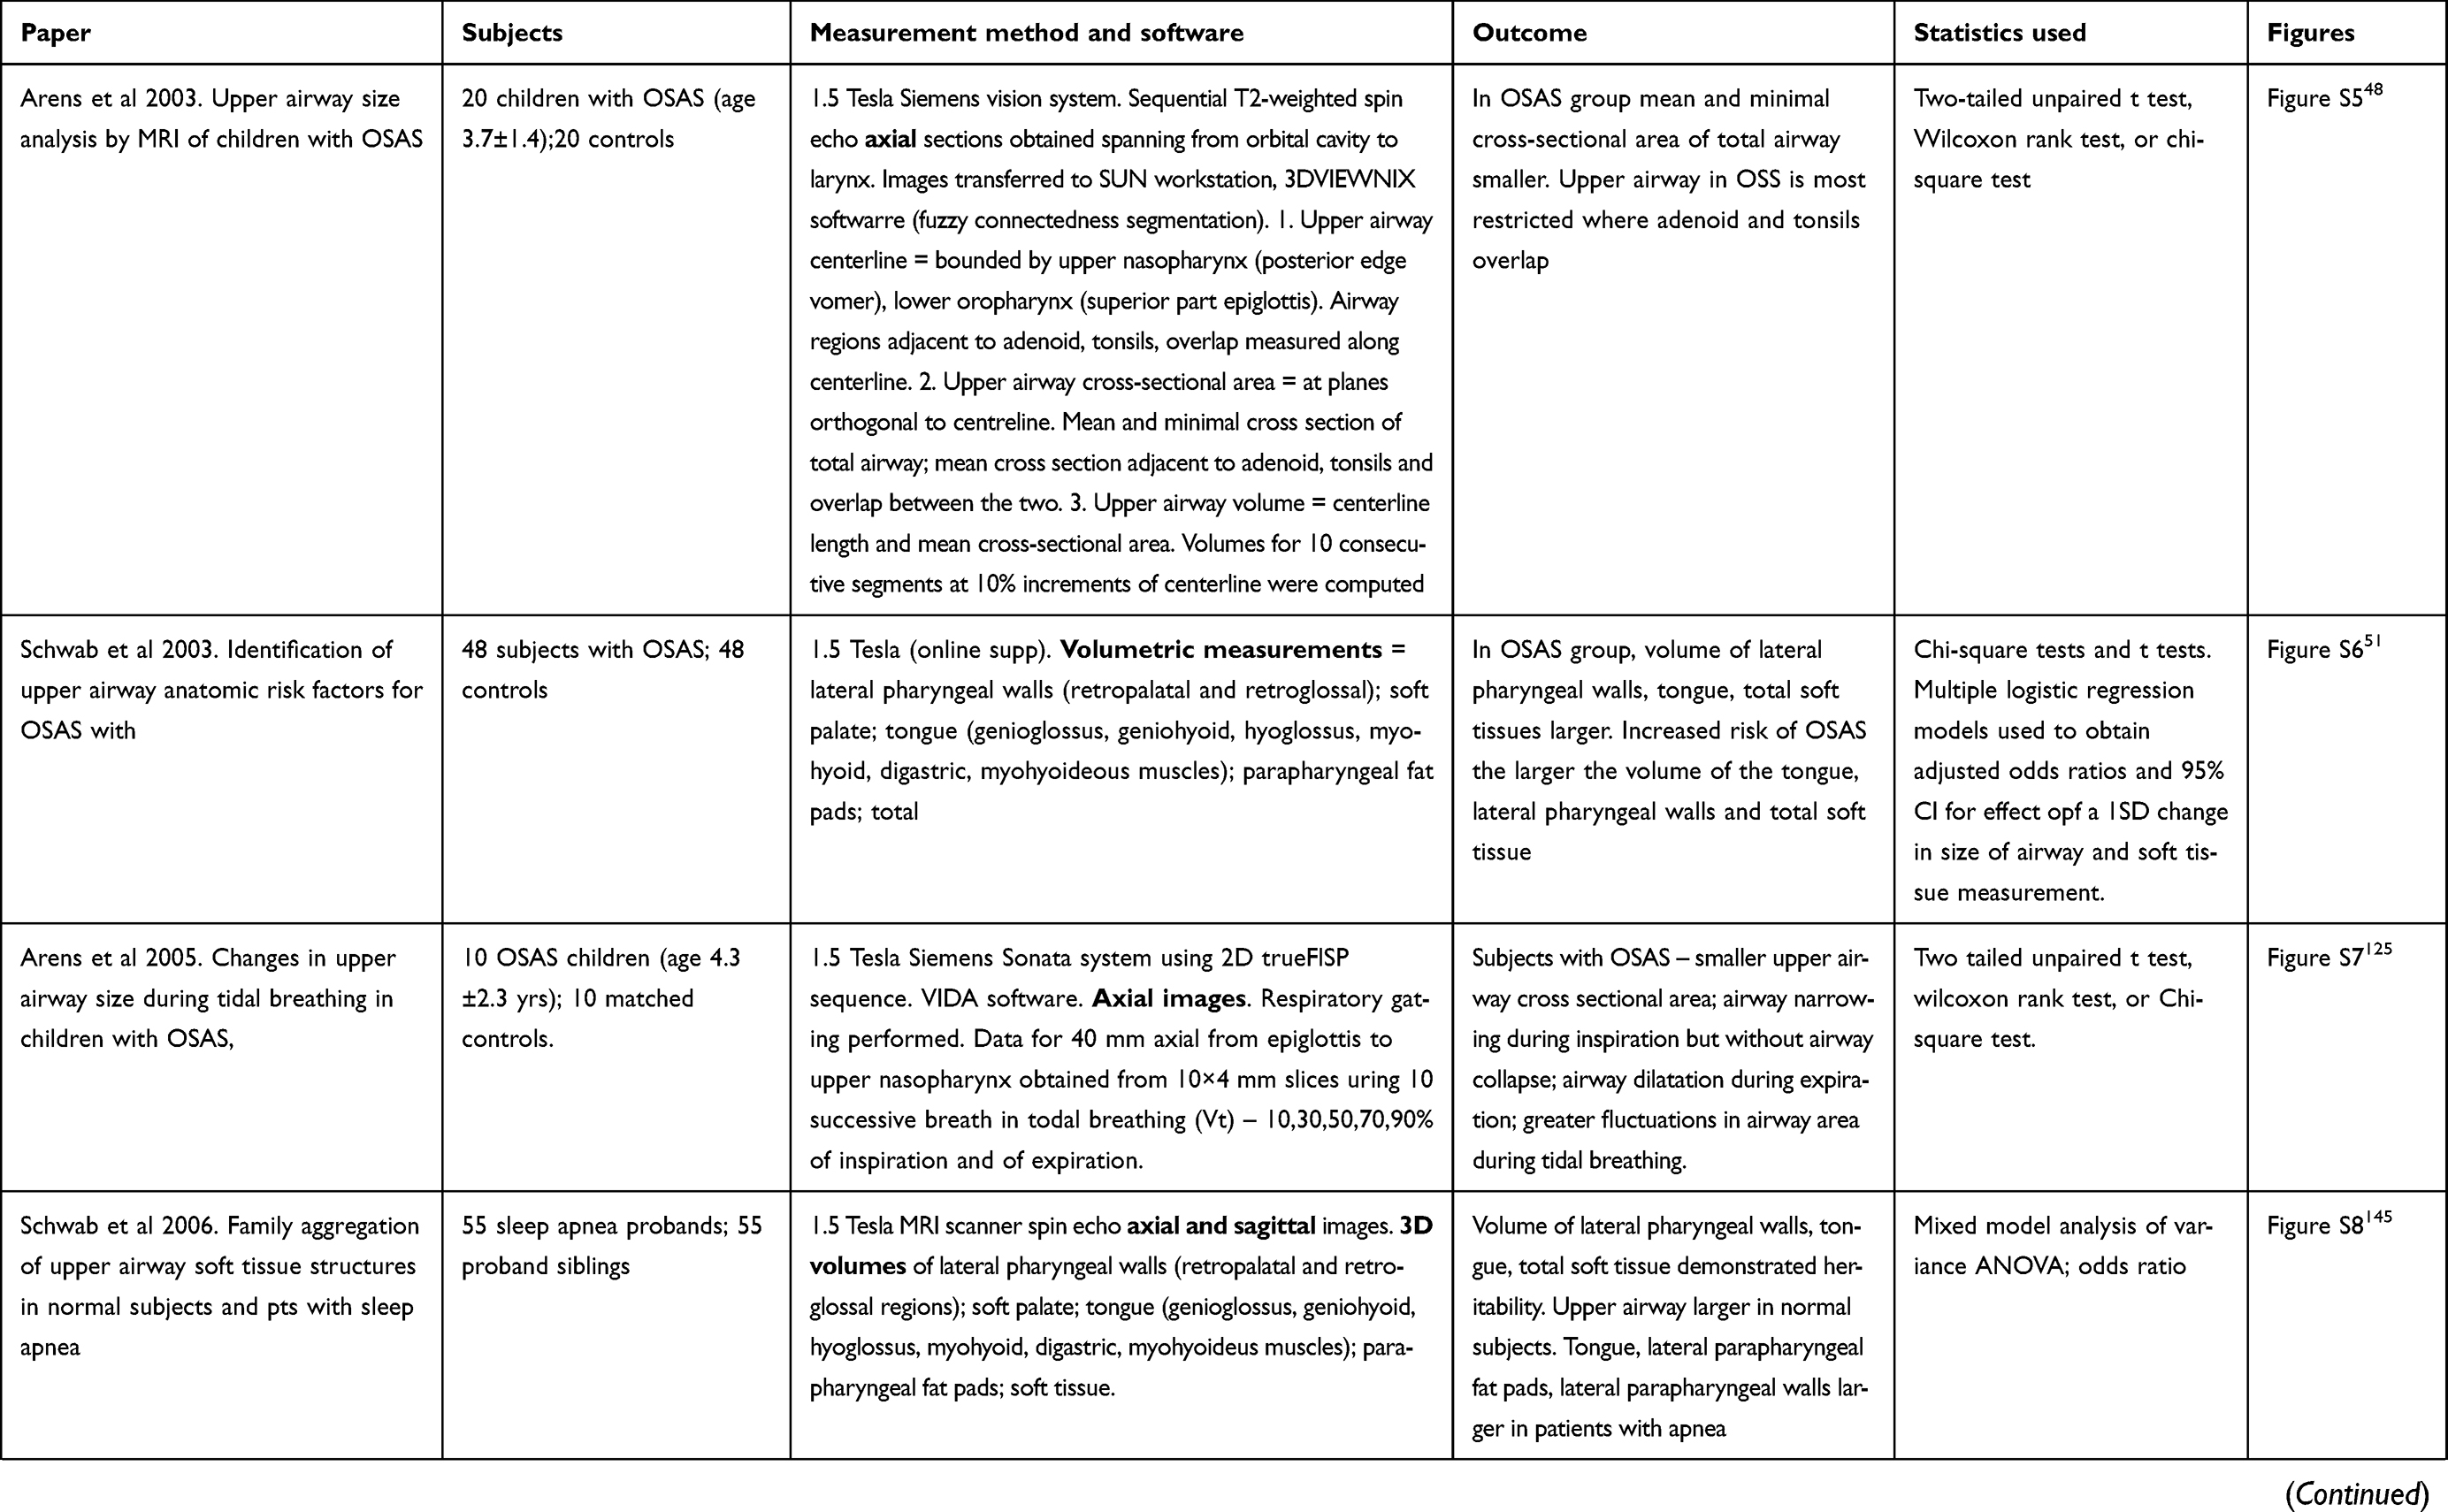
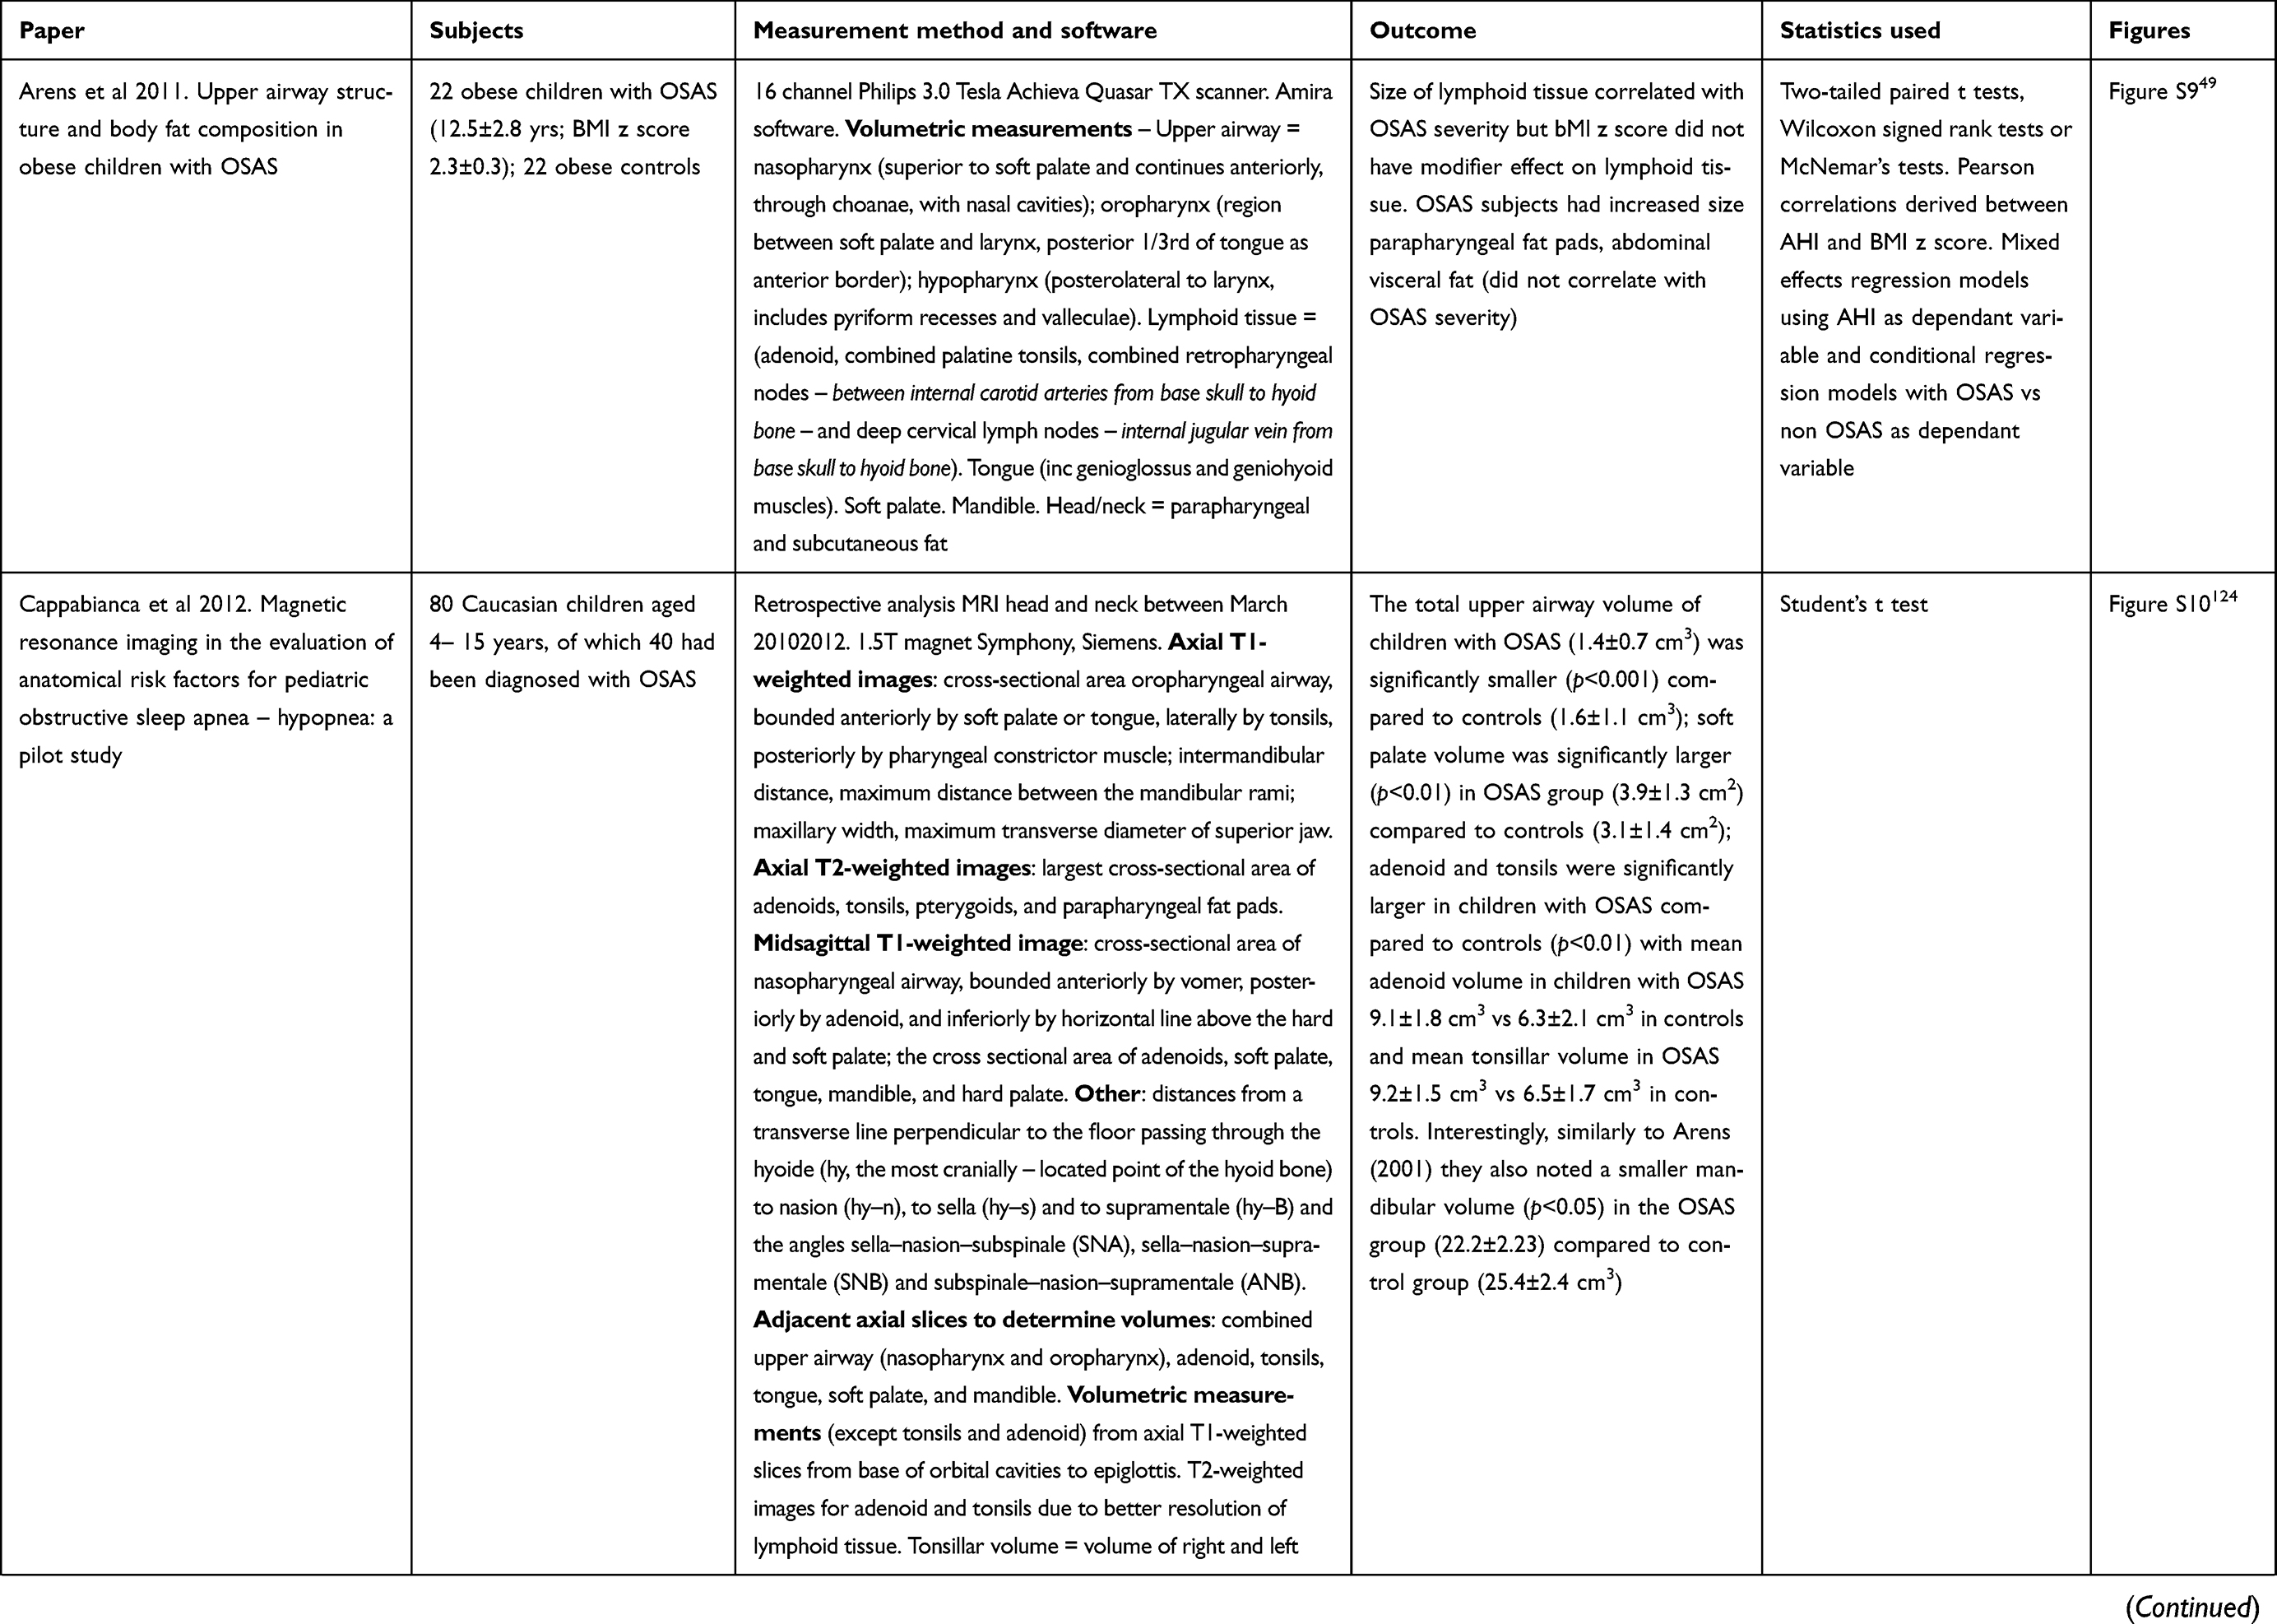
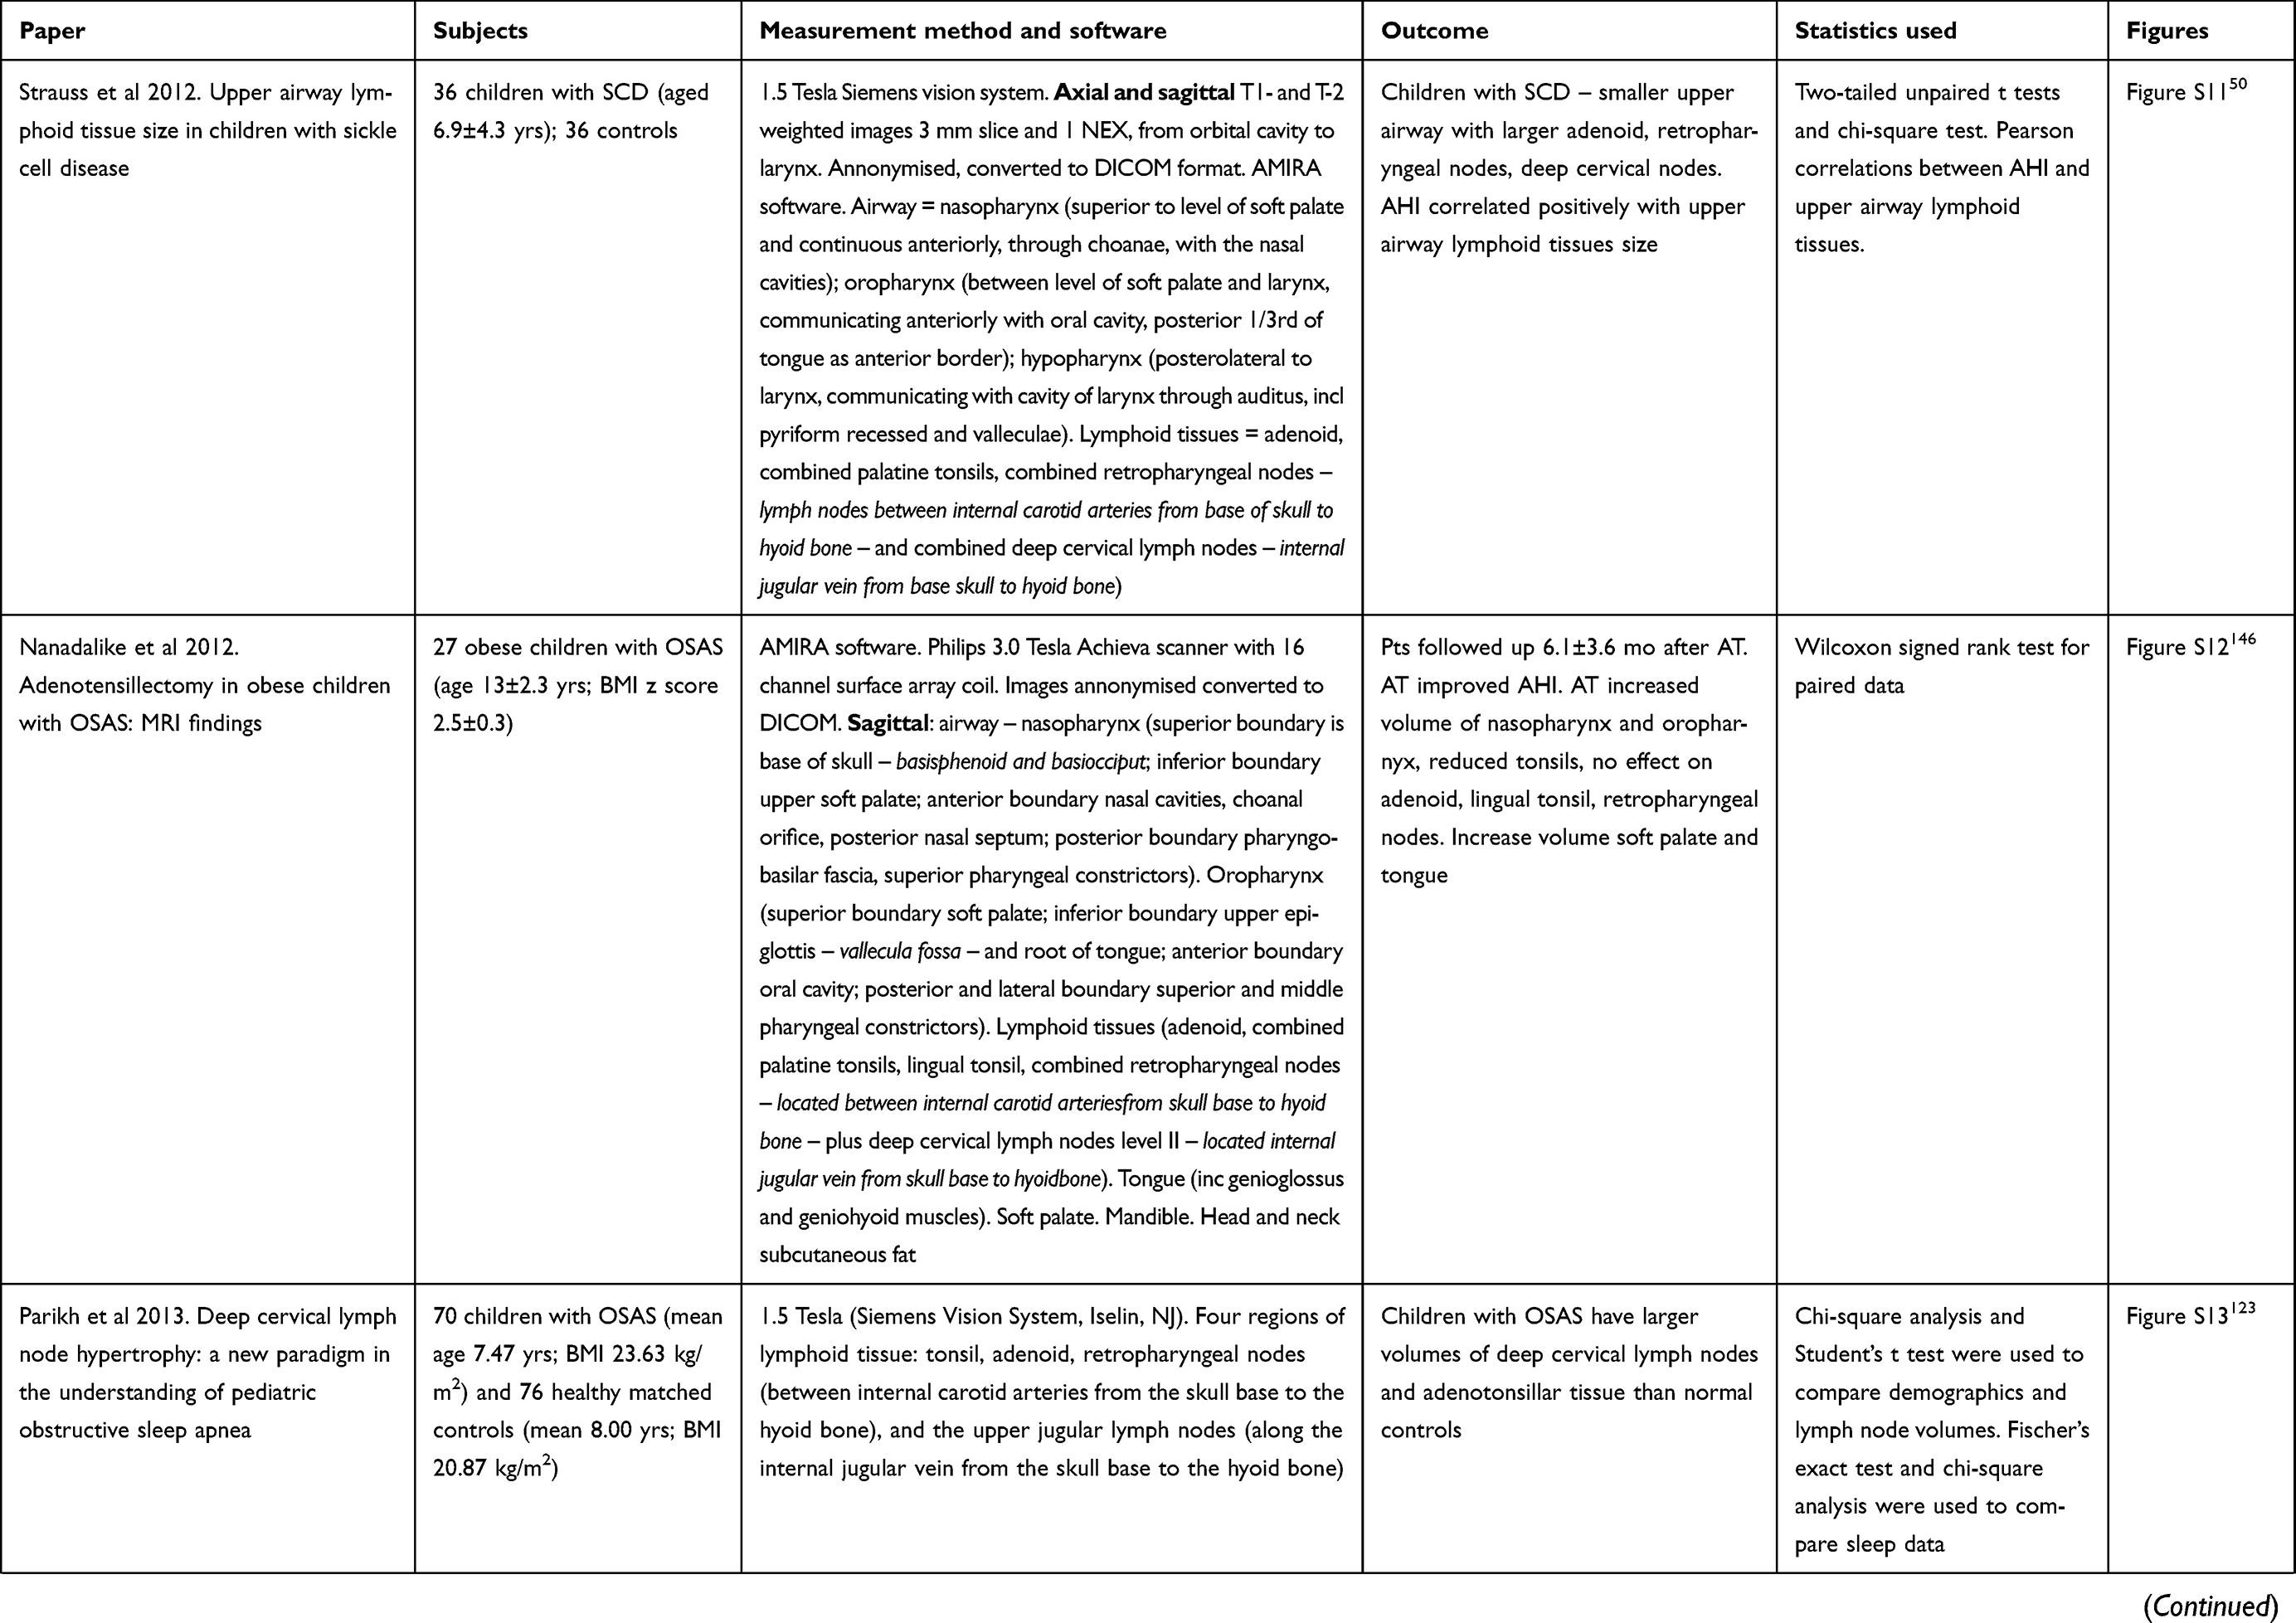
Several studies, as illustrated in Tables 2 and 3, found upper airway anatomical differences between OSAS and non-OSAS populations. The volume/area/size of the upper airway was smaller in subjects with OSAS,47–50 and in adults, the volume of the lateral pharyngeal walls was larger in OSAS51 The adenoids, tonsils47,49,50,123,124 retropharyngeal nodes,49,50,123 deep cervical nodes,50,123 and parapharyngeal fat pads49 were larger in OSAS. The soft palate47 and the total soft tissues were found to be larger in OSAS.51 The volume of the mandible was similar in the control and OSAS groups in some studies,47 but smaller in the OSAS group in others. Regarding the tongue in patients with OSAS compared with controls, it was found to be either similar in children47 or larger in adults.51 Abdominal visceral fat was greater in OSAS.49
In a study using respiratory-gated MRI under sedation, Arens et al found a smaller upper airway cross-sectional area, particularly during inspiration, in children with OSAS.125 Airway narrowing occurred during inspiration without evidence of complete airway collapse, while airway dilatation occurred during expiration. The magnitude of the fluctuations in cross-sectional area during tidal breathing was significantly greater in OSAS compared to healthy children.
Patini conducted a systematic review126 to assess the effectiveness of MRI in evaluating upper airway structures in children with OSAS and, after strict exclusion parameters were applied (initially 1170 titles for possible inclusion), a meta-analysis was performed on three of the studies of patients with OSAS and controls: Arens,47 Arens,48 and Cappabianca.124 The studies showed differences in minimum retropharyngeal cross-sectional area, nasopharyngeal airway, combined upper airway volume, tonsillar, and adenoid cross-sectional and volumetric indices. In addition, in the latter study, midsagittal cross-sectional area of the soft palate was higher, mandibular volume was lower, and the vertical position of the hyoid bone was significantly lower in the OSAS group compared with controls.124 There were also differences in the position of the maxilla and the mandible, in both cases in the sense of retroposition.124 The results suggested that MRI could be a useful tool in pediatric OSAS populations for calculating the total volume of the upper airway structures and thus enabling diagnostic examination and clinical management in practice, as it allows assessment of regions of interest that appear to contribute to obstruction – lumen, soft, and skeletal tissue.
MRI of the upper airway – comparison between healthy controls against SCD populations and association with OSAS
To our knowledge, there is only one MRI study that evaluates the upper airway in children specifically with SCD with comparison to OSAS. Strauss et al found that children with SCD tended to have a smaller upper airway and larger adenoids, retropharyngeal nodes, and deep cervical nodes.50 Only lymphoid tissues were measured in this study. In terms of sleep studies, as previously referenced, Strauss et al identified a greater prevalence of OSAS in SCD (19%) compared to healthy children (0%).50 They found that in children with SCD, higher AHI, lower arterial oxygen saturation nadir, increased peak end-tidal CO2, and increased arousals correlated with upper airway lymphoid tissue size.
In a clinical study including subjects with SCD, Salles et al found a positive correlation between height/age z score and cervical circumference.116 The presence of nocturnal oxygen desaturation was associated with cervical circumference and abdominal circumference. There was a negative correlation between oxygen desaturation and maxillary intermolar distance and mandibular intermolar distance, ie, in SCD subjects that exhibited nocturnal oxygen desaturation, smaller maxilla, and mandible measurements were noted (measured using cephalometry, not MRI).
In summary, children with OSAS typically tended to have smaller sized airways and larger lymphoid and soft tissues compared to children without OSAS. Determining the proportion of growth of the upper airway and related structures for children with anemia such as SCD could potentially provide novel targets for therapies, particularly regarding the size of the lower facial skeleton.
Hypotheses stemming from the literature: considerations for potential treatment targets for SDB
The findings in the literature suggest it is plausible that people with OSAS have smaller sized airways due to smaller lower facial skeleton (eg, smaller mandible) and thus exhibit overcrowding within a defined area – rather than purely having enlarged adenoids and tonsils.
AN ratio
It is also possible that it is the relationship between the size of the adenoid to the nasopharyngeal airway, ie, the AN ratio, that is most important. Adenotonsillectomy is based on the assumption that hypertrophic adenoids and tonsils are the cause of OSAS and thus removal should alleviate symptoms. Differences in AN ratio may suggest why adenotonsillectomy is ineffective in some patients. For instance, if the adenoids are removed but this has little effect on the AN ratio, this may be because, even though the adenoids appeared hypertrophic, the nasopharynx was sufficiently large enough to combat this; hence there was no therapeutic effect from targeting this one factor alone.
Thus, an alternative treatment option could aim to target a combination of factors associated with OSAS, as highlighted in these studies: a triad of lymphoid tissue hypertrophy, airway volume distribution, and lower facial skeleton.
Lymphoid tissue hypertrophy
Children with OSAS show increased nasal and oropharyngeal inflammation with increased local and systemic inflammatory markers and pro-inflammatory cytokines which enhance lymphoid tissue proliferation.127 Novel therapies to combat these effects include anti-inflammatory agents, such as leukotriene receptor antagonists. Montelukast, a leukotriene receptor antagonist, has been used in trials and has shown a significant reduction in adenoid size and respiratory-related sleep disturbances.128 Leukotriene receptors LT1-R and LT2-R showed increased protein expression within adenoid tissues and there were also increased levels of LTB4, LTC4, LTD4, and LTE4 within adenoid tissue.128,129 However, similarly to adenotonsillectomy, there is the possibility of adenoid regrowth. Studies combining adenotonsillectomy and Montelukast as a postsurgical agent look promising.129
Volume of airway
Arens et al showed that regional analysis of the upper airway in children with OSAS was most restricted where adenoid and tonsils overlap.48 However, segmental analysis revealed that the upper airway was restricted throughout the initial two-thirds of its length and that the narrowing was not in a discrete region adjacent to the adenoids or tonsils, but rather in a continuous fashion along both. Documenting the distribution of the volume throughout the airway, rather than just the value of the volume, could be important in understanding this disease process in both healthy populations and those with underlying diseases.
Lower facial skeleton
Craniofacial differences
Arens et al and Cappabianca found that the mandible was smaller in children with OSAS.47,124 Populations that exhibit craniofacial abnormalities, with a higher incidence of OSAS, include Down syndrome, Treacher Collins syndrome, Crouzon syndrome, Apert syndrome, and Pierre Robin syndrome.64 Uong et al found that Down syndrome subjects were more likely to have smaller mental spine to clivus lengths.73 Therefore, exploring these anatomical measures as potential targets for further research could be warranted. Although it can be studied using MRI, the lower facial skeleton has received relatively little attention in populations at risk of OSAS. It would be interesting to ascertain whether there are any differences in craniofacial morphology owing to extramedullary hematopoiesis in chronic anemias and to determine whether growth of the mandible and maxilla matches the trajectory in comparison to healthy, typically developing children – ideally with sequential MRI into adulthood.
Lower facial skeletons in SCD
Salles et al showed smaller maxilla and mandible measurements, measured using cephalometry, in SCD subjects who exhibited nocturnal oxygen desaturation.116 Studies have shown craniofacial differences in the SCD population exhibiting mandibular retrusion, maxillary protrusion with elongated vertical development, and generalized pronounced protrusion of the midface. Skeletal immaturity and impedance of growth alongside angular bony deformities are commonly seen in patients with SCD.130 Anoxic events potentially precipitate premature closure of the epiphysis, whereas craniofacial structure abnormalities could be due to extramedullary hematopoiesis.131 Studies have shown that patients with SCD have reduced z-scores for weight for age, height, elbow breadth, skinfold thickness, and mid-upper arm circumference, that are indicative of global growth deficit. Interestingly, studies have reported lower levels of vitamin D in this population, which were associated with morbidity. Vitamin D supplements might promote growth to combat these anatomical defects.
If genetic disposition is also explored, there could be interventions based on this. A study by Arun et al evaluated MYO1H gene polymorphisms and haplotypes as risk factors for mandibular retrognathism and identified a single-nucleotide polymorphism rs3825393 to be associated with mandibular retrognathism.132 Previous studies have shown that there are distinct combinations of myosin heavy chain isoforms in the masseter muscles and that these muscle combinations may have mutual effects on bones. SCD patients may have a genetic predisposition for mandibular retrognathism influencing their susceptibility to develop OSAS.
Techniques including mandibular advancement or mandibular distraction osteogenesis for treatment of retro-positioned mandibles or mandibular hypoplasia have produced promising results in children with OSAS with improvement in flow limitation.133 These oral jaw repositioning devices are relatively new and not commonly used in the pediatric population. In addition to adenotonsillectomy, alternative methods for treatment include nasal corticosteroid spray or Montelukast, and continuous or bi-level positive airway pressure (CPAP; BiPAP). Exceptionally rare cases may require tracheostomy.
SDB and complications of SCD – implications for treatment?
SDB and NOD have been associated with increased incidence of vaso-occlusive crisis, stroke, neurocognitive deficits, nocturnal enuresis, cardiovascular, and autonomic dysfunction in SCD.93,97,103,134–136 However, there are few studies looking at mechanisms which might lead to evidence-based treatment. Employing MRI to understand the distribution of the volume throughout the airway, rather than discrete values, as well as demarcating growth of related upper airway structures and craniofacial morphology, could improve understanding of the disease process and potentially ameliorate the severe sequelae of OSAS in populations such as SCD. OSAS causes episodes of deoxygenation, which increases the amount of hypoxemia, and therefore increases the risk of complications. Combatting the structural defects associated with obstructive breathing with appropriate interventions could reduce the proportion of time spent with significant oxygen desaturation and consequently reduce the complications in this population.61
Stroke and OSAS/NOD in SCD as an example
The prevalence of cerebral infarction, both overt and covert in people with SCD, is much greater than compared to the healthy population.137 Case reports in the 1980s suggested that OSAS was a risk factor for stroke in SCD.138,139 A cohort study showed that nocturnal hypoxemia predicted central nervous system events.93,140 Interestingly, stroke appears to be more common in those with a longer history of upper airway obstruction.100
A laboratory study by Setty et al reported that the release of cellular mediators in hypoxemia, and the relationship between anemia and oxyhemoglobin desaturation, suggested that cerebral vasculopathy and stroke might occur through hypoxia-mediated pathways.141 In patients, high cerebral blood flow on transcranial Doppler appears to be associated with low daytime oxygen saturation.142,143 Abnormal magnetic resonance angiography was associated with NOD in another study.144
Huang et al highlighted that children with SCD without OSAS have more prominent upper airway reflexes than children with SCD without OSAS.115 Reduced upper airway neuromuscular reflexes may contribute to the increased upper airway collapsibility in SCD children with OSAS. The study speculated that cerebrovascular disease in children with SCD may predispose to abnormal regulation of upper airway muscles during sleep, therefore increasing the risk of OSAS in this population. The question is: does cerebrovascular disease predispose to OSAS or does OSAS-inducing hypoxia lead to cerebrovascular disease?
Conclusion
SDB is more common in Black ethnicities, and even more prevalent in those with SCD. SDB has significant implications for health leading to chronic and debilitating diseases. There appear to be structural differences in the airway between those with and without OSAS, as well as between ethnicities. OSAS populations tend to have smaller airways, larger lymphoid tissues, and smaller lower facial skeletons demarcated by measurements of the mandible and mental spine to clivus. There appears to be an increased prevalence of OSAS in SCD populations with hypoxia as a key manifestation which appears to increase the risk of complications, including stroke. Understanding a potential relationship between the AN ratio, lymphoid hypertrophy, airway volume distribution, and lower craniofacial structure could potentially help to stratify those children most at risk of OSAS. Combatting any structural defects with appropriate interventions could reduce the duration spent in hypoxemia and consequently reduce the risk of comorbidities in this population, therefore warranting early treatment interventions.
Abbreviation list
AN, adenoid to nasopharynx ratio; AASM, American Academy of Sleep Medicine; AHI, Apnea/Hypopnea Index; BiPAP, bi-level positive airway pressure; BMI, body mass index; CAI, central apnea index; CHOP, Children’s hospital of Philadelphia; CPAP, continuous positive airway pressure; CSA, central sleep apnea; CSAS, central sleep apnea syndrome; CT, computed tomography; ECG, electrocardiography; EEG, electroencephalography; EMG, electromyography; EOG, electrooculography; ETpCO2, end-tidal partial pressure carbon dioxide; HbA, normal adult haemoglobin; HbAS, sickle cell trait haemoglobin; HbSS, homozygous sickle cell haemoglobin; MRI, magnetic resonance imaging; NOD, nocturnal oxygen desaturation; Non-REM, non rapid eye movement sleep; OAHI, Obstructive Apnea/Hypopnea Index; OSAS, obstructive sleep apnea syndrome; pCO2, partial pressure carbon dioxide; PSG, polysomnography; RBC, red blood cell; REM, rapid eye movement sleep; RIP, respiratory inductance plethysmography; SAC, sickle Sleep Asthma Cohort study; SaO2, arterial oxygen saturation; SCA, sickle cell anaemia (HbSS); SCD, sickle cell disease (HbSS, HbSC, HbSβthalassemia); SDB, sleep disordered breathing; SpO2, pulse oximetry oxygen saturation.
Acknowledgments
Dr Kirkham’s research is supported by Action Medical Research grant GN2509.
Disclosure
The authors report no conflicts of interest in this work.
References
1. Hendricks JC, Kovalski RJ, Kline LR. Phasic respiratory muscle patterns and sleep-disordered breathing during rapid eye movement sleep in the English bulldog. Am Rev Respir Dis. 1991;144(5):1112–1120. doi:10.1164/ajrccm/144.5.1112
2. Sproson EL, Hogan AM, Hill CM. Accuracy of clinical assessment of paediatric obstructive sleep apnoea in two English centres. J Laryngol Otol. 2009;123(9):1002–1009. doi:10.1017/S0022215109005532
3. Hamada M, Iida M. Home monitoring using portable polygraphy for perioperative assessment of pediatric obstructive sleep apnea syndrome. Tokai J Exp Clin Med. 2012;37(3):66–70.
4. Brouillette RT, Morielli A, Leimanis A, Waters KA, Luciano R, Ducharme FM. Nocturnal pulse oximetry as an abbreviated testing modality for pediatric obstructive sleep apnea. Pediatrics. 2000;105(2):405–412.
5. Hill CM, Elphick HE, Farquhar M, et al. Home oximetry to screen for obstructive sleep apnoea in down syndrome. Arch Dis Child. 2018;103(10):962–967. doi:10.1136/archdischild-2017-314409
6. Iber C, Redline S, Kaplan Gilpin AM, et al. Polysomnography performed in the unattended home versus the attended laboratory setting–Sleep Heart Health Study methodology. Sleep. 2004;27(3):536–540.
7. Berry RB, Budhiraja R, Gottlieb DJ, et al. Rules for scoring respiratory events in sleep: update of the 2007 AASM manual for the scoring of sleep and associated events. deliberations of the sleep apnea definitions task force of the American academy of sleep medicine. J Clin Sleep Med. 2012;8(5):597–619. doi:10.5664/jcsm.2172
8. Berry RB, Brooks R, Gamaldo C, et al. AASM scoring manual updates for 2017 (version 2.4). J Clin Sleep Med. 2017;13(5):665–666. doi:10.5664/jcsm.6576
9. Terrill PI, Dakin C, Hughes I, Yuill M, Parsley C. Nocturnal oxygen saturation profiles of healthy term infants. Arch Dis Child. 2015;100(1):18–23. doi:10.1136/archdischild-2013-305708
10. Evans HJ, Karunatilleke AS, Grantham-Hill S, Gavlak JC. A cohort study reporting normal oximetry values in healthy infants under 4 months of age using Masimo technology. Arch Dis Child. 2018;103(9):868–872. doi:10.1136/archdischild-2017-314361
11. Marcus CL, Brooks LJ, Draper KA, et al. Diagnosis and management of childhood obstructive sleep apnea syndrome. Pediatrics. 2012;130(3):e714–e755. doi:10.1542/peds.2012-1672
12. Nixon GM, Hyde M, Biggs SN, Walter LM, Horne RS, Davey MJ. The impact of recent changes to the respiratory scoring rules in pediatrics. J Clin Sleep Med. 2014;10(11):1217–1221. doi:10.5664/jcsm.4206
13. Mitterling T, Hogl B, Schonwald SV, et al. Sleep and respiration in 100 healthy caucasian sleepers – a polysomnographic study according to American Academy of Sleep Medicine standards. Sleep. 2015;38(6):867–875. doi:10.5665/sleep.4730
14. Hertenstein E, Gabryelska A, Spiegelhalder K, et al. Reference data for polysomnography-measured and subjective sleep in healthy adults. J Clin Sleep Med. 2018;14(4):523–532. doi:10.5664/jcsm.7036
15. Terrill PI, Dakin C, Edwards BA, Wilson SJ, MacLean JE. A graphical method for comparing nocturnal oxygen saturation profiles in individuals and populations: application to healthy infants and preterm neonates. Pediatr Pulmonol. 2018;53(5):645–655. doi:10.1002/ppul.23987
16. Vold ML, Aasebo U, Hjalmarsen A, Melbye H. Predictors of oxygen saturation </=95% in a cross-sectional population based survey. Respir Med. 2012;106(11):1551–1558. doi:10.1016/j.rmed.2012.06.016
17. Vold ML, Aasebo U, Wilsgaard T, Melbye H. Low oxygen saturation and mortality in an adult cohort: the Tromso study. BMC Pulm Med. 2015;15:9. doi:10.1186/s12890-015-0003-5
18. Gries RE, Brooks LJ. Normal oxyhemoglobin saturation during sleep. How low does it go? Chest. 1996;110(6):1489–1492.
19. Ferber R, Kryger MH. Principles and Practice of Sleep Medicine in the Child.
20. Kobayashi M, Fukuda S, Takano KI, Kamizono J, Ichikawa K. Can a pulse oxygen saturation of 95% to 96% help predict further vital sign destabilization in school-aged children?: a retrospective observational study. Medicine (Baltimore). 2018;97(25):e11135. doi:10.1097/MD.0000000000011135
21. Urschitz MS, Wolff J, Von EV, Urschitz-Duprat PM, Schlaud M, Poets CF. Reference values for nocturnal home pulse oximetry during sleep in primary school children. Chest. 2003;123(1):96–101.
22. Uliel S, Tauman R, Greenfeld M, Sivan Y. Normal polysomnographic respiratory values in children and adolescents. Chest. 2004;125(3):872–878.
23. Traeger N, Schultz B, Pollock AN, Mason T, Marcus CL, Arens R. Polysomnographic values in children 2-9 years old: additional data and review of the literature. Pediatr Pulmonol. 2005;40(1):22–30. doi:10.1002/ppul.20236
24. Verhulst SL, Schrauwen N, Haentjens D, Van GL, De Backer WA, Desager KN. Reference values for sleep-related respiratory variables in asymptomatic European children and adolescents. Pediatr Pulmonol. 2007;42(2):159–167. doi:10.1002/ppul.20551
25. Moss D, Urschitz MS, von BA, et al. Reference values for nocturnal home polysomnography in primary schoolchildren. Pediatr Res. 2005;58(5):958–965. doi:10.1203/01.PDR.0000181372.34213.13
26. Accardo JA, Marcus CL, Leonard MB, Shults J, Meltzer LJ, Elia J. Associations between psychiatric comorbidities and sleep disturbances in children with attention-deficit/hyperactivity disorder. J Dev Behav Pediatr. 2012;33(2):97–105. doi:10.1097/DBP.0b013e31823f6853
27. Marcus CL. Sleep-disordered breathing in children. Curr Opin Pediatr. 2000;12(3):208–212.
28. Block AJ, Boysen PG, Wynne JW, Hunt LA. Sleep apnea, hypopnea and oxygen desaturation in normal subjects. A strong male predominance. N Engl J Med. 1979;300(10):513–517. doi:10.1056/NEJM197903083001001
29. Garvey JF, Pengo MF, Drakatos P, Kent BD. Epidemiological aspects of obstructive sleep apnea. J Thorac Dis. 2015;7(5):920–929. doi:10.3978/j.issn.2072-1439.2015.04.52
30. Gozal D, Kheirandish-Gozal L. Neurocognitive and behavioral morbidity in children with sleep disorders. Curr Opin Pulm Med. 2007;13(6):505–509. doi:10.1097/MCP.0b013e3282ef6880
31. Lee W, Nagubadi S, Kryger MH, Mokhlesi B. Epidemiology of obstructive sleep apnea: a population-based perspective. Expert Rev Respir Med. 2008;2(3):349–364. doi:10.1586/17476348.2.3.349
32. Punjabi NM. The epidemiology of adult obstructive sleep apnea. Proc Am Thorac Soc. 2008;5(2):136–143. doi:10.1513/pats.200709-155MG
33. Peppard PE, Young T, Barnet JH, Palta M, Hagen EW, Hla KM. Increased prevalence of sleep-disordered breathing in adults. Am J Epidemiol. 2013;177(9):1006–1014. doi:10.1093/aje/kws342
34. Franklin KA, Lindberg E. Obstructive sleep apnea is a common disorder in the population-a review on the epidemiology of sleep apnea. J Thorac Dis. 2015;7(8):1311–1322. doi:10.3978/j.issn.2072-1439.2015.06.11
35. Senaratna CV, English DR, Currier D, et al. Sleep apnoea in Australian men: disease burden, co-morbidities, and correlates from the Australian longitudinal study on male health. BMC Public Health. 2016;16(Suppl 3):1029. doi:10.1186/s12889-016-3703-8
36. Redline S, Tishler PV, Schluchter M, Aylor J, Clark K, Graham G. Risk factors for sleep-disordered breathing in children. Associations with obesity, race, and respiratory problems. Am J Respir Crit Care Med. 1999;159(5 Pt 1):1527–1532. doi:10.1164/ajrccm.159.5.9809079
37. Rosen CL, Larkin EK, Kirchner HL, et al. Prevalence and risk factors for sleep-disordered breathing in 8- to 11-year-old children: association with race and prematurity. J Pediatr. 2003;142(4):383–389. doi:10.1067/mpd.2003.28
38. Lumeng JC, Chervin RD. Epidemiology of pediatric obstructive sleep apnea. Proc Am Thorac Soc. 2008;5(2):242–252. doi:10.1513/pats.200708-135MG
39. Bixler EO, Vgontzas AN, Lin HM, et al. Sleep disordered breathing in children in a general population sample: prevalence and risk factors. Sleep. 2009;32(6):731–736.
40. Kheirandish-Gozal L, Gozal D. Obesity, asthma, and sleep-disordered breathing. J Pediatr. 2012;160(5):713–714. doi:10.1016/j.jpeds.2011.11.036
41. Montgomery-Downs HE, O’Brien LM, Gulliver TE, Gozal D. Polysomnographic characteristics in normal preschool and early school-aged children. Pediatrics. 2006;117(3):741–753. doi:10.1542/peds.2005-1067
42. Scholle S, Wiater A, Scholle HC. Normative values of polysomnographic parameters in childhood and adolescence: cardiorespiratory parameters. Sleep Med. 2011;12(10):988–996. doi:10.1016/j.sleep.2011.05.006
43. Scholle S, Beyer U, Bernhard M, et al. Normative values of polysomnographic parameters in childhood and adolescence: quantitative sleep parameters. Sleep Med. 2011;12(6):542–549. doi:10.1016/j.sleep.2010.11.011
44. Scholle S, Wiater A, Scholle HC. Normative values of polysomnographic parameters in childhood and adolescence: arousal events. Sleep Med. 2012;13(3):243–251. doi:10.1016/j.sleep.2011.07.022
45. Gozal D, Capdevila OS, Kheirandish-Gozal L. Metabolic alterations and systemic inflammation in obstructive sleep apnea among nonobese and obese prepubertal children. Am J Respir Crit Care Med. 2008;177(10):1142–1149. doi:10.1164/rccm.200711-1670OC
46. Tom C, Roy B, Vig R, et al. Correlations between waist and neck circumferences and obstructive sleep apnea characteristics. Sleep Vigil. 2018;2(2):111–118. doi:10.1007/s41782-018-0041-1
47. Arens R, McDonough JM, Costarino AT, et al. Magnetic resonance imaging of the upper airway structure of children with obstructive sleep apnea syndrome. Am J Respir Crit Care Med. 2001;164(4):698–703. doi:10.1164/ajrccm.164.4.2101127
48. Arens R, McDonough JM, Corbin AM, et al. Upper airway size analysis by magnetic resonance imaging of children with obstructive sleep apnea syndrome. Am J Respir Crit Care Med. 2003;167(1):65–70. doi:10.1164/rccm.200206-613OC
49. Arens R, Sin S, Nandalike K, et al. Upper airway structure and body fat composition in obese children with obstructive sleep apnea syndrome. Am J Respir Crit Care Med. 2011;183(6):782–787. doi:10.1164/rccm.201008-1249OC
50. Strauss T, Sin S, Marcus CL, et al. Upper airway lymphoid tissue size in children with sickle cell disease. Chest. 2012;142(1):94–100. doi:10.1378/chest.11-2013
51. Schwab RJ, Pasirstein M, Pierson R, et al. Identification of upper airway anatomic risk factors for obstructive sleep apnea with volumetric magnetic resonance imaging. Am J Respir Crit Care Med. 2003;168(5):522–530. doi:10.1164/rccm.200208-866OC
52. Fujioka M, Young LW, Girdany BR. Radiographic evaluation of adenoidal size in children: adenoidal-nasopharyngeal ratio. AJR Am J Roentgenol. 1979;133(3):401–404. doi:10.2214/ajr.133.3.401
53. Jeans WD, Fernando DC, Maw AR, Leighton BC. A longitudinal study of the growth of the nasopharynx and its contents in normal children. Br J Radiol. 1981;54(638):117–121. doi:10.1259/0007-1285-54-638-117
54. Haapaniemi JJ. Adenoids in school-aged children. J Laryngol Otol. 1995;109(3):196–202.
55. Springer C, Cooper DM, Wasserman K. Evidence that maturation of the peripheral chemoreceptors is not complete in childhood. Respir Physiol. 1988;74(1):55–64.
56. Gozal D, Arens R, Omlin KJ, Marcus CL, Keens TG. Maturational differences in step vs. ramp hypoxic and hypercapnic ventilatory responses. J Appl Physiol (1985). 1994;76(5):1968–1975. doi:10.1152/jappl.1994.76.5.1968
57. Marcus CL, Gozal D, Arens R, et al. Ventilatory responses during wakefulness in children with obstructive sleep apnea. Am J Respir Crit Care Med. 1994;149(3 Pt 1):715–721. doi:10.1164/ajrccm.149.3.8118641
58. Isono S, Tanaka A, Ishikawa T, Nishino T. Developmental changes in collapsibility of the passive pharynx during infancy. Am J Respir Crit Care Med. 2000;162(3 Pt 1):832–836. doi:10.1164/ajrccm.162.3.9911089
59. Marcus CL, Lutz J, Hamer A, Smith PL, Schwartz A. Developmental changes in response to subatmospheric pressure loading of the upper airway. J Appl Physiol. 1999;87(2):626–633. doi:10.1152/jappl.1999.87.2.626
60. Marcus CL, Moreira GA, Bamford O, Lutz J. Response to inspiratory resistive loading during sleep in normal children and children with obstructive apnea. J Appl Physiol (1985). 1999;87(4):1448–1454. doi:10.1152/jappl.1999.87.4.1448
61. Gileles-Hillel A, Kheirandish-Gozal L, Gozal D. Hemoglobinopathies and sleep–the road less traveled. Sleep Med Rev. 2015;24:57–70. doi:10.1016/j.smrv.2015.01.002
62. Rosen CL, DeBaun MR, Strunk RC, et al. Obstructive sleep apnea and sickle cell anemia. Pediatrics. 2014;134(2):273–281. doi:10.1542/peds.2013-4223
63. Sritippayawan S, Norasetthekul S, Nuchprayoon I, Deerojanawong J, Desudchit T, Prapphal N. Obstructive sleep apnea among children with severe beta-thalassemia. Southeast Asian J Trop Med Public Health. 2012;43(1):152–159.
64. Tan HL, Gozal D, Kheirandish-Gozal L. Obstructive sleep apnea in children: a critical update. Nat Sci Sleep. 2013;5:109–123.
65. Li KK, Kushida C, Powell NB, Riley RW, Guilleminault C. Obstructive sleep apnea syndrome: a comparison between Far-East Asian and white men. Laryngoscope. 2000;110(10 Pt 1):1689–1693. doi:10.1097/00005537-200010000-00022
66. Marcus CL, Omlin KJ, Basinki DJ, et al. Normal polysomnographic values for children and adolescents. Am Rev Respir Dis. 1992;146(5 Pt 1):1235–1239. doi:10.1164/ajrccm/146.5_Pt_1.1235
67. Fleck RJ, Shott SR, Mahmoud M, Ishman SL, Amin RS, Donnelly LF. Magnetic resonance imaging of obstructive sleep apnea in children. Pediatr Radiol. 2018;48(9):1223–1233. doi:10.1007/s00247-018-4180-2
68. Zaffanello M, Antoniazzi F, Tenero L, Nosetti L, Piazza M, Piacentini G. Sleep-disordered breathing in paediatric setting: existing and upcoming of the genetic disorders. Ann Transl Med. 2018;6(17):343. doi:10.21037/atm
69. Hill CM, Evans HJ, Elphick H, et al. Prevalence and predictors of obstructive sleep apnoea in young children with down syndrome. Sleep Med. 2016;27-28:99–106. doi:10.1016/j.sleep.2016.10.001
70. Ashworth A, Hill CM, Karmiloff-Smith A, Dimitriou D. Cross syndrome comparison of sleep problems in children with down syndrome and Williams syndrome. Res Dev Disabil. 2013;34(5):1572–1580. doi:10.1016/j.ridd.2013.01.031
71. Ashworth A, Hill CM, Karmiloff-Smith A, Dimitriou D. A cross-syndrome study of the differential effects of sleep on declarative memory consolidation in children with neurodevelopmental disorders. Dev Sci. 2017;20(2). doi:10.1111/desc.12383
72. Ashworth A, Hill CM, Karmiloff-Smith A, Dimitriou D. The importance of sleep: attentional problems in school-aged children with down syndrome and Williams syndrome. Behav Sleep Med. 2015;13(6):455–471. doi:10.1080/15402002.2014.940107
73. Uong EC, McDonough JM, Tayag-Kier CE, et al. Magnetic resonance imaging of the upper airway in children with down syndrome. Am J Respir Crit Care Med. 2001;163(3 Pt 1):731–736. doi:10.1164/ajrccm.163.3.2004231
74. Zucconi M, Weber G, Castronovo V, et al. Sleep and upper airway obstruction in children with achondroplasia. J Pediatr. 1996;129(5):743–749.
75. Arens R, Gozal D, Burrell BC, et al. Arousal and cardiorespiratory responses to hypoxia in Prader-Willi syndrome. Am J Respir Crit Care Med. 1996;153(1):283–287. doi:10.1164/ajrccm.153.1.8542130
76. Gozal D, Arens R, Omlin KJ, Ward SL, Keens TG. Absent peripheral chemosensitivity in Prader-Willi syndrome. J Appl Physiol (1985). 1994;77(5):2231–2236. doi:10.1152/jappl.1994.77.5.2231
77. Clarke GM, Higgins TN. Laboratory investigation of hemoglobinopathies and thalassemias: review and update. Clin Chem. 2000;46(8 Pt 2):1284–1290.
78. Beutler E, Waalen J. The definition of anemia: what is the lower limit of normal of the blood hemoglobin concentration? Blood. 2006;107(5):1747–1750. doi:10.1182/blood-2005-07-3046
79. Ruiz-Arguelles GJ. Altitude above sea level as a variable for definition of anemia. Blood. 2006;108(6):2131–2132. doi:10.1182/blood-2006-04-016352
80. Mclean E, Cogswell M, Egli I, Wojdyla D, de BB. Worldwide prevalence of anaemia, WHO vitamin and mineral nutrition information system, 1993-2005. Public Health Nutr. 2009;12(4):444–454. doi:10.1017/S1368980008002401
81. Connes P. Obstructive sleep apnea and sickle cell disease: towards hemorheological abnormalities and vascular dysfunction worsening. Sleep Med Rev. 2015;24:101–102. doi:10.1016/j.smrv.2015.01.007
82. DelRosso LM, Bruni O, Ferri R. Restless sleep disorder in children: a pilot study on a tentative new diagnostic category. Sleep. 2018;41(8). doi:10.1093/sleep/zsy024
83. Abakay O, Abakay A, Palanci Y, et al. Relationship between hepcidin levels and periodic limb movement disorder in patients with obstructive sleep apnea syndrome. Sleep Breath. 2015;19(2):459–466. doi:10.1007/s11325-014-1028-3
84. Zilberman M, Silverberg DS, Bits I, et al. Improvement of anemia with erythropoietin and intravenous iron reduces sleep-related breathing disorders and improves daytime sleepiness in anemic patients with congestive heart failure. Am Heart J. 2007;154(5):870–876. doi:10.1016/j.ahj.2007.07.034
85. Kapelushnik J, Shalev H, Schulman H, Moser A, Tamary H. Upper airway obstruction-related sleep apnea in a child with thalassemia intermedia. J Pediatr Hematol Oncol. 2001;23(8):525–526.
86. Tarasiuk A, Abdul-Hai A, Moser A, Freidman B, Tal A, Kapelushnik J. Sleep disruption and objective sleepiness in children with beta-thalassemia and congenital dyserythropoietic anemia. Arch Pediatr Adolesc Med. 2003;157(5):463–468. doi:10.1001/archpedi.157.5.463
87. Amini F, Borzabadi-Farahani A, Behnam-Roudsari G, Jafari A, Shahidinejad F. Assessment of the uvulo-glossopharyngeal dimensions in patients with beta-thalassemia major. Sleep Breath. 2013;17(3):943–949. doi:10.1007/s11325-012-0782-3
88. Telen MJ. Beyond hydroxyurea: new and old drugs in the pipeline for sickle cell disease. Blood. 2016;127(7):810–819. doi:10.1182/blood-2015-09-618553
89. Piel FB, Patil AP, Howes RE, et al. Global distribution of the sickle cell gene and geographical confirmation of the malaria hypothesis. Nat Commun. 2010;2(1):104. doi:10.1038/ncomms1104
90. Gulbis B, Eleftheriou A, Angastiniotis M, et al. Epidemiology of rare anaemias in Europe. Adv Exp Med Biol. 2010;686:375–396. doi:10.1007/978-90-481-9485-8_22
91. Streetly A, Latinovic R, Henthorn J. Positive screening and carrier results for the England-wide universal newborn sickle cell screening programme by ethnicity and area for 2005-07. J Clin Pathol. 2010;63(7):626–629. doi:10.1136/jcp.2010.077560
92. Rees DC, Williams TN, Gladwin MT. Sickle-cell disease. Lancet. 2010;376(9757):2018–2031. doi:10.1016/S0140-6736(10)61029-X
93. Kirkham FJ, Hewes DK, Prengler M, Wade A, Lane R, Evans JP. Nocturnal hypoxaemia and central-nervous-system events in sickle-cell disease. Lancet. 2001;357(9269):1656–1659.
94. Quinn CT, Sargent JW. Daytime steady-state haemoglobin desaturation is a risk factor for overt stroke in children with sickle cell anaemia. Br J Haematol. 2008;140(3):336–339. doi:10.1111/j.1365-2141.2007.06927.x
95. Dowling MM, Quinn CT, Ramaciotti C, et al. Increased prevalence of potential right-to-left shunting in children with sickle cell anaemia and stroke. Br J Haematol. 2017;176(2):300–308. doi:10.1111/bjh.14391
96. Kaleyias J, Mostofi N, Grant M, et al. Severity of obstructive sleep apnea in children with sickle cell disease. J Pediatr Hematol Oncol. 2008;30(9):659–665. doi:10.1097/MPH.0b013e31817eb7ef
97. Hollocks MJ, Kok TB, Kirkham FJ, et al. Nocturnal oxygen desaturation and disordered sleep as a potential factor in executive dysfunction in sickle cell anemia. J Int Neuropsychol Soc. 2012;18(1):168–173. doi:10.1017/S1355617711001469
98. Marshall MJ, Bucks RS, Hogan AM, et al. Auto-adjusting positive airway pressure in children with sickle cell anemia: results of a phase I randomized controlled trial. Haematologica. 2009;94(7):1006–1010. doi:10.3324/haematol.2008.005215
99. Katz T, Schatz J, Roberts CW. Comorbid obstructive sleep apnea and increased risk for sickle cell disease morbidity. Sleep Breath. 2018;22(3):797–804. doi:10.1007/s11325-018-1630-x
100. Sommet J, Alberti C, Couque N, et al. Clinical and haematological risk factors for cerebral macrovasculopathy in a sickle cell disease newborn cohort: a prospective study. Br J Haematol. 2016;172(6):966–977. doi:10.1111/bjh.13916
101. Tripathi A, Jerrell JM, Stallworth JR. Cost-effectiveness of adenotonsillectomy in reducing obstructive sleep apnea, cerebrovascular ischemia, vaso-occlusive pain, and ACS episodes in pediatric sickle cell disease. Ann Hematol. 2011;90(2):145–150. doi:10.1007/s00277-010-1048-4
102. Vichinsky EP, Neumayr LD, Earles AN, et al. Causes and outcomes of the acute chest syndrome in sickle cell disease. National Acute Chest Syndrome Study Group. N Engl J Med. 2000;342(25):1855–1865. doi:10.1056/NEJM200006223422502
103. Johnson MC, Kirkham FJ, Redline S, et al. Left ventricular hypertrophy and diastolic dysfunction in children with sickle cell disease are related to asleep and waking oxygen desaturation. Blood. 2010;116(1):16–21. doi:10.1182/blood-2009-06-227447
104. Onyekwere OC, Campbell A, Teshome M, et al. Pulmonary hypertension in children and adolescents with sickle cell disease. Pediatr Cardiol. 2008;29(2):309–312. doi:10.1007/s00246-007-9018-x
105. Needleman JP, Franco ME, Varlotta L, et al. Mechanisms of nocturnal oxyhemoglobin desaturation in children and adolescents with sickle cell disease. Pediatr Pulmonol. 1999;28(6):418–422.
106. Wittig RM, Roth T, Keenum AJ, Sarnaik S. Snoring, daytime sleepiness, and sickle cell anemia. Am J Dis Child. 1988;142(6):589.
107. Salles C, Ramos RT, Daltro C, Barral A, Marinho JM, Matos MA. Prevalence of obstructive sleep apnea in children and adolescents with sickle cell anemia. J Bras Pneumol. 2009;35(11):1075–1083.
108. Maddern BR, Reed HT, Ohene-Frempong K, Beckerman RC. Obstructive sleep apnea syndrome in sickle cell disease. Ann Otol Rhinol Laryngol. 1989;98(3):174–178. doi:10.1177/000348948909800302
109. Samuels MP, Stebbens VA, Davies SC, Picton-Jones E, Southall DP. Sleep related upper airway obstruction and hypoxaemia in sickle cell disease. Arch Dis Child. 1992;67(7):925–929.
110. Sharma S, Efird JT, Knupp C, et al. Sleep disorders in adult sickle cell patients. J Clin Sleep Med. 2015;11(3):219–223. doi:10.5664/jcsm.4530
111. Whitesell PL, Owoyemi O, Oneal P, et al. Sleep-disordered breathing and nocturnal hypoxemia in young adults with sickle cell disease. Sleep Med. 2016;22:47–49. doi:10.1016/j.sleep.2016.05.006
112. Raghunathan VM, Whitesell PL, Lim SH. Sleep-disordered breathing in patients with sickle cell disease. Ann Hematol. 2018;97(5):755–762. doi:10.1007/s00277-017-3199-z
113. Jordan LC, McKinstry RC
114. Chonat S, Saah E, Gera R, Scott-Emuakpor A, Kulkarni R. Co-occurrence of Chiari malformations and sickle cell disease-a diagnostic dilemma: a report of 4 cases and review of literature. J Pediatr Hematol Oncol. 2011;33(8):624–625. doi:10.1097/MPH.0b013e3182346ec3
115. Huang J, Pinto SJ, Allen JL, et al. Upper airway genioglossal activity in children with sickle cell disease. Sleep. 2011;34(6):773–778. doi:10.5665/SLEEP.1046
116. Salles C, Bispo M, Trindade-Ramos RT. Association between morphometric variables and nocturnal desaturation in sickle-cell anemia. J Pediatr (Rio J). 2014;90(4):420–425. doi:10.1016/j.jped.2014.01.005
117. Zhang SX, Searcy TR, Wu Y, Gozal D, Wang Y. Alternative promoter usage and alternative splicing contribute to mRNA heterogeneity of mouse monocarboxylate transporter 2. Physiol Genomics. 2007;32(1):95–104. doi:10.1152/physiolgenomics.00192.2007
118. Cakirer B, Hans MG, Graham G, Aylor J, Tishler PV, Redline S. The relationship between craniofacial morphology and obstructive sleep apnea in whites and in African-Americans. Am J Respir Crit Care Med. 2001;163(4):947–950. doi:10.1164/ajrccm.163.4.2005136
119. Rogers VE, Lewin DS, Winnie GB, Geiger-Brown J. Polysomnographic characteristics of a referred sample of children with sickle cell disease. J Clin Sleep Med. 2010;6(4):374–381.
120. L’Esperance VS, Ekong T, Cox SE, et al. Nocturnal haemoglobin oxygen desaturation in urban and rural East African paediatric cohorts with and without sickle cell anaemia: a cross-sectional study. Arch Dis Child. 2016;101(4):352–355. doi:10.1136/archdischild-2014-306468
121. Arens R, McDonough JM, Corbin AM, et al. Linear dimensions of the upper airway structure during development: assessment by magnetic resonance imaging. Am J Respir Crit Care Med. 2002;165(1):117–122. doi:10.1164/ajrccm.165.1.2107140
122. Vogler RC, Ii FJ, Pilgram TK. Age-specific size of the normal adenoid pad on magnetic resonance imaging. Clin Otolaryngol Allied Sci. 2000;25(5):392–395.
123. Parikh SR, Sadoughi B, Sin S, Willen S, Nandalike K, Arens R. Deep cervical lymph node hypertrophy: a new paradigm in the understanding of pediatric obstructive sleep apnea. Laryngoscope. 2013;123(8):2043–2049. doi:10.1002/lary.23748
124. Cappabianca S, Iaselli F, Negro A, et al. Magnetic resonance imaging in the evaluation of anatomical risk factors for pediatric obstructive sleep apnoea-hypopnoea: a pilot study. Int J Pediatr Otorhinolaryngol. 2013;77(1):69–75. doi:10.1016/j.ijporl.2012.09.035
125. Arens R, Sin S, McDonough JM, et al. Changes in upper airway size during tidal breathing in children with obstructive sleep apnea syndrome. Am J Respir Crit Care Med. 2005;171(11):1298–1304. doi:10.1164/rccm.200411-1597OC
126. Patini R, Arrica M, Di SE, Gallenzi P, Cordaro M. The use of magnetic resonance imaging in the evaluation of upper airway structures in paediatric obstructive sleep apnoea syndrome: a systematic review and meta-analysis. Dentomaxillofac Radiol. 2016;45(7):20160136. doi:10.1259/dmfr.20160136
127. Kim J, Bhattacharjee R, Dayyat E, et al. Increased cellular proliferation and inflammatory cytokines in tonsils derived from children with obstructive sleep apnea. Pediatr Res. 2009;66(4):423–428. doi:10.1203/PDR.0b013e3181b453e3
128. Goldbart AD, Goldman JL, Veling MC, Gozal D. Leukotriene modifier therapy for mild sleep-disordered breathing in children. Am J Respir Crit Care Med. 2005;172(3):364–370. doi:10.1164/rccm.200408-1064OC
129. Goldbart AD, Veling MC, Goldman JL, Li RC, Brittian KR, Gozal D. Glucocorticoid receptor subunit expression in adenotonsillar tissue of children with obstructive sleep apnea. Pediatr Res. 2005;57(2):232–236. doi:10.1203/01.PDR.0000150722.34561.E6
130. Vaishya R, Agarwal AK, Edomwonyi EO, Vijay V. Musculoskeletal manifestations of sickle cell disease: a review. Cureus. 2015;7(10):e358. doi:10.7759/cureus.268
131. Collins WO, Younis RT, Garcia MT. Extramedullary hematopoiesis of the paranasal sinuses in sickle cell disease. Otolaryngol Head Neck Surg. 2005;132(6):954–956. doi:10.1016/j.otohns.2004.07.007
132. Arun RM, Lakkakula BV, Chitharanjan AB. Role of myosin 1H gene polymorphisms in mandibular retrognathism. Am J Orthod Dentofacial Orthop. 2016;149(5):699–704. doi:10.1016/j.ajodo.2015.10.028
133. Halbower AC, McGinley BM, Smith PL. Treatment alternatives for sleep-disordered breathing in the pediatric population. Curr Opin Pulm Med. 2008;14(6):551–558. doi:10.1097/MCP.0b013e3283130f80
134. Hargrave DR, Wade A, Evans JP, Hewes DK, Kirkham FJ. Nocturnal oxygen saturation and painful sickle cell crises in children. Blood. 2003;101(3):846–848. doi:10.1182/blood-2002-05-1392
135. Lehmann G, Bell TR, Kirkham FJ, et al. Enuresis associated with sleep disordered breathing in children with sickle cell anemia. J Urol. 2012;188(4 Suppl):1572–1576. doi:10.1016/j.juro.2012.02.021
136. L’Esperance VS, Cox SE, Simpson D, et al. Peripheral vascular response to inspiratory gasp in paediatric sickle cell anaemia. Exp Physiol. 2013; 98(1):49–56. doi:10.1113/expphysiol.2011.064055
137. Ohene-Frempong K, Weiner SJ, Sleeper LA, et al. Cerebrovascular accidents in sickle cell disease: rates and risk factors. Blood. 1998;91(1):288–294.
138. Robertson PL, Aldrich MS, Hanash SM, Goldstein GW. Stroke associated with obstructive sleep apnea in a child with sickle cell anemia. Ann Neurol. 1988;23(6):614–616. doi:10.1002/ana.410230615
139. Davies SC, Stebbens VA, Samuels MP, Southall DP. Upper airways obstruction and cerebrovascular accident in children with sickle cell anaemia. Lancet. 1989;2(8657):283–284.
140. Kirkham FJ, Datta AK. Hypoxic adaptation during development: relation to pattern of neurological presentation and cognitive disability. Dev Sci. 2006;9(4):411–427. doi:10.1111/j.1467-7687.2006.00507.x
141. Setty BN, Stuart MJ, Dampier C, Brodecki D, Allen JL. Hypoxaemia in sickle cell disease: biomarker modulation and relevance to pathophysiology. Lancet. 2003;362(9394):1450–1455. doi:10.1016/S0140-6736(03)14689-2
142. Quinn CT, Variste J, Dowling MM. Haemoglobin oxygen saturation is a determinant of cerebral artery blood flow velocity in children with sickle cell anaemia. Br J Haematol. 2009;145(4):500–505. doi:10.1111/j.1365-2141.2009.07652.x
143. Makani J, Kirkham FJ, Komba A, et al. Risk factors for high cerebral blood flow velocity and death in Kenyan children with sickle cell anaemia: role of haemoglobin oxygen saturation and febrile illness. Br J Haematol. 2009;145(4):529–532. doi:10.1111/j.1365-2141.2009.07660.x
144. Dlamini N, Saunders DE, Bynevelt M, et al. Nocturnal oxyhemoglobin desaturation and arteriopathy in a pediatric sickle cell disease cohort. Neurology. 2017;89(24):2406–2412. doi:10.1212/WNL.0000000000004728
145. Schwab RJ, Pasirstein M, Kaplan L, Pierson R, Mackley A, Hachadoorian R, et al. Family aggregation of upper airway soft tissue structures in normal subjects and patients with sleep apnea. Am J Respir Crit Care Med. 2006;173(4):453–463
146. Nandalike K, Shifteh K, Sin S, Strauss T, Stakofsky A, Gonik N, et al. Adenotonsillectomy in obese children with obstructive sleep apnoea syndrome: magnetic resonance imaging findings and considerations. Sleep. 2013;3(6):841–847
147. Schwab RJ, Kim C, Bagchi S, Keenan BT, Comyn FL, Wang S et al. Understanding the anatomic basis for obstructive sleep apnea syndrome in adolescents. Am J Resp Crit Care Med. 2015;1:191(11):1295–1309
148. Tong Y, Udupa JK, Sin S, Liu Z, Wileyto EP, Drew A et al. MR Image Analytics to Characterize the Upper Airway Structure in Obese Children with Obstructive Sleep Apnea Syndrome. PLoS One. 2016;11(8):e0159327
Supplementary materials
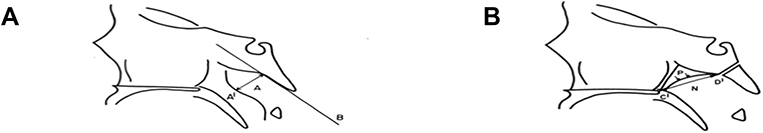 |
Figure S1 (A) Adenoidal measurements. “A” represents distance from A1 point of maximal convexity, along inferior margin of adenoid shadow to line B,drawn along straight part of anterior margin of basiocciput. “A” is measured along line perpendicular from point A1 to its intersection with B. (B) Nasopharyngeal measurement. “N” is distance between C1 posterior superior edge of hard palate, and D1, anteroinferior edge of sphenobasiocciptal synchondrosis. When synchondrosis is not clearly visualised, point D1 can be determined as site of crossing posteroinferior margin of lateral pterygoid plates P and floor of bony nasopharyndx.Note: Reprinted from Radiographic evaluation of adenoidal size in children: Adenoidal-nasopharyngeal ratio. Am J Roentgenol, Fujioka M, Young LW, Girdany BR, the American Journal of Roentgenology 133(3), Copyright© 1979, American Roentgen Ray Society.52 |
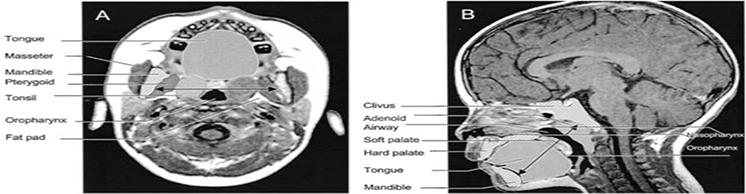 |
Figure S2 (A) Anatomical outlines of an axial T1 image at the level of the maximal tonsillar area of a control Subject. Transverse black arrow represents the intermandibular distance. (B) Anatomical outlines of a midsagittal T1 image of a control subject. Oblique black arrow represents the mental spine-clivus oblique distance.Note: Reprinted with permission of the American Thoracic Society. Copyright © 2020 American Thoracic Society. Arens R, McDonough JM, Costarino AT, Mahboubi S, Tayag-Kier CE, Maislin G, et al. 2001. Magnetic resonance imaging of the upper airway structure of children with obstructive sleep apnea syndrome. Am J Respir Crit Care Med. 4. 698–703. Official journal of the American Thoracic Society.47 |
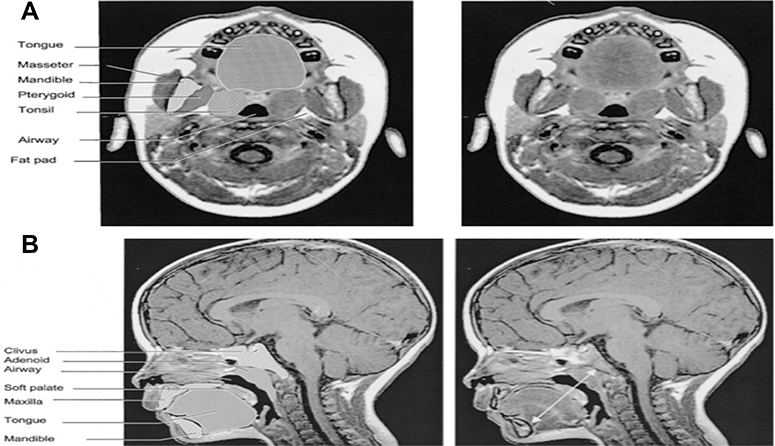 |
Figure S3 (A) T1-weighted axial image at the retropalated level (right) and segmented regions of interest (left) of a control subject. (B) Midsagittal T1-weighted image with mental spine-clivus distance shown (right) and segmented regions of interest (left) of a control subject.Note: Reprinted with permission of the American Thoracic Society. Copyright © 2020 American Thoracic Society. Uong EC, McDonough JM, Tayag-Kier CE, Zhao H, Haselgrove J, Mahboubi S, et al. 2001. Magnetic resonance imaging of the upper airway in children with Down syndrome. Am J Respir Crit Care Med. 163. 731–736. Official journal of the American Thoracic Society.73 |
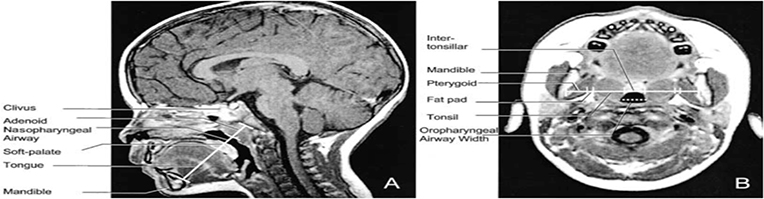 |
Figure S4 (A) Mid-sagittal T1-weighted image with mental spine-clivus oblique line shown (white line). Linear measurements were obtained along this line. (B) Axial T1-weighted image at the level of maximal tonsillar cross-sectional area. Note the transverse intermandibular line (white line) passing the center of each tonsil. Linear measurements were obtained along this axis. Maximal oropharyngeal width was obtained on this plane (dotted white line).Note: Reprinted with permission of the American Thoracic Society. Copyright © 2020 American Thoracic Society. Arens R, McDonough JM, Corbin AM, Hernandez ME, Maislin G, Schwab RJ, et al. 2002. Linear dimensions of the upper airway structure during development: Assessment by magnetic resonance imaging. Am J Respir Crit Care Med. 165.117–22. Official journal of the American Thoracic Society.121 |
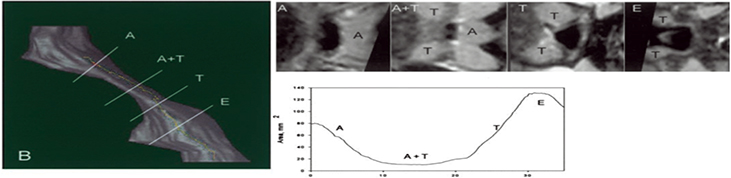 |
Figure S5 Left: three-dimensional display of an upper airway and its centerline in a subject with OSAS. Top right: gray-level two-dimansional scene of the cross-section of the airway orthogonal to the centerline at marker locations: A = adenoid; A + T = adenoid and tonsil overlap; T = tonsils; E = epiglottis. Bottom right: plot of the cross-sectional area function.Note: Reprinted with permission of the American Thoracic Society. Copyright © 2020 American Thoracic Society. Arens R, McDonough JM, Corbin AM, Rubin NK, Carroll ME, Pack AI, et al. 2003. Upper airway size analysis by magnetic resonance imaging of children with obstructive sleep apnea syndrome. Am J Respir Crit Care Med. 167. 65–70. Official journal of the American Thoracic Society.48 |
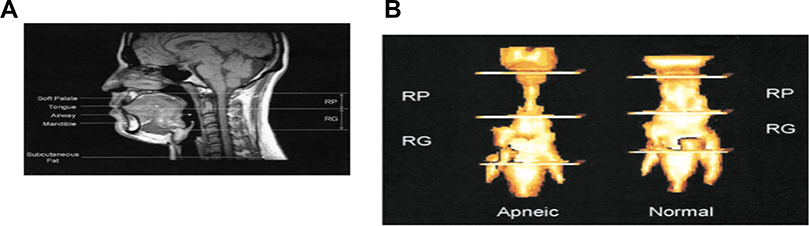 |
Figure S6 (A) Midsagittal magnetic resonance image (MRI) of a normal subject, demonstrating the upper airway regions: retropalatal (RP) — from the level of the hard palate to the caudal margin of the soft palate; and retroglossal (RG) — from the caudal margin of the soft palate to the base of the epiglottis. Soft palate, tongue, airway, mandible, and subcutaneous fat are denoted with arrows. Fat is bright (white) on an MRI. (B) Representative three dimensional upper airway volume in a patient with sleep apnea (left) and in a normal subject (right). Note that the upper airway volume is smaller in the RP region than in the RG region in both subjects and that the length of the total airway and the individual regions (RP/RG) is not equivalent between the apneic and normal subjects. Airway volume is smaller in the RP region in this apneic subject compared with the control subject; airway volume is similar in the RG region in this apneic subject compared with the control subject.Note: Reprinted with permission of the American Thoracic Society. Copyright © 2020 American Thoracic Society. Schwab RJ, Pasirstein M, Pierson R, Mackley A, Hachadoorian R, Arens R, et al. 2003. Identification of upper airway anatomic risk factors for obstructive sleep apnea with volumetric magnetic resonance imaging. Am J Respir Crit Care Med. 168. 522–30. Official journal of the American Thoracic Society.51 |
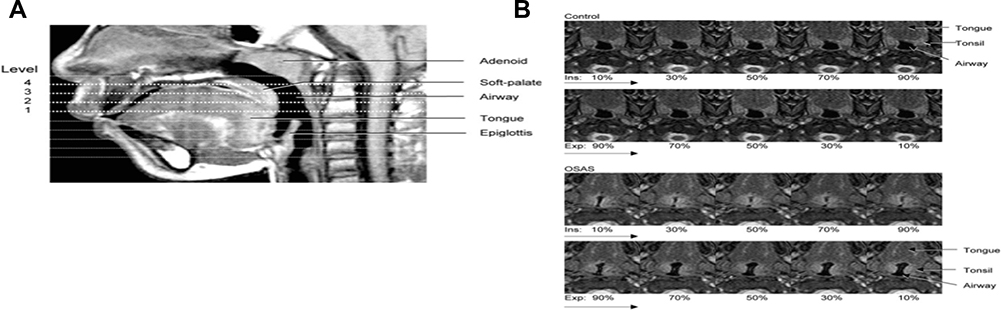 |
Figure S7 (A) Midsagittal magnetic resonance image demonstrating the four ascending levels for analysis (thick dotted lines). Level 1 is 4 mm above tip of epiglottis. (B) Dynamic changes in cross-sectional area at midtonsillar level (level 2) during tidal breathing (5-vol increments of inspiration [ins], 5-vol increments of expiration [Exp]) of control subjects (top panels) and subjects with OSAS (bottom panels). Note difference in anteroposterior (A-P) and lateral airway dimension.Note: Reprinted with permission of the American Thoracic Society. Copyright © 2020 American Thoracic Society. Arens R, Sin S, McDonough JM, Palmer JM, Dominguez T, Meyer H, et al. 2005. Changes in upper airway size during tidal breathing in children with obstructive sleep apnea syndrome. Am J Respir Crit Care Med. 171. 1298–304. Official journal of the American Thoracic Society.125 |
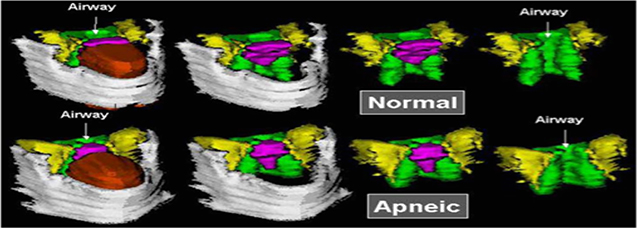 |
Figure S8 Volumetric reconstructions from a series of 3-mm contiguous axial magnetic resonance (MR) images of the mandible (gray), tongue (orange/rust), soft palate (pink/purple), lateral parapharyngeal fat pads (yellow), and lateral/posterior pharyngeal walls (green) in a normal subject (top panel) and in a patient with sleep apnea (bottom panel). The upper airway is larger in the normal subject than in the patient with apnea. In addition, the tongue, lateral parapharyngeal fat pads, and lateral pharyngeal walls are larger in the patient with apnea. Note: Reprinted with permission of the American Thoracic Society. Copyright © 2020 American Thoracic Society. Schwab RJ, Pasirstein M, Kaplan L, Pierson R, Mackley A, Hachadoorian R, et al. 2006. Family aggregation of upper airway soft tissue structures in normal subjects and patients with sleep apnea. Am J Respir Crit Care Med. 173. 453–63. Official journal of the American Thoracic Society.145 |
 |
Figure S9 Upper airway, soft tissues, and mandibular reconstructions. Head and neck surface rensering with three-dimensional reconstructions of the upper airway, soft tissues, and mandible of a subject with obstructive sleep apnea syndrome in various views: lateral (top left), anterior oblique (bottom right). Airway (light blue), tongue (brown), mandible (white), nodes (red), and deep cervical nodes (green). Note: Reprinted with permission of the American Thoracic Society. Copyright © 2020 American Thoracic Society. Arens R, Sin S, Nandalike K, Rieder J, Khan UI, Freeman K, et al. 2011. Upper airway structure and body fat composition in obese children with obstructive sleep apnea syndrome. Am J Respir Crit Care Med. 183. 782–787. Official journal of the American Thoracic Society.49 |
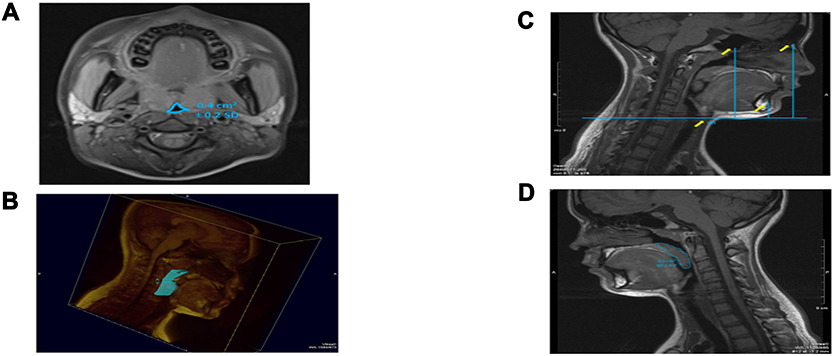 |
Figure S10 (A) CSA oropharyngeal airway. (B) Combined upper airway volume, T1 weighted axial scan. (C) Transverse line perpendicular to the floor passing through the hyoide to nasion, to sella to supramentale. (D) Midsagittal palatal CSA. Note: Reprinted from Int J Pediatr Otorhinolaryngol, 77(1), Cappabianca S, Iaselli F, Negro A, et al., Magnetic resonance imaging in the evaluation of anatomical risk factors for pediatric obstructive sleep apnoea-hypopnoea: a pilot study, 69–75, Copyright 2013, with permission from Elsevier.124 |
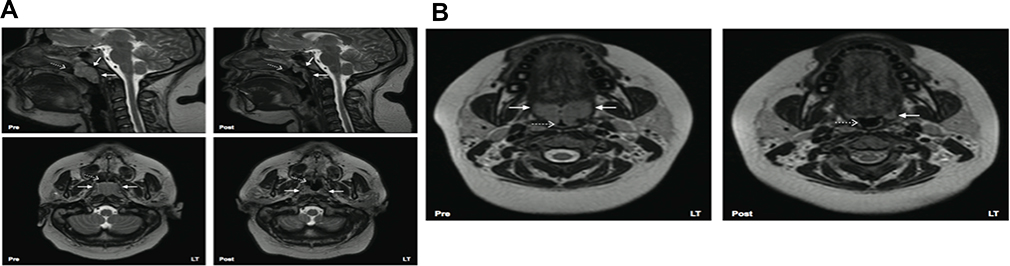 |
Figure S11 (A) Left 4 images. Mid sagittal (top) and axial T2-weighted images at the level of the nasopharynx (bottom), of a patient before (left) and after (right) adenotonsillectomy. Solid white arrows indicate adenoid tissue (gray) and dotted arrows indicate nasopharyngeal airway.Note residual adenoidal tissue and larger airway after adenoidal tissue and larger airway after adeniodectomy. In this example, a 29% reduction in adenoid volume was noted on MRI. (B) Right 2 images. Axial T2-weighted images at the level of the oropharynx of a patient before (left) and after (right) adenotonsillectomy. Solid white arrows indicate tonsillar tissue (gray) and dotted arrows indicate oropharyngeal airway. Note the larger airway and small left residual tonsil tissue after tonsillectomy. Note: Reprinted from CHEST, 142(1), Strauss T, Sin S, Marcus CL, Mason TBA, McDonough JM, Allen JL, et al., Upper airway lymphoid tissue size in children with sickle cell disease, 94-100, Copyright 2012, with permission from Elsevier.50 |
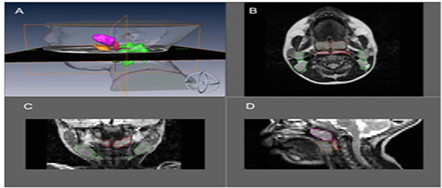 |
Figure S12 MRI volumetric analysis of lymphoid tissue volumes in an OSA patient (green-upper jugular lymph nodes, orange-tonsil tissue, red-retropharyngeal lymph nodes, magenta-adenoid tissue). (A) Three dimensional reconstruction of lymphoid tissue using Amira® software. (B) Axial T2-weighted DICOM image with lymphoid tissue tracings. (C) Coronal T2-weighted DICOM image with lymphoid tissue tracings. (D) Sagittal T2-weighted DICOM image with lymphoid tissue tracings.Note: Nandalike K, Shifteh K, Sin S, Strauss T, Stakofsky A, Gonik N et al., Adenotonsillectomy in obese children with obstructive sleep apnoea syndrome: magnetic resonance imaging findings and considerations, SLEEP, 2013, 36, 6, 841-847, by permission of Oxford University Press.146 |
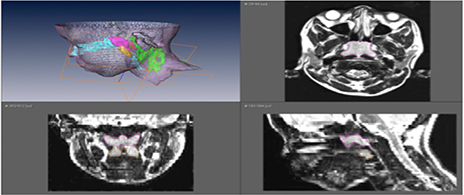 |
Figure S13 Upper airway, soft tissues, and mandibular reconstructions. Head and neck surface rendering with three-dimensional reconstructions of the upper airway, soft tissues, and mandible of a subject with obstructive sleep apnea syndrome in various views:lateral (top left), anterior oblique (top right), superior oblique (bottom left) and posterior (bottom right). Airway (light blue), tongue (brown), mandible (white), soft palate (blue), tonsils (yellow), adenoid (magenta), retropharyngeal nodes (red), and deep cervical nodes (green).Note: Copyright ©2003. John Wiley and Sons. Reproduced from Parikh SR, Sadoughi B, Sin S, Willen S, Nandalike K, Arens R. Deep cervical lymph node hypertrophy: A new paradigm in the understanding of pediatric obstructive sleep apnea. Laryngoscope. 2013;123(8):2043–9.123 |
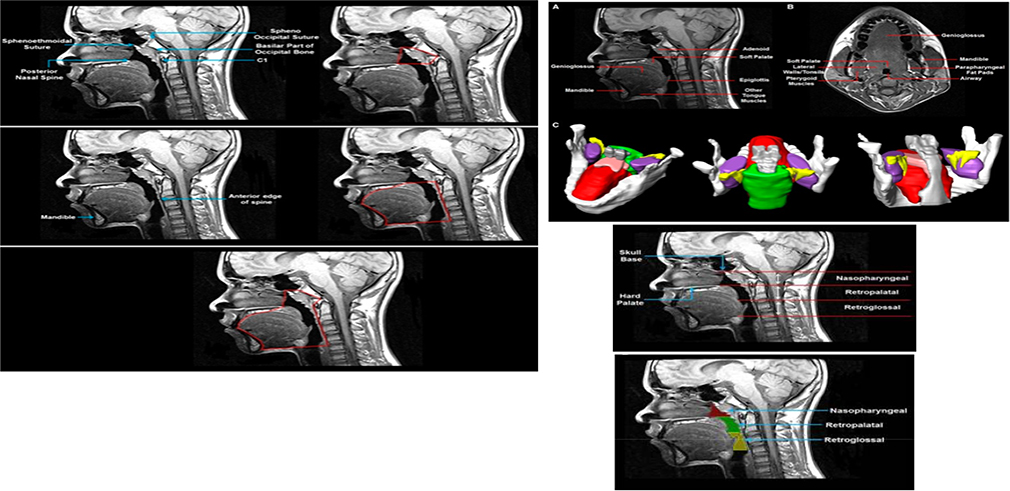 |
Figure S14 Anatomical definitions of upper airway landmarks on midsaggital and axial slices with 3D reconstruction of regions of interest. Note: Reprinted with permission of the American Thoracic Society. Copyright © 2020 American Thoracic Society. Schwab RJ, Kim C, Bagchi S, Keenan BT, Comyn FL, Wang S et al. 2015. Understanding the anatomic basis for obstructive sleep apnea syndrome in adolescents. Am J Resp Crit Care Med. 191. 1295-1309. Official journal of the American Thoracic Society.147 |
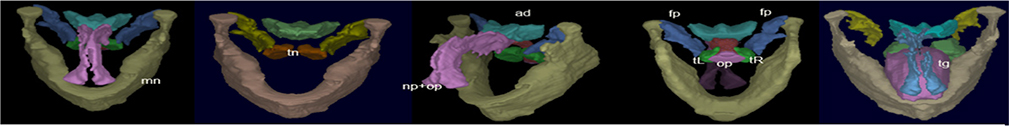 |
Figure S15 3D surface renditions of objects: np (nasopharynx), op (oropharynx), mn (mandible), tn (tonsils), tL & tR (left and right (tonsil), fp (fat pad), ad (adenoid), tg (tongue).Note: Copyright ©2016. PLoS One. Reproduced from Capovilla G, Beccaria F, Montagnini A, et al. Tong Y, Udupa JK, Sin S, Liu Z, Wileyto EP, Drew A et al. MR Image Analytics to Characterize the Upper Airway Structure in Obese Children with Obstructive Sleep Apnea Syndrome. PLoS One 2016; 11(8):e0159327.148 |
 © 2020 The Author(s). This work is published and licensed by Dove Medical Press Limited. The full terms of this license are available at https://www.dovepress.com/terms.php and incorporate the Creative Commons Attribution - Non Commercial (unported, v3.0) License.
By accessing the work you hereby accept the Terms. Non-commercial uses of the work are permitted without any further permission from Dove Medical Press Limited, provided the work is properly attributed. For permission for commercial use of this work, please see paragraphs 4.2 and 5 of our Terms.
© 2020 The Author(s). This work is published and licensed by Dove Medical Press Limited. The full terms of this license are available at https://www.dovepress.com/terms.php and incorporate the Creative Commons Attribution - Non Commercial (unported, v3.0) License.
By accessing the work you hereby accept the Terms. Non-commercial uses of the work are permitted without any further permission from Dove Medical Press Limited, provided the work is properly attributed. For permission for commercial use of this work, please see paragraphs 4.2 and 5 of our Terms.