")
Back to Journals » Nature and Science of Sleep » Volume 12
Sleep and Methylation of Estrogen Receptor Genes, ESR1 and GPER, in Healthy Middle-Aged and Older Women: Findings from the Women 40+ Healthy Aging Study
Authors Gardini ES, Fiacco S, Mernone L, Ehlert U
Received 6 April 2020
Accepted for publication 6 July 2020
Published 27 July 2020 Volume 2020:12 Pages 525—536
DOI https://doi.org/10.2147/NSS.S256102
Checked for plagiarism Yes
Review by Single anonymous peer review
Peer reviewer comments 3
Editor who approved publication: Dr Sutapa Mukherjee
Elena S Gardini,1,2 Serena Fiacco,1,2 Laura Mernone,1,2 Ulrike Ehlert1,2
1Clinical Psychology and Psychotherapy, University of Zurich, Zurich, Switzerland; 2University Research Priority Program (URPP) Dynamics of Healthy Aging, University of Zurich, Zurich, Switzerland
Correspondence: Ulrike Ehlert
Clinical Psychology and Psychotherapy, University of Zurich, Binzmühlestrasse 14, Zurich 8050, Switzerland
Tel +41 44 635 73 50
Fax +41 44 635 73 59
Email [email protected]
Purpose: Sleep problems in middle-aged and older women are very common and have been associated with menopause-related changes in estrogen levels. However, not all women experience sleep problems as they enter perimenopause, and epigenetic mechanisms might contribute to the differences in sleep quality within this population. In this study, we hypothesized that increased methylation of two estrogen receptor (ER) genes (ESR1 and GPER) would be associated with increased sleep problems in healthy pre-, peri-, and postmenopausal women, either directly or indirectly through the experience of vasomotor symptoms (VMS).
Materials and Methods: In 130 healthy women aged 40– 73 years, we assessed DNA methylation from dried blood spots (DBS). Women rated their sleep quality using the Pittsburgh Sleep Quality Index (PSQI), and VMS using the Menopause Rating Scale (MRS).
Results: Higher percentage methylation of ESR1 was associated with increased sleep problems, mediated by VMS, even after controlling for age, menopausal status, body mass index, estradiol levels, depressive symptoms, and caffeine consumption. There was no significant association between GPER methylation and either sleep problems or VMS.
Conclusion: The study findings support an association between increased ESR1 methylation and sleep problems through increased VMS among healthy women aged 40– 73 years.
Keywords: sleep problems, VMS, ESR1, GPER, DNA methylation, healthy middle-aged and older women
Introduction
Sleep is an important determinant of quality of life during aging, even among healthy individuals.1,2 Sleep problems in the form of insomnia, difficulty falling asleep, lower sleep efficiency, or frequent and early awakening become increasingly common with advancing age, and affect as many as 40–56% of middle-aged and older women.3 Menopausal status (MS) is strongly associated with sleep problems, with peri- and postmenopausal women reporting more sleep problems than premenopausal women.4 Changes in levels of ovarian hormones such as estrogens are important contributors to the occurrence and severity of sleep problems as women enter perimenopause.5 Indeed, besides their role in women’s reproductive functions, estrogens exert a vast range of biological effects. In the central nervous system, estrogens contribute to the control of circadian rhythms and body temperature,5,6 and their declining and fluctuating levels have been repeatedly associated with sleep problems and vasomotor symptoms (VMS).5–10 VMS, such as hot flashes and night sweats, are primarily thermoregulatory phenomena and are the main cause of sleep problems.3,11 Although VMS are a hallmark of perimenopause, they can persist for several years after the last menstrual period. Therefore, they may continue to affect sleep even in advanced age.12 However, while all aging women experience major hormonal changes, not all women experience increased sleep problems.13 This suggests that genetic and environmental factors may play a role in the exacerbation of sleep problems among middle-aged and older women.14–18
Epigenetic modifications are increasingly recognized as potential mechanisms underlying the etiology and phenotypic variation of multiple diseases.19 It has also been suggested that epigenetic modifications may constitute underlying mechanisms of the gene-environment interplay affecting sleep and menopause-related symptoms.14,20,21 DNA methylation is a key epigenetic mechanism, which regulates gene expression through DNA modifications at cytosines in cytosine-guanine dinucleotides (CpGs).22 Increased DNA methylation of regulatory regions of estrogen receptor (ER) genes has been shown to decrease levels of ERs.6,23,24 ERs mediate the effects of estrogens in the body, including the estrogenic contributions to the control of circadian rhythms and body temperature.25–27 While the ERα and the ERβ mainly mediate the genomic effects of estrogens, the more recently discovered G protein-coupled estrogen receptor 1 (GPER) mediates rapid non-genomic estrogen effects.28 Several lines of evidence from animal studies indicate that decreased levels of the three ERs may contribute to increase sleep problems and VMS.29–31
To the best of our knowledge, no study has yet investigated the associations between ER gene methylation and sleep problems in middle-aged and older women. DNA methylation levels of specific regions of ER genes may contribute to alter sleep quality among women as they reach midlife. Therefore, in this study, we hypothesized that increased levels of ER gene methylation would be associated with increased sleep problems in healthy pre-, peri-, and postmenopausal women, either directly, or indirectly through VMS. We focused on the ERα gene (ESR1) and GPER gene (GPER) based on knowledge of the involvement of both genomic and non-genomic estrogen effects in sleep problems and VMS, and given the presumed greater role of ERα compared to ERβ in controlling circadian rhythms and body temperature in women.29,32
Materials and Methods
Inclusion and Exclusion Criteria
Women who took part in this study were recruited in the context of a larger investigation, the “Women 40+ Healthy Aging Study”.33–36 Women were recruited using flyers, social media (eg: Facebook), and journal articles. The prospective participants completed an online self-screening to verify their eligibility for the study. Women were included in the study if they reported being free of any acute or chronic somatic disease or mental disorder, and if they had not received any psychotherapeutic or psychopharmacological treatment during the last 6 months. In addition, women had to report good, very good, or excellent subjective health status. Further exclusion criteria were a pregnancy in the last 6 months, menopause due to surgical removal of the ovaries or the uterus, premature menopause, current use of oral contraceptives or hormone therapy. After completion of the online self-screening, eligible women were reached telephonically by a member of the study team. The telephone call aimed, first, to ensure that only women suitable for the study were included, and second, to answer open questions about the study procedure. Participants were invited to a laboratory session during which saliva and blood samples were collected. All sessions started at 7:45 a.m. and followed a standardized protocol.
Participants
In total, 130 healthy Caucasian women aged 40–73 years took part in the study. The women lived in Switzerland, and the majority were Swiss or from a German-speaking neighboring country. Most of the women were married or living together with their partner (68.5%), and had vocational education or a college/university degree (79.2%). Participants were divided into three subgroups with respect to their MS according to the Stages of Reproductive Aging Workshop +10 (STRAW) criteria:37 1) premenopausal (39.2%, n= 51), if the menstrual cycle was regular, 2) perimenopausal (12.3%, n= 16), if the cycle length was variable, with a variability among cycles of at least 7 days, or if the interval between cycles was > 60 days, and 3) postmenopausal (48.5%, n= 63), if no bleeding had occurred in at least the last 12 months. Women using hormone therapies for reducing menopausal symptoms were excluded during the online self-screening. After enrolment, women were screened for the use of other medications. Five women reported taking botanical therapies such as Cimifemin® (2), Cimifemin® forte (1), Premens (1), and a plant-based preparation (no pharmaceutical name provided; 1). In addition, one woman reported taking Eltroxin (hypothyroidism) and one woman reported taking Tamoxifen (breast cancer prevention). The results were not affected by the exclusion of these participants from the statistical analyses, and the sample of this study includes participants reporting the use of the above-mentioned medications. After receiving written and oral information about the study, all participants signed written informed consent forms. The study (BASEC Nr 2016–01591) was evaluated by the cantonal ethics committee of the Canton of Zürich (KEK Zürich, Zürich, Switzerland). Approval from the cantonal ethics committee was not required because the assessment of relationships between biological and physiological parameters in healthy aging individuals was not considered to fall within the scope of the “Humanforschungsgesetz” (HFG) (Art. 2 HFG and Art. 3 HFG).
Sleep Problems
Sleep problems were assessed using the German version of the Pittsburgh Sleep Quality Index (PSQI).38 The scale assesses sleep problems over a one-month time interval and comprises 19 items combined into seven component scores: perceived sleep quality (“how would you rate your sleep quality overall”?), sleep latency (eg: “cannot get to sleep within 30 minutes”), sleep duration (“how many hours of actual sleep do you get at night”?), sleep efficiency (number of hours slept/number of hours spent in bed), sleep disturbances (eg: “wake up in the middle of the night or early morning”, “had bad dreams”), use of sleep medication (eg: “how often have you taken medicines to help you sleep”?), and daytime dysfunction (eg: “how much of a problem has it been for you to keep up enough enthusiasm to get things done?”). Each component is weighted equally from 0 to 3, and the seven component scores are summed up to obtain a total score ranging from 0 to 21. A score above 5 is considered a marker of sleep problems. The single total score is frequently used in the literature, and acceptable reliability and validity in different populations have been reported.39 However, the model including only perceived sleep quality, sleep efficiency and daytime dysfunction (3-factor model) seems to better reflect good versus poor sleep quality in healthy peri- and early postmenopausal women with hot flashes, and in older adults.39,40 Therefore, in the statistical analyses of the present study, we used both the total score and the 3-factor model of the PSQI.
Descriptive statistics of sleep problems in the overall sample and based on menopausal groups are reported in Table 1.
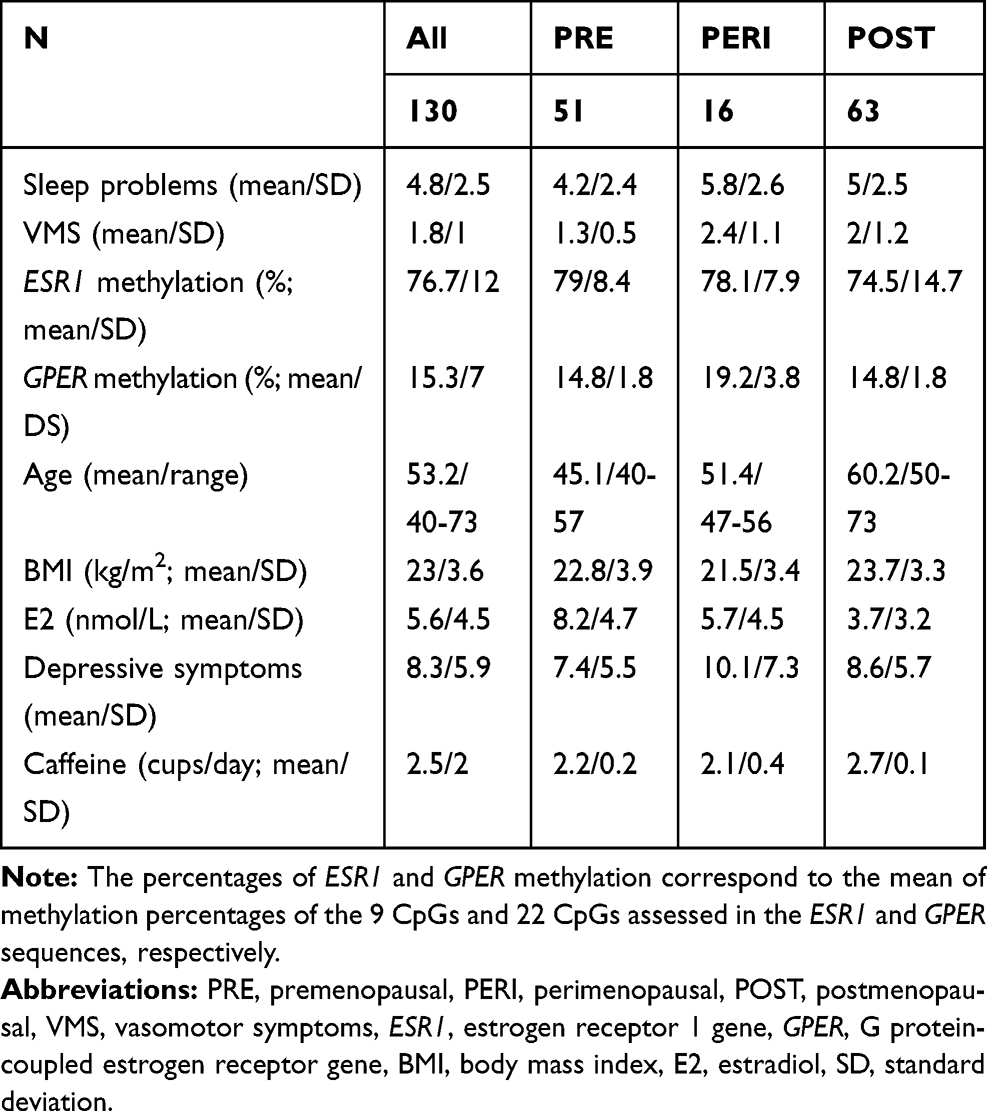 |
Table 1 Descriptive Statistics |
Vasomotor Symptoms
VMS were measured using one item (“hot flashes/sweating”) of the somato-vegetative subscale of the German version of the Menopause Rating Scale (MRS).41 VMS are rated on a 5-point Likert scale, ranging from “0” (no symptoms) to “4” (very severe symptoms). The prevalence of VMS was assessed as follows: 0 (no symptoms), 1–4 (symptoms). Descriptive statistics of VMS for all women and separately for menopausal groups are reported in Table 1.
Blood Sampling
Blood samples were collected at 8:00 am during the laboratory session at the University of Zurich under standardized conditions. For pre- and perimenopausal women, sampling was conducted in the early follicular phase. Blood was collected from fingertips and spotted onto S&S 903 Whatman® paper cards (GE Healthcare, Little Chalfont, Buckinghamshire, United Kingdom), following the manufacturer’s instructions. Blood spots were dried at room temperature for approximately 3 h. Dried blood spots (DBS) were stored at −20°C until biochemical analysis.
DNA Methylation
Genomic DNA was extracted from DBS, using the QIAamp DNA Investigator Kit (QIAGEN, Hilden, Germany), according to the manufacturer’s instructions, and eluted in a final volume of 30 μL of RNase-free water. We obtained a total DNA yield ranging from 41 to 168 ng, as measured with Qubit (Thermo Fischer Scientific, Waltham, MA, USA). The DBS technology was reported to provide highly reliable results in the context of methylation studies.42 Genomic DNA (41–168 ng) was bisulfite-converted using the EZ 96-DNA Methylation-Gold kit (Zymo Research, Irvine, CA, USA) and eluted in 20 ul of water. A first amplification was performed on the bisulfite-converted DNA using the Kapa HIFI Uracil+ master mix and primers that were designed manually or using the MethPrimer software.43 Primers (Table 2) included the universal primer sequences CS1/CS2 at the 5ʹ ends of the forward and reverse primers, and were designed in order to target a specific sequence of the ESR1 shore of promoter C (hg 38; chr6:151805523–151805822, Figure 1A) and the GPER promoter (hg 38; chr7:1087059 −1087533, Figure 1B). DNA methylation in these regions was previously associated with altered gene expression and function.44,45 The PCR was performed with the following parameters: 95°C for 3 min [98°C for 20 sec – annealing temperature for 15 sec – 72°C for 15 sec] x 40 cycles, 72°C for 40 sec. In order to certify that primers were specifically amplifying bisulfite-converted DNA, genomic DNA was included in the PCR, and complete conversion was confirmed by including wild primers. Next, the PCR amplicons were purified using the E-gels 2% size selection (Thermo Fisher Scientific, Waltham, MA, USA). Purified amplicons were indexed with a single barcode (Fluidigm, San Francisco, California, USA) using a second PCR of 10 cycles (annealing temperature, 60°C). Indexed amplicons were pooled and again purified. The purified library was then quantified using the Agilent 2200 Tape Station instrument, with HS DNA 1000 reagents (Agilent Scientific Instruments, Santa Clara, CA, USA), and finally diluted to the concentration of 2nM. The final library was denatured in NaOH, mixed with 12% PhiX, diluted to 12 pM in HT1 buffer, and finally sequenced on an Illumina MiSeq sequencer using the v3 kit (300 base pairs paired-end).
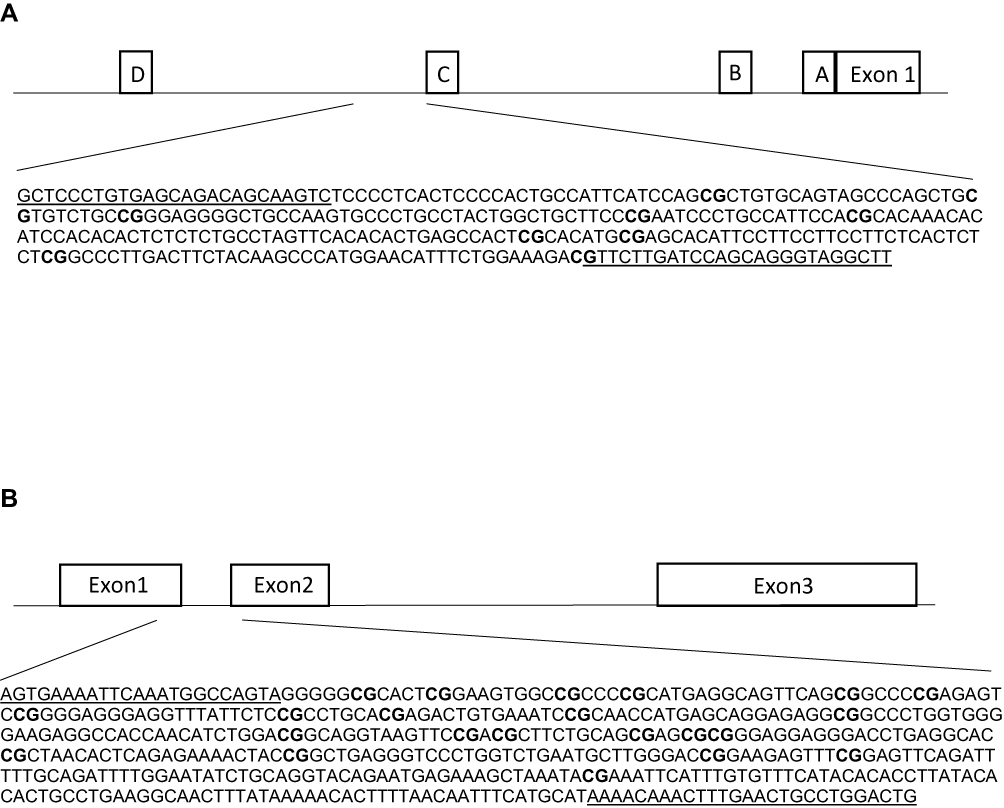 |
Figure 1 Schematic figures of ESR1 (A) and GPER (B) promoter regions. (A) The DNA sequence of ESR1, chr6: 151805523–151805822, is located in a CpG island shore of promoter C, and it has been described as an enhancer (ID GH06J151804) of promoter A.44 This region has been reported in humans and rats by Champagne et al, 2006,23 Gardini et al, 2020,35 Ianov et al, 2017,46 and Tsuboi et al, 2017.44 (B) The DNA sequence of GPER, chr7:1087059–1087533 is located in a CpG island across exons 1 and 2. This region has been assessed in Weissenborn et al, 2017.45 White boxes represent exons or promoter regions. Underlined sequences correspond to the primers position. Bold “CG” correspond to the Interrogated CpGs. |
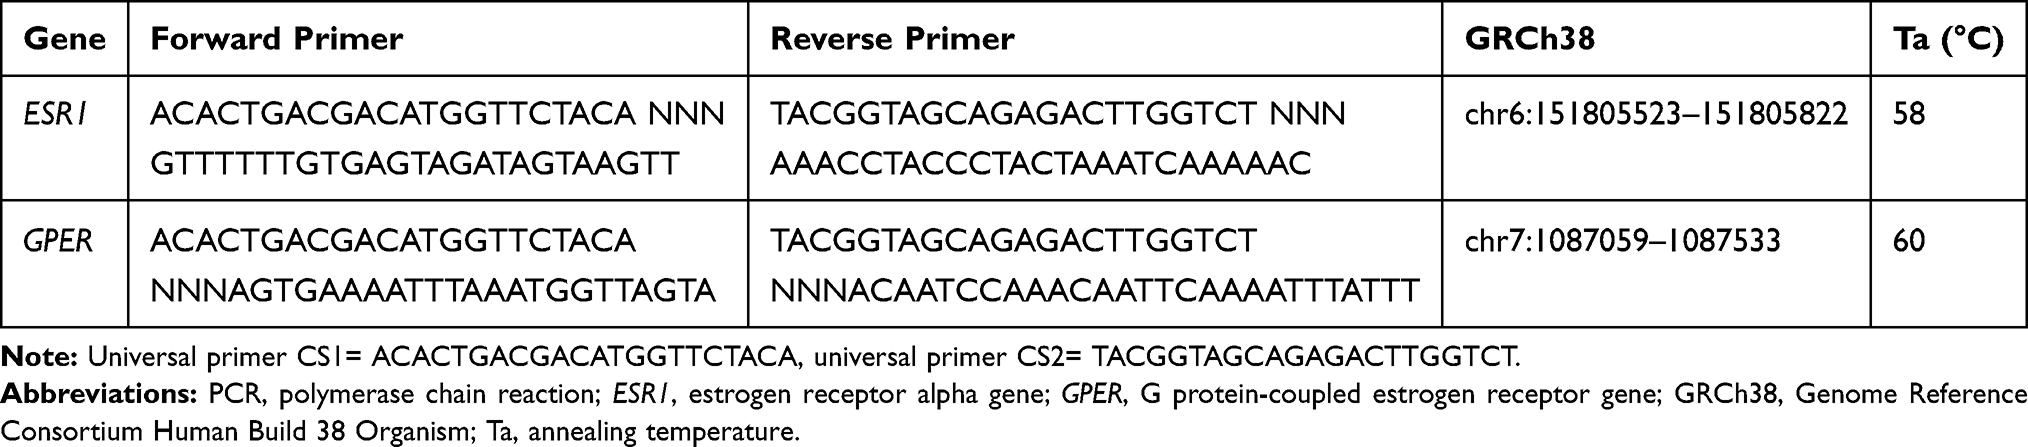 |
Table 2 PCR Primers Used for Amplification of DNA Sequences in the ESR1 and GPER |
As described previously, adaptors and primers were trimmed from the reads using the default settings of Trimmomatic v0.35 (licensed under GPL V3 and available at http://www.usadellab.org/cms/index.php?page=trimmomatic), and low-quality reads defined by a Phred quality score <30 were also discarded.47,48 Using Bismark program (v0.19.0), the remaining sequencing reads were aligned to the target regions and the number of unconverted and converted cytosine was extracted for each interrogated CpG. After summing up counts of unconverted and converted cytosine for each CpG, we removed all samples showing a coverage (=total count) lower than 100x.47 For ESR1, six samples did not reach the 100x threshold and were therefore excluded. For the remaining samples, coverage ranged from 157 to 42ʹ709 (Mean= 6ʹ5601, SD= 5ʹ968). The coverage of most samples for GPER was less than 100x, and only 34 samples could be retained in the analyses. For these 34 samples, coverage ranged from 350 to 39ʹ942 (Mean= 10ʹ647, SD= 9553). The methylation percentage for each CpG was calculated as the unconverted (cytosine) read count divided by the total read count (cytosine + thymine).
The ESR1 shore and GPER methylation data are openly available in “Dryad” at https://doi.org/10.5061/dryad.51c59zw51.
One CpG cluster was identified for ESR1, and therefore the mean of the nine assessed CpGs was used in the statistical analyses. For GPER, two main clusters were identified. However, the results were similar when using the two clusters or the mean of all 22 CpGs assessed for GPER. Therefore, only results obtained using the mean level across all 22 CpGs are presented in this study. Descriptive statistics of ESR1 and GPER methylation levels are reported in Table 1 for the entire sample and the three menopausal stages, respectively.
Potential Covariates and Cofounders
In the statistical analyses we adjusted for age, MS, body mass index (BMI), levels of estradiol (E2), depressive symptoms, and caffeine consumption.8,9,49-57 Depressive symptoms were assessed using the German version of the Center for Epidemiological Studies Depression scale (CES-D), which is a commonly used self-report measure of depressed symptoms during the past one to 2 weeks.58 It consists of 20 items (eg, “I felt hopeful about the future”, “I felt that people disliked me”), rated on a 4-point Likert scale ranging from 0 (rarely or none of the time [less than 1 day]) to 3 (most or all of the time [five to 7 days]). The total score can range from 0 to 60, with higher scores indicating higher depressive symptoms. A cut-off score of 16 or above is often used as a marker of risk for clinical depression.58 Levels of E2 concentrations were measured in saliva using an enzyme-linked immunosorbent assay (IBL international, Hamburg, Germany), following the manufacturer’s instructions. Saliva samples were collected at 8:00 am into 2-mL SaliCaps (IBL International GmbH, Hamburg, Germany) immediately before the collection of blood samples. Intra- and inter-assay coefficients were below 13.3% and 14.8%, respectively, and the assay’s analytical sensitivity was 1.1 pmol/L. Values greater than three standard deviations around the mean were considered as outliers (n= 4) and therefore removed from the analyses. Salivary E2 strongly correlates with free serum E2, which is the portion available for estrogenic effects.59,60 BMI was calculated by dividing the weight in kilograms by the height in meters squared, and caffeine consumption was determined as the number of cups of coffee the women drink per day.
Procedure and Statistical Analyses
Descriptive statistics were calculated to assess the prevalence and severity of sleep problems and VMS among the three menopausal groups (pre-, peri and postmenopausal women). We used Chi-squared test in order to test the prevalence of sleep problems and VMS, and one-way analysis of variance (ANOVA) to test their severity. In the Chi-square test post-hoc analysis, p-values were estimated from unstandardized Z values, according to García-perez et al (2003).61 A p-value below 0.05 was considered statistically significant.
In order to assess the effects of ESR1/GPER methylation on sleep problems, considering VMS as potential mediators, we conducted simple mediation analyses using the PROCESS macro (model 4)62 in SPSS. The mediation model allows the examination of the independent contribution of direct and indirect effects through three paths (ai, bi, c’, see Figure 2): Path ai represents the association between the predictor (X) and the mediator (Mi), path bi represents the association between Mi and the outcome variable (Y), and path c’ represents the direct effect of X on Y, after adjusting for all other variables included in the model. Finally, the indirect effect of X on Y through Mi is defined as aixbi. Direct and indirect effects were assessed using bootstrapping, with the b coefficient providing an index of the magnitude of the effect. Bootstrapping generated a confidence interval (CI). When the 95% asymmetric CI did not include the value 0, direct and indirect effects were considered significant. Bootstrapping has the advantages of not requiring normal distribution of data and of a low vulnerability to type 1 error.62 In a second step, MS was dummy-coded, with the premenopausal group (compared to peri- and postmenopausal groups) and perimenopausal and postmenopausal groups (compared to the premenopausal group) as dummies, to investigate whether effects of the mediation analysis differed between premenopausal women and the group including peri- and postmenopausal women. All analyses were conducted using SPSS (IBM Statistics, version 24.0, Armonk, NY: IBM Corp.).
 |
Figure 2 Path diagram (Macro Model 4) according to Hayes (2017).62 |
Results
Levels of mean methylation across the investigated CpGs of ESR1 and GPER for the three menopausal groups are provided in Table 1. In addition, all variables assessed in this study are provided in this table.
Descriptive Statistics of Sleep Problems Among Menopausal Groups
Almost one third of the sample (30.5%) experienced sleep problems (score of PSQI > 5) during the previous month. Sleep problems were reported by 24% (n= 12) of premenopausal women, 31.3% (n= 5) of perimenopausal women, and 35.5.% (n= 22) of postmenopausal women. The difference in the prevalence of sleep problems among the three menopausal groups was not statistically significant [χ2 (2, N= 128)= 1.73, p= 0.421]. However, there was a trend toward significance regarding the difference in the severity of sleep problems among the groups [F(2125)= 2.94, p= 0.056], with greater sleep problems in peri- (p= 0.028) and postmenopausal women (p= 0.087) compared to premenopausal women.
Descriptive Statistics of Vasomotor Symptoms Among Menopausal Groups
VMS were reported by 48.1% of all women. VMS were experienced by 27% (n= 14) of premenopausal women, 81.3% (n= 13) of perimenopausal women, and 56.5% (n= 35) of postmenopausal women. Among the three groups, there was a statistically significant difference in the prevalence of VMS [χ2 (2, N= 129)= 17.49, p< 0.001]. The number of premenopausal women experiencing VMS was significantly lower than the number of peri- and postmenopausal women experiencing VMS (p< 0.001). The difference in the severity of VMS among menopausal groups was also statistically significant [F (2126)= 10.38, p< 0.001], with peri- (p< 0.001) and postmenopausal women (p< 0.001) reporting greater VMS severity compared to premenopausal women. No significant difference in VMS severity was detected between peri- and postmenopausal women (p= 0.130).
ESR1 Methylation and Sleep Problems
Using the total score of the PSQI as outcome variable, the results indicated that ESR1 methylation predicted sleep problems indirectly through VMS (b= 0.011, 95% CI [0.0013, 0.0299]), while the direct effect of ESR1 methylation on sleep problems was not significant (b= 0.025, 95% CI [−.0100, 0.0597], Figure 3). The results of this mediation model are presented in Table 3. The results of the sensitivity analysis indicated that most of the mediation effect came from peri- and postmenopausal women (b= 0.0127, 95% CI [0.0005, 0.0246]), compared to premenopausal women (b= 0.0045, 95% CI [−.0020, 0.0121]).
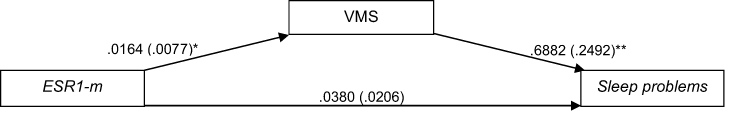 |
Figure 3 Path diagram of the mediation model (Macro Model 4),62 illustrating the associations between ESR1 methylation (X) and sleep disturbances (Y) through VMS (Mi). Estradiol (E2), menopausal status (MS), depressive symptoms, body mass index (BMI), age and caffeine consumption were included in the model and controlled in each of the three paths (ai, bi, c’). Values outside parentheses= unstandardized b coefficient; values in parentheses= standard error; *= p-value < 0.05; **= p-value < 0.01. Abbreviations: ESR1-m, estrogen receptor 1 methylation; VMS, vasomotor symptoms. |
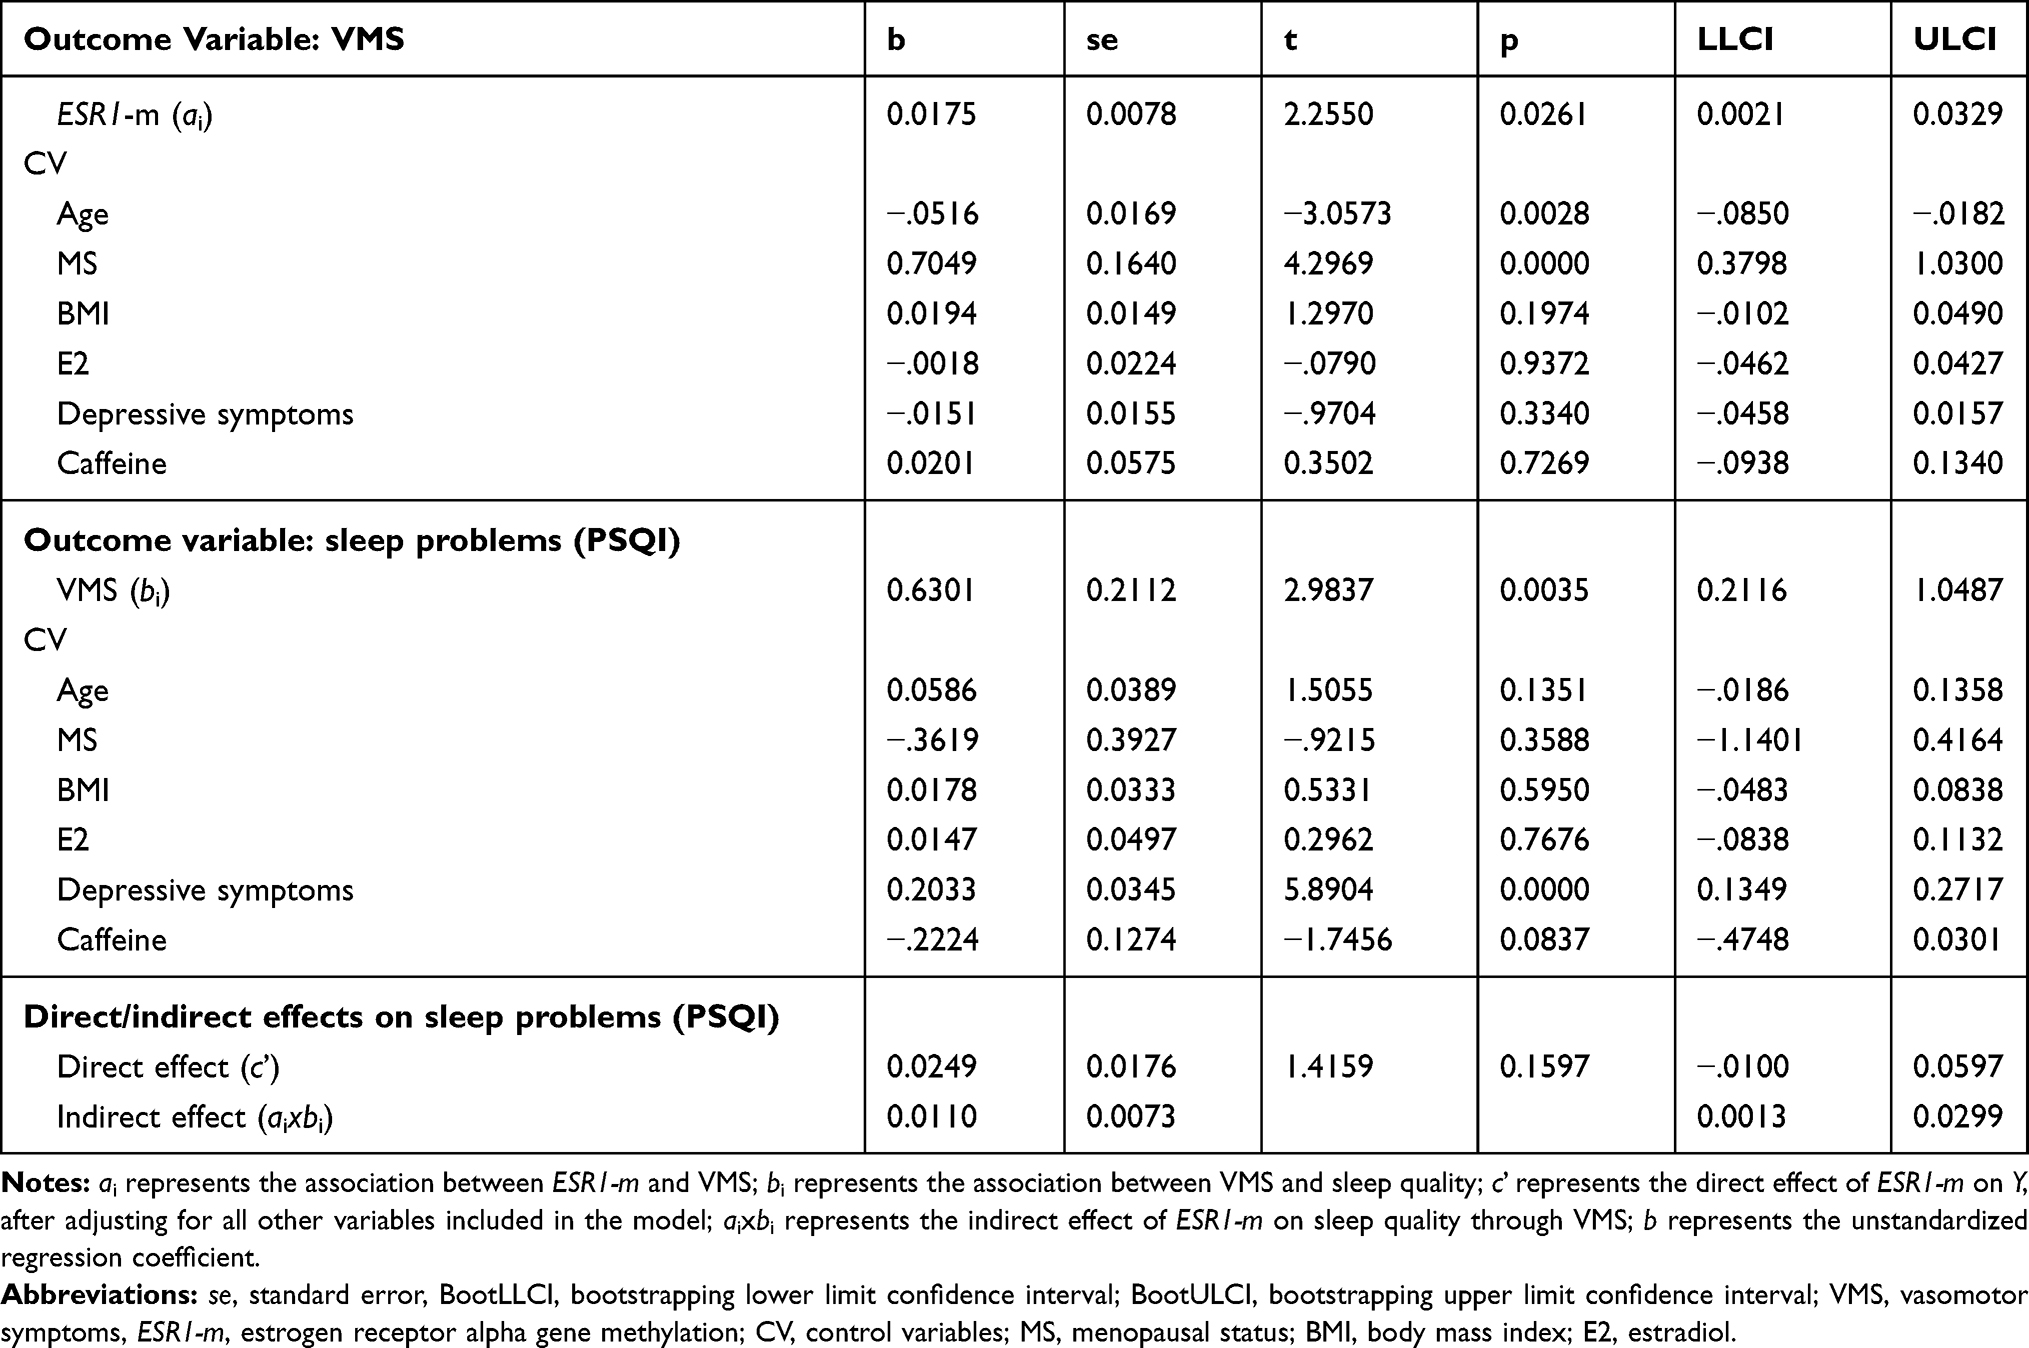 |
Table 3 Results of the Mediation Model with ESR1 Methylation as Predictor, 95% Bias-Corrected Confidence Interval Predicting Sleep Quality |
Similar results were obtained when using the 3-factor model. The indirect effect of ESR1 methylation on the global scores of perceived sleep quality, sleep efficiency and daytime dysfunction through VMS was statistically significant (b= 0.007, 95% CI [0.0014, 0.0187]), while the direct effect was not significant (b= 0.011, 95% CI [−.0103, 0.0324]).
GPER Methylation and Sleep Problems
Using the total score of the PSQI as outcome variable, the results indicated that GPER methylation was not predictive of sleep problems, either directly (b= 0.073, t(23)= 1.08, 95% CI [−.0664, 0.2124]), or indirectly through VMS (b= −.037, 95% CI [−.1083, 0.0416], Figure 4). The results of this mediation model are presented in Table 4.
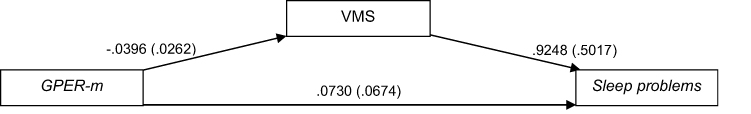 |
Figure 4 Path diagram of the mediation model (Macro Model 4),62 illustrating the associations between GPER methylation (X) and sleep disturbances (Y) through VMS (Mi). Estradiol (E2), menopausal status (MS), depressive symptoms, body mass index (BMI), age and caffeine consumption were included in the model and controlled in each of the three paths (ai, bi, c’). Values outside parentheses= unstandardized b coefficient; values in parentheses= standard error. Abbreviations: GPER-m, G protein-coupled estrogen receptor methylation; VMS, vasomotor symptoms. |
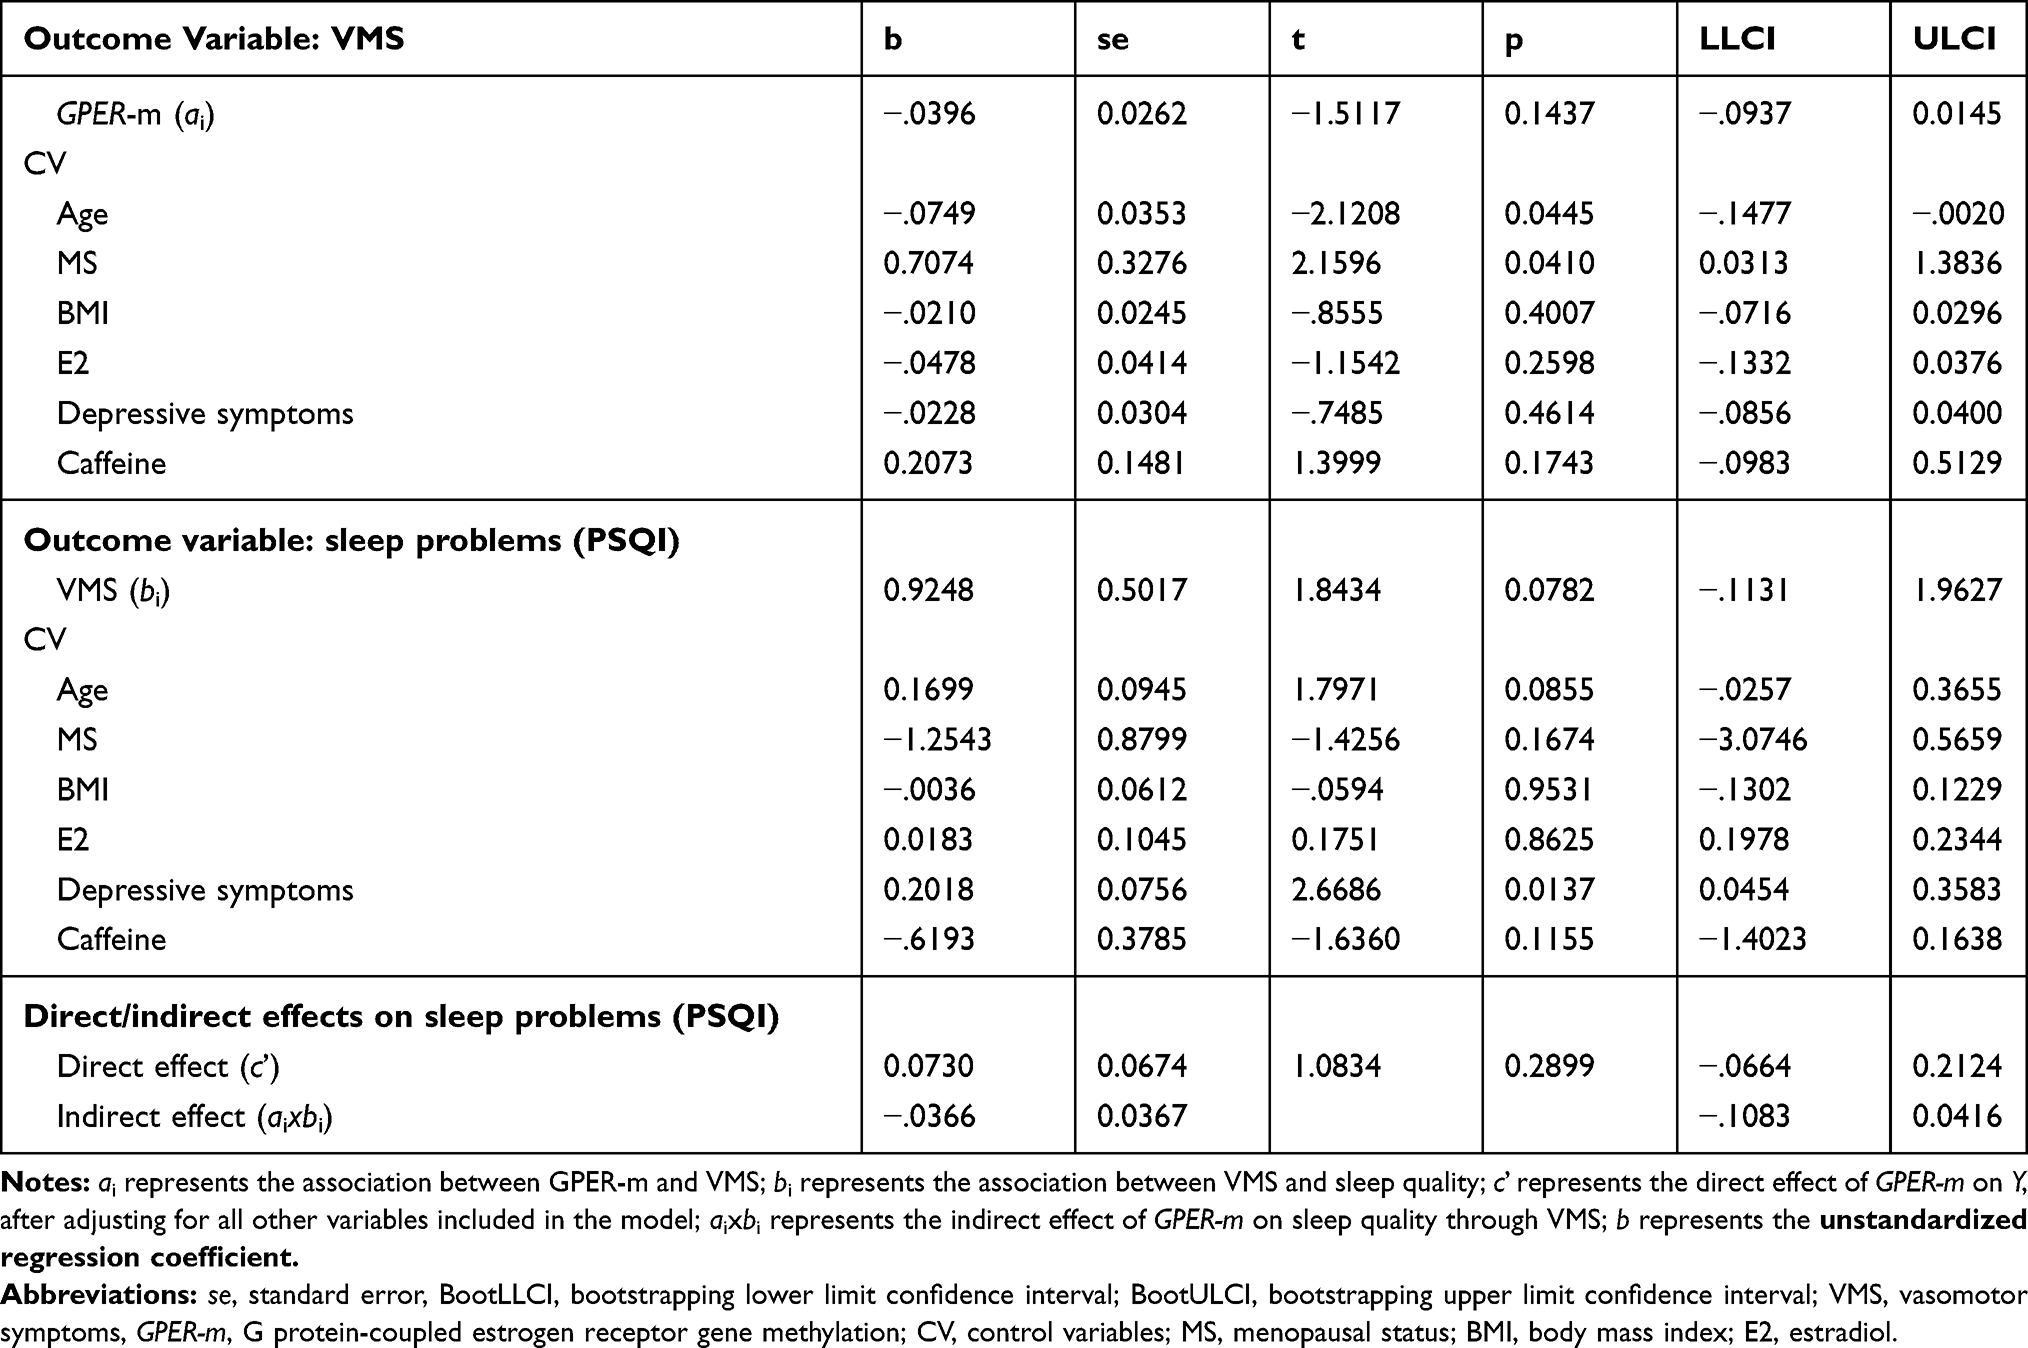 |
Table 4 Results of the Mediation Model with GPER Methylation as Predictor, 95% Bias-Corrected Confidence Interval Predicting Sleep Quality |
Likewise, when testing the effect of GPER methylation on the 3-factor model of the PSQI, the direct effect of GPER methylation on the global scores of perceived sleep quality, sleep efficiency and daytime dysfunction was not significant (b= 0.038, t(23)= 0.84, 95% CI [−.0544, 0.1295]), and nor was the indirect effect through VMS (b= −.023, 95% CI [−.0722, 0.0287]).
Discussion
In the present study, we examined the associations between ESR1/GPER methylation and sleep problems in healthy women aged 40–73 years. No direct associations between ESR1/GPER methylation and sleep problems were detected. However, we found that increased levels of ESR1 methylation were predictive of increased severity of VMS, which in turn predicted increased sleep problems. These associations were significant even if potential cofounders such as age, MS, E2, and medical conditions were controlled.3,11,44,54-56,63
The idea that epigenetic modifications of ER genes may be key drivers of the onset and emergence of perimenopausal symptoms, such as VMS, has been previously suggested.21 One potential mechanism contributing to altered epigenetic patterns of ER genes may be the lifetime action of social and environmental determinants. For instance, early exposure to social stressors and environmental factors (eg: chemicals, nutrition) has been linked to altered ESR1 methylation.6,23,33,64 Most interestingly, early life adversities, such as abuse and neglect, have been previously linked to increased ESR1 methylation in rat,23 and women,33 as well as to increased VMS among midlife women.65
The Study of Women Across the Nation (SWAN), assessing sleep quality in a multi-ethnic sample of 3ʹ045 women in the US, showed that the prevalence of sleep disorders ranged from 16% to 42% in premenopausal women, from 39% to 47% in perimenopausal women, and from 35% to 60% in postmenopausal women, with Caucasian women reporting the highest rates.66 In our study, sleep problems with PSQI scores >5 were reported by 24% of premenopausal women, 31.3% of perimenopausal women and 35.5% of postmenopausal women. The characteristics of our entirely healthy sample may explain the slightly lower prevalence of poor sleep identified in the present study.11 This may also contribute to explain the smaller direct effect of ESR1 methylation on sleep problems, compared to the indirect effect mediated by VMS. The prevalence of VMS among the participating women was comparable with the results reported by the SWAN, which indicated that up to 80% of peri- and postmenopausal women experience VMS.49 In both the present study and previous studies, VMS were strongly associated with sleep problems.3 Together, these results may point to VMS as a primary cause of sleep problems also in healthy women.
The assessment of epigenetic modifications in peripheral tissues, such as blood, is increasingly seen as an important source of biomarkers in health and disease. In addition, as epigenetic signatures are mitotically heritable and yet reversible, their correction holds considerable therapeutic potential.67,68 The clinical implications of ESR1 methylation in VMS may merit further investigation. For instance, longitudinal studies which assess the status of ESR1 methylation before the perimenopausal phase, and which monitor the development of VMS, may provide information regarding the potential of ESR1 methylation as a predictive marker of VMS. In the present study, we used DNA extracted from peripheral blood collected on dried blood spots (DBS). The DBS technology has been suggested as a promising tool in the context of research on biomarkers.69 Its advantages include long-term storage of samples even at room temperature, and ease of transportation.70
Although VMS may be primarily neurological symptoms involving brain regions such as hypothalamic areas, studying DNA methylation in the brain relies on post-mortem tissues, which has several implications in terms of impracticality.71,72 Therefore, peripheral tissues such as blood, buccal cells and saliva are currently used as a proxy of the brain in methylation studies.73,74 Studies using peripheral tissues as a surrogate have demonstrated how specific methylation signatures are associated with disorders affecting the brain.75 In addition, although DNA methylation is tissue-specific, it has been demonstrated that at some CpGs, DNA methylation variance is more closely linked to individual specificity than to tissue specificity.76 Online tools have been developed which enable a comparison of inter-individual methylation variance between peripheral tissues and the brain.76–78 Using the online tool provided by Hannon et al (2015),76 we found that methylation of CpGs located in the assessed DNA region of ESR1 was strongly correlated between blood and brain in the same individuals.35 Therefore, methylation variations in blood may reflect methylation variations in the brain, for the assessed CpGs of ESR1.
Strengths and Limitations
To the best of our knowledge, this is the first study to examine and highlight associations between ESR1 methylation and sleep problems through VMS in healthy middle-aged and older women. In this study, we assessed subjective sleep through the PSQI,38,79 while objective parameters of sleep were not measured. Indeed, questions have been raised regarding the validity of laboratory sleep assessments in women experiencing VMS.80 For instance, evidence supporting an association between objective measures of sleep and VMS is limited and contradictory, despite the association between sleep problems and VMS is well known.81 However, as subjective and objective sleep measurements may capture different aspects of sleep,80,82 objective sleep assessments, such as polysomnography or actigraphy, may be needed to better elucidate the nature of the association between ER genes methylation and sleep.
Our sample included only healthy Caucasian women. On the one hand, as both the race and health status may affect subjective sleep difficulties and self-perceived menopausal symptoms,3,53,66 the characteristics of our sample may help to limit biases linked to race and disease factors. On the other hand, our findings may not be generalizable to other racial/ethnic groups and to the general population including women with poor health. In addition, the sample of this study included three menopausal groups, and the distribution of participants among the three groups was not equal. In particular, the perimenopausal group included significantly fewer participants than the pre- and postmenopausal groups. These considerations may limit comparison with other studies. Furthermore, the sample size of GPER methylation, which was strongly reduced compared to the sample size of ESR1 methylation. Therefore, the assessment of GPER methylation in a larger sample may be useful in order to compare the relative contribution of ESR1 and GPER methylation in the associations with sleep problems and VMS. Finally, the fact that we did not adjust for cell-type composition may also constitute a limitation of this study, as cell-type composition potentially affects levels of methylation in peripheral blood.83
Conclusion
The main result of this study indicates that increased ESR1 methylation may be associated with VMS, which in turn contribute to increased sleep problems in healthy middle-aged and older women. Therefore, this study supports the role of ESR1 in middle-aged and older women’s sleep problems through epigenetic mechanisms. Clinical implications, such as the potential of ESR1 methylation as a biomarker of VMS, may be evaluated in future investigations.
Acknowledgments
This study was supported by the University Research Priority Program Dynamics of Healthy Aging, University of Zurich. The data reported and analyzed in this paper were generated in collaboration with the Genetic Diversity Centre (GDC), ETH Zurich. We also wish to thank Gary G. Chen (NGS support) and Sarah Mannion (proofreading).
Disclosure
The authors report no conflicts of interest in this work.
References
1. Driscoll HC, Serody L, Patrick S, et al. Sleeping well, aging well: a descriptive and cross-sectional study of sleep in “successful agers” 75 and Older. Am J Geriatr Psychiatry. 2008;16(1):74–82. doi:10.1097/JGP.0b013e3181557b69
2. Dew MA, Hoch CC, Buysse DJ, et al. Healthy older adults’ sleep predicts all-cause mortality at 4 to 19 years of follow-up. Psychosom Med. 2003;65(1):63–73. doi:10.1097/01.PSY.0000039756.23250.7C
3. Baker FC, de Zambotti M, Colrain IM, Bei B. Sleep problems during the menopausal transition: prevalence, impact, and management challenges. Nat Sci Sleep. 2018;10:73–95. doi:10.2147/NSS.S125807
4. Jehan S, Masters-Isarilov A, Idoko Salifu FZ, et al. Sleep disorders in postmenopausal women. J Sleep Disord Ther. 2015;4:5.
5. Carrier J, Semba K, Deurveilher S, et al. Sex differences in age-related changes in the sleep-wake cycle. Front Neuroendocrinol. 2017;47:66–85. doi:10.1016/j.yfrne.2017.07.004
6. Vrtačnik P, Ostanek B, Mencej-Bedrač S, Marc J. The many faces of estrogen signaling. Biochem Medica. 2014;24(3):329–342. doi:10.11613/BM.2014.035
7. Al-Safi ZA, Santoro N. Menopausal hormone therapy and menopausal symptoms. Fertil Steril. 2014;101(4):905–915. doi:10.1016/j.fertnstert.2014.02.032
8. Hollander LE, Freeman EW, Sammel MD, Berlin JA, Grisso JA, Battistini M, Sleep quality, estradiol levels, and behavioral factors in late reproductive age women. Obstet Gynecol. 2001;98(3):391–397.doi:10.1016/s0029-7844(01)01485-5
9. Landis CA, Moe KE. Sleep and menopause. Nurs Clin North Am. 2004;39(1):97–115. doi:10.1016/j.cnur.2003.11.006
10. Santen RJ, Allred DC, Ardoin SP, et al. Postmenopausal hormone therapy: an endocrine society scientific statement. J Clin Endocrinol Metab. 2010;95(7_supplement_1):s1–s66. doi:10.1210/jc.2009-2509
11. Pengo MF, Won CH, Bourjeily G. Sleep in women across the life span. Chest. 2018;154(1):196–206. doi:10.1016/j.chest.2018.04.005
12. Freeman EW, Sammel MD, Sanders RJ. Risk of long term hot flashes after natural menopause: evidence from the Penn Ovarian Aging Cohort. Menopause. 2014;21(9):924. doi:10.1097/GME.0000000000000196
13. Thurston RC, Joffe H. Vasomotor symptoms and menopause: findings from the study of women’s health across the nation. Obstet Gynecol Clin North Am. 2011;38(3):489–501. doi:10.1016/j.ogc.2011.05.006
14. Barclay NL, Gregory AM. Quantitative genetic research on sleep: a review of normal sleep, sleep disturbances and associated emotional, behavioural, and health-related difficulties. Sleep Med Rev. 2013;17(1):29–40. doi:10.1016/j.smrv.2012.01.008
15. Davis SR, Lambrinoudaki I, Lumsden M, et al. Menopause. Nat Rev Dis Prim. 2015;1(1):15004. doi:10.1038/nrdp.2015.4
16. Schneiderman N, Ironson G, Siegel SD. Stress and health: psychological, behavioral, and biological determinants. Annu Rev Clin Psychol. 2005;1(1):607–628. doi:10.1146/annurev.clinpsy.1.102803.144141
17. Vézina-Im L-A, Moreno JP, Thompson D, Nicklas TA, Baranowski T. Individual, social and environmental determinants of sleep among women: protocol for a systematic review and meta-analysis. BMJ Open. 2017;7(6):e016592. doi:10.1136/bmjopen-2017-016592
18. Ziv-Gal A, Flaws JA. Factors that may influence the experience of hot flushes by healthy middle-aged women. J Women’s Heal. 2010;19(10):1905–1914. doi:10.1089/jwh.2009.1852
19. Moosavi A, Ardekani AM. Role of epigenetics in biology and human diseases. Iran Biomed J. 2016;20(5):246.
20. Kim J, Bhattacharjee R, Khalyfa A, et al. DNA methylation in inflammatory genes among children with obstructive sleep apnea. Am J Respir Crit Care Med. 2012;185(3):330–338. doi:10.1164/rccm.201106-1026OC
21. Brinton RD, Yao J, Yin F, Mack WJ, Cadenas E. Perimenopause as a neurological transition state. Nat Rev Endocrinol. 2015;11(7):393–405. doi:10.1038/nrendo.2015.82
22. Kumar S, Chinnusamy V, Mohapatra T. Epigenetics of modified DNA bases: 5-methylcytosine and beyond. Front Genet. 2018;9. doi:10.3389/fgene.2018.00640.
23. Champagne FA, Weaver ICG, Diorio J, Dymov S, Szyf M, Meaney MJ. Maternal care associated with methylation of the estrogen receptor-α1b promoter and estrogen receptor-α expression in the medial preoptic area of female offspring. Endocrinology. 2006;147(6):2909–2915. doi:10.1210/en.2005-1119
24. Tang Z-R, Zhang R, Lian Z-X, Deng S-L YK, Yu K. Estrogen-Receptor Expression and Function in Female Reproductive Disease. Cells. 2019;8(10):1123. doi:10.3390/cells8101123
25. Frank A, Brown LM, Clegg DJ. The role of hypothalamic estrogen receptors in metabolic regulation. Front Neuroendocrinol. 2014;35(4):550–557. doi:10.1016/j.yfrne.2014.05.002
26. Kelly MJ, Rønnekleiv OK. Membrane-initiated actions of estradiol that regulate reproduction, energy balance and body temperature. Front Neuroendocrinol. 2012;33(4):376–387. doi:10.1016/j.yfrne.2012.07.002
27. Liu X, Shi H. Regulation of estrogen receptor α expression in the hypothalamus by sex steroids: implication in the regulation of energy homeostasis. Int J Endocrinol. 2015;2015:1–17. doi:10.1155/2015/949085
28. Prossnitz ER, Barton M. The G protein-coupled estrogen receptor GPER in health and disease. Nat Rev Endocrinol. 2011;7(12):715–726. doi:10.1038/nrendo.2011.122
29. Hatcher KM, Royston SE, Mahoney MM. Modulation of circadian rhythms through estrogen receptor signaling. Eur J Neurosci. 2019. doi:10.1111/ejn.14184
30. Kelly MJ, Rønnekleiv OK. Minireview: neural Signaling of Estradiol in the Hypothalamus. Mol Endocrinol. 2015;29(5):645–657. doi:10.1210/me.2014-1397
31. Qiu J, Bosch MA, Tobias SC, et al. Rapid signaling of estrogen in hypothalamic neurons involves a novel G-protein-coupled estrogen receptor that activates protein kinase C. J Neurosci. 2003;23(29):9529–9540. doi:10.1523/JNEUROSCI.23-29-09529.2003
32. Gouw AM, Efe G, Barakat R, et al. Roles of estrogen receptor-alpha in mediating life span: the hypothalamic deregulation hypothesis. Physiol Genomics. 2017;49(2):88–95. doi:10.1152/physiolgenomics.00073.2016
33. Fiacco S, Gardini ES, Mernone L, Schick L, Ehlert U. Table_1_DNA methylation in healthy older adults with a history of childhood adversity—findings from the women 40+ healthy aging study.pdf. Fron psychiatry. 2019. 10:77. doi:10.3389/fpsyt.2019.00777.s001
34. Fiacco S, Mernone L, Ehlert U. Psychobiological indicators of the subjectively experienced health status-findings from the Women 40+ Healthy Aging Study. BMC Womens Health. 2020;20(1):16. doi:10.1186/s12905-020-0888-x
35. Gardini ES, Chen GG, Fiacco S, et al. Differential ESR1 promoter methylation in the peripheral blood—findings from the women 40+ healthy aging study. Int J Mol Sci. 2020;21(10):3654. doi:10.3390/ijms21103654
36. Mernone L, Fiacco S, Ehlert U. Psychobiological factors of sexual functioning in aging women – findings from the women 40+ healthy aging study. Front Psychol. 2019;10. doi:10.3389/fpsyg.2019.00546.
37. Harlow SD, Gass M, Hall JE, et al. Executive summary of the Stages of Reproductive Aging Workshop + 10: addressing the unfinished agenda of staging reproductive aging. J Clin Endocrinol Metab. 2012;97(4):1159–1168. doi:10.1210/jc.2011-3362
38. Buysse DJ, Reynolds III CF, Monk TH, Berman SR, Kupfer DJ. The Pittsburgh sleep quality index: A new instrument for psychiatric practice and research. Psychiatry Res. 1989;28(2):193–213. doi:10.1016/0165-1781(89)90047-4
39. Otte JL, Rand KL, Landis CA, et al. Confirmatory factor analysis of the Pittsburgh Sleep Quality Index in women with hot flashes. Menopause. 2015;22(11):1190. doi:10.1097/GME.0000000000000459
40. Cole JC, Motivala SJ, Buysse DJ, Oxman MN, Levin MJ, Irwin MR. Validation of a 3-factor scoring model for the Pittsburgh sleep quality index in older adults. Sleep. 2006;29(1):112–116. doi:10.1093/sleep/29.1.112
41. Heinemann LAJ, Potthoff P, Schneider HPG. International versions of the Menopause Rating Scale (MRS). Health Qual Life Outcomes. 2003;1(1):28. doi:10.1186/1477-7525-1-28
42. Aberg KA, Xie LY, Nerella S, et al. High quality methylome-wide investigations through next-generation sequencing of DNA from a single archived dry blood spot. Epigenetics. 2013;8(5):542–547. doi:10.4161/epi.24508
43. Li L-C, Dahiya R, MethPrimer: designing primers for methylation PCRs. Bioinformatics. 2002;18(11):1427–1431.doi:10.1093/bioinformatics/18.11.1427
44. Tsuboi K, Nagatomo T, Gohno T, et al. Single CpG site methylation controls estrogen receptor gene transcription and correlates with hormone therapy resistance. J Steroid Biochem Mol Biol. 2017;171:209–217. doi:10.1016/j.jsbmb.2017.04.001
45. Weissenborn C, Ignatov T, Nass N, et al. GPER Promoter Methylation Controls GPER Expression in Breast Cancer Patients. Cancer Invest. 2017;35(2):100–107. doi:10.1080/07357907.2016.1271886
46. Ianov L, Kumar A, Foster TC. Epigenetic regulation of estrogen receptor α contributes to age-related differences in transcription across the hippocampal regions CA1 and CA3. Neurobiol Aging. 2017;49:79–85. doi:10.1016/j.neurobiolaging.2016.09.013
47. Chen GG, Gross JA, Lutz P-E, et al. Medium throughput bisulfite sequencing for accurate detection of 5-methylcytosine and 5-hydroxymethylcytosine. BMC Genomics. 2017;18(1). doi:10.1186/s12864-017-3489-9
48. Bolger AM, Lohse M, Usadel B. Trimmomatic: a flexible trimmer for Illumina sequence data. Bioinformatics. 2014;30(15):2114–2120. doi:10.1093/bioinformatics/btu170
49. Gold EB, Colvin A, Avis N, et al. Longitudinal analysis of the association between vasomotor symptoms and race/ethnicity across the menopausal transition: study of women’s health across the nation. Am J Public Health. 2006;96(7):1226–1235. doi:10.2105/AJPH.2005.066936
50. Cappuccio FP, Taggart FM, Kandala N-B, et al. Meta-analysis of short sleep duration and obesity in children and adults. Sleep. 2008;31(5):8.
51. Miner B, Kryger MH. Sleep in the aging population. Sleep Med Clin. 2017;12(1):31–38. doi:10.1016/j.jsmc.2016.10.008
52. Roehrs T, Roth T. Caffeine: sleep and daytime sleepiness. Sleep Med Rev. 2008;12(2):153–162. doi:10.1016/j.smrv.2007.07.004
53. Kravitz HM, Zhao X, Bromberger JT, et al. Sleep disturbance during the menopausal transition in a multi-ethnic community sample of women. Sleep. 2008;31(7):979–990.
54. Field AE, Robertson NA, Wang T, Havas A, Ideker T, Adams PD. DNA Methylation Clocks in Aging: categories, Causes, and Consequences. Mol Cell. 2018;71(6):882–895. doi:10.1016/j.molcel.2018.08.008
55. Levine ME, Lu AT, Chen BH, et al. Menopause accelerates biological aging. Proc Natl Acad Sci. 2016;113(33):9327–9332. doi:10.1073/pnas.1604558113
56. Matsuda KI. Epigenetic changes in the estrogen receptor α gene promoter: implications in sociosexual behaviors. Front Neurosci. 2014;8. doi:10.3389/fnins.2014.00344.
57. Woods NF, Mitchell ES. Sleep symptoms during the menopausal transition and early postmenopause: observations from the seattle midlife women’s health study. Sleep. 2010;33(4):539–549. doi:10.1093/sleep/33.4.539
58. Radloff LS. The CES-D Scale: A self-report depression scale for research in the general population. Appl Psychol Meas. 1977;1(3):385–401. doi:10.1177/014662167700100306
59. Dielen C, Fiers T, Somers S, Deschepper E, Gerris J. Correlation between saliva and serum concentrations of estradiol in women undergoing ovarian hyperstimulation with gonadotropins for IVF/ICSI. Facts Views Vis ObGyn. 2019;9(2):85–91.
60. Wu C-H, Motohashi T, Abdel-Rahman HA, Flickinger GL, Mikhail G. Free and protein-bound plasma estradiol-17β during the menstrual cycle. J Clin Endocrinol Metab. 1976;43(2):436–445. doi:10.1210/jcem-43-2-436
61. García-pérez MA, Núñez-antón V. Cellwise Residual Analysis in Two-Way Contingency Tables. Educ Psychol Meas. 2003;63(5):825–839. doi:10.1177/0013164403251280
62. Hayes AF. Introduction to Mediation, Moderation, and Conditional Process Analysis, Second Edition: A Regression-Based Approach. Guilford Publications; 2017. https://books.google.ch/books?id=8ZM6DwAAQBAJ.
63. Teschendorff AE, West J, Beck S. Age-associated epigenetic drift: implications, and a case of epigenetic thrift? Hum Mol Genet. 2013;22(R1):R7–R15. doi:10.1093/hmg/ddt375
64. Doshi T, Mehta SS, Dighe V, Balasinor N, Vanage G. Hypermethylation of estrogen receptor promoter region in adult testis of rats exposed neonatally to bisphenol A. Toxicology. 2011;289(2):74–82. doi:10.1016/j.tox.2011.07.011
65. Thurston RC, Bromberger J, Chang Y, et al. Childhood abuse or neglect is associated with increased vasomotor symptom reporting among midlife women. Menopause. 2008;15(1):16–22.
66. Kravitz HM, Joffe H. Sleep during the perimenopause: a SWAN story. Obstet Gynecol Clin. 2011;38(3):567–586. doi:10.1016/j.ogc.2011.06.002
67. Kronfol MM, Dozmorov MG, Huang R, Slattum PW, McClay JL. The role of epigenomics in personalized medicine. Expert Rev Precis Med Drug Dev. 2017;2(1):33–45. doi:10.1080/23808993.2017.1284557
68. Rasool M, Malik A, Naseer MI, et al. The role of epigenetics in personalized medicine: challenges and opportunities. BMC Med Genomics. 2015;8(1):S5. doi:10.1186/1755-8794-8-S1-S5
69. Fischer S, Obrist R, Ehlert U. How and when to use dried blood spots in psychoneuroendocrinological research. Psychoneuroendocrinology. 2019;108:190–196. doi:10.1016/j.psyneuen.2019.06.011
70. Mei J, Lee M. Dried blood spot sample collection, storage, and transportation. Dried Blood Spots Appl Tech. 2014;21–31.
71. Freedman RR, Subramanian M, Effects of symptomatic status and the menstrual cycle on hot flash-related thermoregulatory parameters. Menopause. 2005;12(2):156–159. doi:10.1097/00042192-200512020-00009
72. Rhein M, Hagemeier L, Klintschar M, Muschler M, Bleich S, Frieling H. DNA methylation results depend on DNA integrity-role of post mortem interval. Front Genet. 2015;6:182. doi:10.3389/fgene.2015.00182
73. Fiori LM, Turecki G. Investigating epigenetic consequences of early-life adversity: some methodological considerations. Eur J Psychotraumatol. 2016;7(1):31593. doi:10.3402/ejpt.v7.31593
74. Zhang B, Zhou Y, Lin N, et al. Functional DNA methylation differences between tissues, cell types, and across individuals discovered using the M&M algorithm. Genome Res. 2013;23(9):1522–1540. doi:10.1101/gr.156539.113
75. Bakulski KM, Halladay A, Hu VW, Mill J, Fallin MD. Epigenetic Research in Neuropsychiatric Disorders: the “Tissue Issue.”. Curr Behav Neurosci Reports. 2016;3(3):264–274. doi:10.1007/s40473-016-0083-4
76. Hannon E, Lunnon K, Schalkwyk L, Mill J. Interindividual methylomic variation across blood, cortex, and cerebellum: implications for epigenetic studies of neurological and neuropsychiatric phenotypes. Epigenetics. 2015;10(11):1024–1032. doi:10.1080/15592294.2015.1100786
77. Braun PR, Han S, Hing B, et al. Genome-wide DNA methylation comparison between live human brain and peripheral tissues within individuals. Transl Psychiatry. 2019;9(1):1–10. doi:10.1038/s41398-019-0376-y
78. Edgar RD, Jones MJ, Meaney MJ, Turecki G, Kobor MS. BECon: a tool for interpreting DNA methylation findings from blood in the context of brain. Transl Psychiatry. 2017;7(8):e1187–e1187. doi:10.1038/tp.2017.171
79. Pilz LK, Keller LK, Lenssen D, Roenneberg T. Time to rethink sleep quality: PSQI scores reflect sleep quality on workdays. Sleep. 2018;41:5. doi:10.1093/sleep/zsy029
80. Ameratunga D, Goldin J, Hickey M. Sleep disturbance in menopause. Intern Med J. 2012;42(7):742–747. doi:10.1111/j.1445-5994.2012.02723.x
81. Joffe H, Massler A, Sharkey KM Evaluation and management of sleep disturbance during the menopause transition. In:
82. Landry GJ, Best JR, Liu-Ambrose T. Measuring sleep quality in older adults: a comparison using subjective and objective methods. Front Aging Neurosci. 2015;7:166. doi:10.3389/fnagi.2015.00166
83. Houseman EA, Kelsey KT, Wiencke JK, Marsit CJ. Cell-composition effects in the analysis of DNA methylation array data: a mathematical perspective. BMC Bioinform. 2015;16(1):95. doi:10.1186/s12859-015-0527-y
 © 2020 The Author(s). This work is published and licensed by Dove Medical Press Limited. The full terms of this license are available at https://www.dovepress.com/terms.php and incorporate the Creative Commons Attribution - Non Commercial (unported, v3.0) License.
By accessing the work you hereby accept the Terms. Non-commercial uses of the work are permitted without any further permission from Dove Medical Press Limited, provided the work is properly attributed. For permission for commercial use of this work, please see paragraphs 4.2 and 5 of our Terms.
© 2020 The Author(s). This work is published and licensed by Dove Medical Press Limited. The full terms of this license are available at https://www.dovepress.com/terms.php and incorporate the Creative Commons Attribution - Non Commercial (unported, v3.0) License.
By accessing the work you hereby accept the Terms. Non-commercial uses of the work are permitted without any further permission from Dove Medical Press Limited, provided the work is properly attributed. For permission for commercial use of this work, please see paragraphs 4.2 and 5 of our Terms.