")
Back to Journals » International Journal of Nanomedicine » Volume 12
SL2B aptamer and folic acid dual-targeting DNA nanostructures for synergic biological effect with chemotherapy to combat colorectal cancer
Authors Sun P, Zhang N, Tang Y, Yang Y, Chu X, Zhao Y
Received 21 January 2017
Accepted for publication 1 March 2017
Published 3 April 2017 Volume 2017:12 Pages 2657—2672
DOI https://doi.org/10.2147/IJN.S132929
Checked for plagiarism Yes
Review by Single anonymous peer review
Peer reviewer comments 2
Editor who approved publication: Dr Linlin Sun
Pengchao Sun,* Nan Zhang,* Yafang Tang, Yanan Yang, Xiao Chu, Yongxing Zhao
Department of Pharmaceutics, School of Pharmaceutical Sciences, Zhengzhou University, Zhengzhou, HeNan, People’s Republic of China
*These authors contributed equally to the work
Abstract: DNA nanostructures prepared by self-assembly possess good stability, high biocompatibility, and low immunogenicity as drug delivery vehicles. In this work, DNA tetrahedron (TD) was constructed and modified with SL2B aptamer (S) and folic acid (F). TD possessed a small diameter (~6 nm) and entered into the nucleus quickly. SL2B aptamer can inhibit cancer cell growth by disturbing vascular endothelial growth factor/Notch signaling pathways. To explore the effect of SL2B number on colorectal cancer inhibition, SL2B multimers (dimer, trimer, and tetramer) were constructed by functionalization of TD with different numbers of SL2B. One SL2B per TD was the most efficient anticancer strategy and showed significantly better anticancer efficacy than SL2B, probably due to the enhanced stability of SL2B by TD. Doxorubicin (DOX) is a potent anticancer agent that can intercalate into DNA double strands. Results showed that TD could facilitate DOX entrance into the nucleus and the intracellular delivery of DOX was further enhanced by functionalization of SL2B and F. DOX-intercalated TD modified with two F and two S (DOX@TD-2F2S) could cause sufficient HT-29 cell inhibition at a much lower DOX concentration. In sum, DOX@TD-2F2S exhibited a synergic anticancer biological effect with chemotherapy and can be a promising strategy for treating colorectal cancer.
Keywords: SL2B aptamer, DNA tetrahedron, synergic biological effect with chemotherapy, colorectal cancer, doxorubicin, VEGF/Notch, folic acid
Introduction
DNA is a type of natural biomacromolecule with good stability, high biocompatibility, and low immunogenicity in vivo. It can be designed into various structures and functionalized by targeting agents easily.1 DNA self-assembly is an easy, fast, and efficient method to construct DNA nanostructures. Turberfield et al reported a one-step synthesis of DNA tetrahedron (TD).2,3 Kim et al had used doxorubicin (DOX)-intercalated DNA TD to treat multidrug resistance of MCF-7 cells.4 Charoenphol et al also showed that aptamer (AS1411)-modified DNA pyramids could enter HeLa cells easily and enhance HeLa cell inhibition. In addition, DNA pyramids increased the stability of AS1411 in vitro.5
Aptamers are single-stranded DNA or RNA that possess high binding affinity and specificity like monoclonal antibodies.6 However, aptamers are easily degraded in vivo. PEGylation and structure modification of aptamers have been reported to increase their stability and bioactivity.6–8 At present, several aptamers have been used in clinical studies for diseases, including mNOX-E36-3′PEG aptamer for glomerulosclerosis,9 AS1411 aptamer for acute myeloid leukemia,10 and ARC 1779 for von Willebrand factor-mediated platelet activation and thrombosis.11 SL2B is a DNA aptamer with 26 bases and was selected by Hasegawa et al via Systematic Evolution of Ligands by Exponential Enrichment technology for vascular endothelial growth factor (VEGF)165. VEGF165 is a protein that is overexpressed by HT-29 cells, HepG2 cells, SGC729 cells, and MCF-7 cells. It contains a heparin-binding domain (HBD) that helps enhance interaction with its receptors and the specific co-receptor neurophilins to trigger cellular angiogenic response in cancer cells. SL2B could specifically bind to HBD on VEGF165. SL2B binding to VEGF165 might interfere with VEGF and Notch signaling pathways, which can finally cause tumor cell inhibition.6,12
Cancer is still an unmet health problem with increasing incidence and mortality.13 To combat cancer and minimize damage to normal tissue, targeting agents are usually functionalized to drug delivery vehicles. However, receptors that overexpress on cancer cells may also express on normal cells, which results in unspecific drug uptake, toxicity to normal cells, and reduced anticancer efficacy. Dual targeting may solve the problem because specificity of drug delivery vehicles is further enhanced. For example, gold nanoparticles (GNPs) modified with folate and glucose showed significantly increased intracellular uptake compared with GNP-folate and GNP-glucose due to multivalent interactions between both ligands with human epidermal cancer cells.14 Nanoparticles comprising AS1411 aptamer (glioma targeting) and trans-Golgi network peptide (blood–brain barrier [BBB] targeting) showed more penetration across BBB and brain–glioma barrier to improve the survival of glioma-bearing mice.15 Saul et al also developed a dual-targeting system for folate receptor and epidermal growth factor receptor on KB cells.16
Numerous aptamer-based biotherapies were limited to one aptamer-modified vehicle. However, affinity of aptamers to receptors and efficiency of subsequent biological effects were highly affected by oligomerization of receptors on cell surface in some cases. For example, CD30 ligands could trimerize CD30 receptors and activate specific cellular signaling.17 Parekh et al had demonstrated that multimeric C2NP aptamer was able to trimerize CD30 receptor, activate downstream signaling, and enhance cell apoptosis compared with a single aptamer.18 In this work, SL2B and SL2B multimers (dimer, trimer, and tetramer) were synthesized by using DNA TD and tested for biological anticancer effects against HT-29 cells. Folic acid (F) was also functionalized to TD-SL2B for dual targeting to folate receptors and VEGF165 proteins, respectively. DOX was intercalated to DNA TD to examine the combined anticancer efficacy with SL2B.
Experimental design
Materials
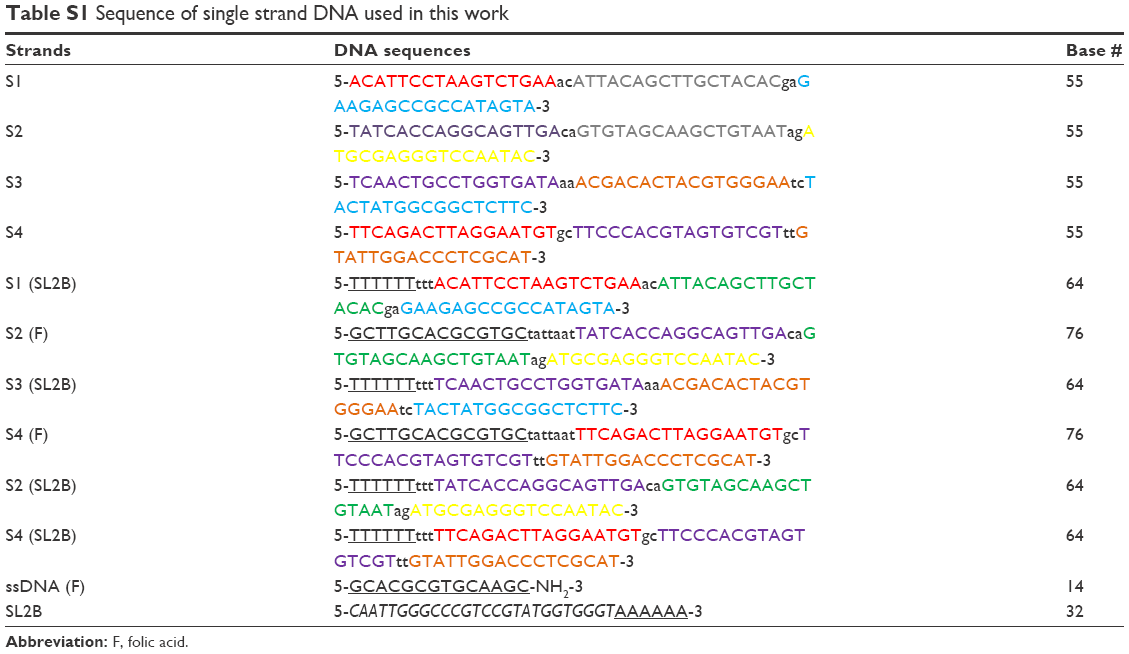
SL2B and all DNA strands (Table S1) were synthesized by Sangon Biotech (Shanghai, China). DOX hydrochloride was purchased from Solarbio (Beijing, China). F-PEG 2000-NHS was obtained from Sigma-Aldrich Co. (St Louis, MO, USA). HyClone (Pittsburgh, PA, USA) supplied penicillin–streptomycin solution (100×). Thermo Fisher Scientific (Waltham, MA, USA) provided FBS, McCoy’s 5A culture medium, and 0.25% trypsin. CCK8 kit was purchased from Melonepharma (Dalian, China). Apoptosis assay kit was obtained from Thermo Fisher Scientific. Cell cycle assay kit was provided by KeyGen Biotech (Nanjing, China). HT-29 cells (human colorectal adenocarcinoma cells; ATCC® HTB-38TM) was purchased from CoBioer (#CBP60011), Nanjing, China.
Preparation of DNA nanostructures
TD was prepared by adding stoichiometric quantities of component S1–S4 (Table S1) in TM buffer (5 mM Tris and 5 mM MgCl2) at a total DNA concentration of 1 μM. DNA solution was mixed well in PCR tubes and heated at 95°C for 5 min. Subsequently, the solution was quickly cooled to 4°C and maintained at 4°C for 30 s.
Targeted DNA TD was functionalized with F and/or SL2B. Briefly, F-PEG 2000-NHS (0.26 mg) was weighed and dissolved into dimethyl sulfoxide (DMSO) to prepare 10 μM F-PEG 2000-NHS solution. ssDNA was added dropwise to F-PEG 2000-NHS solution under stirring to reach a molar ratio 1:2 of ssDNA to F-PEG 2000-NHS. The solution was stirred overnight in the dark and the obtained product was labeled as ssDNA-F. Pre-targeted DNA TD was produced by adding stoichiometric quantities of component S1 (or S1-S), S2 (or S2-F), S3 (or S3-S), and S4 (or S4-F) (Table S1) in TM buffer (5 mM Tris and 5 mM MgCl2) at a total DNA concentration of 1 μM. DNA solutions were mixed well in PCR tubes and heated at 95°C for 5 min. Subsequently, the DNA solutions were quickly cooled to 4°C and maintained at 4°C for 30 s. ssDNA-F and/or SL2B was added to the pre-targeted DNA TD solutions and the mixtures were kept at 40°C for 5 min. Targeted DNA TD was obtained by cooling the solution to 20°C at 2 min/°C.
Characterization of DNA nanostructures
Constructed nanostructures (TD, TD-1SL2B, TD-2SL2B, TD-3SL2B, TD-4SL2B, TD-1FA, TD-2FA, TD-1F1S, and TD-2F2S) were analyzed by 3% agarose gel electrophoresis. Briefly, samples were mixed with 6× loading buffer at 1:0.2 (v/v) and run for 50 min at 100 V in an ice bath. Morphology of TD was observed by AFM (Bruker, Billerica, MA, USA). Briefly, TD was diluted to 125 nM with Tris·HCl and MgCl2. The sample (5 μL) was added to MgCl2 treated mica sheet and allowed to settle for 5 min to allow DNA absorption. Additional 40 μL Tris·HCl and MgCl2 was added to the sample to allow AFM scanning under solution mode.
DOX release and stability of DNA nanostructures
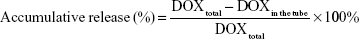
DNA nanostructures were incubated with DOX at different molar ratios to obtain maximum DOX loading. Briefly, DNA TD was diluted to 250 nM and incubated with DOX (500, 400, 300, 250, 200, 150, 100, 50, and 10 μM) for 10 h in the dark. Subsequently, the solutions were centrifuged at 10,000 rpm for 10 min to collect DOX@TD. Supernatants (10 μL) were taken and mixed with 90 μL phosphate-buffered saline (PBS). The samples were added to 96-well plates and shaken at 100 rpm for 3 min. Fluorescent signal of DOX was detected by a plate reader (BioTek, Winooski, VT, USA) (λex=485 nm and λem=591 nm). Loaded DOX was calculated by using total DOX minus DOX in the supernatant. Effect of incubation time on DOX loading was also explored. A series of incubation time points (0, 0.5, 1, 2, 4, 6, 8, and 10 h) was set, and DOX loading at each time point was measured by the same method. To demonstrate release of DOX from TD, DOX@TD was suspended with PBS and added to micro dialysis tube (200 μL per tube). Samples (10 μL) were taken from the tubes at set time points (0.5, 1, 2, 4, 6, 8, 12, 24, 36, and 48 h) and prepared with the same method for the measurement by the plate reader. Accumulative DOX release at each time point was calculated as:
|
Dissociation of DOX@TD in cell culture medium (plus 10% FBS) was evaluated in the dark at 37°C. Samples (12 μL) were taken at set time points (0, 0.5, 3, 6, 15, 24, 48, and 72 h) and kept at −20°C. Stability of TD was determined by 3% agarose gel electrophoresis. To explore stability of DOX in TD, 10 μL collected samples were mixed with 2 μL DMSO and 88 μL PBS. The samples were added to 96-well plates and shaken at 100 rpm for 3 min. Fluorescent signal of DOX was read and the relative stability of DOX was calculated as:
|

In vitro anticancer efficacy
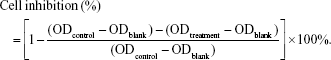
HT-29 cells were in an exponential phase of growth and were cultured for 48 h at 37°C to allow attachment before experiment. Treatments included control groups, blank groups, chemotherapy groups (DOX, DOX@TD, DOX@TD-1F, DOX@TD-2F, DOX@TD-1S, DOX@TD-2S, DOX@TD-1F1S, and DOX@TD-2F2S) (finalized DOX concentration: 10, 5, 1, 0.5, or 0.1 μM), biological therapy groups (SL2B, TD-1SL2B, TD-2SL2B, TD-3SL2B, and TD-4SL2B) (finalized SL2B concentration: 5, 2, or 1 μM), and combined therapy groups (DOX@TD-1SL2B; DOX concentration: 1, 0.5, 0.1, or 0 μM; SL2B concentration: 5, 2, or 1 μM). Designed treatments were added to 96-well plates at a cell density of 8×10³ cells/well. Cells were incubated with chemotherapy groups for 24, 48, and 72 h, respectively. Cells were treated by biological therapy groups for 72 h. Combined therapy groups were also applied for 72 h to HT-29 cells. Subsequently, the designed treatments were removed and 200 μL CCK8 (2.5%, v/v) cell culture medium was added to each well. After 4 h incubation, the plates were read for optical density (OD) value at 450 nm by the plate reader. Cell inhibition was calculated as:
|
Confocal fluorescence microscopy imaging
Cellular uptake of DOX and intracellular location of TD were studied by using FV100 laser confocal microscopy (Olympus, Tokyo, Japan) on HT-29 cells. Briefly, DOX (1 μM), DOX@TD (DOX: 1 μM), DOX@TD-1F (DOX: 1 μM), DOX@TD-2F (DOX: 1 μM), DOX@TD-1S (DOX: 1 μM), DOX@TD-2S (DOX: 1 μM), DOX@TD-1F1S (DOX: 1 μM), DOX@TD-2F2S (DOX: 1 μM), and TD-FITC (TD: 100 nM) were added to HT-29 cells (cell density 5×10⁴ cells/well) in 24-well plates and incubated for 15 min, 30 min, 1 h, 2 h, and 4 h, respectively. At set time points, the medium in each well was removed and cells were washed thrice with PBS. One milliliter of 4% paraformaldehyde was then added to each well and cells were incubated for 10 min in the dark. Subsequently, the cells were washed with PBS twice and 400 μL DAPI solution was used to stain cells for 9 min. Cells were washed and observed under a microscope for DOX intracellular uptake and intracellular location of TD.
Binding affinity of SL2B and TD-SL2B to HT-29 cell
Briefly, SL2B-FITC (SL2B concentration: 0, 0.1, 1, 5, 10, 50, 100 nM) and TD-SL2B-FITC (SL2B concentration: 0, 0.1, 1, 5, 10, 50, 100 nM) were added to HT-29 cells (cell density 1×10⁶ cells/well) in 6-well plates, respectively. Cells were incubated with the designed treatment for 2 h. Subsequently, cell culture medium was removed and the cells were washed thrice with PBS. Trypsin (500 μL) was then added to each well and the detached cells were transferred into a centrifuge tube. Cell solutions were centrifuged at 1,000 rpm for 5 min and the obtained cell pellets were suspended with a small amount of PBS to 1,000–2,000 cell/μL. The suspended cells were analyzed by a flow cytometer. The equilibrium dissociation constants (Kd) of SL2B and TD-SL2B were obtained by fitting the dependence of fluorescence intensity of specific binding on the concentration of SL2B to the equation Y = BmaxX/(Kd + X).19
Cellular uptake
Briefly, DOX (1 μM), DOX@TD (DOX: 1 μM), DOX@TD-1F (DOX: 1 μM), DOX@TD-2F (DOX: 1 μM), DOX@TD-1S (DOX: 1 μM), DOX@TD-2S (DOX: 1 μM), DOX@TD-1F1S (DOX: 1 μM), and DOX@TD-2F2S (DOX: 1 μM) were added to HT-29 cells (cell density 1×10⁶ cells/well) in 6-well plates, respectively. Cells were incubated with the designed treatment for 1 h. Subsequently, cell samples were prepared as above for flow cytometry.
Cell apoptosis and cell cycle
Annexin V-FITC/propidium iodide (PI) double staining method was used to distinguish early and late stages of apoptosis cells and necrosis cells. Briefly, DOX (1 μM), DOX@TD (DOX: 1 μM), DOX@TD-1F (DOX: 1 μM), DOX@TD-2F (DOX: 1 μM), DOX@TD-1S (DOX: 1 μM), DOX@TD-2S (DOX: 1 μM), DOX@TD-1F1S (DOX: 1 μM), and DOX@TD-2F2S (DOX: 1 μM) were added to cells (cell density 1×10⁶ cells/well) in 6-well plates for 48 h. Afterwards, 1 mL trypsin was added to each well and the detached cells were washed twice with PBS. Subsequently, the cells were centrifuged at 1,500 rpm for 5 min. For cell apoptosis investigation, the supernatant was removed and the cell pellets were suspended with 200 μL binding buffer. Annexin V-FITC (5 μL) and PI (5 μL) were then added and mixed with the suspended cell solutions sequentially. The mixed solutions were allowed to react for 15 min in the dark. For cell cycle experiments, the supernatant was removed and the cell pellets were suspended with 350 μL cold ethanol and kept overnight at 4°C. Subsequently, the cell samples were centrifuged and washed twice with PBS. RNase A (100 μL) containing PI was used to suspend and stain the cells. The cell solution was incubated for 15 min in the dark. The prepared samples were tested by a flow cytometer for cell apoptosis and cell cycle, respectively.
Western blot analysis
Proteins (15 μg) for each sample (positive control: HT-29 cells without treatment, SL2B: HT-29 cells treated with 5 μM SL2B, TD-SL2B: HT-29 cells treated with 5 μM TD-SL2B, negative control: human gastric epithelial Ges-1 cells that do not express jagged-1 protein) were separated on 10% sodium dodecyl sulfate–polyacrylamide gel and transferred onto nitrocellulose membrane via wet transfer. After being blocked with 5% non-fat milk, the membranes were first incubated overnight at 4°C with the primary antibodies: rabbit monoclonal anti-jagged-1 1:1,000 (catalog number: ab109536; Abcam, Cambridge, UK). Subsequently, the membranes were incubated with the appropriate secondary antibody: goat anti-rabbit IgG H&L (catalog number ab6721; Abcam). The protein bands were developed with enhanced chemiluminescence Western blotting substrate and visualized on an X-OMAT BT film. Images of protein bands were acquired by GelDocTM XR+ (Bio-Rad Laboratories Inc., Hercules, CA, USA). Rabbit monoclonal anti-GADPH (1:1,000, catalog number bs-2188R; Bioss, Beijing, China) was used as a housekeeping protein.
Statistical analysis
All experiments in this study were conducted at least in triplicate. Statistical analyses were performed by using Origin 8.0 and GraphPad Prism 6 software packages (GraphPad Software, Inc., La Jolla, CA, USA). Quantified data were presented as mean ± SD. Student’s t-test was applied for comparison between two groups and one-way analysis of variance was performed to compare three or more groups (P<0.05 indicating statistical significance).
Results and discussion
Construction and characterization of multifunctional DNA nanostructures
DNA TD and DNA TD functionalized with F and/or SL2B were designed and constructed in this work (Scheme 1). Sequences of used DNA strands are listed in Table S1. DNA TD was made by self-assembly of four single strands described by Goodman et al3 and each edge contained 17 bp double helix (capital letters) and 2 bp hinges (lowercase letters). Each edge was represented in different colors. In this work, extra sequences (underlined letters) were synthesized to 5′ end of single DNA strands to facilitate functionalization of F and/or SL2B to the corner of TD. Hinges (lowercase letters) were also incorporated in the design to ensure the extra sequences had sufficient flexibility to react with F and/or SL2B. TD was synthesized in TM (5 mM Tris and 5 mM MgCl2) buffer via polymerase chain reaction (PCR). As shown in Figure 1A, lane 2 showed a bright band around 100 bp that fitted to the designed size of TD. Conjugation of one F and/or SL2B (lane 3, 5, 7) caused DNA retardation in the agarose gel and additional F and/or SL2B (lane 4, 6, 8) increased the DNA retardation. The results suggested successful construction of TD and F and/or SL2B modified TD. Atom force microscopy (AFM) was used to observe the morphology and size of synthesized TD. AFM images further confirmed that the synthetic nanostructures possessed a triangle outline with side length around 6 nm (Figure 1B).
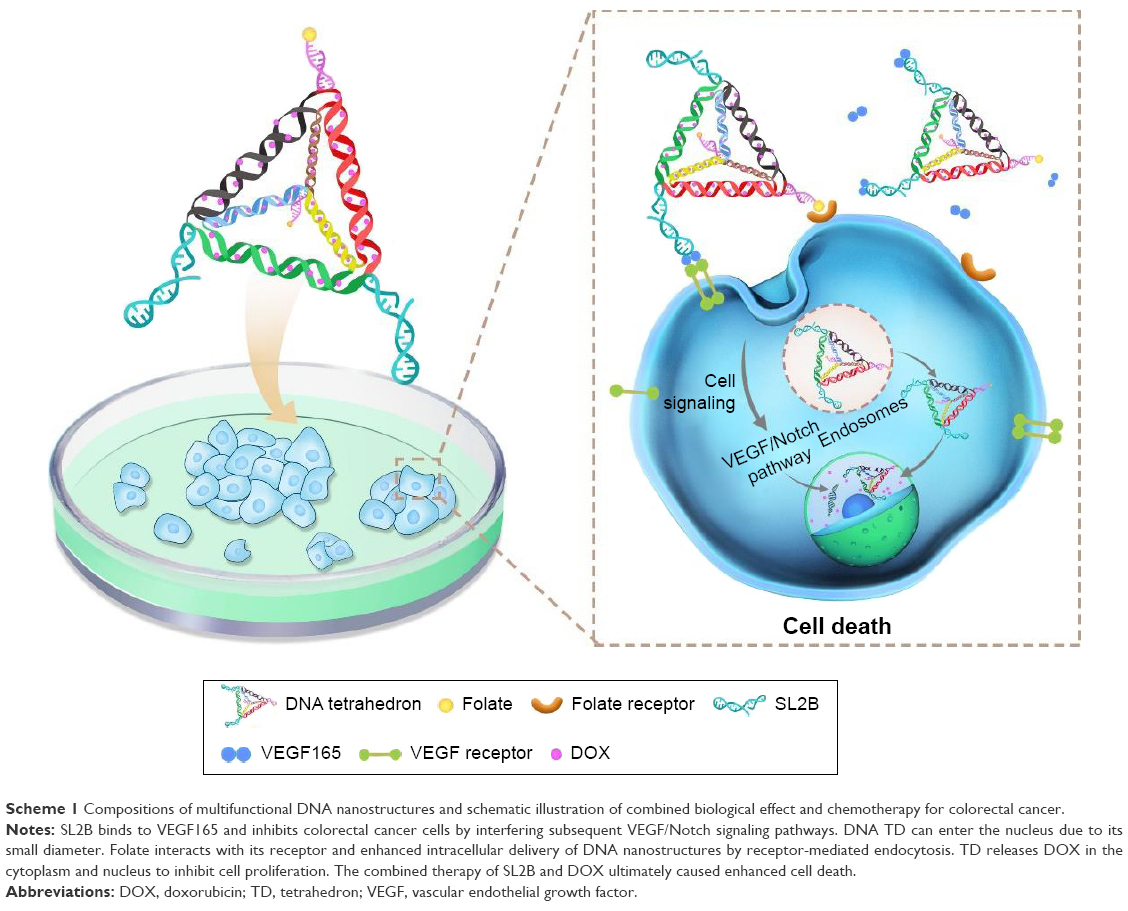 | Scheme 1 Compositions of multifunctional DNA nanostructures and schematic illustration of combined biological effect and chemotherapy for colorectal cancer. |
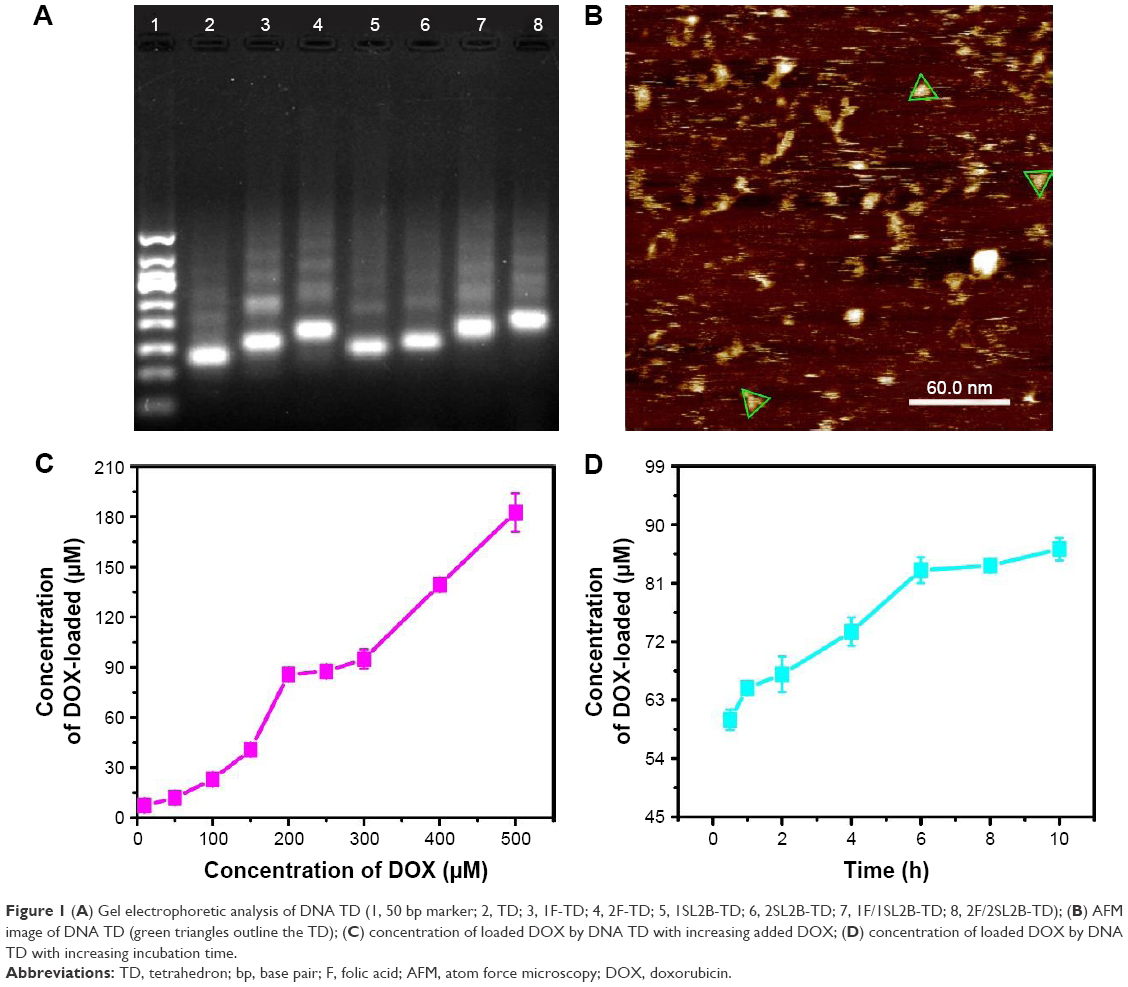 | Figure 1 (A) Gel electrophoretic analysis of DNA TD (1, 50 bp marker; 2, TD; 3, 1F-TD; 4, 2F-TD; 5, 1SL2B-TD; 6, 2SL2B-TD; 7, 1F/1SL2B-TD; 8, 2F/2SL2B-TD); (B) AFM image of DNA TD (green triangles outline the TD); (C) concentration of loaded DOX by DNA TD with increasing added DOX; (D) concentration of loaded DOX by DNA TD with increasing incubation time. |
DOX loading
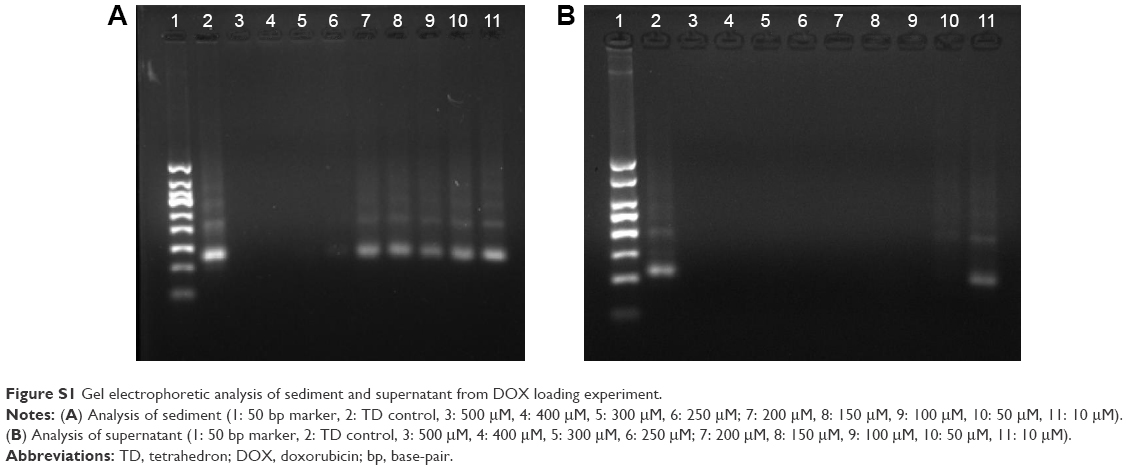
DOX can intercalate into DNA double helix non-covalently because of its planar anthracycline nucleus structure.20 Experiments were optimized to obtain maximum DOX loading to TD. Results indicated that DOX loading increased with higher initial incubation concentration of DOX within 0–200 and 250–500 μM (Figure 1C). The results were contrary to the knowledge that DNA strands had finite sites for DOX intercalation. To explain the results, DOX loading experiment was repeated. Solutions with different DOX concentrations were incubated with TD. Supernatants and pellets of the incubated solutions were collected and tested by 3% agarose gel electrophoresis. Figure S1A showed that the obtained pellets contained clear DNA band when the DOX concentration was 10–200 μM. At 250 μM of DOX, a weak band showed on the gel. When the DOX concentration was increased to 300–500 μM, there was no band on the gel, which indicated the destruction and disappearance of TD nanostructures. The results suggested that excess DOX would destroy TD nanostructures. Figure S1B shows TD nanostructures in the supernatant when DOX concentrations were 10 and 50 μM. DNA nanostructures had good water solubility and, with insufficient DOX loading, they remained in the supernatant after centrifugation. Therefore, TD:DOX 250 nM:200 μM was chosen as the optimized ratio to carry maximum DOX without destruction of TD nanostructures. At TD:DOX 250 nM:200 μM, one TD contained ~330 DOX molecules. DOX loading also kept increasing with increasing incubation time until 6 h (Figure 1D).
Stability and release of DOX and DNA nanostructures
Structural stability of drugs and nanostructures is critical to in vitro and in vivo efficacy experiments. Structural stability of DOX-loaded DNA TD (DOX@TD) in cell culture medium plus 10% fetal bovine serum (FBS) was assayed by gel electrophoresis. Lanes 3–10 showed clear TD bands and suggested high structural stability of TD up to 72 h (Figure 2A). Structural stability of free DOX and DOX@TD was also tested. Fluorescent signal of free DOX and DOX intercalated into TD reduced to 15.8% and 48.0% at 72 h, respectively. The results showed that DOX intercalation into TD could preserve more signature fluorescence of DOX, which indicated that TD could improve structural stability of DOX in cell culture environment (Figure 2B). Figure 2C shows that TD and TD modified with two F and two S (TD-2F2S) could slow down the release of DOX at 37°C compared with free DOX.
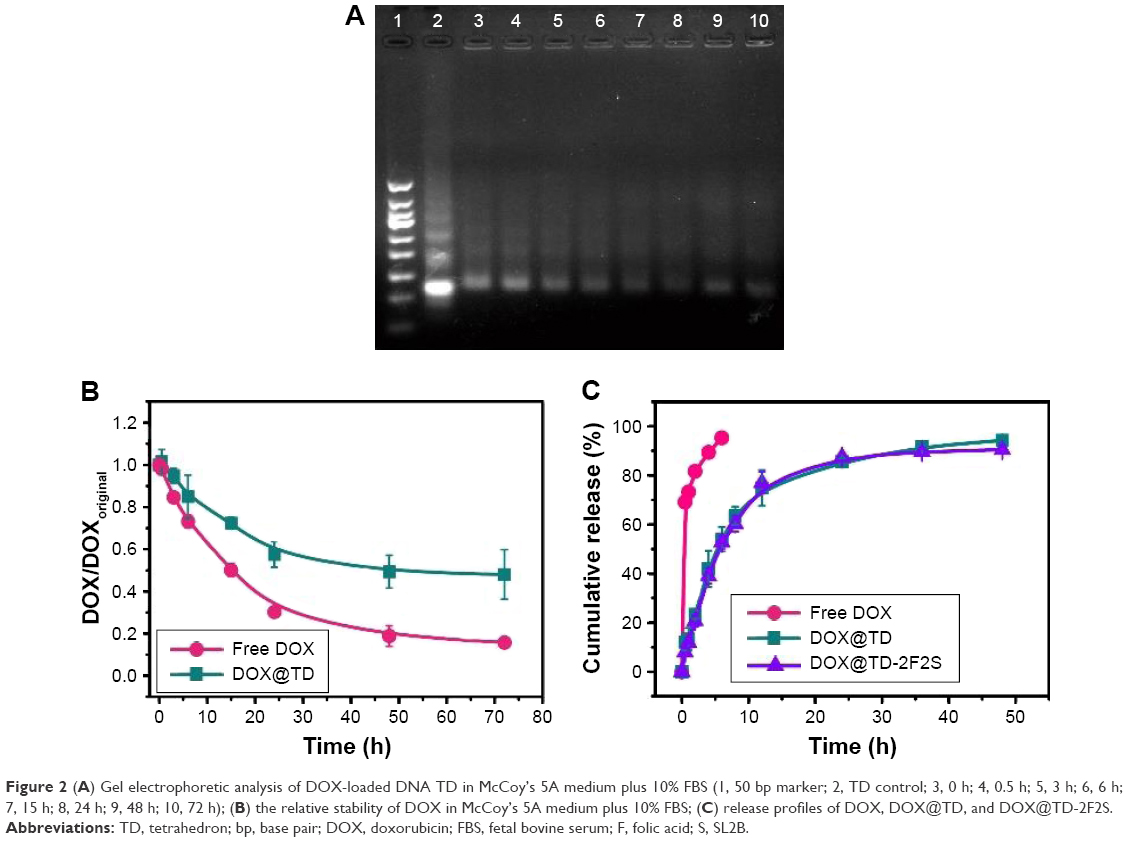 | Figure 2 (A) Gel electrophoretic analysis of DOX-loaded DNA TD in McCoy’s 5A medium plus 10% FBS (1, 50 bp marker; 2, TD control; 3, 0 h; 4, 0.5 h; 5, 3 h; 6, 6 h; 7, 15 h; 8, 24 h; 9, 48 h; 10, 72 h); (B) the relative stability of DOX in McCoy’s 5A medium plus 10% FBS; (C) release profiles of DOX, DOX@TD, and DOX@TD-2F2S. |
Enhanced HT-29 cell inhibition by combined therapy with DOX and SL2B
A series of anticancer treatments was designed for in vitro cell inhibition experiment. First, parameters such as DOX concentration and DOX incubation time were explored for their effect on cell inhibition. Results showed increased cell inhibition with higher DOX concentration and longer DOX incubation time. Compared with free DOX, DOX@TD demonstrated higher cell inhibition. Cell inhibition was further enhanced with F and/or SL2B modification. Different numbers of F and/or SL2B modification also resulted in varied cell inhibition, especially when DOX concentrations were 0.5 and 1 μM. With longer incubation time and higher DOX concentration, the difference between groups turned out to be smaller and all treatments showed high cell inhibition. Among all the treatments, DOX@TD-2F2S showed the highest anti-HT-29 cell efficacy (Figure 3). To explore the possible cell inhibition mechanism, cell apoptosis and cell cycle assays were conducted. Results showed that free DOX caused 6.7% necrosis and 25.2% late apoptosis after 48 h incubation with HT-29 cells. DOX@TD-FS and DOX@TD-2F2S significantly increased late apoptosis of HT-29 cells to 52% and 69.5%, respectively (Figure 4A). Free DOX resulted in 25.45% cell arrest in the S phase. After loading to TD, S phase arrest was increased to 36.7% (Figure 4B).
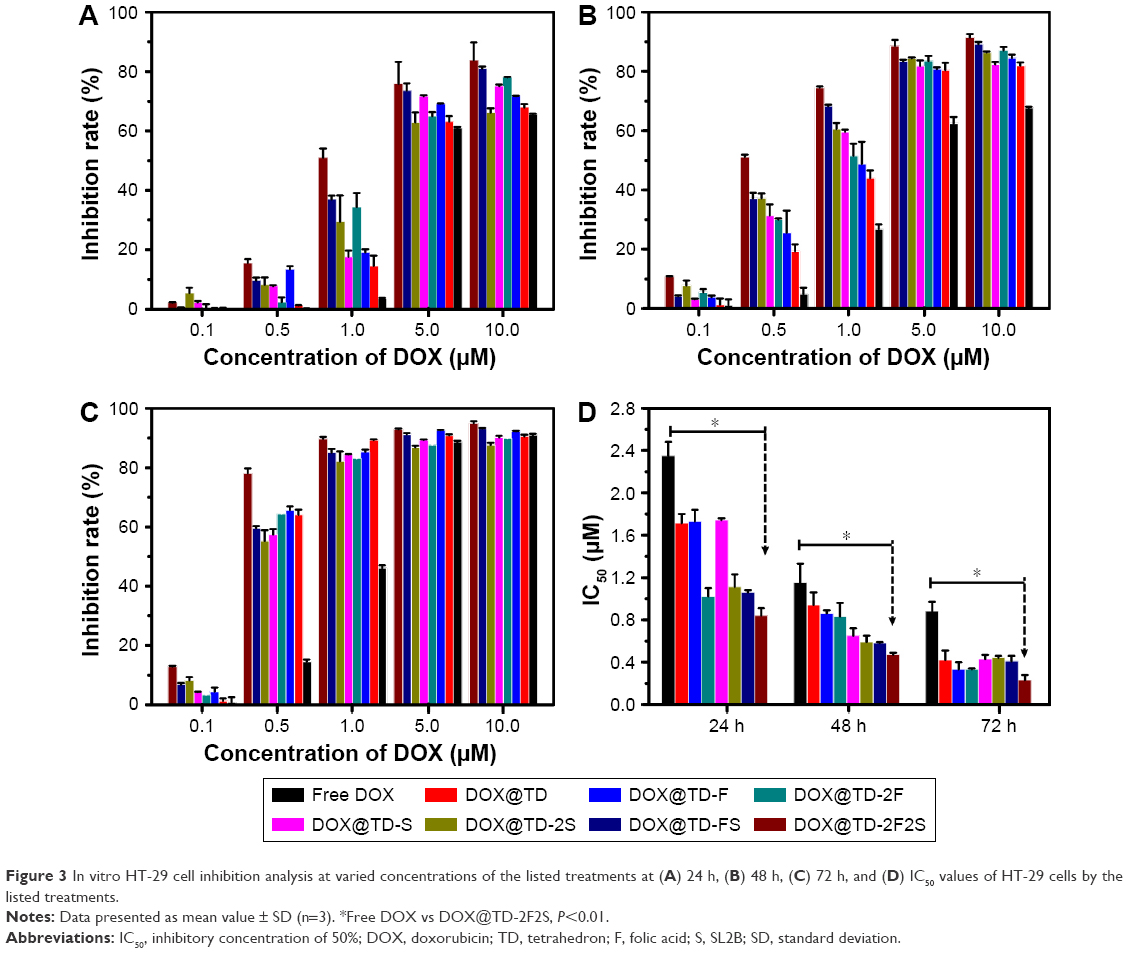 | Figure 3 In vitro HT-29 cell inhibition analysis at varied concentrations of the listed treatments at (A) 24 h, (B) 48 h, (C) 72 h, and (D) IC50 values of HT-29 cells by the listed treatments. |
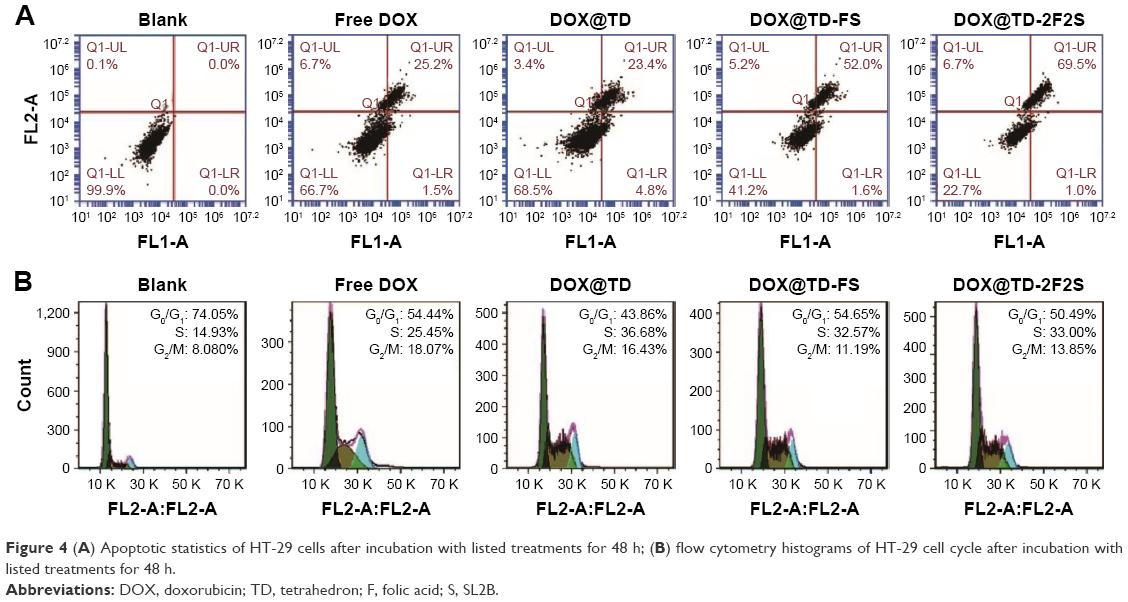 | Figure 4 (A) Apoptotic statistics of HT-29 cells after incubation with listed treatments for 48 h; (B) flow cytometry histograms of HT-29 cell cycle after incubation with listed treatments for 48 h. |
Second, biological anti-HT-29 cell efficacy of SL2B was tested. Results showed that free SL2B possessed low cell inhibition at all tested concentrations (1, 2, and 5 μM). The low efficacy was possibly caused by the low stability of free SL2B in a biological environment. Kaur et al reported that free SL2B caused a 50% proliferation inhibition on Hep G2 cells at 15 μM.6 In this work, functionalization of SL2B to TD significantly increased the capacity of cell inhibition by SL2B. At 5 μM of SL2B, TD-SL2B demonstrated 84% HT-29 cell inhibition (Figure 5A), which indicated that the anticancer efficacy of SL2B had been improved by TD-SL2B. This might be due to the enhancement of SL2B stability after conjugation to TD.
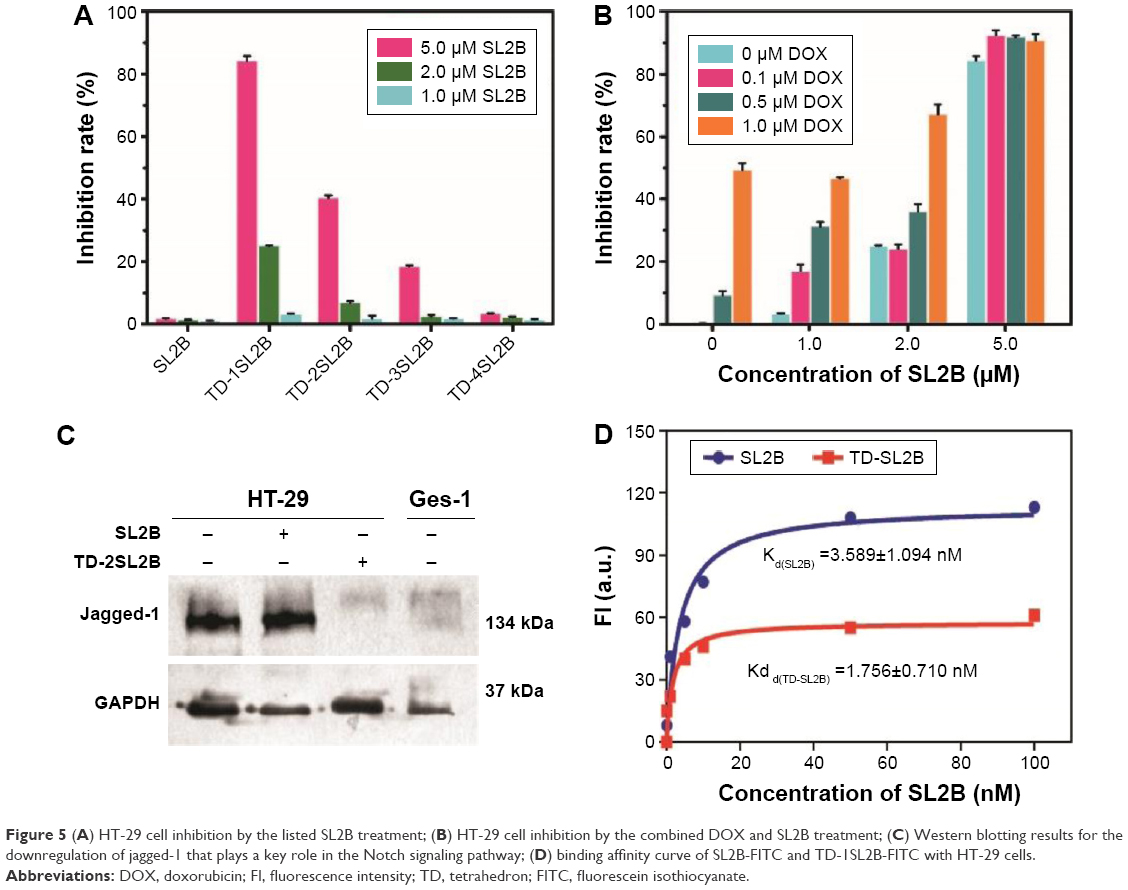 | Figure 5 (A) HT-29 cell inhibition by the listed SL2B treatment; (B) HT-29 cell inhibition by the combined DOX and SL2B treatment; (C) Western blotting results for the downregulation of jagged-1 that plays a key role in the Notch signaling pathway; (D) binding affinity curve of SL2B-FITC and TD-1SL2B-FITC with HT-29 cells. |
The mechanism of SL2B on cell inhibition was unclear. Previously, Kaur et al proposed two possible explanations.6 One was that SL2B bound to HBD on VEGF165 and inhibited the interaction of VEGF165 with VEGF receptor-2 (VEGFR-2), and the other was that SL2B bound VEGF165 interacted with VEGFR-2 and subsequently interfered with the downstream VEGF-linked signaling pathway after cellular internalization. VEGF165 generally had a much higher binding affinity to its receptors than SL2B to VEGF165. Hence, SL2B could probably not significantly inhibit the interaction of VEGF165 with its receptors but affect the downstream VEGF signaling pathway. VEGF165 is a diffusive protein in the extracellular matrix. It could dimerize its receptors into homodimers or heterodimers and subsequently result in different signals and cell fates.21 Kaur et al showed that SL2B could inhibit jagged-1 protein that was highly expressed when the Notch signaling pathway was activated.6 VEGF pathway plays a key role for the initiation of tumor angiogenesis and the Notch pathway acts downstream of the VEGF pathway.22 In this work, the results confirmed that HT-29 cells treated with TD-SL2B showed comparable expression of jagged-1 to normal Ges-1 cells. However, HT-29 cells treated with free SL2B could not inhibit jagged-1 protein compared with that of untreated HT-29 cells (Figure 5C). The results confirmed the cross-talk of VEGF and Notch pathways in HT-29 cells. The significant difference on jagged-1 protein expression by SL2B and TD-SL2B explained why TD-SL2B had a better anticancer efficacy than SL2B.
Trimerization of CD30 by multimeric C2NP aptamers could significantly enhance the downstream signaling pathway. To explore if multimeric SL2B aptamers had a similar biological function, possibly via oligomerization of VEGF165 proteins and/or its receptors, TD with 1–4 SL2B was designed in this work. However, results showed that single SL2B (TD-SL2B) showed ~84% HT-29 cell inhibition while TD-2SL2B and TD-3SL2B demonstrated only ~40% and ~20% HT-29 cell inhibition, respectively, at the same SL2B concentration (Figure 5A). One possibility was that only one SL2B on the TD could bind to VEGF165 and cause downstream signal. Or more than one SL2B on the TD could bind to more than one VEGF165, but only one SL2B bound VEGF165 could interact with the VEGF receptor to cause downstream signal change. In future, DNA nanostructures with varied lengths among aptamers will be designed and used to explore the issue.
The significant difference of cell inhibition between TD-SL2B and TD-2SL2B in this experiment seemed to conflict cell inhibition results in Figure 3 as the difference between DOX@TD-S and DOX@TD-2S was less significant. The reason was the different concentrations used in these two experiments. They were designed based on the concentration of DOX and SL2B, respectively. In Figure 3, the DOX concentration used was TD:DOX 250 nM:200 μM); at the highest DOX concentration (10 μM), the corresponding SL2B concentration was 12.5 nM that was much lower than 5 μM used in Figure 5A. At 12.5 nM, SL2B had very low anticancer efficacy; hence, significant difference of cell inhibition between DOX@TD-S and DOX@TD-2S was not observed. Although Figure 5A showed higher cell inhibition by TD-SL2B (concentration of TD: 5 μM) than by TD-2SL2B (concentration of TD: 2.5 μΜ) at the same SL2B concentration (5 μM), DOX@TD-2F2S (concentration of F: 25 nΜ, concentration of S: 25 nΜ) possessed more F and/or SL2B than DOX@TD-2F1S (concentration of F: 25 nΜ, concentration of S: 12.5 nΜ) and DOX@TD-FS (concentration of F: 12.5 nΜ, concentration of S: 12.5 nΜ) at the same DOX@TD concentration. Figure 3 confirmed that DOX@TD-2F2S had higher cell inhibition than DOX@TD-FS. The reason was that two F and two SL2B endowed DOX@TD with more chance to interact with and enter into cells at the same DOX concentration, which had been verified by flow cytometry data in Figure 6. In other words, at the same TD concentration, DOX@TD-2F2S possessed more F and SL2B than DOX@TD-FS. Hence, DOX@TD-2F2S showed better anticancer efficacy than DOX@TD-FS as shown in Figure 3.
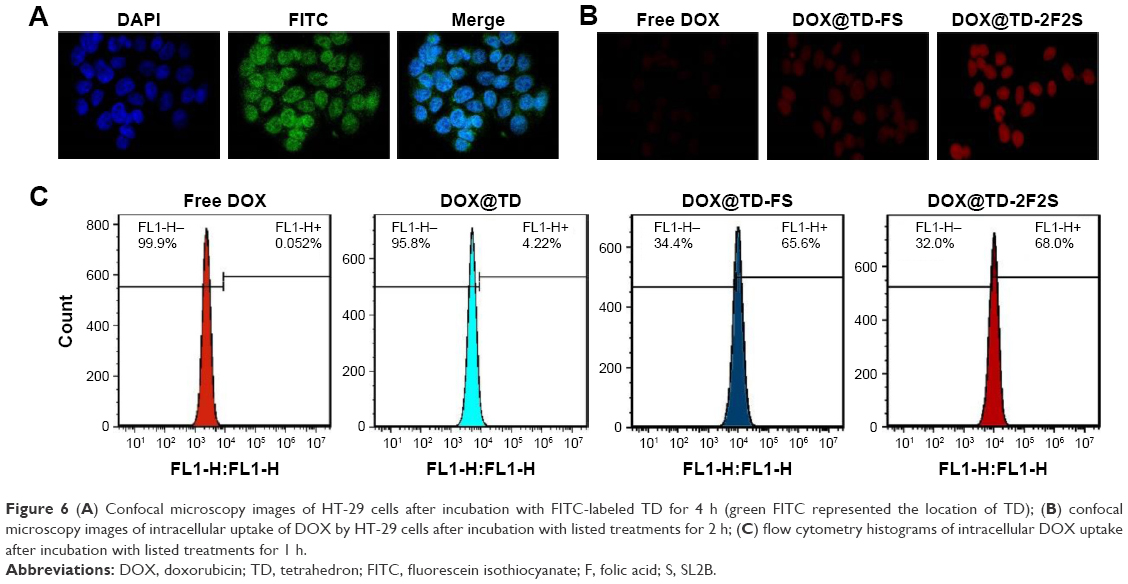 | Figure 6 (A) Confocal microscopy images of HT-29 cells after incubation with FITC-labeled TD for 4 h (green FITC represented the location of TD); (B) confocal microscopy images of intracellular uptake of DOX by HT-29 cells after incubation with listed treatments for 2 h; (C) flow cytometry histograms of intracellular DOX uptake after incubation with listed treatments for 1 h. |
DOX at varied concentrations was added to biological SL2B therapy. With such addition, DOX@TD-SL2B had significant enhancements on in vitro cell inhibition. When the SL2B concentration was 5 and 2 μM, DOX@TD-SL2B showed significantly more cell inhibition than DOX@TD and TD-SL2B, which indicated the synergic cell inhibition effect of DOX and SL2B (Figure 5B).
F, a ligand with high affinity to the folate receptors that are frequently overexpressed in many types of tumor cells,23 has been used to improve targeting of nanocarriers to HT-29 cells.24–26 In this study, SL2B was also incorporated to cause biological signals and enhance HT-29 targeting. With the dual-targeting strategy, DOX@TD-2F2S is expected to possess higher specificity to HT-29 tumor in vivo and demonstrate better tumor targeting than single-ligand targeted treatment schemes. Safety is always a critical parameter for a new therapy. As shown in Figure S2 and Table S2, TD, TD-2F, and the materials used to synthesize TD had little effect on cell inhibition (see supplementary materials). SL2B and F both interacted with their corresponding receptors that were overexpressed on several cancer cells. The dual-targeting strategy further minimized unspecific interaction of DOX@TD-2F2S with normal cells. HT-29 demonstrated high expression of both folate receptors and VEGF receptors. Hence, DOX@TD-2F2S was developed to demonstrate a dual-targeting anticancer strategy toward HT-29 cell line in this study. Different types of cancer cells have varied characters. The dual-targeting strategy can also be used to treat other cancer cells with specific modifications based on needs.
DNA nanostructure enhanced binding affinity of SL2B to HT-29 cells
SL2B was labeled with fluorescein isothiocyanate (FITC) and incubated with HT-29 cells that expressed VEGF165 and its receptors. Fluorescent signal was detected by a flow cytometer to determine the bound SL2B to cells. The detected fluorescent signal increased with higher SL2B incubation concentration. Obtained data were plotted and Kd of SL2B to HT-29 cells was calculated. As shown in Figure 5D, Kd(TD-SL2B) is much lower than Kd(SL2B), which indicated a higher binding affinity of TD-SL2B to cells than free SL2B at the same SL2B concentration. Improvement in the binding affinity of SL2B explained why TD-SL2B could enhance the anticancer efficacy of SL2B at a much lower SL2B concentration than that of a previous report.
Nucleus location of TD
Side length of TD was ~6 nm and that should allow it to enter the nucleus via nuclear pore. To verify the hypothesis, the nucleus was stained with DPAI and TD was labeled with FITC. Figure 6A showed strong green fluorescence in the nucleus area, which confirmed the location of TD in the nucleus after 4 h incubation with HT-29 cells. Intracellular uptake of DOX was also observed and the results showed that the fluorescent signal of DOX increased with time. At 1, 2, and 4 h, DOX loaded to TD groups showed stronger fluorescence than free DOX. Targeted TD groups exhibited stronger fluorescence than the untargeted TD groups. These results indicated that TD could facilitate DOX to enter the nucleus. Functionalization of F and/or SL2B to TD further increased intracellular DOX (Figures 6B and S3). Flow cytometry data confirmed significantly more intracellular DOX uptake by DOX@TD (~81 fold more than the free DOX group) after 1 h incubation. With F and SL2B functionalization, intracellular DOX was further increased (~1,308 fold more than the free DOX group) (Figure 6C).
Conclusion
For the first time, dual-targeting DNA TD with one or more SL2B aptamer and/or F was constructed to combat colorectal HT-29 cancer cells. Anticancer efficacy of SL2B aptamer was significantly increased after conjugation with the DNA carrier-DNA TD, probably due to the improvement of SL2B stability. However, SL2B multimers were less efficient than TD-SL2B at the same SL2B concentration. DOX@TD-2F2S showed significantly enhanced HT-29 cell inhibition than free DOX and DOX@TD-2F. DOX@TD-SL2B also resulted in more cell death than TD-SL2B. These results suggested superior anticancer efficacy of DOX@TD-2F2S and a synergic anticancer effect of SL2B and DOX. In sum, this work has demonstrated that dual targeting and combined biological effect and chemotherapy could be a promising strategy to combat colorectal cancer.
Acknowledgments
Financial support from National Natural Science Foundation of China (NSFC Nos. 81573011 and 81611130076) and China Postdoctoral Science Foundation (2015M582211) is gratefully acknowledged.
Disclosure
The authors report no conflicts of interest in this work.
References
Yang DY, Campolongo MJ, Tran TNN, Ruiz RCH, Kahn JS, Luo D. Novel DNA materials and their applications. Wires Nanomed Nanobi. 2010;2(6):648–669. | ||
Erben CM, Goodman RP, Turberfield AJ. Single-molecule protein encapsulation in a rigid DNA cage. Angewandte Chemie. 2006;45(44):7414–7417. | ||
Goodman RP, Berry RM, Turberfield AJ. The single-step synthesis of a DNA tetrahedron. Chem Commun. 2004;(12):1372–1373. | ||
Kim KR, Kim DR, Lee T, et al. Drug delivery by a self-assembled DNA tetrahedron for overcoming drug resistance in breast cancer cells. Chem Commun. 2013;49(20):2010–2012. | ||
Charoenphol P, Bermudez H. Aptamer-targeted DNA nanostructures for therapeutic delivery. Mol Pharm. 2014;11(5):1721–1725. | ||
Kaur H, Li JJ, Bay BH, Yung LY. Investigating the antiproliferative activity of high affinity DNA aptamer on cancer cells. PLoS One. 2013;8(1):e50964. | ||
Healy JM, Lewis SD, Kurz M, et al. Pharmacokinetics and biodistribution of novel aptamer compositions. Pharm Res. 2004;21(12):2234–2246. | ||
Dapic V, Bates PJ, Trent JO, Rodger A, Thomas SD, Miller DM. Antiproliferative activity of G-quartet-forming oligonucleotides with backbone and sugar modifications. Biochemistry. 2002;41(11):3676–3685. | ||
Ninichuk V, Clauss S, Kulkarni O, et al. Late onset of Ccl2 blockade with the Spiegelmer mNOX-E36-3′PEG prevents glomerulosclerosis and improves glomerular filtration rate in db/db mice. Am J Pathol. 2008;172(3):628–637. | ||
Bates PJ, Laber DA, Miller DM, Thomas SD, Trent JO. Discovery and development of the G-rich oligonucleotide AS1411 as a novel treatment for cancer. Exp Mol Pathol. 2009;86(3):151–164. | ||
Diener JL, Daniel Lagasse HA, Duerschmied D, et al. Inhibition of von Willebrand factor-mediated platelet activation and thrombosis by the anti-von Willebrand factor A1-domain aptamer ARC1779. J Thromb Haemost. 2009;7(7):1155–1162. | ||
Kaur H, Yung LY. Probing high affinity sequences of DNA aptamer against VEGF165. PLoS One. 2012;7(2):e31196. | ||
Ferlay J, Soerjomataram I, Dikshit R, et al. Cancer incidence and mortality worldwide: sources, methods and major patterns in GLOBOCAN 2012. Int J Cancer. 2015;136(5):E359–E386. | ||
Li X, Zhou HY, Yang L, et al. Enhancement of cell recognition in vitro by dual-ligand cancer targeting gold nanoparticles. Biomaterials. 2011;32(10):2540–2545. | ||
Gao HL, Yang Z, Zhang S, Pang ZQ, Liu QF, Jiang XG. Study and evaluation of mechanisms of dual targeting drug delivery system with tumor microenvironment assays compared with normal assays. Acta Biomater. 2014;10(2):858–867. | ||
Saul JM, Annapragada AV, Bellamkonda RV. A dual-ligand approach for enhancing targeting selectivity of therapeutic nanocarriers. J Control Release. 2006;114(3):277–287. | ||
Kennedy MK, Willis CR, Armitage RJ. Deciphering CD30 ligand biology and its role in humoral immunity. Immunology. 2006;118(2):143–152. | ||
Parekh P, Kamble S, Zhao NX, Portier BP, Zu YL. Immunotherapy of CD30-expressing lymphoma using a highly stable ssDNA aptamer. Biomaterials. 2013;34(35):8909–8917. | ||
Zhang H, Ma Y, Xie Y, et al. A controllable aptamer-based self-assembled DNA dendrimer for high affinity targeting, bioimaging and drug delivery. Sci Rep. 2015;5:10099. | ||
Zhao YX, Shaw A, Zeng X, Benson E, Nyström AM, Högberg B. DNA origami delivery system for cancer therapy with tunable release properties. ACS Nano. 2012;6(10):8684–8691. | ||
Koch S, Tugues S, Li X, Gualandi L, Claesson-Welsh L. Signal transduction by vascular endothelial growth factor receptors. Biochem J. 2011;437:169–183. | ||
Radtke F, Raj K. The role of Notch in tumorigenesis: oncogene or tumour suppressor? Nat Rev Cancer. 2003;3(10):756–767. | ||
Lu YJ, Low PS. Folate-mediated delivery of macromolecular anticancer therapeutic agents. Adv Drug Deliv Rev. 2002;54(5):675–693. | ||
Ebrahimnejad P, Dinarvand R, Sajadi A, et al. Preparation and in vitro evaluation of actively targetable nanoparticles for SN-38 delivery against HT-29 cell lines. Nanomed Nanotechnol Biol Med. 2010;6(3):478–485. | ||
Li P, Wang Y, Zeng F, Chen L, Peng Z, Kong LX. Synthesis and characterization of folate conjugated chitosan and cellular uptake of its nanoparticles in HT-29 cells. Carbohydr Res. 2011;346(6):801–806. | ||
Zhang L, Zhu W, Yang C, et al. A novel folate-modified self-microemulsifying drug delivery system of curcumin for colon targeting. Int J Nanomed. 2012;7:151–162. |
Supplementary materials
In vitro cytotoxicity evaluation of Tris·HCl, MgCl2, and TD
Methods
HT-29 cells were in an exponential phase of growth and were cultured for 48 h at 37°C to allow attachment before experiment. TD (65, 32.5, 6.5, 3.25, 0.65 nM) and TD-2F (65, 32.5, 6.5, 3.25, 0.65 nM) were added to 96-well plates at a cell density of 8×10³ cells/well. Cells were incubated for 24, 48, and 72 h. Tris·HCl (12.5, 6.25, 5, 3.125, 2.5, 1.25, and 0.625 mM) and MgCl2 (12.5, 6.25, 5, 3.125, 2.5, 1.25, and 0.625 mM) were also added to HT-29 cells and incubated for 72 h. Subsequently, designed treatments were removed and 200 μL cell culture medium with CCK8 (2.5%, v/v) was added to each well. After 4 h of incubation, the plates were read for optical density (OD) value at 450 nm by a plate reader. Cell inhibition was calculated as:
|
Results
In all tested concentrations of TM buffer, cell inhibition was <10% and in all tested concentrations of TD and TD-2F, cell inhibition was <5%.
Conclusion
TD, TD-2F, TM buffer were considered safe to be used in this work.
 | Table S1 Sequence of single strand DNA used in this work |
 | Figure S1 Gel electrophoretic analysis of sediment and supernatant from DOX loading experiment. |
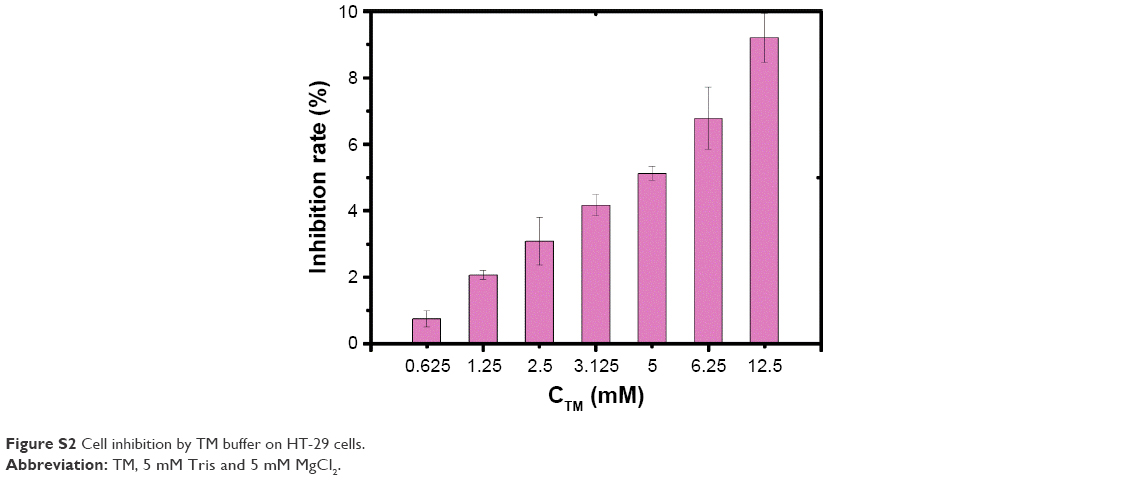 | Figure S2 Cell inhibition by TM buffer on HT-29 cells. |
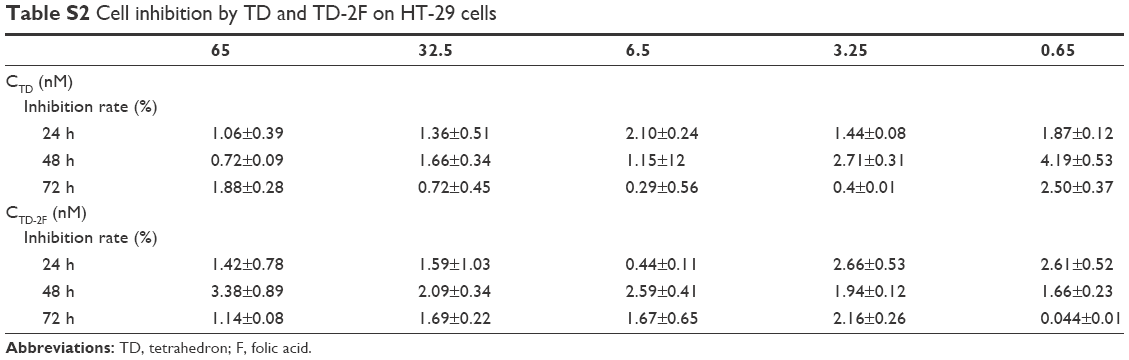 | Table S2 Cell inhibition by TD and TD-2F on HT-29 cells |
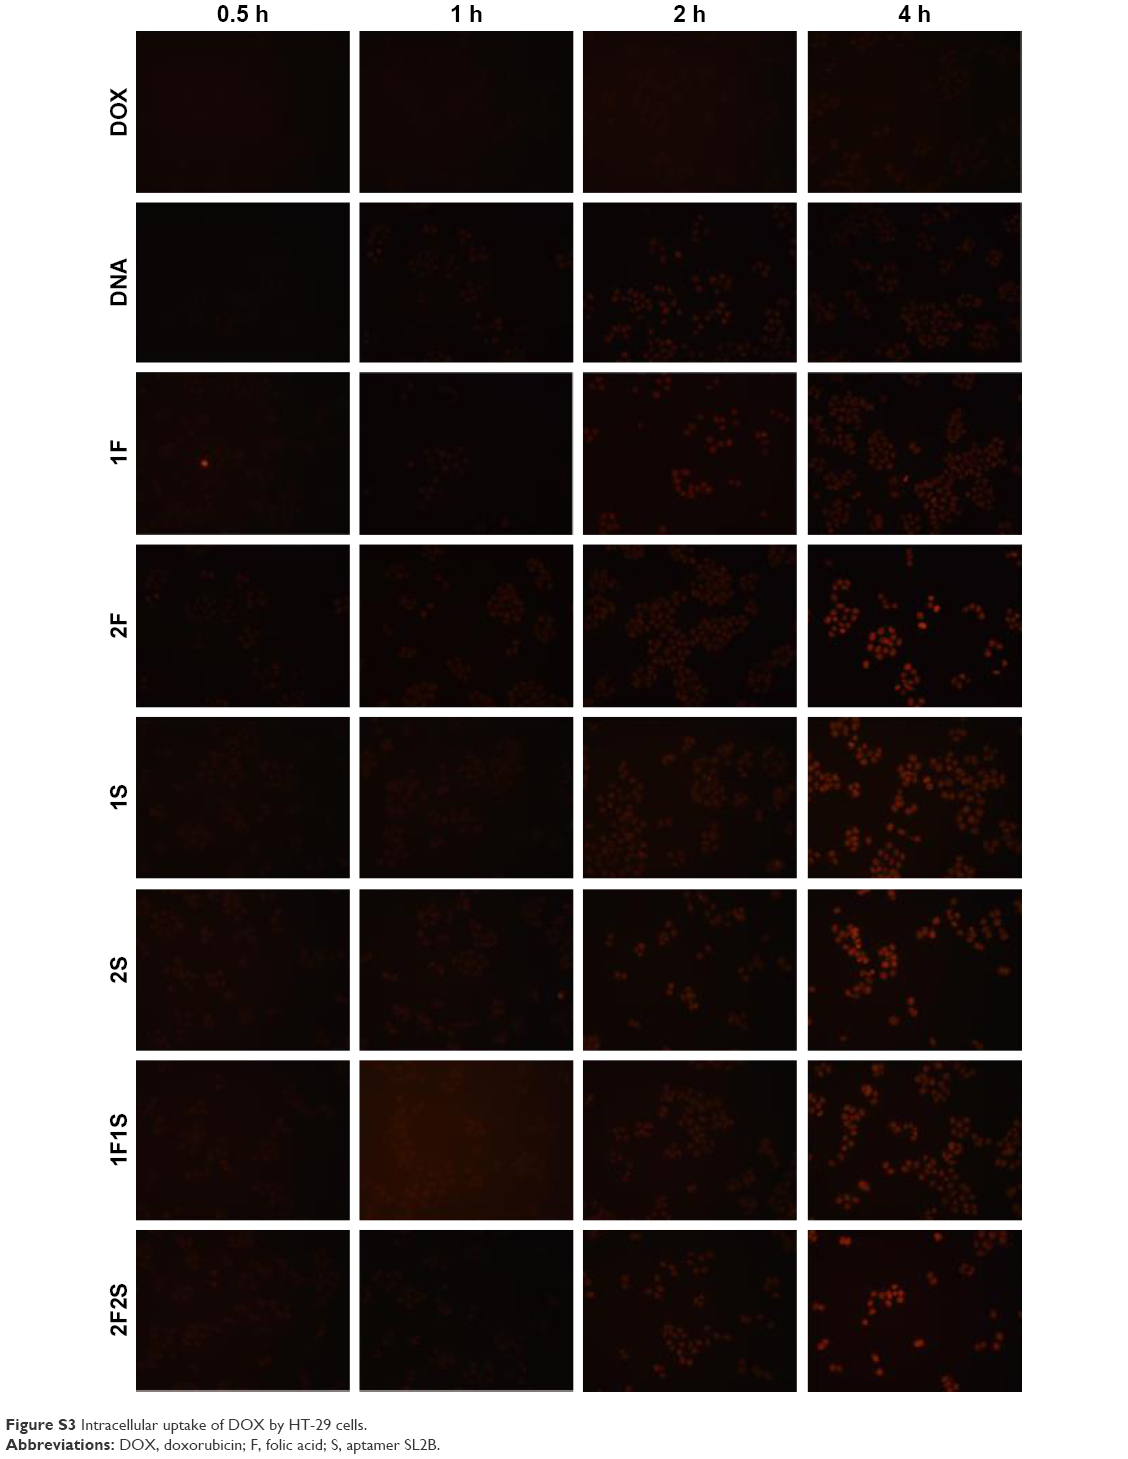 | Figure S3 Intracellular uptake of DOX by HT-29 cells. |
 © 2017 The Author(s). This work is published and licensed by Dove Medical Press Limited. The full terms of this license are available at https://www.dovepress.com/terms.php and incorporate the Creative Commons Attribution - Non Commercial (unported, v3.0) License.
By accessing the work you hereby accept the Terms. Non-commercial uses of the work are permitted without any further permission from Dove Medical Press Limited, provided the work is properly attributed. For permission for commercial use of this work, please see paragraphs 4.2 and 5 of our Terms.
© 2017 The Author(s). This work is published and licensed by Dove Medical Press Limited. The full terms of this license are available at https://www.dovepress.com/terms.php and incorporate the Creative Commons Attribution - Non Commercial (unported, v3.0) License.
By accessing the work you hereby accept the Terms. Non-commercial uses of the work are permitted without any further permission from Dove Medical Press Limited, provided the work is properly attributed. For permission for commercial use of this work, please see paragraphs 4.2 and 5 of our Terms.