")
Back to Journals » International Journal of Nanomedicine » Volume 15
Size-Dependent Effects of Suspended Graphene Oxide Nanoparticles on the Cellular Fate of Mouse Neural Stem Cells
Authors Lin L, Zhuang X, Huang R, Song S, Wang Z, Wang S , Cheng L, Zhu R
Received 1 August 2019
Accepted for publication 1 February 2020
Published 3 March 2020 Volume 2020:15 Pages 1421—1435
DOI https://doi.org/10.2147/IJN.S225722
Checked for plagiarism Yes
Review by Single anonymous peer review
Peer reviewer comments 2
Editor who approved publication: Dr Thomas Webster
Lijuan Lin,1,2,* Xizhen Zhuang,1,2,* Ruiqi Huang,1 Simin Song,1 Zhaojie Wang,1,2 Shilong Wang,3 Liming Cheng,1,2 Rongrong Zhu1,2
1Division of Spine, Department of Orthopedics, Tongji Hospital Affiliated to Tongji University School of Medicine, School of Life Science and Technology, Tongji University, Shanghai, People’s Republic of China; 2Key Laboratory of Spine and Spinal Cord Injury Repair and Regeneration (Tongji University), Ministry of Education, Shanghai, People’s Republic of China; 3Research Center for Translational Medicine at East Hospital, School of Life Science and Technology, Tongji University, Shanghai, People’s Republic of China
*These authors contributed equally to this work
Correspondence: Rongrong Zhu; Liming Cheng
Division of Spine, Department of Orthopedics, Tongji Hospital Affiliated to Tongji University School of Medicine, School of Life Science and Technology, Tongji University, Shanghai 200065, People’s Republic of China
Tel +86 21 66111330
Email [email protected]; [email protected]
Purpose: In this study, we aim to explore the effects of graphene oxide (GO), a derivative of graphene, nanoparticles of four different sizes on the cellular fate of mouse neural stem cells (mNSCs).
Methods: GO NPs were characterized with transmission electron microscopy (TEM), scanning electron micrography (SEM), atomic force microscopy (AFM) and Raman Spectra analysis. The cytotoxic effects of the GO NPs of different sizes on the mNSCs were determined using CCK-8 assay, Annexin V-APC/ 7-AAD staining and EdU staining assays. We investigated the biological and the mechanisms of GO NPs on cells using immunofluorescence analysis and quantitative real-time PCR (qPCR).
Results: The average hydrodynamic sizes of the GO NPs were 417 nm, 663 nm, 1047 nm, and 4651 nm, with a thickness of approximately 22.5 nm, 17.7 nm, 22.4 nm, and 13.4 nm, respectively. GO NPs of all sizes showed low cytotoxicity at a concentration of 20 μg/mL on the mNSCs. Immunostaining demonstrated that treatment with GO NPs, especially the 663 nm ones, enhanced the self-renewal ability of mNSCs in the absence of EGF and bFGF. Under differentiation medium conditions that are free of mitogenic factors, all the GO NPs, particularly the 4651 nm ones, increased the expression level of Tuj1 and GFAP. With regards to the migration ability, we found that 417 nm GO-NP-treated mNSCs migrated over a longer distance than the control group obviously. In addition, higher expression of Rap1, Vinculin and Paxillin was observed in the GO NP-treated groups compared to the control group. mRNA-Sequence analysis and Western blotting results suggested that the 4651 nm GO NPs triggered positive neuronal differentiation through phosphorylation of ERK1/2 by the downregulating of TRPC2.
Conclusion: GO NPs play an important role in the applications of inducing self-renewal and differentiation of mNSC, and are promising in the future for further studies.
Keywords: graphene oxide, neural stem cells, size-dependent, self-renewal, differentiation
Introduction
NSCs are pluripotent and self-renewing cells found in the central nervous system,1,2 and they can differentiate into neurons, oligodendrocytes and astrocytes under specific culture conditions.3–5 Due to these characteristics, they have become one of the most promising candidates for neural regeneration, as well as brain repair.6–8 However, it is challenging to control the eventual fate of NSCs, which restricts the application of NSCs in tissue engineering and regenerative medicine.
One of the traditional methods to control the growth and differentiation of NSCs is to culture them in a medium containing both chemical inducers and growth factors. Mitogen signals such as basic fibroblast growth factor (bFGF) and epidermal growth factor (EGF) are widely considered to play a crucial role in the proliferation and differentiation of NSCs in vitro, as well as in maintaining their self-renewal ability of NSCs.9
Nanotechnology involves the development of nanomaterials in sizes ranging from 1 to 100 nm.10 At such a small scale, the physical, chemical, and biological properties of materials are often quite different, which has brought unprecedented possibilities for its usage in the field of drug delivery, imaging, diagnostics, and other medical applications, especially stem cell research.11–13
Over the past few decades, researches on graphene have been increasing rapidly for applications in fields of nanomaterials and nanotechnology, especially in tissue engineering and regenerative medicine.14 Graphene is a two-dimensional nanoparticle comprising of a single layer with six atoms arranged in a honeycomb lattice in sp2 hybridization.15 Of all its derivatives, graphene oxide, is notably favored for stem cell research because of its excellent biocompatibility, as well as outstanding electrical, thermal, mechanical and chemical properties.16 In fact, great values of graphene oxide in many promising applications of GO NPs have been reported recently,17,18 including biosensing,19,20 cell imaging,21 drug delivery,21–24 gene delivery,25 cancer therapy22,23 and tissue engineering.24 Moreover, stem cells treated with GO were found to show enhanced neural differentiation.26–28 However, only a few reports have research focused on exploring the effects of the sizes of the GO NPs on the cellular functions of NSCs.
In this study, we explored the size-dependent effects of GO NPs on the self-renewal and differentiation of mNSCs. GO NPs with mean sizes of 417 nm, 663 nm, 1047 nm and 4651 nm were prepared and used for treating the cells. Then we evaluated the cytotoxicity of these NPs, as well as their effect on the cell cycle, cell proliferation, pluripotency, potential for differentiating into specific lineages and migration of mNSCs. Furthermore, we evaluated the role of GO NPs play in maintaining the self-renewal of the mNSCs in place of EGF and bFGF. Our research demonstrated that the particle size of GO had an effect on controlling the fate and cellular functions of mNSCs.
Materials and Methods
Materials
Graphene oxide nanoparticles of different sizes were purchased from Aladdin Co. and Nanjing JiCang Nano Technology Co., Ltd.
Characterization of Nanoparticles
A transmission electron microscope (TEM, JEOL-1230, Japan) was used to observe the morphology of the GO NPs. The samples were dispersed in double-distilled water and several drops of each suspension were placed on the carbon-coated copper TEM grid. The diameter and zeta potential of different particles were measured using the Malvern zeta sizer nano-zs90 (Malvern, UK). The thickness and roughness of GO NPs were examined by atomic force microscopy (AFM). The structure and mechanical properties were analyzed using by Raman spectrometry by exciting with a 514 nm argon laser (Renishaw, UK).
Cell Culture
Mouse NSCs were isolated from the forebrain of C57 mice at E13.5.29 The use of cells was approved by the Ethical Committee of Tongji University of Medicine. Mice, from which we isolated cells, were approved by the Institutional Animal Care Committee of Tongji University. We have complied with all relevant ethical regulations. Cells were cultured as neurospheres in Dulbecco′s modified eagle′s medium/nutrient mixture F-12 (DMEM/F12) medium (Gibco), supplemented with 2% B-27 (Gibco), 1 mM L-glutamine (Gibco), 1% nonessential amino acids (Gibco), basic fibroblast growth factor (bFGF) (20 ng/mL, Peprotech), and epidermal growth factor (EGF) (20 ng/mL, Peprotech). One half of the culture medium was replaced with fresh medium every 2 days. The mNSCs were cultured in a humidified incubator with 5% CO2 at 37°C.
Cytotoxicity Assay
The cytotoxicity of the NPs was indicated by the relative cell viability compared with the control group and was examined using a CCK-8 cell proliferation kit (KeyGen Biotech, China). The cell suspension (100 μL) were cultured in 96-well plates with a density is 1 × 10⁴ cells in per well. Then, fresh culture medium containing GO NPs of different sizes at the concentration of 5, 10, 20, 50, and 100 μg/mL was added to the wells, and cells treated only with medium were used as the control. CCK-8 reagent (10 μL) was added to each well, and the plates were incubated for another 1–4 h at 37°C in the darkness. The absorbance was measured at a wavelength of 450 nm using a microplate reader (SpectraMax M5, Molecular Devices).
Cell Apoptosis Assay
mNSCs were seeded into six-well plates. GO NPs at a fixed concentration of 20 μg/mL were added to each well and incubated for 24 h. Subsequently, cells from different treatment groups were harvested and rinsed twice with PBS. They were labeled with Annexin V-FITC/PI using an Apoptosis Detection Kit (KeyGen Biotech, China) and examined using a flow cytometer (Becton Dickinson, USA). The Flowjo software was used to analyze the results.30
Cell Cycle Assay
We examined the effect of the GO NPs on the cell cycle of mNSCs using the cell cycle detection kit (KeyGen Biotech, China). mNSCs were seeded into six-well plates (at a density of 1 × 10⁵ cells per well). Following that, 20 μg/mL of GO NPs were added to the wells and incubated for 24 h. The cells were then harvested and fixed in 70% ethanol (ice-cold) at 4°C overnight. Subsequently, the cells were resuspended in PBS (pH 7.4), incubated with RNase A (40 μg/mL) and PI (10 μg/mL), and then kept in the darkness. Finally, flow cytometry (Becton Dickinson, USA) was performed and the results were Flowjo software.
EdU Cell Proliferation Assay
The effect of GO NPs on the proliferation of mNSCs was tested by using the Click-iT Edu Kit (KeyGen Biotech, China) with the Alexa Fluor488 dye. The mNSCs were seeded on poly-L-ornithine (PLO)-coating six-well plates at a concentration of 1.0 × 10⁵ cells per well and cultured till attachment. After an overnight incubation, the culture medium was replaced with the medium containing 20 µg/mL of GO NPs. After a 24 h incubation period, the samples were treated using the kit according to the manufacturer’s instructions. The proliferation rate indicated by the fluorescence intensity was observed using a fluorescence microscope.
Induction of Spontaneous Differentiation of mNSCs
To induce spontaneous differentiation of mNSCs, neurospheres were seeded onto PLO-coating six-well plates, which are known to support the adhesion of NSCs. GO NPs at a concentration of 20 μg/mL were added, and the cells were incubated in differentiation medium free of mitogenic factors for 24 h. The cells were subsequently harvested for immunofluorescence and subjected to qPCR.
Cell Migration
The mNSCs were passaged every 4 days and on the 3rd day after passage, neurospheres were seeded into PLO-coated six-well plates and cultured till attachment. GO NPs at a concentration of 20 μg/mL were then added and incubated for 24 h. The morphology and migration distances of the samples were observed under a bright field of photon microscope (Nikon ECLIPSE Ti) and confocal microscope (LSM 700, Carl Zeiss, Jena, Germany).
Immunofluorescence
mNSCs were fixed with 4% (w/v) paraformaldehyde at 37°C for 15 min and washed three times with PBS. The samples were permeabilized with 0.3% (v/v) Triton X-100 for 10 min, and then washed and blocked with 5% (v/v) goat serum for 1 h. The samples were incubated at 4°C overnight with primary antibodies as follows: mouse monoclonal anti-Nestin (1:200, Abcam), mouse monoclonal anti-NeuN (1:200, Abcam, conjugated with AlexaFluor 488) and mouse monoclonal anti-GFAP (1:200, Abcam, conjugated with Cy3). After gently rinsing with PBS, the samples were incubated with secondary antibodies [AlexaFluor 488-conjugated goat anti-mouse IgG (Invitrogen) for 1 h. The nuclei were stained with 4′,6-diamidino-2-phenylindole (DAPI) and the fluorescence images were taken using a confocal microscope (LSM 700, Carl Zeiss, Jena, Germany).
Western Blotting
After treatment with GO NPs treatments, the cells were collected and washed with PBS, and the total proteins were extracted. The membranes were blocked in 5% (w/v) bovine serum albumin (BSA) in TBST was incubated overnight with primary antibodies (β-actin, ERK1/2, and p-ERK1/2) overnight at 4°C. After washing with TBST several times, the membranes were incubated with second antibodies for 60 mins at room temperature. A chemiluminescence detection system (Santa Cruz Biotechnology, Santa Cruz, CA, USA) was used to observe bands. The primary antibodies used in this study included β-actin(ab8227, Abcam), ERK1/2(ab184699, Abcam), and pERK1/2(ab32538, Abcam).
Quantitative Real-Time PCR
The total RNA was isolated from the mNSCs using the Trizol® reagent (Invitrogen). The concentrations and quality of RNA were measured using an ND-1000 spectrophotometer (Nanodrop) for further experiments. cDNA was synthesized with a Primer Script Reverse Transcriptase Kit (Takara) according to the manufacturer’s instructions. qPCR was performed using SYBR Premix Ex Taq™ (Takara) on a 7500 Real-Time PCR System. GAPDH was used as the internal reference. Supplementary Figure S1 shows all the primer sequences.
Statistical Analysis
All results were shown as means ± standard deviation (SD). Statistical analysis was performed using the Statistical Product and Service Solutions software. One-way analysis of variance was taken for each analysis. Values with *P < 0.05, **P < 0.01, ***P < 0.001 were considered significant.
Results
Characterization of Graphene Oxide Nanoparticles
We observed the morphology and surface topography of the GO NPs using TEM and SEM. The images showed the stacked multi-layer structure (Figure 1A), the irregular edges (Figure 1A) and the wrinkle surface (Figure 1B) of the GO NPs. The average hydrodynamic sizes of the GO NPs were 417 nm, 663 nm, 1047 nm, and 4651 nm (Figure 1C), which changed to 466 nm, 680 nm, 1109 nm, and 4638 nm, respectively, in the cell culture medium (Figure S2). These results indicated that there were no obvious differences in the size of the GO NPs in water and in cell culture medium. The average zeta potentials of the GO NPs in water were −32.8 mV (417 nm), −37 mV (663 nm), −36.8 mV (1047 nm), and −35 mV (4651 nm) (Figure 1D). The thicknesses of the GO NPs detected by AFM were approximately 22.5 nm, 17.7 nm, 22.4 nm, and 13.4 nm for NPs of sizes 417 nm, 663 nm, 1047 nm, and 4651 nm, respectively (Figure 1E). The thickness of the single-layered GO NPs was between 0.7nm and 1.2nm, indicating that the NPs in used this study consisted of approximately 10 to 20 layers. The structure and the physical properties of the GO NPs were measured using Raman spectroscopy (Figure 1F). The specific G-band was observed at ~1580 cm−1 and the D-band, which represented sp3 carbon defects, was observed at ~1350 cm−1.
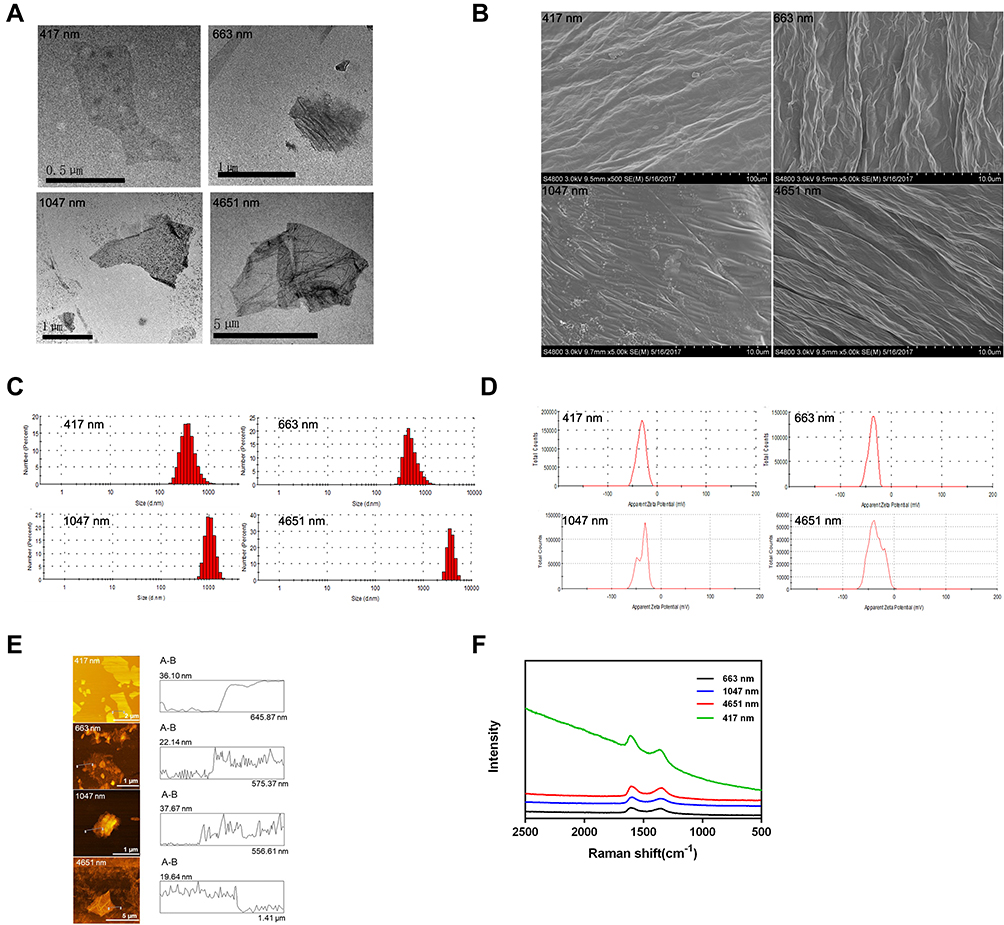 |
Figure 1 Characterization of graphene oxide nanoparticles. (A) TEM images of GO NPs; (B) SEM images of GO NPs. Scale Bars: 100 µm (for 417 nm)10.0 µm (for 663=nm,1047 nm and 4651nm); (C) Size distributions of GO NPs in water; (D) Zeta potentials of GO NPs in water; (E) AFM images of GO NPs; (F) Raman spectra analysis of the GO NPs. |
Evaluation of Biocompatibility of Graphene Oxide Nanoparticles
Before investigating the effects of the GO NPs of different sizes on the self-renewal and differentiation of mNSCs, we tested the cell viability of mNSCs cultured with GO NPs at different concentrations for 24 hrs. The CCK-8 assay demonstrated that GO NPs at concentrations from 5 to 20 μg/mL showed less cytotoxicity after the 24 h period, but when the cells were exposed to higher concentrations, especially 100 μg/mL, the cell viability decreased significantly, confirming that the cytotoxicity of the GO NPs increases in a dose-dependent and size-dependent manner (Figure 2A). Besides, the 417 nm GO NPs seemed to have lower cytotoxicity than the GO NPs of larger sizes. However, we found that the GO NPs causes cell damage at high concentrations and hence, the concentration of GO NPs was set at 20 μg/mL for the following experiments.
Then, we assessed whether these GO NPs could induce apoptosis in the mNSCs using the annexin V/propidium iodide dual staining assay. Flow cytometry analysis demonstrated that the rate of cellular apoptosis and necrosis were not significantly affected at a concentration of 20 μg/mL for 24 h (Figure 2B and C).30 These data indicated that the GO NPs we used in this study were biocompatible with the mNSCs when used at doses under 20 μg/mL.
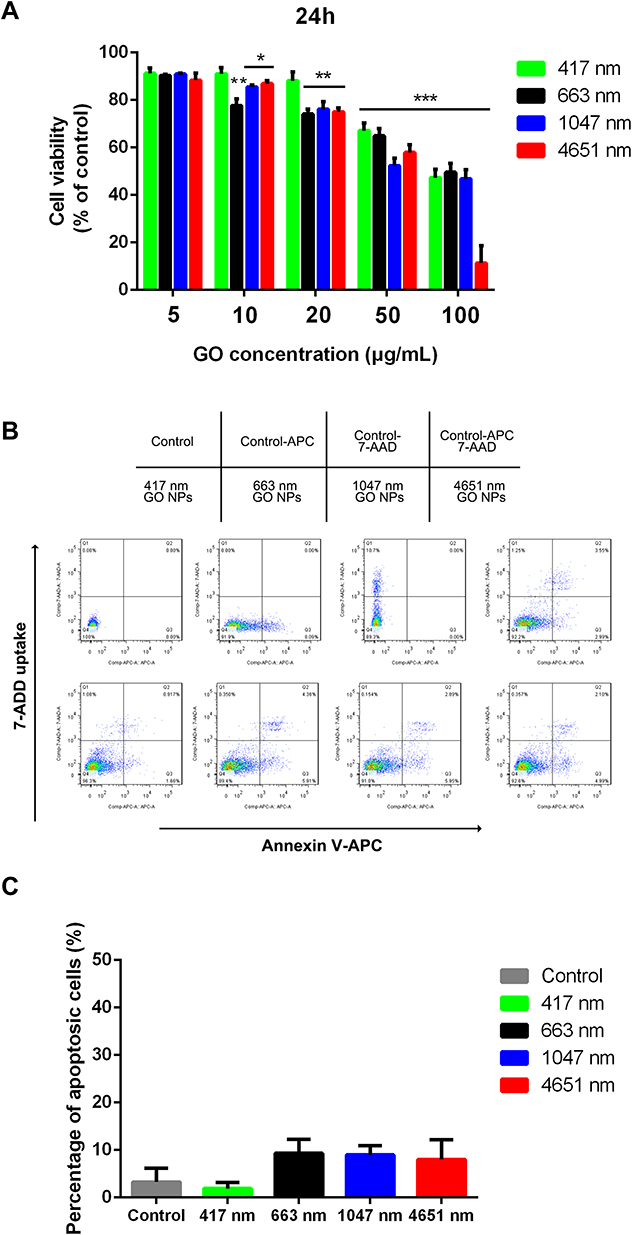 |
Figure 2 Effect of graphene oxide nanoparticles on the viability and proliferation of mNSCs. (A) CCK-8 assay was performed to evaluate the cell viability of mNSCs after treatment with 417 nm, 663 nm, 1047 nm and 4651 nm GO NPs at concentrations ranging from 5 to 100 μg/mL for 24 h. Data show the means ± standard error of the mean of three independent experiments. ***p < 0.001, **p < 0.01 and *p < 0.05 compared with the control group. (B) Apoptosis of mNSCs treated with GO NPs of different sizes at a concentration of 20 μg/mL for 24 h. (C) Quantification of cellular apoptosis. Data show the means ± standard error of the mean. |
Cell cycle assay is an effective way to detect apoptotic cells. Flow cytometric analysis was used to measure the cell cycle progression of mNSCs treated with GO NPs. After being incubated with 20 μg/mL of GO NPs for 24 h, the cell cycle distribution of mNSCs showed no significant change compared to the control group (Figure 3A and B). The results were within the margin of error, showing good biocompatibility of the GO NPs with mNSCs.
Furthermore, the effects of the GO NPs on the proliferation of mNSCs were then evaluated by the EdU proliferation assay at a concentration of 20 μg/mL for 24 h (Figure 3C). The intensity of green fluorescence of EdU revealed that the proliferation of mNSCs did not change much in the four GO NPs-treated groups at a concentration of 20 μg/mL compared to the control group (Figure 3D), demonstrating good biocompatibility.
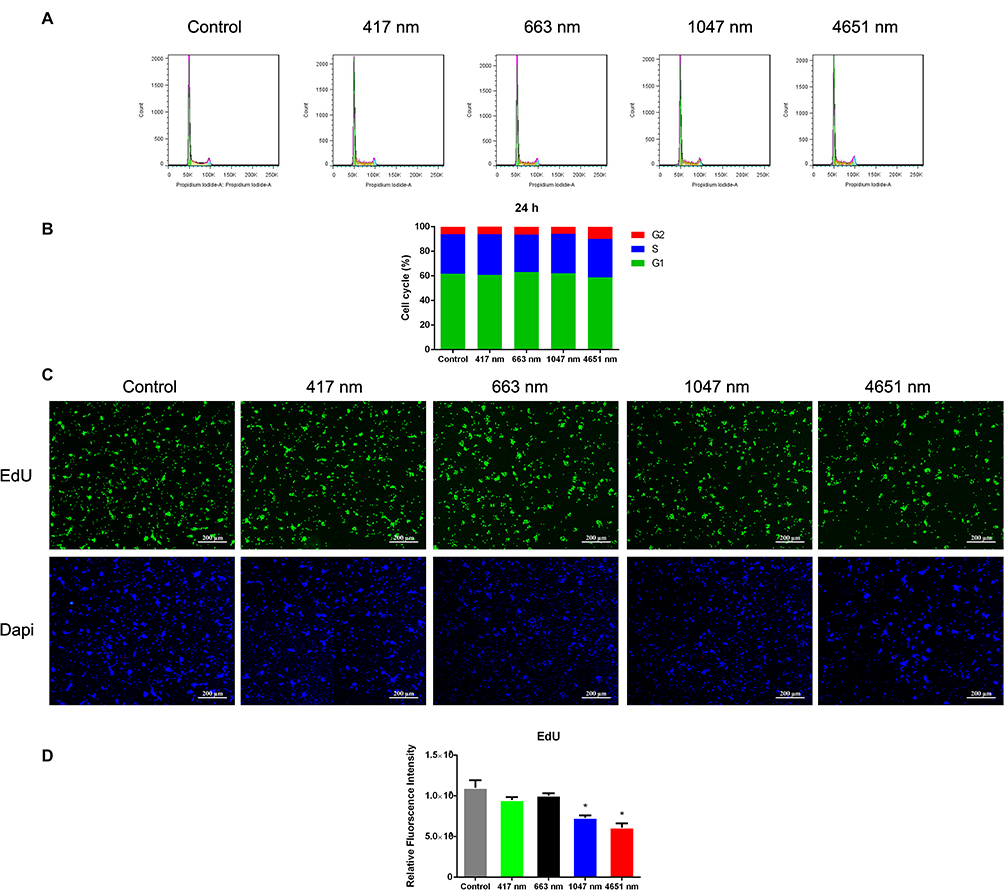 |
Figure 3 Effects of graphene oxide nanoparticles on the cell cycle and cell proliferation. (A) Effects of exposure to 417 nm, 663 nm, 1047 nm and 4651 nm GO NPs (20 μg/mL) for 24 h on the cell cycle of mNSCs. (B) Percentage distribution of cells in different cell cycle stages. (C) Fluorescence of EdU (green) revealed the proliferation rate of mNSCs treated with 417 nm, 663 nm, 1047 nm and 4651nm GO NPs (20 μg/mL) after 24 h incubation. Nuclei were stained with DAPI (blue). Scale bars: 200 μm. (D) Quantification of fluorescence intensity. Data show the means ± standard error of the mean of three independent experiments. *p < 0.05 compared with the control group. |
GO NPs Enhanced the Self-Renewal of mNSCs in the Absence of EGF and bFGF
The aforementioned results showed good biocompatibility of the GO NPs with the cultured mNSCs at concentrations less than 20 μg/mL. Then, we examined the effects of GO NPs of different sizes on the self-renewal of mNSCs. The cells were cultured in the proliferation medium with GO NPs for 24 h and the gene expression of Nestin, which is responsible for pluripotency in the NSCs, was examined by immunofluorescence staining. As shown in Figure 4A, there was no significant change in the morphology and the expression of Nestin did not change significantly. In the absence of EGF and bFGF, we observed under a bright field of microscope that the cells in all four groups treated with GO NPs maintained spherical morphology, whereas the groups not treated with EGF and bFGF, as well as GO NPs showed differentiation (Figure 4C). Immunofluorescence staining was also performed to detect the expression of Nestin in the absence of EGF and bFGF and the green fluorescence signals corresponding to Nestin were stronger in the groups treated with EGF and bFGF and GO NPs than the group without EGF and bFGF (Figure 4B). To further evaluate the effects of the GO NPs on the mNSCs at the mRNA level, total RNA was isolated from the GO NPs-treated cells and the expression level of Nestin mRNA was analyzed using qPCR. Treatment with GO NPs of all four sizes, especially the 663 nm GO NPs, upregulated the mRNA expression of the pluripotency marker Nestin in mNSCs compared with the group without EGF and bFGF, which was consistent with the immunostaining results. (Figure 4D). These results demonstrated that GO NPs enhanced the self-renewal of mNSCs in the absence of EGF and bFGF.
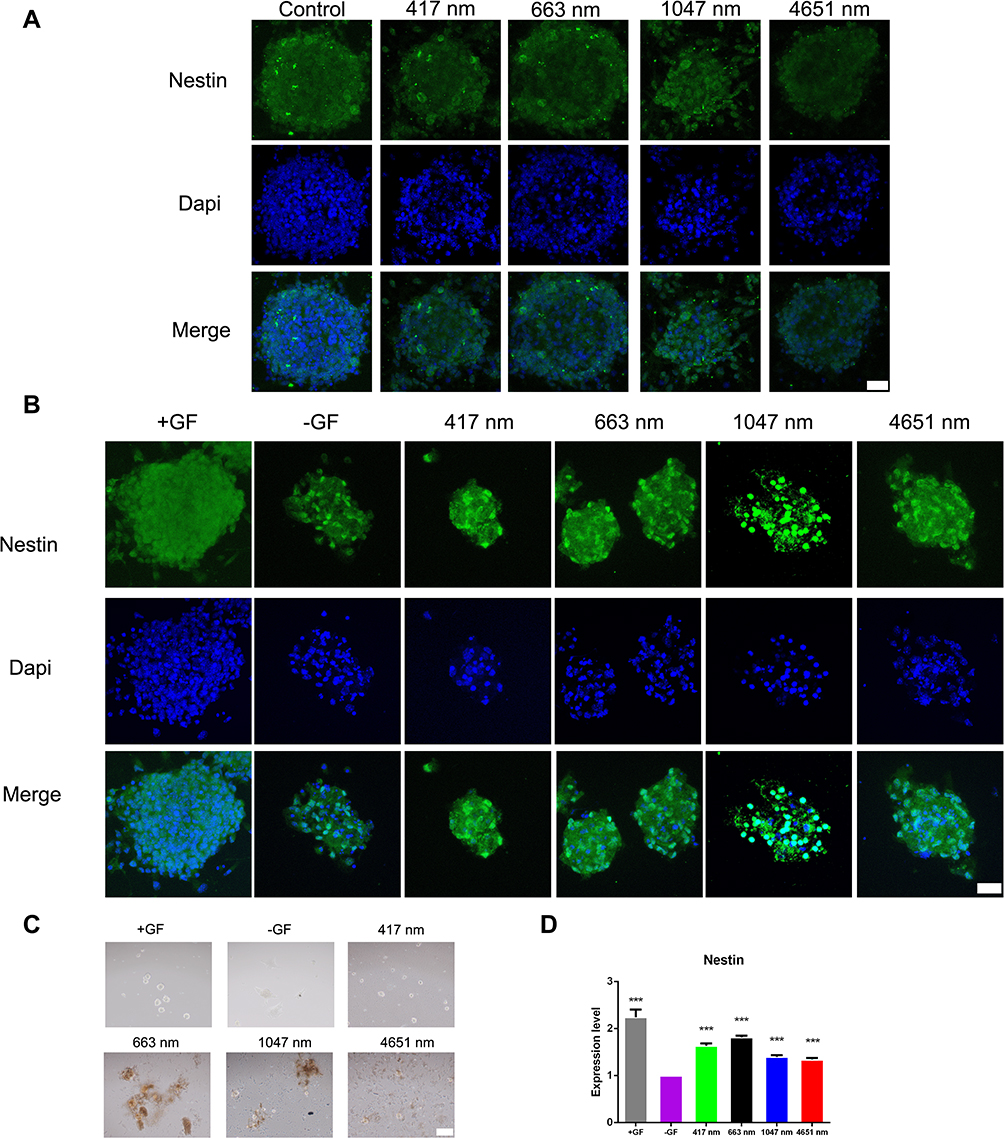 |
Figure 4 Effects of graphene oxide nanoparticles on the self-renewal of mNSCs in the absence of EGF and bFGF. (A) Immunofluorescence images of mNSCs treated with 417 nm, 663 nm, 1047 nm and 4651 nm GO NPs (20 μg/mL) for 24 hrs. The cells were co-stained with Nestin (green) and nuclei (blue). Scale bars: 20 μm. (B) Immunofluorescence images of mNSCs treated with 417 nm, 663 nm, 1047 nm and 4651 nm GO NPs (20 μg/mL) for 24 hrs in the absence of EGF and bFGF. The cells were co-stained with Nestin (green) and nuclei (blue). Scale bars: 20 μm. (C) Bright field images of neurospheres treated with 417 nm, 663 nm, 1047 nm and 4651nm GO NPs (20 μg/mL) for 24 hrs in the absence of EGF and bFGF. Scale bars: 500 μm. (D) Relative mRNA expression levels of pluripotency marker gene Nestin, GAPDH was used for internal normalization in the quantitative RT-PCR. Data show the means ± standard error of the mean of three independent experiments. ***p < 0.001 compared with the cells cultured in the absence of EGF and bFGF. |
GO NPs Accelerated the Differentiation of mNSCs
As we observed that GO NPs enhanced the self-renewal of mNSCs in the absence of EGF and bFGF to some extent, we next evaluated the differentiation potential of the treated cells grown in differentiation medium conditions without mitogenic factors. NSCs have the capacity to generate three basic neural cell types (neurons, astrocytes, and oligodendrocytes) under spontaneous induced differentiation conditions. The immunofluorescence images showed that neurospheres cultured with 20 μg/mL of GO NPs exhibited higher levels of the expression of neuron specific marker NeuN and astrocyte specific marker GFAP than the control group (Figure 5A), indicating accelerated differentiation of the mNSCs. Moreover, the expression of differentiation-related genes at mRNA level was also analyzed by using qPCR. Tuj1 served as the neuronal marker and GFAP served as the astrocyte marker (Figure 5B). While GO NPs of all four sizes increased the expression levels of Tuj1 and GFAP, the 4651 nm GO NPs showed more obvious effects on promoting the differentiation of mNSCs than the other three GO NPs.
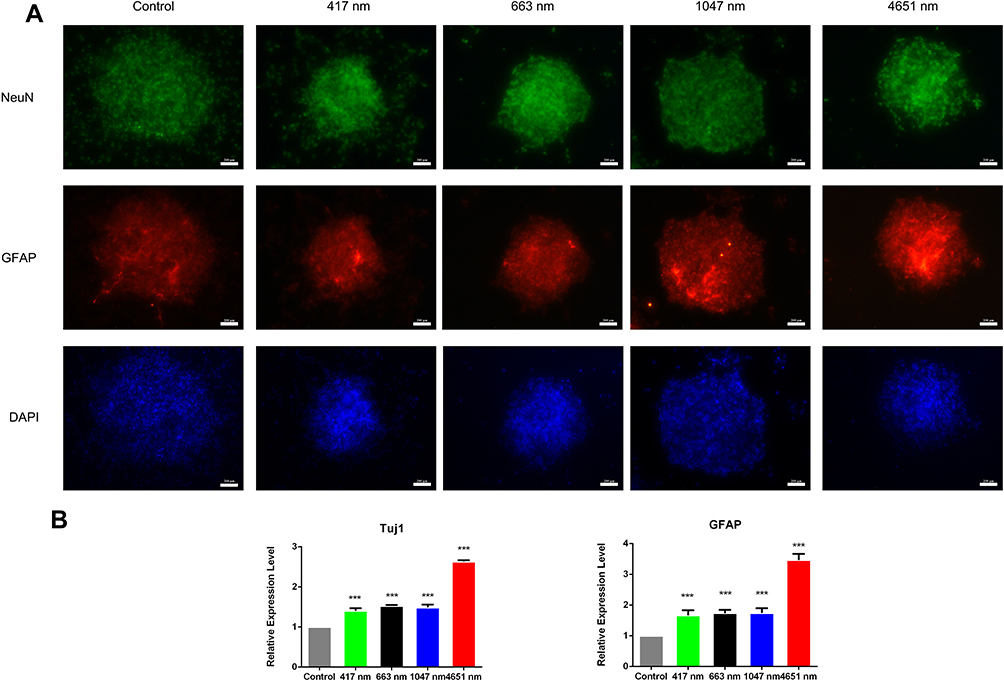 |
Figure 5 Spontaneous differentiation of neurospheres cultured with graphene oxide nanoparticles. (A) Immunofluorescence images of mNSCs treated with 417 nm, 663 nm, 1047 nm and 4651 nm GO NPs (20 μg/mL) for 24 hrs. The cells were co-stained with NeuN (green), GFAP (red) and nuclei (blue). Scale bars: 200 μm. (B) Relative mRNA expression levels of the neuron marker gene Tuj1 and astrocyte marker GFAP were measured. GAPDH was used for internal normalization in the quantitative RT-PCR. Data show the means ± standard error of the mean of three independent experiments. ***p < 0.001 compared with the control group. |
GO NPs Improved the Migration of mNSCs
In the treatment of many neurodegenerative diseases of the central nervous system, even though NSCs can be transplanted exogenously or activated endogenously, these neural stem cells still need to migrate to the area of damage to differentiate into functional neural cells.31,32 Hence, we evaluated the effect of GO NPs on the migration ability of mNSCs. We observed the outgrowth and extension of neurites from the GO NPs-treated neurospheres that were attached to the culture plate while the untreated neurospheres maintained their spherical morphology with smooth edges, as seen under the bright field of photon microscope (Figure 6A). Immunostaining results, as shown in Figure 6B, also indicated that the mNSCs which expressed Nestin, could migrate over a significantly longer distance after treatment with 417 nm, 663 nm and 1047 nm GO NPs than the control group. The 4651 nm GO NP-treated cells showed enhanced migration of the mNSCs over a longer distance compared with that in the control group; however, the migration was not as much as in the other GO groups. To determine the underlying mechanism of GO NP effect on the migration of mNSCs, the expression of focal adhesion-related genes Rap1, Vinculin and Paxillin were analyzed at the mRNA level using qPCR. As shown in Figure 6C, we observed significant increases in the expression of Rap1, Vinculin and Paxillin in the GO NPs-treated groups compared with the control group, which explained the improved migration of mNSC.
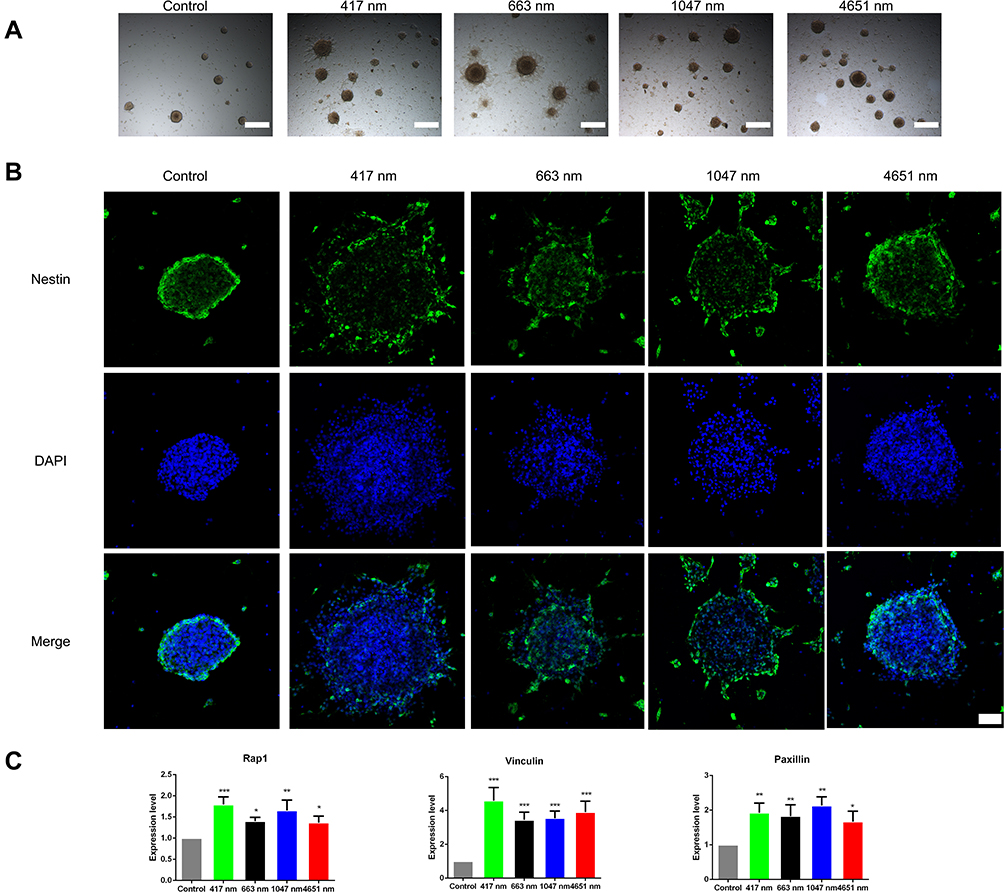 |
Figure 6 Effects of graphene oxide nanoparticles on the migration of mNSCs. (A) Bright field images of the neurospheres treated with 417 nm, 663 nm, 1047 nm and 4651 nm GO NPs (20 μg/mL) for 24 hrs. Scale bars: 500 μm. (B) Immunofluorescence images of mNSCs treated with 417 nm, 663 nm, 1047 nm and 4651 nm GO NPs (20 μg/mL) for 24 hrs. The cells were co-stained with Nestin (green) and nuclei (blue). Scale bars: 50 μm. (C) Relative mRNA expression levels of the focal adhesion gene Rap1, Vinculin, and Paxillin were shown. GAPDH was used for internal normalization in the quantitative RT-PCR. Data show the means ± standard error of the mean of three independent experiments. ***p < 0.001, **p < 0.01 and *p < 0.05 compared with the control group. |
ERK 1/2 Signal Pathway Is Involved in 4651 nm GO NP-Induced Neuronal Differentiation of NSCs
As the 4651 nm GO NPs-treated mNSCs had the highest tendency for undergoing neuronal differentiation, it was still not clear why it could enhance the differentiation only to a certain degree. To understand the underlying mechanism, a comprehensive transcriptome analysis was performed using mRNA-sequence analysis with 2D principal component analysis (2D PCA). We observed that for both the samples, all the genes could be clearly distinguished for 4651 nm GO NP-treated group than the control group (each group consisted of samples in replicates) (Figure 7A). The differentially expressed genes were enriched and divided into several apparent signaling pathways using Gene Ontology and Kyoto Encyclopedia of Genes and Genomics (KEGG) analysis, respectively (Figure 7B and C). Among the differentially expressed genes, we picked out TRPC2, a gene related to axon growth, which was downregulated dramatically in this group. Generally, downregulation of TRPC2 leads to phosphorylation of ERK1/2,33 which in turns, initiates neuronal differentiation of NSCs.34–36 Therefore, the ERK1/2 signal pathway was chosen for further studies. The effect of 4651 nm GO NPs on the mNSC was examined using Western blotting and q-PCR. As is shown in Figure 7E, TRPC2 expression in the 4651 nm GO NP-treated cells was dramatically lower than in the control group, which is consistent with the mRNA-sequence analysis results (Figure 7D). Besides, treatment of mNSCs, with the 4651 nm increasingly enhanced the expression level of pERK1/2, showing that it is likely that the enhancement of NSC differentiation via ERK1/2 signaling pathway is the key underlying mechanism.
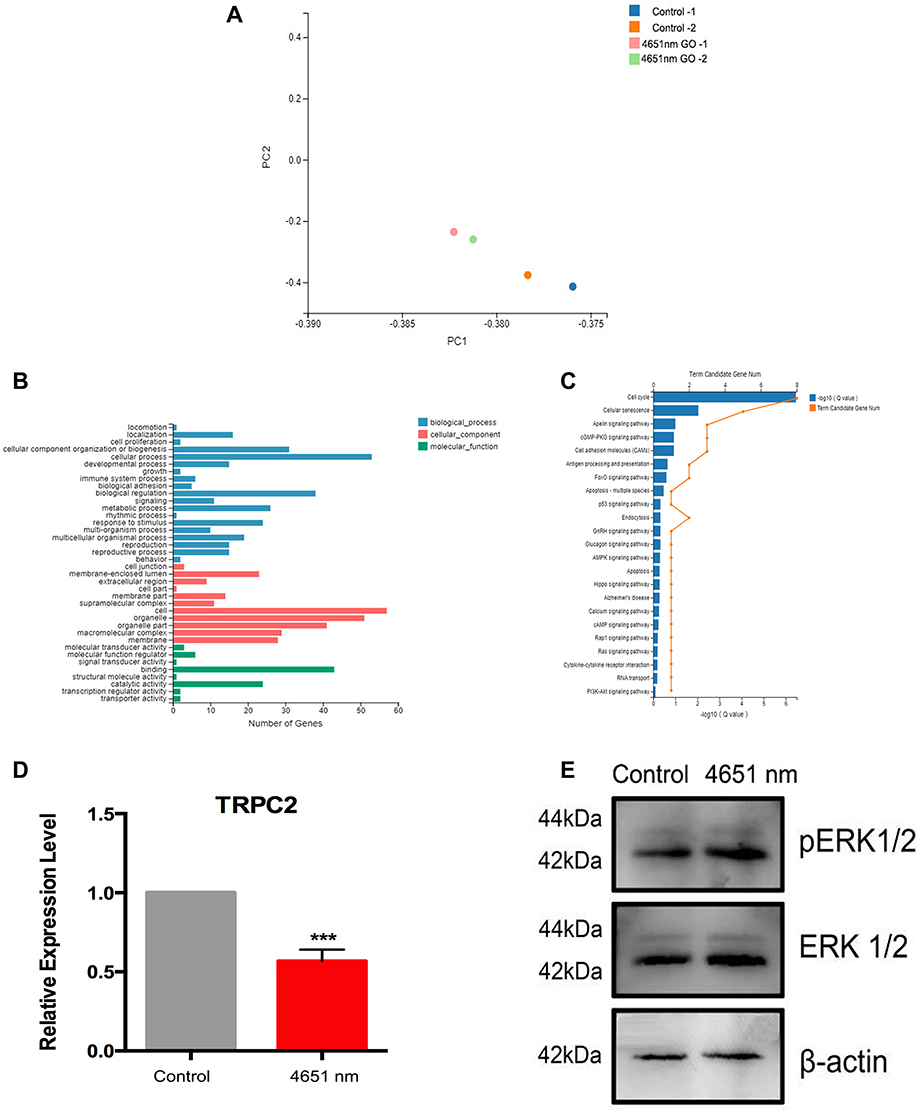 |
Figure 7 Effects of 4651 nm graphene oxide nanoparticles on the differentiation mechanism of mNSCs. (A) 2D principal component analysis using the genome-wide expression data for the 4651 nm GO NPs and control group using R Studio. (B) KEGG pathway analysis of the genes regulated in the 4651 nm GO NP-treated mNSCs. (C) GO pathway analysis of the regulated genes in the 4651 nm GO NP-treated mNSC. (D) Relative mRNA expression levels of gene TRPC2, GAPDH was used for internal normalization in the quantitative RT-PCR. Data show the means ± standard error of the mean of three independent experiments. ***p < 0.001 compared with the control group. (E) Western blotting results. |
Discussion
In vitro and in vivo studies have shown that hydrophilic GO NPs are less toxic than the hydrophobic ones.37–40 The suspended graphene particles tend to agglomerate in the cell culture medium, covering the cell surface as the concentration increases, limiting the nutrient supply and leading to oxidative stress-induced apoptosis. However, as GO is more stable in solution, it can be used for easy absorption of proteins on the cell surface by avoiding direct interaction with the cells, and hence reducing the cytotoxicity. The cytotoxicity of the suspended GO NPs depends mainly on surface chemistry, particle size, shape and concentration.41,42 Meanwhile, the rations of carbon-to-oxygen of four GO NPs are measured by a FEI Titan G2 80–300, which is a STEM integrated with corrected electron optics, to measure the carbon-to-oxygen ration of GO NPs. The principle edges of carbon and oxygen are 284 eV and 532 eV, respectively, and the rations of carbon-to-oxygen of four GO NPs are calculated.43 As is shown in Figure S3, the rations of the carbon-to-oxygen of four sizes are 11:1 (417 nm), 11.2:1 (663 nm), 11.7:1 (1047 nm) and 12.5:1 (4651 nm). With the hydrophilicity of GO NPs decreasing, the carbon-to-oxygen ration increases, which probably affects its solubility and toxicity.44 In our study, GO NPs of approximately 5 µm size exhibited higher cytotoxicity than other GO NPs at concentrations of 100 μg/mL, possibly because of greater coverage of the cell surface leading to nutrient deficiency and more oxidative stress-induced apoptosis.
Several studies have demonstrated that the fate of theNSCs is determined by both the internal genes and exogenous signals. Internal regulation refers to the regulation via transcription factors belonging to the Notch signaling pathway, bHLH transcription factor family and Wnt signal pathway.45,46 They are activated in a specific manner leading to activation or inhibition of the expression of downstream genes, and ultimately influencing the proliferation and differentiation of NSCs. Exogenous signal regulation refers to the regulation of several aspects of the microenvironment in which NSCs are located, including cytokines,9,47 extracellular matrix (ECM),48 and neighboring cells.49,50
The composition and concentration of cytokines-like growth factors determine the fate of stem cells by transferring exogenous signals into cells through the corresponding membrane receptor. In this study, surprisingly, we found that GO NPs are capable of replacing EGF and bFGF in maintaining the self-renewal of mNSCs in vitro to some extent. GO NPs possess special surface topography and mechanical properties such as hardness, elasticity and porosity, which provide similar growth environment for stem cells like NSCs.51–54 In addition to the structural topography and mechanical properties, the interaction between the stem cells and the biomaterials have also accounted for cellular behavior.55 Stress from ECM can possibly activate or suppress certain genes specific to proliferation and differentiation of NSCs, leading to promotion of self-renewal.49,56 Notably, there is higher possibility of smaller suspended GO NPs interacting with mNSCs than larger ones, which may explain the better ability of 417 nm and 663 nm GO NPs in maintaining self-renewal of mNSCs. However, the exact mechanism of GO NPs in maintaining the self-renewal of mNSCs in the absence of EGF and bFGF is still unclear and needs further investigation.
The extracellular matrix consists of a variety of glycoproteins and mucins that influence the and differentiation of NSCs by regulating their adhesion and migration.57 Due to the unique characteristics of NPs such as specific nano-scale morphology, roughness and elasticity, GO NPs can mimic the extracellular matrix microenvironment, enabling the adsorption of biomolecules and the formation of adhesive spots.58,59 Under conditions that induce differentiation, the attachment of the cells was reinforced and the relative focal adhesion signaling pathway was activated after treatment with GO NPs, resulting in increased expression of Rap1, Vinculin and Paxillin. Moreover, mNSCs attached to the GO matrix after treatment with PLO in the differentiation medium, where the 4651 nm GO NPs had larger area to form adhesion spots. This could be one of the reasons for the enhanced performance of the 4651 nm GO NPs in accelerating the differentiation and improving migration of the mNSCs.
It is also worth noting that the cellular response of mNSCs mediated by GO NPs exhibited significant dependency on the particle size.60,61 Previous research has shown that after addition into the culture medium, NPs rapidly absorb small molecules selectively onto their surface and a layer of molecules, also known as corona, is generated that can enable interaction with the cells. The chemical composition and thickness of the corona layer, which is determined by the size of NPs, influences the cellular functions, including cellular uptake, cytotoxicity and gene expression.62,63 However, the exact mechanism of the size-dependent effects of GO NPs on the cytotoxicity, self-renewal, differentiation and migration of mNSCs is still unclear, and requires further relevant research.
TRPC2, TRPC1 and TRPC3 belongs to the family of transient receptor potential canonical (TRPC) genes. TRPCs are potential Ca2+ cation channels and influence the cellular functions through the entry of Ca2+, which triggers changes in the action potentials in the neurons. TRPC2 is unique among TRPCs33 and its physiological roles have been studied in rat thyroid FRTL-5 cells. In these cells, it was seen that knockdown of TRPC2 leads to the increase in cAMP levels, leading to a rise in Ras-related protein 1-MAPK kinase 1(MAPK/ERK Kinase 1) along with stimulation of ERK1/2 phosphorylation.64 From the signal transduction point of view, ERK1/2 phosphorylation induces expression of specific proteins that regulate cellular proliferation, differentiation and apoptosis. Our Western blotting analysis shows that the expression of pERK1/2 was higher in the 4651 nm GO NPs group than in the control group. This indicates that the addition of GO NPs stimulates ERK1/2 phosphorylation, which plays an important role in neuronal growth. With regard to gliogenesis, TRPC3-induced Ca2+ signals might be related to the growth of astrocytes, which is attenuated in the presence of TRPC1. As the primer sequences and lengths for TRPC1 and TRPC2 are similar (171 bp and 173 bp, respectively), we assumed that the downregulation of TPRC2 may lead to the growth of astrocytes.65 However, further studies need to be conducted to show the other signal pathways that are involved in this mechanism.
Taken together (Figure 8), our study shows that GO NPs play an important role in the self-renewal of NSCs, as shown by the strong expression of Nestin. However, TRPC2 gene as well as TRPC2 protein, which is a Ca2+ ion channel, was downregulated. The ERK signaling pathway was activated and the levels of certain markers, such as Tuj1, NeuN and GFAP were also upregulated. Overall, these results show that GO NPs may act as potential candidates for nanomedicines for the regulation of cellular fate.
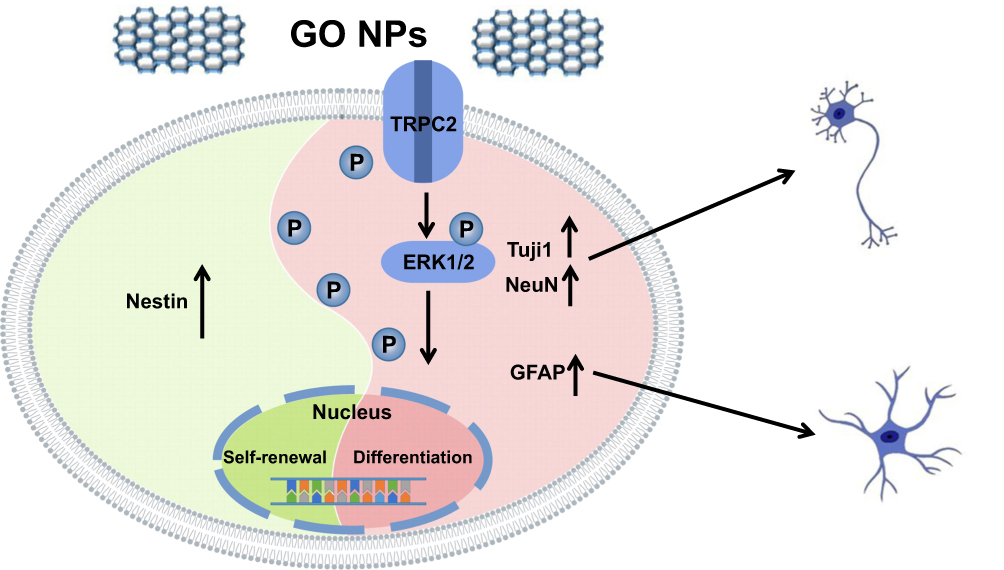 |
Figure 8 Schematic representation summarizing the role of graphene oxide nanoparticles on the self-renewal and differentiation of mNSCs. |
Conclusion
Overall, in this study, we compared the effects of GO NPs of four different sizes on the biocompatibility, self-renewal and differentiation of mNSCs. We observed that GO NPs of all sizes presented less cytotoxicity at concentrations ≤20 μg/mL. Larger GO NPs (approximately 1 μm and 5 μm in size) showed more obvious cytotoxicity than small GO NPs (approximately 400 nm and 700 nm in size) at high concentrations. Through analysis of the expression of self-renewal and differentiation-related genes, we found that the 417 nm and 663 nm GO NPs exhibited more outstanding ability to maintain the self-renewal of mNSCs in the absence of EGF and bFGF, while 4651 nm GO NPs were more efficient in accelerating the differentiation of mNSCs under differentiation conditions. In addition, 417 nm GO NPs can promote the migration of mNSCs by upregulating the expression of Vinculin significantly. Finally yet importantly, 4651 nm GO NPS clearly enhanced neuronal differentiation in the mNSCs through phosphorylation of ERK1/2 via downregulation of TRPC2.
Acknowledgments
This work was financially supported by the National key research and development program (Grant No. 2016YFA0100800), the National Natural Science Foundation of China (Grant No.81922039, 81873994, 31727801, 81671105), and the Fundamental Research Funds for the Central Universities.
Disclosure
No potential conflicts of interest were disclosed by the authors.
References
1. Gage FH. Mammalian neural stem cells. Science. 2000;287(5457):1433–1438. doi:10.1126/science.287.5457.1433
2. Temple S. The development of neural stem cells. Nature. 2001;414(6859):112–117. doi:10.1038/35102174
3. Johansson CB, Momma S, Clarke DL, Risling M, Lendahl U, Frisen J. Identification of a neural stem cell in the adult mammalian central nervous system. Cell. 1999;96(1):25–34. doi:10.1016/S0092-8674(00)80956-3
4. Reynolds BA, Weiss S. Generation of neurons and astrocytes from isolated cells of the adult mammalian central-nervous-system. Science. 1992;255(5052):1707–1710. doi:10.1126/science.1553558
5. McGrath EL, Gao JL, Wu P. Proliferation and differentiation of human fetal brain neural stem cells in vitro. J Neurorestoratol. 2018;6:19–27. doi:10.2147/JN.S148794
6. Cummings BJ, Uchida N, Tamaki SJ, et al. Human neural stem cells differentiate and promote locomotor recovery in spinal cord-injured mice. Proc Natl Acad Sci U S A. 2005;102(39):14069–14074. doi:10.1073/pnas.0507063102
7. Lindvall O, Kokaia Z, Martinez-Serrano A. Stem cell therapy for human neurodegenerative disorders - how to make it work. Nat Med. 2004;10(7):S42–S50. doi:10.1038/nm1064
8. Martino G, Pluchino S. The therapeutic potential of neural stem cells. Nat Rev Neurosci. 2006;7(5):395–406. doi:10.1038/nrn1908
9. Ciccolini F, Svendsen CN. Fibroblast growth factor 2 (FGF-2) promotes acquisition of epidermal growth factor (EGF) responsiveness in mouse striatal precursor cells: identification of neural precursors responding to both EGF and FGF-2. J Neurosci. 1998;18(19):7869–7880. doi:10.1523/JNEUROSCI.18-19-07869.1998
10. Xia YN. Nanomaterials at work in biomedical research. Nat Mater. 2008;7(10):758–760. doi:10.1038/nmat2277
11. Ferreira L. Nanoparticles as tools to study and control stem cells. J Cell Biochem. 2009;108(4):746–752. doi:10.1002/(ISSN)1097-4644
12. Ferreira L, Karp JM, Nobre L, Langer R. New opportunities: the use of nanotechnologies to manipulate and track stem cells. Cell Stem Cell. 2008;3(2):136–146. doi:10.1016/j.stem.2008.07.020
13. Ilie I, Ilie R, Mocan T, Bartos D, Mocan L. Influence of nanomaterials on stem cell differentiation: designing an appropriate nanobiointerface. Int J Nanomedicine. 2012;7:2211–2225. doi:10.2147/IJN.S29975
14. Stankovich S, Dikin DA, Dommett GHB, et al. Graphene-based composite materials. Nature. 2006;442(7100):282–286. doi:10.1038/nature04969
15. Zhu Y, Murali S, Cai W, et al. Graphene and graphene oxide: synthesis, properties, and applications (vol 22, pg 3906, 2010). Adv Mater. 2010;22(46):5226. doi:10.1002/adma.201090156
16. Dreyer DR, Park S, Bielawski CW, Ruoff RS. The chemistry of graphene oxide. Chem Soc Rev. 2010;39(1):228–240. doi:10.1039/B917103G
17. Wang Y, Li ZH, Wang J, Li JH, Lin YH. Graphene and graphene oxide: biofunctionalization and applications in biotechnology. Trends Biotechnol. 2011;29(5):205–212. doi:10.1016/j.tibtech.2011.01.008
18. Wu SY, An SSA, Hulme J. Current applications of graphene oxide in nanomedicine. Int J Nanomedicine. 2015;10:9–24. doi:10.2147/IJN.S88285
19. Ng AMH, Kenry C, Lim CT, Low HY, Loh KP. Highly sensitive reduced graphene oxide microelectrode array sensor. Biosens Bioelectron. 2015;65:265–273. doi:10.1016/j.bios.2014.10.048
20. Wang Y, Li ZH, Hu DH, Lin CT, Li JH, Lin YH. Aptamer/graphene oxide nanocomplex for in situ molecular probing in living cells. J Am Chem Soc. 2010;132(27):9274–9276. doi:10.1021/ja103169v
21. Sun XM, Liu Z, Welsher K, et al. Nano-graphene oxide for cellular imaging and drug delivery. Nano Res. 2008;1(3):203–212. doi:10.1007/s12274-008-8021-8
22. Liu Z, Robinson JT, Sun XM, Dai HJ. PEGylated nanographene oxide for delivery of water-insoluble cancer drugs. J Am Chem Soc. 2008;130(33):
23. Zhang LM, Xia JG, Zhao QH, Liu LW, Zhang ZJ. Functional graphene oxide as a nanocarrier for controlled loading and targeted delivery of mixed anticancer drugs. Small. 2010;6(4):537–544. doi:10.1002/smll.v6:4
24. Goenka S, Sant V, Sant S. Graphene-based nanomaterials for drug delivery and tissue engineering. J Control Release. 2014;173:75–88. doi:10.1016/j.jconrel.2013.10.017
25. Chen BA, Liu M, Zhang LM, Huang J, Yao JL, Zhang ZJ. Polyethylenimine-functionalized graphene oxide as an efficient gene delivery vector. J Mater Chem. 2011;21(21):7736–7741. doi:10.1039/c1jm10341e
26. Lee WC, Lim C, Shi H, et al. Origin of enhanced stem cell growth and differentiation on graphene and graphene oxide. ACS Nano. 2011;5(9):7334–7341. doi:10.1021/nn202190c
27. Yang DH, Li T, Xu MH, et al. Graphene oxide promotes the differentiation of mouse embryonic stem cells to dopamine neurons. Nanomedicine. 2014;9(16):2445–2455. doi:10.2217/nnm.13.197
28. Weaver CL, Cui XT. Directed neural stem cell differentiation with a functionalized graphene oxide nanocomposite. Adv Healthc Mater. 2015;4(9):1408–1416. doi:10.1002/adhm.201500056
29. Ahlenius H, Kokaia Z. Isolation and generation of neurosphere cultures from embryonic and adult mouse brain. Methods Mol Biol. 2010;633:241–252.
30. Jing G, Wang Z, Zhuang X, et al. Suspended graphene oxide nanosheets maintain the self-renewal of mouse embryonic stem cells via down-regulating the expression of vinculin. Biomaterials. 2018;171:1–11. doi:10.1016/j.biomaterials.2018.04.017
31. Ramaswamy S, Goings GE, Soderstrom KE, Szele FG, Kozlowski DA. Cellular proliferation and migration following a controlled cortical impact in the mouse. Brain Res. 2005;1053(1–2):38–53. doi:10.1016/j.brainres.2005.06.042
32. Ourednik V, Ourednik J, Xu YF, et al. Cross-talk between stem cells and the dysfunctional brain is facilitated by manipulating the niche: evidence from an adhesion molecule. Stem Cells. 2009;27(11):2846–2856. doi:10.1002/stem.v27:11
33. Yildirim E, Birnbaumer L. TRPC2: molecular biology and functional importance. Handb Exp Pharmacol. 2007;179:53–75.
34. Torii S, Nakayama K, Yamamoto T, Nishida E. Regulatory mechanisms and function of ERK MAP kinases. J Biochem. 2004;136(5):557–561. doi:10.1093/jb/mvh159
35. Shinjyo N, Stahlberg A, Dragunow M, Pekny M, Pekna M. Complement-derived anaphylatoxin c3a regulates in vitro differentiation and migration of neural progenitor cells. Stem Cells. 2009;27(11):2824–2832. doi:10.1002/stem.225
36. Kim SY, Han YM, Oh M, et al. DUSP4 regulates neuronal differentiation and calcium homeostasis by modulating ERK1/2 phosphorylation. Stem Cells Dev. 2015;24(6):686–700. doi:10.1089/scd.2014.0434
37. Zhang XY, Yin JL, Peng C, et al. Distribution and biocompatibility studies of graphene oxide in mice after intravenous administration. Carbon. 2011;49(3):986–995. doi:10.1016/j.carbon.2010.11.005
38. Yang K, Gong H, Shi XZ, Wan JM, Zhang YJ, Liu Z. In vivo biodistribution and toxicology of functionalized nano-graphene oxide in mice after oral and intraperitoneal administration. Biomaterials. 2013;34(11):2787–2795. doi:10.1016/j.biomaterials.2013.01.001
39. Seabra AB, Paula AJ, de Lima R, Alves OL, Duran N. Nanotoxicity of graphene and graphene oxide. Chem Res Toxicol. 2014;27(2):159–168. doi:10.1021/tx400385x
40. Lalwani G, D’Agati M, Khan AM, Sitharaman B. Toxicology of graphene-based nanomaterials. Adv Drug Deliv Rev. 2016;105:109–144. doi:10.1016/j.addr.2016.04.028
41. Mendes RG, Koch B, Bachmatiuk A, et al. A size dependent evaluation of the cytotoxicity and uptake of nanographene oxide. J Mater Chem B. 2015;3(12):2522–2529. doi:10.1039/C5TB00180C
42. Wang INE, Robinson JT, Do G, et al. Graphite oxide nanoparticles with diameter greater than 20 nm are biocompatible with mouse embryonic stem cells and can be used in a tissue engineering system. Small. 2014;10(8):1479–1484. doi:10.1002/smll.201303133
43. Liu AR, Zhang WX. Fine structural features of nanoscale zero-valent iron characterized by spherical aberration corrected scanning transmission electron microscopy (Cs-STEM). Analyst. 2014;139(18):4512–4518. doi:10.1039/C4AN00679H
44. Zhao J, Tang M, Cao J, et al. Structurally tunable reduced graphene oxide substrate maintains mouse embryonic stem cell pluripotency. Adv Sci (Weinh). 2019;6(12):1802136. doi:10.1002/advs.201802136
45. Piccin D, Morshead CM. Wnt signaling regulates symmetry of division of neural stem cells in the adult brain and in response to injury. Stem Cells. 2011;29(3):528–538. doi:10.1002/stem.v29.3
46. Aguirre A, Rubio ME, Gallo V. Notch and EGFR pathway interaction regulates neural stem cell number and self-renewal. Nature. 2010;467(7313):323–U101. doi:10.1038/nature09347
47. Cattaneo E, McKay R. Proliferation and differentiation of neuronal stem-cells regulated by nerve growth-factor. Nature. 1990;347(6295):762–765. doi:10.1038/347762a0
48. Brizzi MF, Tarone G, Defilippi P. Extracellular matrix, integrins, and growth factors as tailors of the stem cell niche. Curr Opin Cell Biol. 2012;24(5):645–651. doi:10.1016/j.ceb.2012.07.001
49. Discher DE, Mooney DJ, Zandstra PW. Growth factors, matrices, and forces combine and control stem cells. Science. 2009;324(5935):1673–1677. doi:10.1126/science.1171643
50. Spradling A, Drummond-Barbosa D, Kai T. Stem cells find their niche. Nature. 2001;414(6859):98–104. doi:10.1038/35102160
51. Dalby MJ, Gadegaard N, Oreffo ROC. Harnessing nanotopography and integrin-matrix interactions to influence stem cell fate. Nat Mater. 2014;13(6):558–569. doi:10.1038/nmat3980
52. Chen WQ, Villa-Diaz LG, Sun YB, et al. Nanotopography influences adhesion, spreading, and self-renewal of human embryonic stem cells. ACS Nano. 2012;6(5):4094–4103. doi:10.1021/nn3004923
53. Even-Ram S, Artym V, Yamada KM. Matrix control of stem cell fate. Cell. 2006;126(4):645–647. doi:10.1016/j.cell.2006.08.008
54. Engler AJ, Sen S, Sweeney HL, Discher DE. Matrix elasticity directs stem cell lineage specification. Cell. 2006;126(4):677–689. doi:10.1016/j.cell.2006.06.044
55. Nel AE, Madler L, Velegol D, et al. Understanding biophysicochemical interactions at the nano-bio interface. Nat Mater. 2009;8(7):543–557. doi:10.1038/nmat2442
56. Wong JY, Leach JB, Brown XQ. Balance of chemistry, topography, and mechanics at the cell-biomaterial interface: issues and challenges for assessing the role of substrate mechanics on cell response. Surf Sci. 2004;570(1–2):119–133. doi:10.1016/j.susc.2004.06.186
57. Solanki A, Shah S, Memoli KA, Park SY, Hong S, Lee KB. Controlling differentiation of neural stem cells using extracellular matrix protein patterns. Small. 2010;6(22):2509–2513. doi:10.1002/smll.201001341
58. Fusco S, Panzetta V, Embrione V, Netti PA. Crosstalk between focal adhesions and material mechanical properties governs cell mechanics and functions. Acta Biomater. 2015;23:63–71. doi:10.1016/j.actbio.2015.05.008
59. Gautrot JE, Malmstrom J, Sundh M, Margadant C, Sonnenberg A, Sutherland DS. The nanoscale geometrical maturation of focal adhesions controls stem cell differentiation and mechanotransduction. Nano Lett. 2014;14(7):3945–3952. doi:10.1021/nl501248y
60. Wu YJ, Zhu RR, Ge X, et al. Size-dependent effects of layered double hydroxide nanoparticles on cellular functions of mouse embryonic stem cells. Nanomedicine. 2015;10(23):3469–3482. doi:10.2217/nnm.15.158
61. Shang L, Nienhaus K, Nienhaus GU. Engineered nanoparticles interacting with cells: size matters. J Nanobiotechnology. 2014;12:5.
62. Jiang W, Kim BYS, Rutka JT, Chan WCW. Nanoparticle-mediated cellular response is size-dependent. Nat Nanotechnol. 2008;3(3):145–150. doi:10.1038/nnano.2008.30
63. Akhavan O, Ghaderi E, Akhavan A. Size-dependent genotoxicity of graphene nanoplatelets in human stem cells. Biomaterials. 2012;33(32):8017–8025. doi:10.1016/j.biomaterials.2012.07.040
64. Lof C, Sukumaran P, Viitanen T, et al. Communication between the calcium and cAMP pathways regulate the expression of the TSH receptor: TRPC2 in the center of action. Mol Endocrinol. 2012;26(12):2046–2057. doi:10.1210/me.2012-1171
65. Belkacemi T, Niermann A, Hofmann L, et al. TRPC1- and TRPC3-dependent Ca(2+) signaling in mouse cortical astrocytes affects injury-evoked astrogliosis in vivo. Glia. 2017;65(9):1535–1549. doi:10.1002/glia.23180
 © 2020 The Author(s). This work is published and licensed by Dove Medical Press Limited. The full terms of this license are available at https://www.dovepress.com/terms.php and incorporate the Creative Commons Attribution - Non Commercial (unported, v3.0) License.
By accessing the work you hereby accept the Terms. Non-commercial uses of the work are permitted without any further permission from Dove Medical Press Limited, provided the work is properly attributed. For permission for commercial use of this work, please see paragraphs 4.2 and 5 of our Terms.
© 2020 The Author(s). This work is published and licensed by Dove Medical Press Limited. The full terms of this license are available at https://www.dovepress.com/terms.php and incorporate the Creative Commons Attribution - Non Commercial (unported, v3.0) License.
By accessing the work you hereby accept the Terms. Non-commercial uses of the work are permitted without any further permission from Dove Medical Press Limited, provided the work is properly attributed. For permission for commercial use of this work, please see paragraphs 4.2 and 5 of our Terms.