")
Back to Journals » International Journal of Nanomedicine » Volume 15
Size-Dependent Cytotoxicity of Hydroxyapatite Crystals on Renal Epithelial Cells
Authors Sun XY , Chen JY, Rao CY, Ouyang JM
Received 30 September 2019
Accepted for publication 9 June 2020
Published 15 July 2020 Volume 2020:15 Pages 5043—5060
DOI https://doi.org/10.2147/IJN.S232926
Checked for plagiarism Yes
Review by Single anonymous peer review
Peer reviewer comments 3
Editor who approved publication: Dr Linlin Sun
Xin-Yuan Sun, Jia-Yun Chen, Chen-Ying Rao, Jian-Ming Ouyang
Department of Chemistry, Institute of Biomineralization and Lithiasis Research, Jinan University, Guangzhou 510632, People’s Republic of China
Correspondence: Jian-Ming Ouyang
Department of Chemistry Institute of Biomineralization and Lithiasis Research,Jinan University, Guangzhou 510632, People’s Republic of China
Tel +86 20-85223353
Email [email protected]
Background: Hydroxyapatite (HAP) is a common component of most idiopathic calcium oxalate (CaOx) stones and is often used as a nidus to induce the formation of CaOx kidney stones.
Methods: This work comparatively studies the cytotoxicity of four kinds of HAP crystals with different sizes (40 nm to 2 μm), namely, HAP-40 nm, HAP-70 nm, HAP-1 μm, and HAP-2 μm, on human renal proximal tubular epithelial cells (HK-2).
Results: HAP crystals reduce the viability and membrane integrity of HK-2 cells in a concentration-dependent manner and consequently cause cytoskeleton damage, cell swelling, increased intracellular reactive oxygen species level, decreased mitochondrial membrane potential, increased intracellular calcium concentration, blocked cell cycle and stagnation in G0/G1 phase, and increased cell necrosis rate. HAP toxicity to HK-2 cells increases with a decrease in crystal size.
Conclusion: Cell damage caused by HAP crystals increases the risk of kidney stone formation.
Keywords: cytotoxicity, nanocrystal, hydroxyapatite, crystal size, cell injury
Introduction
Hydroxyapatite (HAP) is the main component of vascular calcification (VC) plaques, and its toxicity to vascular smooth muscle cells has been widely studied.1–3 HAP is a common component in urine and in most idiopathic calcium oxalate (CaOx) kidney stones,4–6 but its toxic mechanism on renal epithelial cells has not been thoroughly investigated.
HAP is the core component of Randall plaque.7,8 Khan et al8 performed biopsies on patients with idiopathic calculi and found spherical HAP crystals with representative Randall plaques in all patients with calculi. The basement membrane of the Henle’s loop is the initial location of HAP formation and is composed of collagen and a large amount of mucopolysaccharide, which attracts calcium and phosphate ions to form apatite through an electrostatic action. Therefore, Randall plaque is a result of crystallization within a collagen matrix; if this material reaches the suburothelial space and penetrates the urothelium, then it can serve as an anchor site for a CaOx overlay, ultimately inducing CaOx kidney stone formation.5,9,10 Evan et al9,11 showed that Randall plaque acts as a nidus that induces the formation of CaOx stones at the tip of the nipple.
HAP can cause oxidative stress that damages renal epithelial cells and promotes HAP aggregation on the basement membrane of renal tubular epithelium. HAP massive accumulation changes the physical and chemical environments of the interstitial cells, which in turn induces the formation of calcified plaque in the renal papilla. HAP can flow with the urine to the renal pelvis, remain in the distal tubule lumen, stimulate the hydrogen secretion of distal tubules, and acidify urine. HAP crystals dissolve at the end of collecting tubules, thereby releasing calcium ions, which combine with oxalate ions in urine to form CaOx crystals.12 When renal epithelial cells are damaged, HAP deposits come in contact with supersaturated urine from adjacent renal sources, then act as initial and adhesion sites to adsorb small crystals in urine, such as CaOx and calcium phosphate, and subsequently adhere to their surfaces and induce microcrystalline aggregation.13 Kuo et al14 believed that this crystal attachment may be a special heterogeneous nucleation. If the crystal lattices of the two crystals in a supersaturated solution are similar, then one component is oriented in the existing crystal plane of the other component, that is, the orientation epitaxial.
HAP cytotoxicity is closely related to its size and morphology. Shi et al15 studied the effects of HAP at different sizes (20 nm, 80 nm, and 12 μm) on the uptake and function of human umbilical vein endothelial cells and found that nano-HAP is more conducive to cellular uptake and exerts greater damage to normal cell function than micro-HAP. Han et al16 analyzed the inhibitory effect of nano-HAP of different sizes (60, 170, and 290 nm) on cancer cells (Bel-7402) and its mechanism; the concentration was 0.56 g/L, and the inhibition rates of the three HAP sizes were 75%, 40%, and 20%. Yuan et al17 showed that the anti-tumor activity and apoptosis-inducing ability of 26 nm and 45 nm HAP are greater than those of 78 and 175 nm HAP in HepG2 cells.
Early studies focused on the damage of single-size apatite to renal epithelial cells.18,19 However, urine crystallites have varying sizes in patient with kidney stones and normal people due to the difference in supersaturation and urine inhibitor concentration.8 The difference in HAP crystal size on renal epithelial cell toxicity and the potential risk of Randall plaque formation have not been investigated yet. We selected four different sizes of nano/micron HAP crystals to study their differences in cytotoxicity and endocytosis in renal epithelial cells. The internal relationship between the physicochemical properties of crystals and cytotoxicity was also analyzed from the perspective of chemistry and cell biology to provide new inspiration for revealing the formation mechanism of Randall plaque.
Materials and Methods
Materials and Instruments
Materials
The following materials were used: human renal proximal tubular epithelial cells (HK-2; Shanghai Cell Bank, Chinese Academy of Sciences); HAP (purity ≥97%; Huizhou Weijing Nano New Material Co., Ltd.); Dulbecco’s modified Eagle’s medium (DMEM/F-12, Cat. No. yk-969612) and pancreatin (Cat. No. 25200–056) (Gibco Company (Gibco, NY, USA)). Cell counting kit-8 (CCK-8, Cat. No. BA00208) was purchased from Bioss (Beijing, China). Lactate dehydrogenase (LDH) kit (Cat. No. KGT02448), Hematoxylin-eosin (HE, Cat. No. KGA224), reactive oxygen species (ROS) detection kit (Cat. No. KGAF019), Annexin V-FITC/Propidium iodide (Cat. No. KGA108), Actin-Tracker Green (Cat. No. KGMP001), intracellular calcium (Fluo-4 AM) dyeing solution (Cat. No. KGAF024), and mitochondrial membrane potential detection kit (JC-1, Cat. No. KGA603) were purchased from KeyGEN Bio. Tech., Co., Ltd. (Nanjing, China). Other conventional chemical reagents are analytical grade and were purchased from Guangzhou Chemical Reagent Factory.
Instruments
The following apparatuses were used: XL-30 environmental scanning electron microscope (SEM, Philips, Eindhoven, Netherlands), Fourier transform infrared absorption spectrometer (EQUINOX 55, Bruker, Germany), D/max2400X X-ray powder diffractometer (Rigaku, Japan), Nano-ZS type nano particle size analyzer (Malvern, UK), Tristar 3000 specific surface area and porosity analyzer (Micromeritics, USA); microplate reader (Thermo Multiskan MK3, USA), inverted fluorescence microscope (Leica DMRA2, Germany), optical microscope (OLYMPUS, CKX41, Japan), flow cytometry (Beckman, Gallios, USA), and confocal microscope (LSM510 Meta Duo Scan, Zeiss, Germany).
Experimental Methods
FT-IR, XRD, and SEM Analyses of HAP Crystals
FT-IR: HAP was conducted with KBr discs in the region of 4000 cm−1 to 400 cm−1 with a resolution of 4 cm−1.
XRD: dried HAP crystals with different sizes were recorded with Cu-Kα radiation at a scanning rate of 8° per min in the 2θ range from 5° to 55°.
SEM: HAP suspension was prepared with absolute ethanol, then ultrasonic dispersion uniformity, sprayed with gold, and then observed by SEM. The dimensions of the crystals were statistically measured using Nano Measurer (v1.2.5) software.
Determination of Zeta Potential, Conductivity, and Surface Structure of HAP Crystals
HAP crystals with different size were dispersed in distilled water or DMEM/F-12 medium (without serum). The solution was prepared at a concentration of 0.10 mg/mL. After ultrasonication for 5 min, the zeta potential and conductivity of the crystals were measured by nano-ZS nanoparticle sizer.
Nitrogen sorption isotherms were measured at −196°C by using a Tristar 3000 surface area and porosity analyzer. The specific surface area of the nanoparticles was determined via the Brunauer–Emmet–Teller (BET) method, and data were processed by the BJH (Rod rett–Joyner–Halenda) method to obtain the pore size distribution curve, pore volume, and average pore diameter value of the crystal.
Preparation of Crystal Suspensions and Cell Culture
Preparation of serum-free medium containing HAP: a certain amount of HAP crystals were plated, sterilized by ultraviolet light for 30 min, and then dispersed in serum-free medium to prepare a suspension with a concentration of 500 μg/mL. Dilution was performed after 5 minutes of ultrasound before use.
HK-2 cells were cultured in DMEM/F-12 supplemented with 10% FBS, 100 µg/mL penicillin, and 100 µg/mL streptomycin in a 5% CO2 incubator at 37°C. Trypsin digestion was performed for cell propagation. The cells were divided into two groups: (A) control group, in which only serum-free medium was added, and (B) crystal treatment group, in which HK-2 cells were exposed to 250 μg/mL HAP-40 nm, HAP-70 nm, HAP-1 µm and HAP-2 µm for 24 h. Aspirated supernatant and washed twice with PBS for subsequent experiments.
Cell Viability Detection
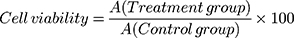
The cytotoxicity of HAP crystals with various sizes was evaluated through CCK-8 viability assay. The experimental model was divided into two groups: (A) control group: only serum-free medium was added, and (B) crystal treatment group: HK-2 cells were exposed to HAP-40 nm, HAP-70 nm, HAP-1 µm and HAP-2 µm crystals for 24 h with concentrations of 63, 125, 250 and 500 μg/mL, respectively. Afterward, 10 μL of CCK-8 was added to each well and incubated for 2 h at 37°C. Absorbance was measured by using the microplate reader at 450 nm.
(1)
Lactate Dehydrogenase (LDH) Release Assay
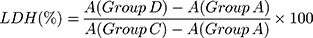
The experimental model was divided into four groups: (A) cell-free culture medium wells (control wells of background), (B) control wells without crystal treatment (sample control wells), (C) cells without crystal treatment for the subsequent cleavage of the wells (sample maximum enzyme activity control wells), and (D) treated group with HAP-40 nm, HAP-70 nm, HAP-1 µm, and HAP-2 µm crystals with concentrations of 63, 125, 250 and 500 μg/mL, respectively, for 24 h (drug–treated wells). After incubation, absorbance was analyzed at 490 nm with a reference wavelength of 620 nm according to the LDH kit instruction.
(2)
Cell Morphology Observation by Hematoxylin-Eosin (HE) Staining
The experimental model was grouped according to “Preparation of Crystal Suspensions and Cell Culture”. The cells were washed by PBS twice, fixed by paraformaldehyde, and stained with hematoxylin for 15 min and eosin staining solution for 5 min. When the prepared samples were observed under the microscope, the nucleus appeared blue-violet, and the cytoplasm was pink or red.
Cell Cytoskeleton Observation
After treatment according to “Preparation of Crystal Suspensions and Cell Culture”, the cells were fixed with 3.7% paraformaldehyde solution for 20 min at room temperature and washed three times with 0.1% Triton X-100 in PBS for approximately 5 min each time. Actin-Tracker Green was diluted 1:100 with PBS containing 5% BSA and 0.1% Triton X-100. Approximately 200 μL of diluted Actin-tracker Green staining solution was added to each group and incubated for 60 min at room temperature in the dark. The cells were washed with PBS containing 0.1% Triton X-100 twice, and the nuclei were stained with DAPI for 10 min and then observed under confocal microscope.
Reactive Oxygen Species (ROS) Detection
Qualitative observation: The experimental model was grouped according to “Preparation of Crystal Suspensions and Cell Culture”. After incubation for 24 h, the samples were stained with 500 μL of DCFH-DA diluted with serum-free culture medium at 1:1000 for 20 min. The cells were then observed under a fluorescence microscope.
Quantitative detection: 100 μL of cell suspension with a concentration of 1×10⁵ cells/mL was inoculated per well in 96-well plates. After incubation for 24 h, the samples were stained using 100 μL of DCFH-DA dye solution for 20 min. The fluorescence intensity of intracellular ROS was quantitatively detected by microplate reader.
Quantitative Analysis of Internalized HAP Crystals
Fluorescein isothiocyanate (FITC)-labeled HAP was prepared through a two-step reaction. First, 0.05 g of HAP and 5 mL of AMPTES were added into 50 mL of absolute ethanol with continuous stirring at 74°C for 3 h. Afterward, 0.025 g of FITC was added to the mixture for a reaction time of 6 h at 74°C to form FITC-labeled HAP crystals, which were then washed several times with anhydrous ethanol and deionized water until free FITC was removed. The crystals were dried for 24 h.
The experimental model was grouped according to “Preparation of Crystal Suspensions and Cell Culture”. Freshly prepared 250 μg/mL FITC-labeled HAP-40 nm, HAP-70 nm, HAP-1 µm, and HAP-2 µm crystals were added to cultured cells and incubated at 37°C for 24 h. After incubation, the supernatant was removed, and the cells were treated with 0.4 mL of ethylenediaminetetraacetic acid (EDTA) (5 mM) for 5 min to remove the adherent HAP. The cells were then resuspended after washing with PBS, and the percentage of cells with internalized crystals was measured by flow cytometry.
Detection of Calcium Concentration in HK-2 Cells
After treatment according to “Preparation of Crystal Suspensions and Cell Culture”, each cell group was centrifuged for 5 min (1000 rpm/min). The supernatant was removed, washed twice with PBS, and re-centrifuged to obtain a cell pellet. Afterward, 200 μL of Fluo-4 AM (5 μmol/L) was added, incubated at 37°C for 30 min, washed three times with PBS, and tested on the machine.
Detection of Mitochondrial Membrane Potential (Δψm)
Qualitative observation: After treatment according to “Preparation of Crystal Suspensions and Cell Culture”, 200 μL of JC-1 stain solution was added to each group of cells and mixed at 37°C for 20 min in the dark. The mixture was washed three times with PBS and observed under a fluorescence microscope.
Quantitative detection: After treatment according to “Preparation of Crystal Suspensions and Cell Culture”, each cell group was centrifuged for 5 min (1000 rpm/min). The supernatant was aspirated, washed twice with PBS, and re-centrifuged to obtain a cell pellet. After resuspension in 200 μL of PBS, the mixture was centrifuged for 5 min (1000 rpm/min), stained with 200 μL of JC-1 dye for 15 min, washed three times with PBS, and tested on the machine.
Cell Cycle Detection Assay
Approximately 2 mL of cell suspension with a cell concentration of 1×10⁵ cells/mL was inoculated per well in six-well plates and incubated for 24 h. After the cells were confluent, the medium was changed to serum-free culture media and then incubated for another 12 h to achieve synchronization. The experimental grouping was the same as those in “Preparation of Crystal Suspensions and Cell Culture”. The cells were collected with trypsin digestion, washed twice with PBS, centrifuged (1000 rpm) for 5 min, and then fixed with 70% ethanol at 4°C for 12 hours. The ethanol was removed through centrifugation (2000 rpm, 5 minutes), and the cells were washed twice with PBS, resuspended in 200 μL of propidium iodide, and kept at 37°C for 15 min. Cell cycle was analyzed by flow cytometry to measure the amount of PI-labeled DNA in the fixed cells.
Detection of Apoptosis and Necrosis
Qualitative observation: after treatment according to “Preparation of Crystal Suspensions and Cell Culture”, 800 μL of cell staining buffer, 5 μL of Hoechst 33342 staining solution, and 5 μL of PI staining solution were added to each cell group. The sample was mixed at 4°C for 20 min in the dark, washed three times with PBS, and observed under a fluorescence microscope.
Quantitative detection: after the treatment of HAP crystals with different sizes was completed, the cells were harvested and then stained with 5 μL of annexin V-FITC for 10 min at room temperature. The cells were then resuspended in 200 μL of binding buffer, stained with 5 μL of PI, and analyzed using flow cytometry.
Statistical Analysis
Normal distribution of experimental results was analyzed by Shapiro–Wilk test. Data were assessed using one-way ANOVA test, followed by Tukey’s multiple comparison test for those following normal distribution. The data were presented as individual values and assessed using the Kruskal–Wallis test, followed by Dunn’s multiple comparisons test when following a non-normal distribution. Statistical analyses were performed with Prism 6.0 (GraphPad Software, CA, USA) for Windows software.
Results
Characterization of HAP Crystals
Figure 1A shows the SEM images of four spherical HAP crystals with different sizes. The spherical HAPs had sizes of 37.94±8.70 nm, 71.27±5.37 nm, 0.96±0.19 μm, and 1.92±0.59 μm (Table 1) as measured by the software Nano Measurer (v1.2.5) and were named as HAP-40 nm, HAP-70 nm, HAP-1 μm, and HAP-2 μm, respectively.
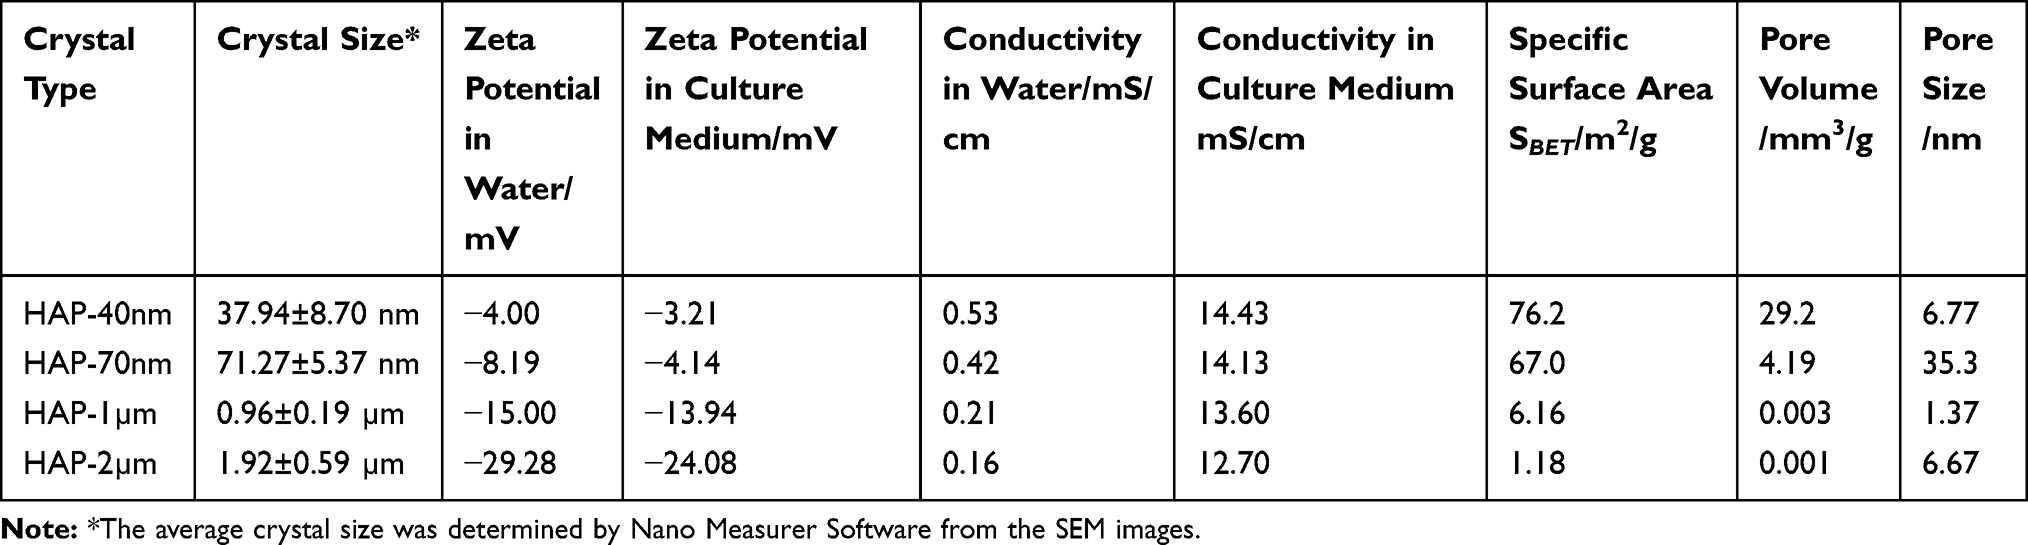 |
Table 1 Basic Physical and Chemical Properties of HAP with Different Sizes |
 |
Figure 1 SEM images of HAP with different sizes (A). Cell viability (B) and LDH release (C) of HK-2 cells after injury by HAP crystals with different concentrations and sizes for 24 h. (**P<0.01, *P<0.05 vs control); Crystal concentration: 63, 125, 250, 500 μg/mL, respectively; treatment time: 24 h. Scale bars: 200 nm (HAP-40nm, HAP-70 nm), 1 μm (HAP-1μm, HAP-2μm). |
Figure S1A shows the XRD patterns of different sizes of the nano-HAP crystals. The diffraction peaks of interplanar spacing d = 3.42, 2.80, 2.78, 2.65, 2.26, 1.95, and 1.83 nm corresponded to the (002), (211), (112), (202), (310), (222), and (213) planes of HAP, respectively (JCPDS No. 09–0432).
In the FT-IR spectrum (Figure S1B), the peaks at 3578 and 3428 cm−1 correspond to O-H stretching vibration peaks, and those at 607, 960, and 1034 cm−1 are the absorption bands of PO43−. FT-IR and XRD spectroscopy results showed that all four HAPs were pure-phase crystals.
Physicochemical Properties of HAP Crystals of Various Sizes
1) Zeta potential
Figure S2A shows the negative zeta potential values of HAP crystals dispersed in the medium and in water (Table 1). The absolute values of zeta potential were ranked as follows: HAP-40 nm < HAP-70 nm < HAP-1 μm < HAP-2 μm.
The absolute value of the zeta potential of each HAP value in the medium is slightly smaller than the zeta potential in water. This discrepancy is attributed to the large number of inorganic ions (Ca2+ and Mg2+), amino acids, and vitamins in the DMEM/F-12 medium.
Owing to the negatively charged HAP surface,20 the PO43-on the surface of HAP neutralizes Ca2+ and Mg2+ in the culture medium, thus reducing the absolute value of the zeta potential of the HAP crystal.
2) Conductivity
Figure S2B shows the conductivity of each HAP crystal in the culture medium and in water. HAP is a poorly soluble substance, and only a small amount of HAP was dissolved in water. Thus, its conductivity value was low. Given the large number of inorganic ions (Ca2+ and Mg2+) contained in the DMEM/F-12 medium, the conductivity of the HAP crystals dispersed in the medium (12.70–14.43 mS/cm) was higher than that of the crystal dispersed in water (0.16–0.53 mS/cm). The conductivity levels of the HAPs of different sizes were ranked as follows: HAP-40 nm>HAP-70 nm>HAP-1 μm>HAP-2 μm.
3) Specific surface area, pore volume, and pore size
Figure S3 shows the N2 adsorption–desorption curves and pore size distribution curves of all HAP crystals. The adsorption–desorption curves of HAP-40 nm and HAP-70 nm were typical type III adsorption isotherms,21,22 indicating the weak interaction between adsorbate N2 and these two HAP crystals. The pore volume distribution peaks appeared for the two types of HAP crystals, indicating that these crystals were rough and had large specific surface areas (Table 1).
The adsorption–desorption curves of HAP-1 μm and HAP-2 μm were typical Ι-type (microporous) adsorption isotherms;22 that is, the interaction between the adsorbed N2 and these HAP crystals was strong, and the crystal surface did not have a noticeable pore structure and had a small specific surface area. The specific surface areas SBET of the HAP crystals were ranked as follows: HAP-40 nm (76.2 m2/g)>HAP-70 nm (67.0 m2/g)>>HAP-1 μm (6.16 m2/g)>HAP-2 μm (1.18 m2/g).
Changes of Cell Viability Caused by HAP Crystals
Figure 1B shows the changes in the viability of HK-2 cells after they were treated with HAP crystals with different sizes for 24 h. All these crystals caused a decrease in cell viability and were concentration-dependent; that is, the cell viability decreased as the crystal concentration increased.
At the same concentration, the toxicity of each crystal to HK-2 cells was ranked as follows: HAP-40 nm>HAP-70 nm>HAP-1 μm>HAP-2 μm. That is, the smaller the size of HAP, the greater its cytotoxicity. Especially at high concentrations (500 μg/mL), the nano-HAP was more cytotoxic, and the cell activity was less than 60%.
Changes of Lactate Dehydrogenase (LDH) Release Caused by HAP Crystals
LDH levels can be used to assess the effect of HAP on HK-2 cell membrane integrity.23 As shown in Figure 1C, the four HAPs significantly increased the release of LDH compared with that in the control group (p<0.05). Therefore, the HAP crystals noticeably damaged the cell membrane in a concentration-dependent manner. At the same concentration, the use of a small size led to a high amount of LDH released by HAP.
Changes of Cell Morphology Caused by HAP Crystals
The effect of each HAP crystal on the morphology of HK-2 cells was investigated by HE staining (Figure 2A). The four HAPs can reduce the number of cells, loosen the connection between cells, and increase the intercellular space. At the same concentration, the effect of nano-HAP crystals on cell morphology was greater than that of micro-HAP crystals.
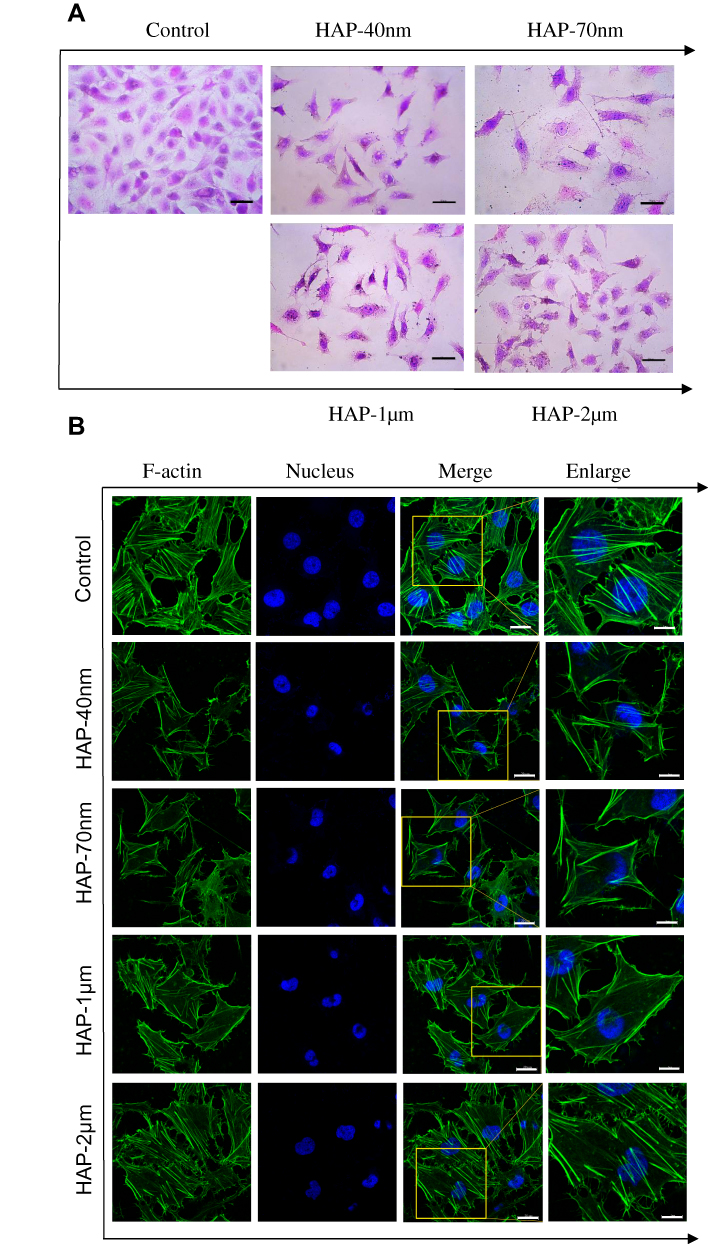 |
Figure 2 Cell morphology (A) and cytoskeleton (B) of HK-2 cells after injury by HAPs with different sizes. Crystal concentration: 250 μg/mL; treatment time: 24 h. Scale bars of cell morphology: 50 µm (400x). Scale bars of cytoskeleton: 20 μm (Merged images, 630x); 5 μm (Enlarged images). |
Changes of Cytoskeleton Caused by HAP Crystals
The cytoskeleton includes three types of protein fibers: actin fibers, microtubules, and intermediate fibers. These backbone fibers are interconnected to maintain the basic shape of the cells.24 We used Actin-Tracker Green for the actin staining of HK-2 cells and for the detection of the skeletal spread of HK-2 cells (Figure 2B). The cytoskeleton of the normal group spread well, and the microfilaments were clearly visible. Most of the cytoskeleton in the two micro-HAP treatment groups remained intact. However, the cytoskeleton distribution of the HAP-40 nm and HAP-70 nm treatment groups was disordered, and the cell deformation was severe, indicating the destruction of cytoskeletal integrity.
Changes of ROS Levels Caused by HAP Crystals
Intracellular ROS levels reflect the oxidative toxicity of crystals.25 The qualitative and quantitative detection of ROS produced and induced by HAP crystals was performed using DCFH-DA fluorescent probing (Figure 3A) and flow cytometry (Figure 3B), respectively.
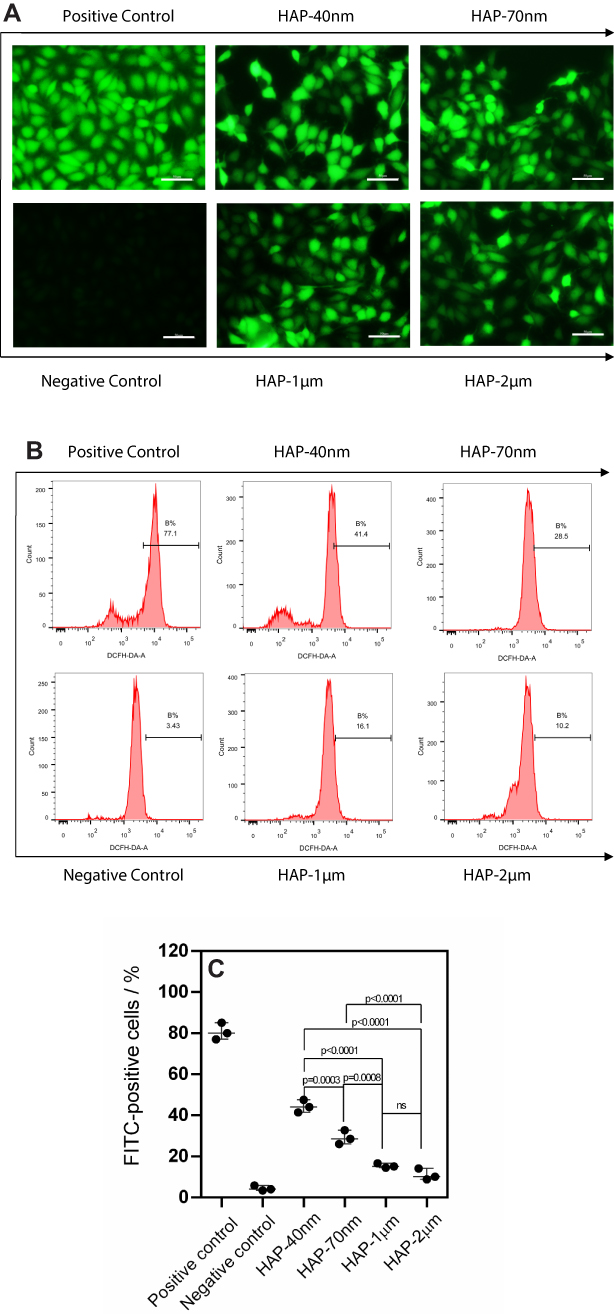 |
Figure 3 Intracellular ROS levels of HK-2 cells after injury by HAPs with different sizes. (A) Qualitative observation of ROS; (B) Flow cytometry analysis results of ROS; (C) ROS quantitative histogram. Crystal concentration: 250 μg/mL; treatment time: 24 h. Scale bars: 50 μm (400x). |
The positive control group stimulated the strongest fluorescence intensity under the stimulation of a Rosup staining solution, whereas the negative control group was the weakest (Figure 3A). The HAPs with different sizes increased the fluorescence intensity of cells; the smaller the crystal size, the greater the increase in fluorescence intensity.
Quantitative detection showed that the proportion of cells with elevated intracellular ROS levels was as follows: positive control (77.1%)>HAP-40 nm (41.4%)>HAP-70 nm (28.5%)>HAP-1 μm (16.6%)>HAP-2 μm (10.2%)>negative control (3.43%) (Figure 3B and C). The HAP crystals with different sizes induced the cells to produce varying degrees of ROS, which in turn caused varying degrees of oxidative damage to cells.
Changes of the Percentage of Cells with Internalized HAP Crystals of Varying Sizes
The endocytotic ability of HK-2 cells for HAP of varying sizes was quantitatively detected by flow cytometry (Figure 4A and C). The cells in the presence of FITC signal were considered to have internalized crystals. The percentage of cells with internalized crystals in the control group was 0.58%, whereas those in HAP-40 nm, HAP-70 nm, HAP-1 µm, and HAP-2 µm treated cells were 42.5%, 30.7%, 14.5%, and 8.12%, respectively. The percentage of cells with internalized crystals decreased with the increasing crystal size and was positively correlated with crystal toxicity to HK-2 cells (Figure 4E, R2 = 0.943).
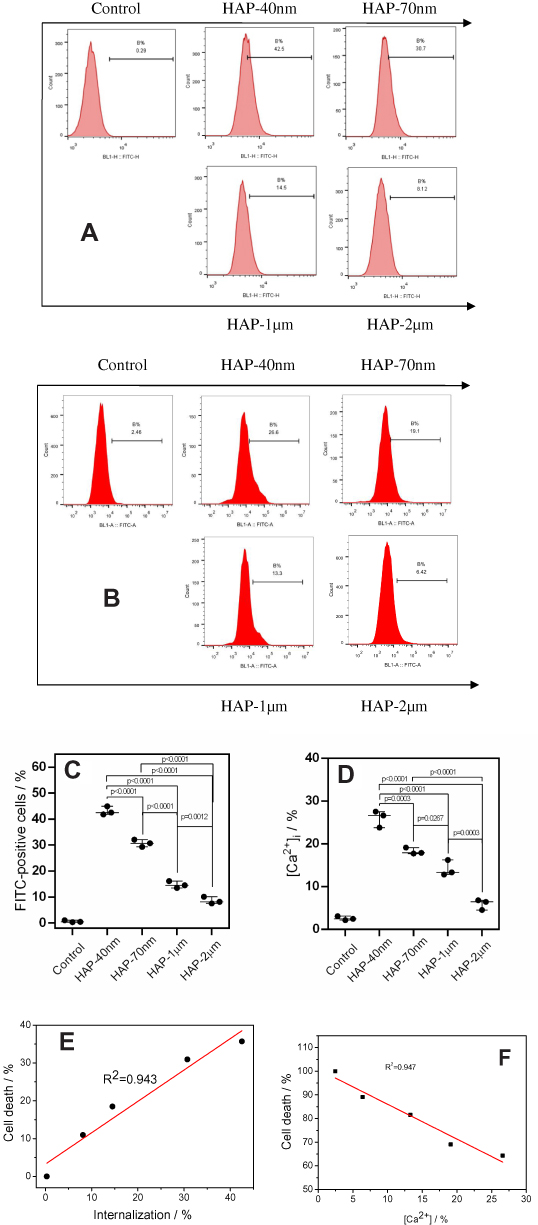 |
Figure 4 Flow cytometry analysis of internalized HAP crystals (A) and intracellular Ca2+ ion concentration [Ca2+]i (B) in HK-2 cells after injury by HAPs with different sizes. Quantitative analysis results of internalized HAP crystals (C) and [Ca2+]i (D). The linear relationship of cell death rate and the proportion of cells with internalized crystals (E). The linear relationship of [Ca2+]i and cell viability (F). R2 is a linear correlation coefficient. Crystal concentration: 250 μg/mL; treatment time: 24 h. |
Changes of Intracellular Calcium Concentration Caused by HAP Crystals
The effect of four HAPs on the [Ca2+]i levels in HK-2 cells is shown in Figure 4B. Each HAP crystal caused an increase in [Ca2+]i level (6.42%–26.6%) compared with that in the normal control group (2.46%), and the smaller the size, the greater the increase caused by the crystal (Figure 4B). The increase in [Ca2+]i levels was positively correlated with the cytotoxicity of HAP (Figure 4D); that is, the higher the cytotoxicity of the crystal, the higher the [Ca2+]i level caused (Figure 4F). The increase in [Ca2+]i caused by HAP may be an important factor leading to cytotoxicity.
Changes of Mitochondrial Membrane Potential (Δψm) Induced by HAP Crystals
Fluorescent probe JC-1 is a cationic lipophilic dye that can penetrate the cell membrane freely. When Δψm is high, JC-1 accumulates in the mitochondrial matrix to form polymers (J-aggregates), thus producing red fluorescence (high ΔΨm). Conversely, when Δψm is low, JC-1 cannot accumulate in the mitochondrial matrix. JC-1 is a monomer, which produces green fluorescence. Therefore, the change in particle membrane potential can be qualitatively observed under a fluorescence microscope using JC-1 as the fluorescence probe for qualitative analysis (Figure 5A), and quantitative detection can be performed by flow cytometry (Figure 5B).
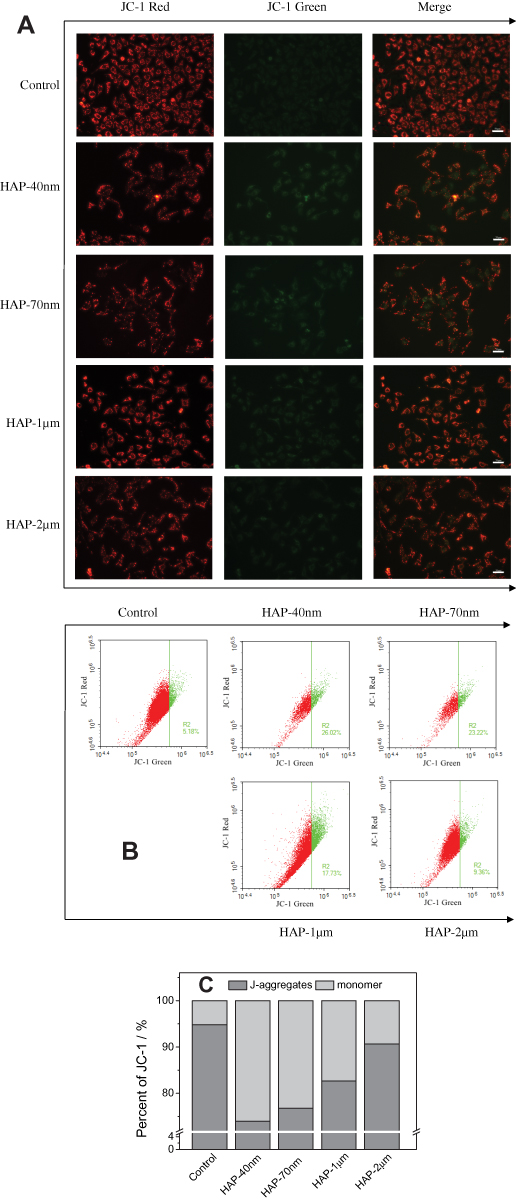 |
Figure 5 Mitochondrial membrane potential (Δψm) changes of HK-2 cells after injury by HAP with different sizes. (A) Qualitative observation of the changes in Δψm under fluorescence microscope; (B) Scatter plot of Δψm detected by flow cytometry; (C) Histogram for quantitative determination of aggregation degree of JC-1 in mitochondria, JC-1 monomers represent decreased Δψm. Crystal concentration: 250 μg/mL; treatment time: 24 h. Scale bars: 50 μm (200x). |
The normal group showed strong red fluorescence and weak green fluorescence (Figure 5A), and the proportion of cells at low potential was 5.18% (Figure 5B). However, after HAP crystal treatment, red fluorescence was weakened, green fluorescence was enhanced, and the proportion of low-potential cells was significantly increased (9.48%–26.68%). Thus, the HAP crystals caused different degrees of mitochondrial depolarization. The mitochondrial membrane potential decreased (22.72%–26.68%) because the nanocrystals have a more severe effect (9.48%–16.46%) and greater cytotoxicity than the micron crystals.
Changes of Cell Cycle Distribution Induced by HAP Crystals
As shown in Figure 6, the four HAP crystals resulted in an increase in the proportion of cells in the G0/G1 phase (pre-DNA synthesis), the proportion of G0/G1 in HAP-40 nm, HAP-70 nm, HAP-1 μm, and HAP-2 μm treatment groups were 83.8%, 75.3%, 73.8%, and 65.5%, respectively, which were greater than 58.6% of the control group. The proportion of S phase (DNA synthesis period) decreased to 10.2% and 17.2%. 14.1% and 23.8% were all less than the 27.6% of the control group (Figure 6B). That is, each HAP blocked cell proliferation, and its retention ability to the G0/G1 phase of the cells was consistent with the cytotoxicity order of each crystal (Figure 6C).
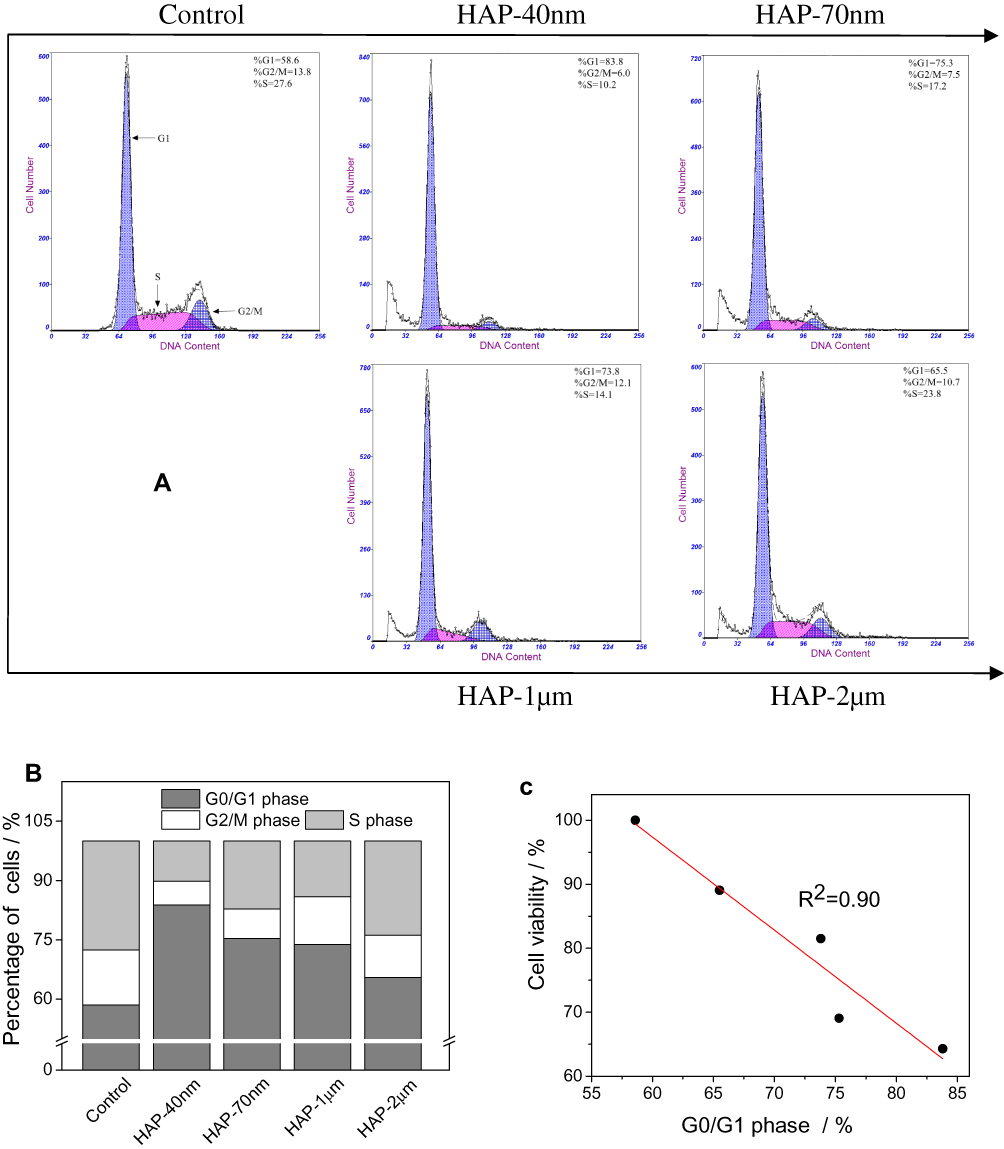 |
Figure 6 Changes in cell cycle distribution of HK-2 cells after injury by HAPs with different sizes. (A) Cell cycle images detected by Flow cytometry; (B) quantitative histogram of cell cycle distribution; (C) correlation between cell viability and retention capacity at G0/G1 phase. Crystal concentration: 250 μg/mL; treatment time: 24 h. |
Effect of HAP Crystals on Cell Death Mode of HK-2 Cells
Apoptosis and necrosis were qualitatively observed by fluorescence microscopy using Hoechst 33342-PI double staining (Figure 7A). Hoechst 33342 can penetrate the cell membrane into normal and apoptotic cells and binds to intracellular DNA to show blue fluorescence. PI does not pass through the normal cell membrane, but it can transmit red fluorescence by binding to DNA in the nucleus through the membrane of late apoptotic and necrotic cells. The small number of cells with red fluorescence in the normal control group indicated the relatively low quantity of late apoptotic and necrotic cells. The number of cells with red fluorescence increased in the HAP crystal treatment group, and the cells treated by small-sized HAP showed higher degrees of necrosis.
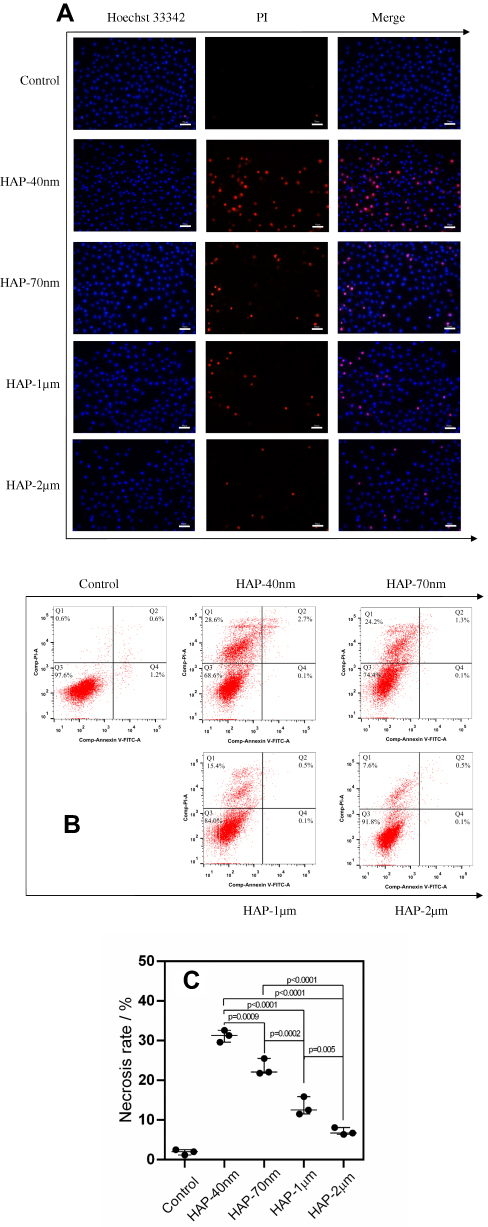 |
Figure 7 Changes of apoptosis and necrosis rate of HK-2 cells after injury by HAPs with different sizes. (A) Qualitative observation of apoptosis and necrosis under fluorescence microscope; (B) quantitative scatter plot of apoptosis and necrosis; (C) statistical result of necrosis rate. Crystal concentration: 250 μg/mL; treatment time: 24 h. Scale bars: 50 μm (100x). |
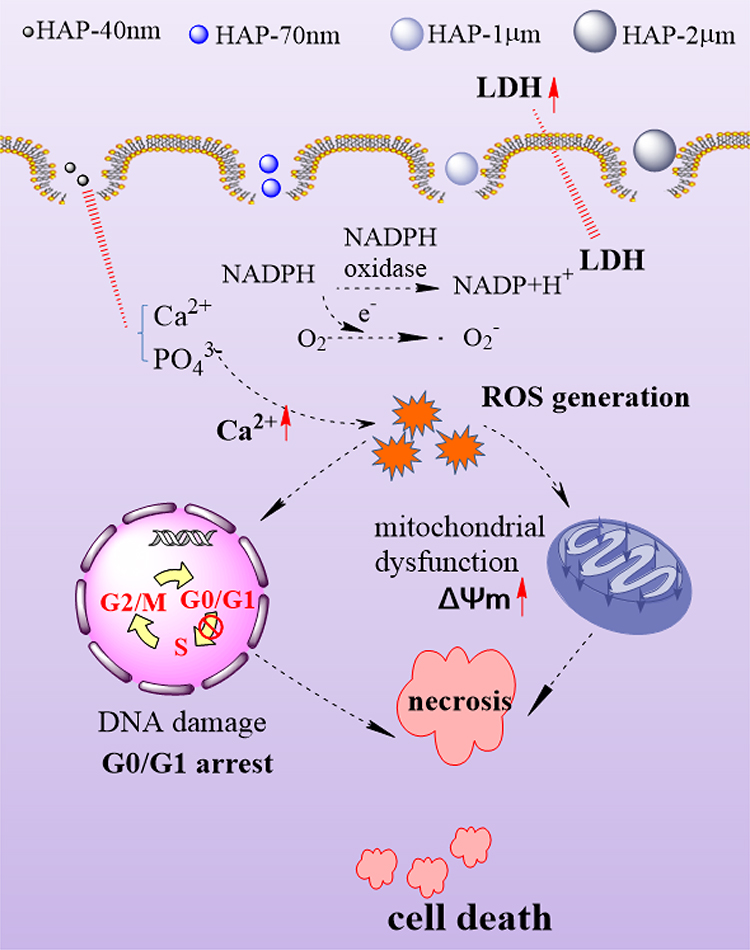 |
Figure 8 Schematic diagram of cytotoxicity mechanism of HK-2 cells induced by HAP with different sizes. |
The number of cells with apoptotic or necrotic morphotype was measured by flow cytometry using Annexin V-FITC/PI double staining (Figure 7B and C). The proportion of cells with apoptotic morphotype (Q4) and necrotic morphotype (Q1+Q2) was only 1.2%. The number of cells with necrotic morphotype increased with the decrease in HAP size in the following order: HAP-40 nm (31.3%) > HAP-70 nm (25.5%) > HAP-1 μm (15.9%) > HAP-2 μm (8.1%).
Discussion
HAP is a common component of most idiopathic CaOx stones and the core element of Randall plaques. HAP crystallites on the surface of renal epithelial cells are nests that can induce the formation of Randall plaques and even kidney stones. HAP crystals with different sizes from nanometer to micrometer and with varying morphologies can be found in Randall plaques.8
Urinary supersaturation, which is closely related and inversely proportional to the size of initially formed crystallites,28 is higher in kidney stone formers than in healthy controls.26,27 Owing to the high supersaturation in the urine of stone formers, their initially formed urine crystallites were smaller than those of healthy controls. Therefore, we studied the damage of four different sizes of HAP to renal epithelial cells and the underlying risk of Randall plaque formation to reveal and understand the mechanism of stone formation.
The formation of Randall plaque and its transformation into stones are divided into four stages.12,29 1) Calcium phosphate crystals are deposited in the nipple interstitial. 2) Then, Randall plaque grows and expands. 3) The epithelium of the plaque cells is damaged. 4) Apatite and CaOx crystals accumulate on the surface of the Randall plaque, eventually forming kidney stones. As one of the important links in the formation of Randall plaque and its transformation into calculus, the cell damage caused by this plaque further induces the adherence of HAP and accelerates the exposure of Randall plaque to urine, thereby attracting CaOx in the supersaturated surrounding urine. The attachment of crystals to the surface of the plaque promotes the deposition of CaOx crystals, which increases the risk of kidney stone formation.
The four HAP crystals with different sizes showed dose and size dependence on cell viability and LDH release (Figure 1C). Nanoscale HAP-40 nm and HAP-70 nm were more toxic to HK-2 cells than the micron-sized HAP-1 μm. The destruction of HK-2 cell morphological integrity by the HAP crystals also showed a consistent pattern of toxicity (Figure 2A). The integrity of cell morphology is necessary in completing the normal physiological functions.
Changes in the cytoskeleton occur after cell damage (Figure 2C). Nano-HAP crystals can be directly endocytosed into the interior of the cell. Endocytosis leads to rearrangement of actin and affects the skeletal organization in the cell. Therefore, the treatment groups of the nano-sized HAP-40 nm and HAP-70 nm greatly affected the cytoskeleton tissue,30 resulting in the disorder of cytoskeleton distribution and destruction of cytoskeleton integrity. By contrast, the large micron-sized HAP crystals could not directly interfere with actin alignment as easily as could the nanocrystals. Thus, most of the cytoskeleton in the HAP-1 μm and HAP-2 μm treatment groups essentially remained intact.
We further examined some biochemical indicators in the cells to further investigate the causes of differences in cytotoxicity caused by the HAP crystals of different sizes. The production of ROS is an important cause of cytotoxicity caused by oxidative stress, and the specific surface area of exogenous particles is a key factor affecting ROS production.31 Qualitative and quantitative detection showed that the intracellular ROS levels in the groups treated by HAP-40 nm, HAP-70 nm, HAP-1 μm, and HAP-2 μm crystals, which had specific surface areas of 76.2, 67.0, 6.16, and 1.18 m2/g, increased to 41.4%, 28.5%, 16.6%, and 10.2%, respectively (Figure 3). That is, the smaller the crystal size, the larger the amount of ROS produced.
The dissolution of HAP releases calcium ions, which can enter the cytoplasm, and the homeostasis of intracellular calcium ([Ca2+]i) plays a crucial role in nearly all cellular processes, including cell proliferation and apoptosis. Nano-sized HAP crystals with large specific surface areas are beneficial for cell uptake and dissolved in lysosomal acidic environments, which in turn increases [Ca2+]i levels and causes an imbalance in intracellular Ca2+ homeostasis, leading to cytotoxicity.32
Motskin et al33 showed that treatment of MGC80-3 cells with rod-shaped nano-HAPs of different sizes caused an increase in [Ca2+]i; a good correlation was observed between the increase in [Ca2+]i and the cytotoxicity of HAP.33,34 The results also showed that nano-scale HAP-40 nm and HAP-70 nm, which had large specific surface areas, showed greater toxicity than the micro-level HAP-1 μm and HAP-2 μm crystals, which had small specific surface areas. The increase of [Ca2+]i level was positively correlated with the cytotoxicity of HAP (Figure 4F). That is, the increase in [Ca2+]i levels caused by HAP was an important factor leading to cytotoxicity.
Most of the ROS occurs in the mitochondria. Therefore, high levels of ROS can induce changes in mitochondrial membrane permeability, mitochondrial membrane potential depolarization, respiratory chain disruption, and mitochondrial function disruption. When the mitochondria are damaged beyond their own repair capacity, they undergo apoptosis or necrosis.35 Four kinds of HAPs significantly caused a decrease in ΔΨm (Figure 5). The HAP-40 nm and HAP-70 nm treatment groups, which had high ROS levels, exhibited lower damage to mitochondrial membrane potential than HAP-1 μm and HAP-2 μm.
Oxidative stress can also lead to DNA damage, which causes cell cycle retention36 and thus accelerates cell death.37 The G1 phase is a key stage in determining the state of cell proliferation. A detection point (R point) regulates the cell proliferation cycle, which controls the progress of cellular activities. The R point can prevent the damaged cells from entering the S phase, and the cells are directly detached from the G1 phase and enter the death process. The nano-HAP-induced HK-2 cell cycle arrest was stronger in G0/G1 phase than micron HAP (Figure 6). The normal cell cycle was disrupted, thus further inducing cells into the death program (Figure 7).
When HAP crystals adhere to the cell surface, they immediately internalized. This phenomenon is the key event in mediating nanoscopic calcium phosphate toxicity.33 HAP-induced cell damage is mainly caused by the internalization of crystals and the increase in cytosolic Ca2+ levels, which reflect the dissolution of calcium phosphate particles in lysosomes. Excessive dissolution of calcium phosphate destroys the intracellular calcium homeostasis, thereby causing mitochondrial dysfunction and cell cycle disorder, that is, a series of cellular responses eventually leads to the death of a large number of necrotic cells (Figure 8).31
The endocytotic ability of renal epithelial cells for HAP exhibits size dependence. Nano-HAP is easier to be endocytosed into cells than micron-sized HAP. The internalization of nano-HAP crystals was more extensive than that of micron-sized HAP (Figure 4A). Therefore, nano-sized HAP exhibits higher cytotoxicity than micron-sized HAP, suggesting that the former has higher risk of forming Randall plaque than the latter.
In a normal in vivo environment, normal renal tubular cells can inhibit the adhesion of HAP crystals and eliminate some HAP crystallites through endocytosis. Pathological circumstances, such as exogenous stimulus, may induce healthy cells to acquire a crystal-binding phenotype.38 Oxidative damage caused by free radicals can lead to the exfoliation of membrane fragments in the lumen and the expression of adhesion molecules, which provide suitable sites for the nucleation and adhesion of urine crystallites (such as HAP and CaOx).39 The newly formed crystals adhere to the surface of tubular cells and further cause cell damage by the adhesion and aggregation of new microcrystals and accelerating the formation of Randall plaque. The formed plaque destroys the renal papillary epithelial layer, contact the urine, and induce CaOx stone formation.
Conclusions
The cytotoxicity of HAP crystals is closely related to crystal size. The action of four HAP crystals with different sizes on HK-2 cells caused cell membrane damage, cell morphology changes, cytoskeleton damage, and intracellular Ca2+ level increase. These changes result in an imbalance of the intracellular calcium homeostasis and a large amount of intracellular ROS production. In turn, this condition will decrease ΔΨm, arrest the cell cycle, cause loss of normal cell function, and induce cell necrosis. Moreover, the cytotoxicity of HAP on HK-2 cells is size-dependent. The results of this work are helpful for further understanding the formation mechanism of Randall plaque and its promoting effect on the formation of CaOx kidney stones.
Funding
This research work was granted by the National Natural Science Foundation of China (No. 21701050 and 21975105).
Disclosure
The authors declare that they have no competing interests.
References
1. Chen NX, O’Neill KD, Moe SM. Matrix vesicles induce calcification of recipient vascular smooth muscle cells through multiple signaling pathways. Kidney Int. 2018;93(2):343–354. doi:10.1016/j.kint.2017.07.019
2. Hunter LW, Charlesworth JE, Yu S, Lieske JC, Miller VM. Calcifying nanoparticles promote mineralization in vascular smooth muscle cells: implications for atherosclerosis. Int J Nanomed. 2014;9:2689–2698.
3. Villa-Bellosta R, Millan A, Sorribas V. Role of calcium-phosphate deposition in vascular smooth muscle cell calcification. Am J Physiol-Cell Ph. 2010;300(1):C210–C220. doi:10.1152/ajpcell.00229.2010
4. Lee T, Lin YC. Mimicking the initial development of calcium urolithiasis by screening calcium oxalate and calcium phosphate phases in various urinelike solutions, time points, and pH values at 37°C. Cryst Growth Des. 2011;11(7):2973–2992. doi:10.1021/cg200246v
5. Daudon M, Bouzidi H, Bazin D. Composition and morphology of phosphate stones and their relation with etiology. Urol Res. 2010;38(6):459–467. doi:10.1007/s00240-010-0320-3
6. Grases F, Costa-Bauzá A, Gomila I, Ramis M, García-Raja A, Prieto RM. Urinary pH and renal lithiasis. Urol Res. 2012;40:41–46. doi:10.1007/s00240-011-0389-3
7. Verrier C, Bazin D, Huguet L, et al. Topography, composition and structure of incipient Randall plaque at the nanoscale level. J Urol. 2016;196(5):1566–1574. doi:10.1016/j.juro.2016.04.086
8. Khan SR, Rodriguez DE, Gower LB, Monga M. Association of Randall plaque with collagen fibers and membrane vesicles. J Urol. 2012;187(3):1094–1100. doi:10.1016/j.juro.2011.10.125
9. Evan AP, Lingeman JE, Coe FL, et al. Randall’s plaque of patients with nephrolithiasis begins in basement membranes of thin loops of Henle. J Clin Invest. 2003;111(5):607–616. doi:10.1172/JCI17038
10. Knoll T. Epidemiology, pathogenesis, and pathophysiology of urolithiasis. Eur Urol Suppl. 2010;9(12):802–806. doi:10.1016/j.eursup.2010.11.006
11. Evan AP, Lingeman JE, Worcester EM, et al. Contrasting histopathology and crystal deposits in kidneys of idiopathic stone formers who produce hydroxyapatite, brushite, or calcium oxalate stones. Anat Rec. 2014;297(4):731–748. doi:10.1002/ar.22881
12. Evan AP, Unwin RJ, Williams, Jr. JC. Renal stone disease: a commentary on the nature and significance of Randall’s plaque. Nephron Physiol. 2011;119(4):49–53. doi:10.1159/000330255
13. Daudon M, Bazin D, Letavernier E. Randall’s plaque as the origin of calcium oxalate kidney stones. Urolithiasis. 2015;43(1):5–11. doi:10.1007/s00240-014-0703-y
14. Kuo RL, Lingeman JE, Evan AP, et al. Urine calcium and volume predict coverage of renal papilla by Randall’s plaque. Kidney Int. 2003;64:2150. doi:10.1046/j.1523-1755.2003.00316.x
15. Shi X, Zhou K, Huang F, Wang C. Interaction of hydroxyapatite nanoparticles with endothelial cells: internalization and inhibition of angiogenesis in vitro through the PI3K/Akt pathway. Int J Nanomed. 2017;12:5781–5795. doi:10.2147/IJN.S140179
16. Han Y, Li S, Cao X, et al. Different inhibitory effect and mechanism of hydroxyapatite nanoparticles on normal cells and cancer cells in vitro and in vivo. Sci Rep-UK. 2014;4:7134. doi:10.1038/srep07134
17. Yuan Y, Liu C, Qian J, Wang J, Zhang Y. Size-mediated cytotoxicity and apoptosis of hydroxyapatite nanoparticles in human hepatoma HepG2 cells. Biomaterials. 2010;31(4):730–740. doi:10.1016/j.biomaterials.2009.09.088
18. Escobar C, Byer KJ, Khaskheli H, Khan SR. Apatite induced renal epithelial injury: insight into the pathogenesis of kidney stones. J Urol. 2008;180(1):379–387. doi:10.1016/j.juro.2008.02.041
19. Khan A, Gilani AH, Khan SR. Expression of matrix Gla protein in MDCK cells exposed to oxalates, calcium oxalate monohydrate and hydroxyapatite crystals. Eur Urol Suppl. 2011;10(7):466–467. doi:10.1016/S1569-9056(11)61163-9
20. Cai Y, Liu Y, Yan W, et al. Role of hydroxyapatite nanoparticle size in bone cell proliferation. J Mater Chem. 2007;17(36):3780–3787. doi:10.1039/b705129h
21. Foo KY, Hameed BH. Insights into the modeling of adsorption isotherm systems. Chem Eng J. 2010;156(1):2–10. doi:10.1016/j.cej.2009.09.013
22. Thommes M, Kaneko K, A V N, et al. Physisorption of gases, with special reference to the evaluation of surface area and pore size distribution (IUPAC technical report). Pure Appl Chem. 2015;87(9–10):1051–1069. doi:10.1515/pac-2014-1117
23. Juch H, Nikitina L, Reimann S, et al. Dendritic polyglycerol nanoparticles show charge dependent bio-distribution in early human placental explants and reduce hCG secretion. Nanotoxicology. 2018;12(2):90–103. doi:10.1080/17435390.2018.1425496
24. Fudge DS, Schorno S. The hagfish gland thread cell: a fiber-producing cell involved in predator defense. Cells. 2016;5(2):25. doi:10.3390/cells5020025
25. Sharifi S, Behzadi S, Laurent S, Forrest ML, Stroeve P, Mahmoudi M. Toxicity of nanomaterials. Chem Soc Rev. 2012;41(6):2323–2343. doi:10.1039/C1CS15188F
26. Tsujihata M. Mechanism of calcium oxalate renal stone formation and renal tubular cell injury. Int J Urol. 2008;15(2):115–120. doi:10.1111/j.1442-2042.2007.01953.x
27. Marangella M, Daniele PG, Ronzani M, Sonega S, Linari F. Urine saturation with calcium salts in normal subjects and idiopathic calcium stone formers estimated by an improved computer model system. Urol Res. 1985;13:189–193. doi:10.1007/BF00261822
28. Mersmann A. Crystallization and precipitation. Chem Eng Process. 1999;38(4–6):345–353. doi:10.1016/S0255-2701(99)00025-2
29. Khan SR, Canales BK. Unified theory on the pathogenesis of Randall’s plaques and plugs. Urolithiasis. 2015;43(1):109–123. doi:10.1007/s00240-014-0705-9
30. Huang XL, Teng X, Chen D, Tang FQ, He JQ. The effect of the shape of mesoporous silica nanoparticles on cellular uptake and cell function. Biomaterials. 2010;31:438–448. doi:10.1016/j.biomaterials.2009.09.060
31. Sun X-Y, Ouyang J-M, Gan Q-Z, Liu A-J. Renal epithelial cell injury induced by calcium oxalate monohydrate depends on their structural features: size, surface, and crystalline structure. J Biomed Nanotechnol. 2016;12(11):2001–2014. doi:10.1166/jbn.2016.2289
32. Cui X, Liang T, Liu C, Yuan Y, Qian J. Correlation of particle properties with cytotoxicity and cellular uptake of hydroxyapatite nanoparticles in human gastric cancer cells. Mat Sci Eng C-Mater. 2016;67:453–460. doi:10.1016/j.msec.2016.05.034
33. Motskin M, Wright DM, Muller K, et al. Hydroxyapatite nano and microparticles: correlation of particle properties with cytotoxicity and biostability. Biomaterials. 2009;30(19):3307–3317. doi:10.1016/j.biomaterials.2009.02.044
34. Tang W, Yuan Y, Liu C, Wu Y, Lu X, Qian J. Differential cytotoxicity and particle action of hydroxyapatite nanoparticles in human cancer cells. Nanomedicine. 2014;9(3):397–412. doi:10.2217/nnm.12.217
35. Miethling-Graff R, Rumpker R, Richter M, Verano-Braga T, Kjeldsen F, Brewer J. Exposure to silver nanoparticles induces size-and dose-dependent oxidative stress and cytotoxicity in human colon carcinoma cells. Toxicol in Vitro. 2014;28(7):1280–1289. doi:10.1016/j.tiv.2014.06.005
36. Queiroz EAIF, Puukila S, Eichler R, et al. Metformin induces apoptosis and cell cycle arrest mediated by oxidative stress, AMPK and FOXO3a in MCF-7 breast cancer cells. PLoS One. 2014;9(5):e98207. doi:10.1371/journal.pone.0098207
37. Gao M, Yang Y, Lv M, Song W, Song Z. Oxidative stress and DNA damage in zebrafish liver due to hydroxyapatite nanoparticles-loaded cadmium. Chemosphere. 2018;202:498–505. doi:10.1016/j.chemosphere.2018.03.146
38. Priante G, Ceol M, Gianesello L, Furlan C, Del Prete D, Anglani F. Human proximal tubular cells can form calcium phosphate deposits in osteogenic culture: role of cell death and osteoblast-like transdifferentiation. Cell Death Discov. 2019;5(1):57. doi:10.1038/s41420-019-0138-x
39. Khan SR, Byer KJ, Thamilselvan S, et al. Crystal-cell interaction and apoptosis in oxalate-associated injury of renal epithelial cells. J Am Soc Nephrol. 1999;10(Suppl 14):S457–463.
 © 2020 The Author(s). This work is published and licensed by Dove Medical Press Limited. The full terms of this license are available at https://www.dovepress.com/terms.php and incorporate the Creative Commons Attribution - Non Commercial (unported, v3.0) License.
By accessing the work you hereby accept the Terms. Non-commercial uses of the work are permitted without any further permission from Dove Medical Press Limited, provided the work is properly attributed. For permission for commercial use of this work, please see paragraphs 4.2 and 5 of our Terms.
© 2020 The Author(s). This work is published and licensed by Dove Medical Press Limited. The full terms of this license are available at https://www.dovepress.com/terms.php and incorporate the Creative Commons Attribution - Non Commercial (unported, v3.0) License.
By accessing the work you hereby accept the Terms. Non-commercial uses of the work are permitted without any further permission from Dove Medical Press Limited, provided the work is properly attributed. For permission for commercial use of this work, please see paragraphs 4.2 and 5 of our Terms.