")
Back to Journals » International Journal of Nanomedicine » Volume 13
Site-specific PEGylation of an anti-CEA/CD3 bispecific antibody improves its antitumor efficacy
Authors Pan H, Liu J , Deng W , Xing J, Li Q, Wang Z
Received 4 February 2018
Accepted for publication 13 April 2018
Published 29 May 2018 Volume 2018:13 Pages 3189—3201
DOI https://doi.org/10.2147/IJN.S164542
Checked for plagiarism Yes
Review by Single anonymous peer review
Peer reviewer comments 4
Editor who approved publication: Professor Lei Yang
Haitao Pan,1,2 Jiayu Liu,1,2 Wentong Deng,1,2 Jieyu Xing,1,2 Qing Li,1,2 Zhong Wang1,2
1School of Pharmaceutical Sciences, 2Centre for Cellular & Structural Biology, Sun Yat-Sen University, Guangzhou, People’s Republic of China
Introduction: Bispecific antibodies that engage immune cells to kill cancer cells are actively pursued in cancer immunotherapy. Different types of bispecific antibodies, including single-chain fragments, Fab fragments, nanobodies, and immunoglobulin Gs (IgGs), have been studied. However, the low molecular weight of bispecific antibodies with single-chain or Fab fragments generally leads to their rapid clearance in vivo, which limits the therapeutic potential of these bispecific antibodies.
Materials and methods: In this study, we used a site-specific PEGylation strategy to modify the bispecific single-domain antibody-linked Fab (S-Fab), which was designed by linking an anticarcinoembryonic antigen (anti-CEA) nanobody with an anti-CD3 Fab.
Results: The half-life (t1/2) of PEGylated S-Fab (polyethylene glycol-S-Fab) was increased 12-fold in vivo with a slightly decreased tumor cell cytotoxicity in vitro as well as more potent tumor growth inhibition in vivo compared to S-Fab.
Conclusion: This study demonstrated that PEGylation is an effective approach to enhance the antitumor efficacy of bispecific antibodies.
Keywords: Fab, nanobody, PEGylation, bispecific antibody, half-life, CEA
Introduction
Antibodies have attracted increasing interest as therapeutics due to their unique biophysical characteristics, such as good solubility, stability, high specificity, and prolonged plasma concentration.1–3 A wide range of nonconventional antibody formats have also been studied for use in a diverse array of biological applications. For example, bispecific antibodies have been developed as a powerful approach to cancer immunotherapy by engaging immune cells to target cancer cells.4,5 Bispecific antibodies have the following two different antigen-binding sites: one recognizes tumor cells and the other recognizes immune cells, usually T cells or natural killer (NK) cells.4,6,7 Various bispecific antibody formats have been studied, including immunoglobulin G (IgG)-based full-length formats (such as complete bispecific antibodies), single-chain-based formats (including tandem single-chain variable fragments [ScFvs]),8,9 and bispecific T-cell engagers (BiTEs).10
To enhance the tumor tissue penetration of full-size IgG antibodies and improve the stability of ScFv and BiTE antibodies, the bispecific single-domain antibody-linked Fab (S-Fab) format was developed and can bind to diverse epitopes and be synthesized in prokaryotic expression systems.8,11,12 Derived from natural camel heavy-chain only antibodies, single-domain antibodies lack the first constant (CH1) domain and light chain and are consequently referred to as nanobodies or VHHs (variable regions of heavy chain). Nanobodies are small sized and generally more stable than conventional ScFvs or BiTEs are, thus making them a good scaffold for constructing bispecific antibodies.13–16 In a previous study, a bispecific S-Fab antibody was constructed by linking the single-domain nanobody anticarcinoembryonic antigen (anti-CEA) with a CD3-Fab,8 which specifically kills tumor cells that overexpress carcinoembryonic antigen (CEA) by engaging T cells. S-Fab has potent in vitro cytotoxicity and significantly suppresses cancer progression in in vivo studies.8
However, Fab fragments (including S-Fab) have a short plasma half-life because they are degraded rapidly in vivo due to their lack of constant regions (Fc), which are responsible for neonatal Fc receptor (FcRN)-mediated transfer and receptor-mediated antibody recycling. Their short in vivo half-life makes them less than optimal for clinical application.17–19
To improve the in vivo half-life of proteins, various strategies have been explored to modulate their pharmacokinetic (PK) profiles, including conjugation to polyethylene glycol (PEG; PEGylation), N-(2-hydroxypropyl) methacrylamide (HPMA) copolymers, proteins (such as albumin), and more recently, polyglutamic acid and PASylation.19–23 Since the first introduction of PEG as an immunoprotective agent by Abuchowski et al23–25 and the pioneering work of Davis26 in the late 1970s, the covalent attachment of biocompatible nontoxic PEG to therapeutic proteins has become a common technique for improving the PK properties to reduce renal clearance.22,23,27,28 In addition to extending the half-life, PEGylation offers a number of additional advantages, including reducing the antigenicity and immunogenicity of the conjugated proteins,27 improving protein solubility,29 enhancing the proteolytic resistance of therapeutic proteins,30 decreasing toxicity, and improving the thermal and mechanical stabilities.27 Currently, several PEGylated proteins have been approved in the clinic and a number of PEGylated proteins are under clinical trials.23
In this study, we explored thiol site-specific PEGylation to improve the half-life (t1/2) of the CEA-S-Fab bispecific antibody, which is an anti-CEA/CD3 bispecific S-Fab.8 A functionalized 20 kDa linear PEG was conjugated to S-Fab. To retain the properties of CEA-S-Fab, the site for conjugation was designed to be distant to both CEA- and CD3-binding sites. The PEGylated S-Fab (PEG-S-Fab) retained the ability to bind to tumor cells and T cells. PEG-S-Fab showed enhanced plasma stability and a 12-fold increase in the half-life compared to S-Fab. PEG-S-Fab also had more potent tumor inhibitory efficacy in xenograft mouse models. These data suggest that PEGylation is an effective approach for enhancing the antitumor properties of bispecific antibodies.
Materials and methods
Reagents and supplies
The 20 kDa linear methoxy PEG maleimide (MAL-PEG-OMe; Lot A3115) was purchased from JenKem Technology Co., Ltd. (Beijing, People’s Republic of China). Human colon adenocarcinoma cell line LS174T and human breast cancer cell line SKOV3 were purchased from the Type Culture Collection of the Chinese Academy of Sciences (Shanghai, People’s Republic of China). HI fetal bovine serum (FBS), Dulbecco’s Modified Eagle Medium (for SKOV3 cells), and Roswell Park Memorial Institute 1640 (for LS174T cells) medium were purchased from Thermo Fisher Scientific (Waltham, MA, USA). Ficoll gradient separating solution was purchased from GE Healthcare Bio-Sciences Corp. (Piscataway, NJ, USA). The EasySep™ Human CD3 Positive Selection Kit was purchased from StemCell Technologies, Inc. (Vancouver, BC, Canada). The cell counting kit-8 (CCK8; Lot CK04) reagent was purchased from Dojindo Molecular Technologies, Inc. (Shanghai, People’s Republic of China). The goat antihuman IgG (H + L)-AlexaFluor 488 antibody (Lot A11001; Thermo Fisher Scientific), mouse monoclonal antiflag peroxidase (HRP) IgG (Lot A8492; Sigma-Aldrich Co., St Louis, MO, USA), mouse monoclonal anti-His IgG (Lot 14-6657-82; Thermo Fisher Scientific), and goat antimouse HRP-conjugated IgG (Lot ab97040; Abcam Co., Ltd., Shanghai, People’s Republic of China) were purchased accordingly. Anti-CD3 fluoresceine isothiocyanate (OKT3; Lot 11-0037-42) was purchased from Thermo Fisher Scientific. A bicinchoninic acid protein assay kit (Thermo Fisher Scientific) was used for protein quantification. The soluble tetramethylbenzidine substrate solution for enzyme-linked immunosorbent assay (ELISA) was purchased from TIANGEN Biotech Co., Ltd. (Beijing, People’s Republic of China). The Tecan Infinite F50 ELISA Microplate reader was purchased from Tecan Group Ltd. (Shanghai, People’s Republic of China). An FV3000 laser scanning confocal microscope (Olympus Corporation, Tokyo, Japan) was used for immunofluorescence analysis. A Beckman-Coulter Cytomics™ FC 500 (Beckman Coulter, Inc., Brea, CA, USA) was used for flow cytometry analysis. The human materials used in the study, especially whole blood cells, peripheral blood mononuclear cells (PBMCs), and sera, were from Guangzhou Blood Center (Guangzhou, People’s Republic of China). The documented review was approved by Health and Family Planning Commission of Guangdong Province (People’s Republic of China). The written informed consents from donors have been obtained by Guangzhou Blood Center.
Animals
Specific pathogen free nonobese diabetic–severe combined immunodeficiency (NOD–SCID) mice (18–22 g) were purchased from Beijing Biocytogen Co., Ltd. (Beijing, People’s Republic of China). Adult male Sprague Dawley (SD) rats (250–300 g) that were used for PK analysis were supplied by the Laboratory Animal Center, Sun Yat-Sen University, Guangzhou, People’s Republic of China. All animals were housed in the Laboratory Animal Center, Sun Yat-Sen University, under sterile and standardized environmental conditions (20°C–26°C room temperature, 40%–70% relative humidity, and a 12 h light–dark cycle). The welfare of the animals in in vivo experiments was handled strictly following “Guidelines on kindly treatments for experimental animals” by the Science and Technology Ministry of the People’s Republic of China (2006) 398. All protocols were approved by the Institutional Animal Ethics Committee of Sun Yat-Sen University (approval no IACUC-DD-18-0307).
S-Fab design and protein purification
The structure of S-Fab is shown in Figure 1A. The VH-CH1 and VL-CL fragments of anti-CD38 were synthesized and cloned by standard DNA cloning techniques. The signal sequence of pelB was added to the N-terminus for periplasmic expression. For the site-specific conjugation of PEG, a cysteine residue was added at the C-terminus of the light chain, followed by a short linker, and another cysteine (CGGGGC) and a his6 tag were added. S-Fab was constructed via the heterodimerization of VL-CL/VH-CH1 (anti-CD3 Fab) with the anti-CEA VHH nanobody.16,31 A Flag-tag was added to the C-terminus of the heavy chain for detection (Figure 1B).
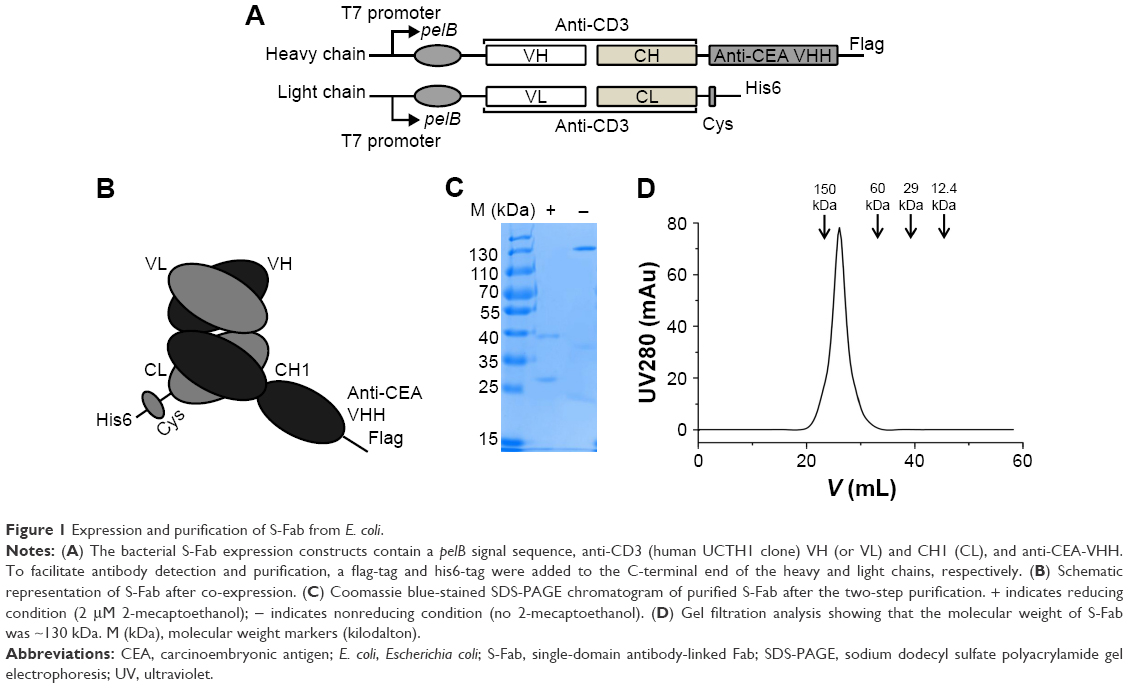 | Figure 1 Expression and purification of S-Fab from E. coli. |
To produce S-Fab, two plasmids encoding the VH-CH1-VHH and VL-CL polypeptides were co-transformed into BL21 (DE3, codon plus) competent cells with the appropriate antibiotics.8 When the absorbance (OD600) of the cell culture reached 0.8, 0.2 mM isopropyl-β-D-thiogalactoside (IPTG) was added to induce protein expression. Cells were cultured at 16°C for another 40 h before harvesting. After harvesting the cells by centrifugation, periplasmic extraction was performed by re-suspending the cell pellets 1:4 (gram:milliliter) in a precooled sucrose solution (20 mM Tris-HCl, pH 7.5; 25% [w/v] sucrose; 1 mM EDTA). After a 15 min incubation on ice, the suspension was centrifuged at 10,000× g for 20 min and the supernatant fraction was collected as the sucrose fraction. The pellet was re-suspended in a chilled periplasmic solution (5 mM MgCl2) and centrifuged at 10,000× g for 20 min. The supernatant was gathered as the periplasmic fraction.
The S-Fab protein was purified from the combined sucrose and periplasmic fractions by a two-step purification: first by immobilized Ni-NTA affinity chromatography (GE Healthcare Bio-Sciences Corp.) and then by an IgG-CH1 affinity matrix (Lot 194320005; Thermo Fisher Scientific). Gel filtration analysis was performed using a Bio-Rad FPLP system and a GE Superdex 200™ Increase 10/300 GL column at a flow rate of 0.5 mL/min. Fractions (0.5 mL per fraction) were collected and subjected to sodium dodecyl sulfate polyacrylamide gel electrophoresis (SDS-PAGE) analysis under reducing conditions. The resulting fractions were visualized by Coomassie blue staining. Protein markers (Lot MWGF200; Sigma-Aldrich Co.) were loaded as standard controls for gel filtration analysis.
Conjugation of S-Fab to PEG (PEGylation)
S-Fab was engineered with two terminal cysteine residues located at the C-terminus of CL, which served as the sites for conjugation with a 20 kDa linear MAL-PEG-OMe. S-Fab (~1.35 mg/mL [~20 μM] in 5.0 mL of phosphate-buffered saline [PBS], pH 7.4) and 3 M equivalents of 1 mM tris(2-carboxyethyl) phosphine (TCEP; final 60 μM, ~300 μL) were mixed and incubated for 2 h at 22°C to obtain reduced S-Fab fragments.
To explore the optimal molar ratio of MAL-PEG-OMe and S-Fab in the PEGylation process, we performed a series of reactions with the molar equivalents of PEG:S-Fab of 0:1, 10:1, 20:1, 40:1, and 60:1. MAL-PEG-OMe was dissolved in sterile water to obtain a working concentration of 20 mg/mL (1 mM). PEGylation of S-Fab was carried out by mixing MAL-PEG-OMe (at the working concentration) with reduced S-Fab and shaking at 22°C for 2 h. The resulting samples were subjected to 12% reducing or nonreducing SDS-PAGE electrophoresis (5 μL/sample/PAGE), followed by Coomassie blue and barium iodide staining of PEG as previously described.32 After electrophoresis, a Western blotting assay was used to detect the PEGylated chain. Briefly, two gels were transferred to polyvinylidene fluoride membrane (EMD Millipore, Billerica, MA, USA). After blocking for 2 h with 5% skimmed milk, the membranes were incubated with mouse monoclonal antiflag HRP (1:2,000, for heavy chain) and mouse monoclonal anti-His IgG (1:3,000, for light chain) in 5% skim milk. The secondary antibody (goat antimouse HRP-conjugated IgG, 1:3,000) was incubated with the light-chain membrane for another hour after washing with tris-buffered saline and Tween 20 buffer. The membranes were developed with Pierce’s West Pico chemiluminescence substrate (EMD Millipore) after washing with tris-buffered saline and Tween 20 buffer.
Purification of PEG-S-Fab using fast protein liquid chromatography
PEG-S-Fab was purified using an AKTA™ avant25 fast protein liquid chromatography purification system (GE Healthcare Bio-Sciences Corp.) and a Superdex 10/300 GL column at a flow rate of 0.8 mL/min. The column was first equilibrated with two column volumes (CVs) of distilled water and two CVs of PBS before applying the samples. All the collected fractions were analyzed by Coomassie blue and barium iodide complex staining after SDS-PAGE under reducing conditions. The fractions of the purified PEG-S-Fab were pooled together for further studies.
Human CD3+ T-cell isolation
Human PBMCs were prepared from healthy donors using Ficoll gradient centrifugation as previously described.8,11 T cells were isolated from PBMCs using an EasySep™ Human CD3 Positive Selection Kit. Isolated T cells were cultured in complete Roswell Park Memorial Institute 1640 medium with 10% FBS and 1% penicillin/streptomycin at 37°C in a 5% CO2 humidified incubator before cytotoxicity assays.
Flow cytometric analysis
Flow cytometry was used to detect CEA binding using the CEA-positive cell line LS174T and CEA-negative cell line SKOV3, while CD3 antigen binding used CD3-positive T cells. Briefly, 1×10⁶ (for LS174T and SKOV3) or 5×10⁵ (for T cells) cells per sample were collected by centrifugation at 200× g for 5 min and washed once with 1.0 mL of ice-cold PBS with 0.20% bovine serum albumin (BSA). The primary antibodies, including S-Fab and PEG-S-Fab, and blank control (vehicle, PBS only) were added to a final concentration of 10 μg/mL and incubated on ice for 1 h, followed by washing twice with ice-cold PBS with 0.1% BSA. Anti-CD3 fluoresceine isothiocyanate (OKT3, final concentration of 10 μg/mL) was used as positive control for CD3+ antigen-binding analysis. Goat antihuman IgG (H + L)-AlexaFluor 488 antibody was then added to a final concentration of 5 μg/mL. The cells were incubated on ice for another hour. After washing the cells twice, flow cytometric detection was then performed.
Immunofluorescence assay
To further analyze the binding of S-Fab and PEG-S-Fab to cell surface CEA, immunofluorescence assays were performed as previously described.33 Briefly, LS174T and SKOV3 cells (2.5×10⁵ cells in 1.0 mL, respectively) were plated on 30 mm confocal glass bottom dishes (Nest Labs, Wuxi, People’s Republic of China; catalog 801002) to 80% confluence. The cells were then washed with cold PBS three times before fixing with 4% paraformaldehyde. The fixed cells were incubated with 20 μg of S-Fab or PEG-S-Fab followed by 10 μg of the goat antihuman IgG (H + L)-AlexaFluor 488 antibody for 2 h at 4°C. Cell nuclei were counterstained with 1.0 μg/mL of 4′,6-diamidino-2-phenylindole (DAPI). After washing with PBS, the samples were then examined under an Olympus FV3000 laser scanning confocal microscope and analyzed using the Olympus FV31S-SW_V2.1 software.
In vitro cytotoxicity assay
CEA-positive human LS174T cells and CEA-negative human SKOV3 cells were used to assess the in vitro growth inhibitory effects of S-Fab and PEG-S-Fab as previously described.8,11,33 Briefly, LS174T and SKOV3 cells were used as target cells (T) and freshly prepared human CD3+ T cells without prior stimulation were used as effector cells (E). In vitro cytotoxicity assays were performed in 96-well microplates in triplicate by seeding 5,000 target cells per well in 100 μL of the corresponding media. After a 6 h incubation, an equal volume of CD3+ T cells was added to each well at an E:T ratio of 10:1 and a series of concentrations (0.033, 0.1, 0.33, 1, 3.3, 10, 33, and 100 nM) of S-Fab or PEG-S-Fab were then added. After a 72 h incubation, the cell viability was evaluated with the CCK8 assay according to the manufacturer’s protocol. The absorbance values were detected using a Tecan microplate reader at 450 nm. The survival rate (100%) was calculated as [(As − Ab)/(A0 − Ab)] ×100%, where As is the absorbent value of the measurement group, Ab is the absorbent value of the medium, and A0 is the absorbent value of the measurement group at 0 nM.
PK assay to determine the in vivo half-life
Specific pathogen free male SD rats (250–300 g) were used for the PK assay. Food was controlled to maintain animals below a weight of 350 g. S-Fab (1.0 mg/kg), PEG-S-Fab (1.0 mg/kg), or a volume equivalent of the vehicle solution PBS was administered through the caudal vein. A blood sample (each ~150–200 μL) was taken from the orbital vein using capillary under isoflurane anesthesia at 0, 0.5, 1, 2, 4, 8, 16, 24, 36, 48, 72, 96, and 144 h after administration. All blood samples were collected in heparinized tubes. Plasma was obtained via centrifugation at 3,500× g for 30 min and then stored at −80°C until further analysis.
S-Fab and PEG-S-Fab in the plasma samples were quantified using ELISA. Briefly, a 100 μL aliquot of 6D6 (mouse antihuman IgG Fab antibody; 1.0 μg/mL in PBS) was used to coat each well of a 96-well ELISA microplate (Thermo Fisher Scientific) for 2 h at 37°C. The wells were washed twice with 200 μL of PBS with 0.05% Tween-20 (PBST). The wells were blocked with 200 μL of blocking buffer (PBST containing 1% BSA) for 2 h at 37°C. Each well was washed five times with PBST prior to the addition of 100 μL of samples or standards. Samples and standards (100, 80, 50, 40, 30, 20, 10, 5, 1, and 0.1 μg/mL) were prepared in blocking buffer, with the standards (S-Fab) prepared at a 1:10 dilution of plasma using PBS, which was important, to avoid matrix effects in the assay.17 For plasma samples, a 1:3 dilution was used. Either a 100 μL sample or a standard aliquot was added in triplicate and incubated at 37°C for 1 h. Each well was washed again with PBST before the addition of 100 μL of secondary antibody (mouse monoclonal antiflag M2-peroxidase [HRP] antibody at 1:500 dilutions) per well at 37°C for 1 h. After being washed five times, a 100 μL aliquot of tetramethylbenzidine substrate solution was added to each well. After a 10 min incubation, 100 μL of 2 M H2SO4 was added to stop the reaction. The absorbance was detected at 450 nm using a Tecan ELISA microplate reader.
The serum elimination t1/2 and clearance were calculated with 3P97 PK software using standard formulas. The results are expressed as the mean ± standard error of the mean (SEM), and comparisons between the groups were made with an unpaired Student’s t-test. Differences were considered to be statistically significant if P<0.05.
Plasma stability analysis
S-Fab and PEG-S-Fab stabilities were assessed in human fresh plasma over 2 weeks. Briefly, S-Fab and PEG-S-Fab were diluted with human fresh plasma (without platelets), which generated an initial concentration of 100 μg/mL. Simultaneously, a vehicle control with only plasma was established. The samples were incubated at 37°C for 2 weeks. At the time intervals of 0, 24, 48, 72, 96, 168, 264, and 336 h, 40 μL samples were collected and stored directly at −80°C until further analysis. The samples were thawed on ice and centrifuged at 18,500× g for 10 min at 4°C. The supernatant was subjected to electrophoresis in 12% reducing SDS-PAGE (5 μL of sample per well). After electrophoresis, a Western blotting assay was performed to analyze the protein levels.
In vivo tumor growth inhibition
The in vivo antitumor activities of S-Fab and PEG-S-Fab were studied using NOD–SCID mice engrafted subcutaneously with LS174T cells.8,34 Briefly, LS174T cells were harvested and washed once with PBS and mixed with human PBMCs that were freshly isolated from healthy donors. Mixtures of 1×10⁶ LS174T cells and 5×10⁶ human PBMCs were subcutaneously injected into the right flank of NOD–SCID mice at a total volume of 0.2 mL per mouse. One hour after engraftment, ~0.3 nmol of S-Fab (20.0 μg per mouse) and ~0.3 nmol of PEG-S-Fab (32.0 μg per mouse) or the vehicle control (PBS) were injected intraperitoneally. The animals were treated daily (0.3 nM per mouse in each group) for the following 6 days. The tumor volume was measured with calipers in two perpendicular dimensions and was calculated using the formula (width2 × length)/2. All data were expressed as the mean ± SEM for each group, and differences between groups were determined by a two-way analysis of variance using the GraphPad Prism 5 software (GraphPad Software, La Jolla, CA, USA).
Results
Bispecific S-Fab construction and purification
S-Fab was constructed as previously described with minor modifications.8 Basically, the single-domain nanobody anti-CEA VHH was linked to the C-terminus of anti-CD3 VH-CH1 (UCTH1 clone) (Figure 1A and B).35 A short peptide, CGGGGC, was added to the C-terminus of anti-CD3 VL-CL. Anti-CD3 VL-CL and VH-CH1-anti-CEA-VHH were cloned into pET26b and pET21a with the signal peptide for pelB at the N-terminus for periplasmic protein expression in Escherichia coli (Figure 1A and B). S-Fab was purified by two-step affinity purification, first with Ni-NTA, followed by anti-IgG-CH1 affinity purification to a final concentration of 0.3–0.4 mg/L. Under reducing condition (2 μM 2-mecaptoethanol), the light chain was ~25 kDa and the heavy chain was ~40 kDa, as expected (Figure 1C). Under nonreducing condition (no 2-mecaptoethanol), a major binding of ~130 kDa was observed (Figure 1C), suggesting the dimerization of S-Fab (~65 kDa of monomer), which was likely formed via the disulfide bond(s) of the C-terminal cysteine residues of VL-CL. Gel filtration analysis also showed that the intact S-Fab antibody had a molecular weight of ~130 kDa (Figure 1D), further confirming the dimerization of S-Fab. The purified S-Fab was subjected to further studies.
Conjugation of S-Fab to PEG (PEGylation)
PEGylation was performed using 20 kDa maleimide-terminated PEG. After the reduction of S-Fab by TCEP, free thiols were conjugated to MAL-PEG-OMe. The conjugation reactions were carried out at different molar ratios of PEG:S-Fab, ie, 10, 20, 40, and 60 (Figure 2A). PEGylation was analyzed using reducing SDS-PAGE and Coomassie blue dye (for protein S-Fab) and barium iodide complex staining (for PEGylated protein PEG-S-Fab) (Figure 2A and B). An increased ratio of PEG:S-Fab in the PEGylation of S-Fab with MAL-PEG-OMe resulted in higher molecular weight bands (~107 and ~45 kDa), indicating that maleimide-functionalized PEG was conjugated to S-Fab. The 45 kDa band suggested a single conjugation at the single C-terminal cysteine (Figure 2B and D). The ~107 kDa band indicated that both of the cysteine residues at the VL-CL terminus were PEGylated (Figure 2B and D). The ~107 kDa band appeared first and accounted for the majority of the light chain, indicating preferred conjugation on both cysteine residues (Figure 2B and D). As no decrease in VH-CH1-VHH was observed (Figure 2A and C) and no high molecular weight of VH-CH1-VHH was observed on Western blots (Figure 2C), the VH-CH1-VHH chain was likely not PEGylated. Because the band of the VL-CL chain decreased (Figure 2A and D) and PEGylation corresponded to the VL-CL chain based on anti-His Western blots (Figure 2B and D), the data suggested that only VL-CL was PEGylated. As the molar ratio of PEG:S-Fab increased (10–60), the molecular weight of the PEGylated bands slightly increased, suggesting further PEGylation on the other cysteine residues on VH-CH1 or VL-CL. A molar ratio of PEG:S-Fab of 20 was chosen for conjugation because it led to increased VL-CL conjugation without higher molecular weight conjugation.
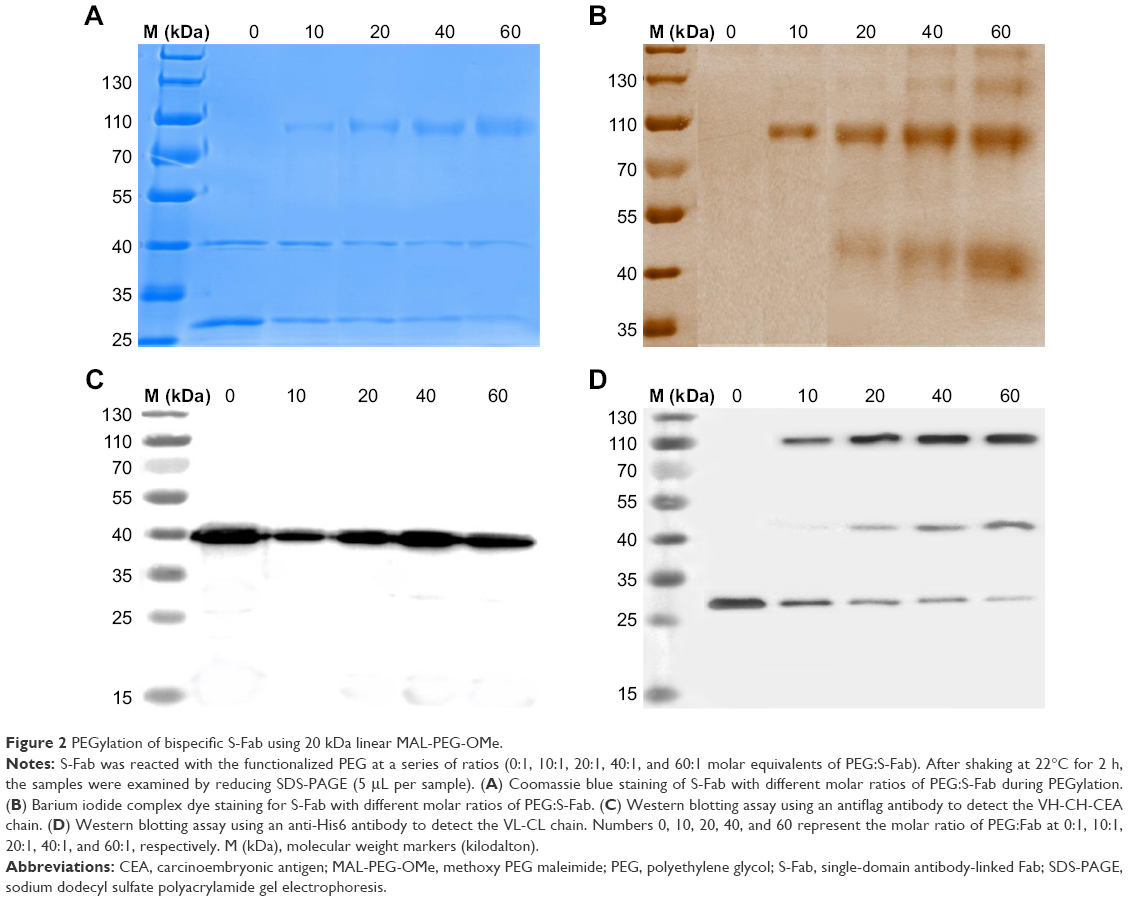 | Figure 2 PEGylation of bispecific S-Fab using 20 kDa linear MAL-PEG-OMe. |
Purification of PEG-S-Fab
To remove free PEG, free S-Fab, and high molecular weight proteins, the conjugation reaction mixture was subjected to size exclusion analysis. Based on reducing SDS-PAGE followed by Coomassie blue staining (Figure 3B) and barium iodide staining for PEGylation (Figure 3C), high molecular weight fraction 1 (Figure 3A–C) contained a large proportion of multiple conjugation species. Fraction 2 (Figure 3A–C) mostly contained the double- and single-site-conjugated PEG-S-Fab, while fraction 3 (Figure 3A–C) contained free S-Fab, free PEG, and a single-site-conjugated S-Fab. Fractions that mostly contained double- and single-site-conjugated PEG-S-Fab (fraction 2 in Figure 3) were pooled for further studies.
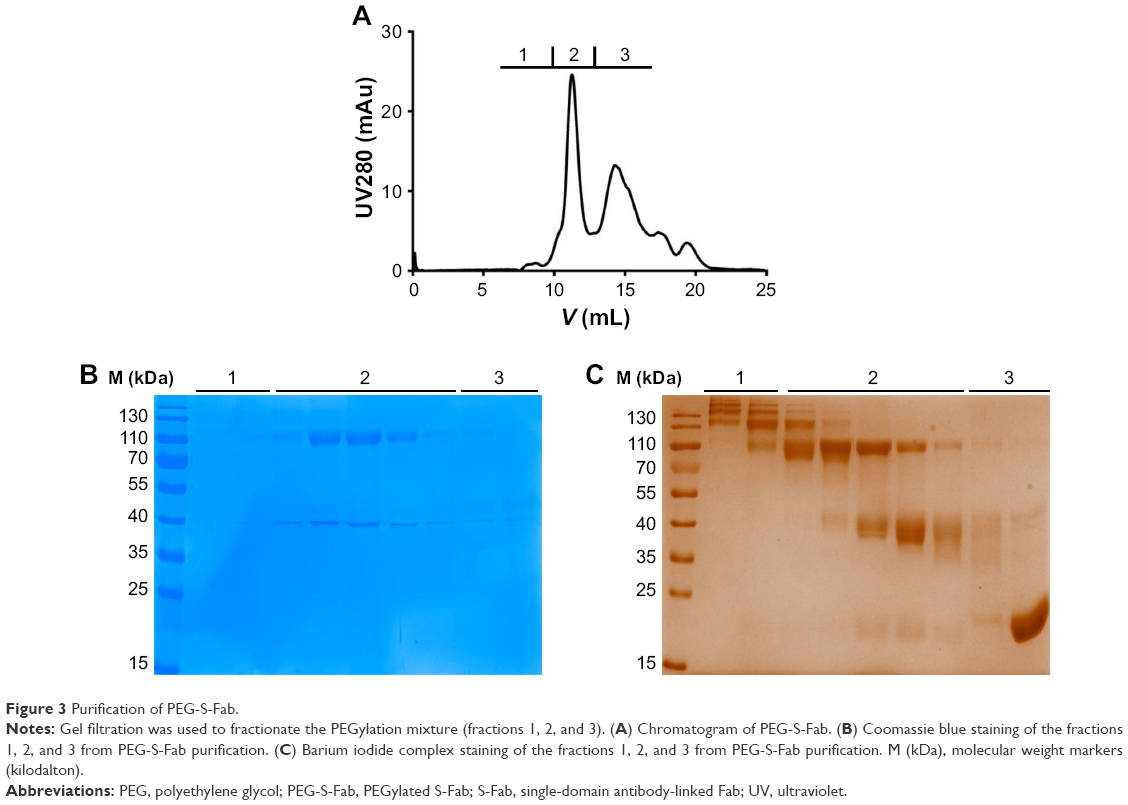 | Figure 3 Purification of PEG-S-Fab. |
PEG-S-Fab can bind the tumor antigen CEA and CD3+ T cells
Bispecific S-Fab has two different binding sites, anti-CEA VHH recognizing CEA on tumor cells and anti-CD3 recognizing CD3+ on T cells. To confirm whether PEGylation of S-Fab affected its ability to bind CEA-positive cancer cells, flow cytometry analysis was performed using LS174T cells that overexpress CEA.8 The CEA-negative cell line SKOV3 was used as a negative control. Both S-Fab and PEG-S-Fab showed distinct specific fluorescence intensity shifts, suggesting that PEG-S-Fab was still able to bind LS174T cells (Figure 4A). Meanwhile, a 15.8% left shift of PEG-S-Fab (X-med 19.92) could be observed compared to that of S-Fab (X-med 23.65). The slight left shift of PEG-S-Fab to the value of S-Fab (Figure 4B) indicated that the PEGylation of S-Fab may have slightly reduced the binding affinity of S-Fab to its antigen by 15.8%. For SKOV3 cells, both S-Fab and PEG-S-Fab could not bind the cells due to the lack of the CEA on the cell surface, suggesting that PEG-S-Fab retained specific antigen binding (Figure 4B).
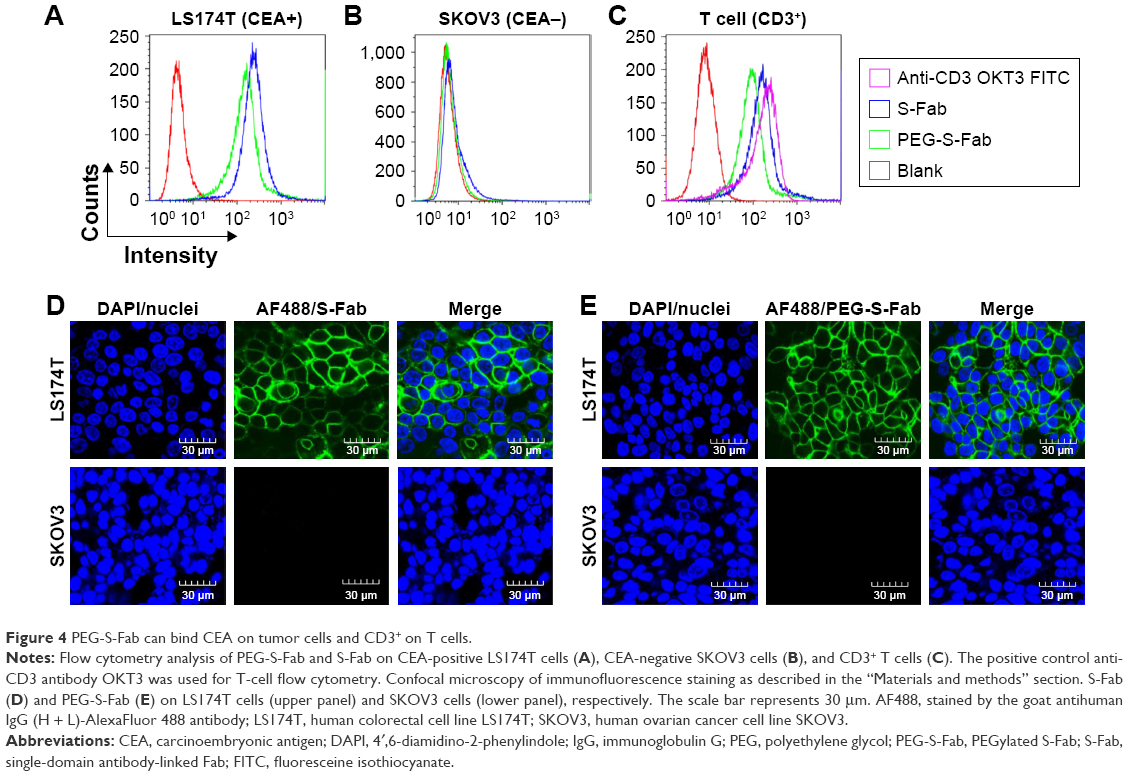 | Figure 4 PEG-S-Fab can bind CEA on tumor cells and CD3+ on T cells. |
Similarly, for CD3+ T cells, an obvious distinct fluorescence intensity shift of S-Fab and PEG-S-Fab was also demonstrated. PEGylation decreased the binding activity to the CD3+ antigen on T cells by 16.8% from the results of specific fluorescence intensity shifts of S-Fab (X-med 18.23) and PEG-S-Fab (X-med 15.17) (Figure 4C). The slightly reduced binding activities of PEG-S-Fab suggested that site-specific conjugations in the middle of S-Fab had minimal effects on its bispecific antibody binding affinity.
To further confirm the binding activity of PEG-S-Fab, immunofluorescence analysis was performed. Both S-Fab (upper panel in Figure 4D) and PEG-S-Fab (upper panel in Figure 4E) were able to bind CEA-positive LS174T cells. For CEA-positive SKOV3 cells, no binding was observed for S-Fab (lower panel in Figure 4D) or PEG-S-Fab (lower panel in Figure 4E), further supporting that PEGylation maintains the specific binding affinity of S-Fab to its antigen.
PEG-S-Fab has potent specific cytotoxicity against tumor cells
The cytotoxic activity of PEG-S-Fab was measured in vitro using LS174T and SKOV3 cells. Both S-Fab and PEG-S-Fab can kill CEA-positive LS174T cells effectively, even at 0.033 nM (Figure 5A), with no cytotoxicity against CEA-negative SKOV3 cells (Figure 5B). PEG-S-Fab had a slightly lower cytotoxicity than S-Fab (Figure 5A) possibly because of slightly decreased antigen binding or steric interference of PEGylation. However, the level of decreased activity appeared to be much lower than of many other PEGylated proteins.17,28
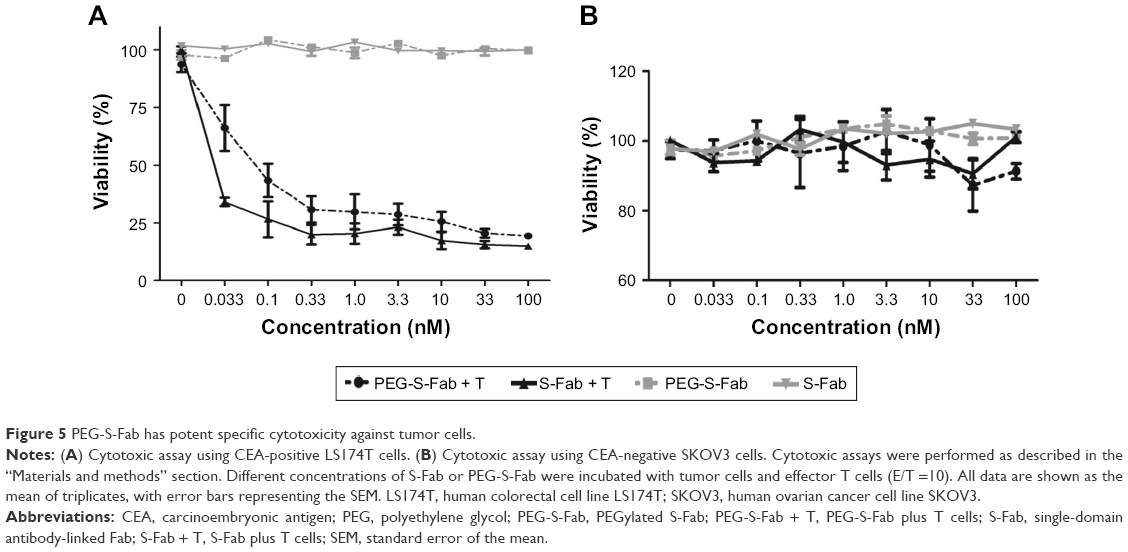 | Figure 5 PEG-S-Fab has potent specific cytotoxicity against tumor cells. |
PEGylation prolongs the in vivo half-life of S-Fab
To determine the circulating half-life of PEG-S-Fab, the intravenous PK profiles of S-Fab and PEG-S-Fab in the rat were analyzed. S-Fab and PEG-S-Fab were quantified using ELISA as described in the “Materials and methods” section. Quantification of a series of standards showed that the standard curve was y=0.0934x+0.0748 (0≤x≤25 μg/mL), with an R2 value of 0.9982 (Figure 6A). Based on the serum protein concentration up to 144 h, S-Fab had an in vivo half-life of ~3.0 h, similar to the reported half-life of other Fabs in vivo.36–38 PEGylation significantly extended the half-life of PEG-S-Fab to 36.0 h, a 12-fold increase over that of S-Fab (Figure 6B).
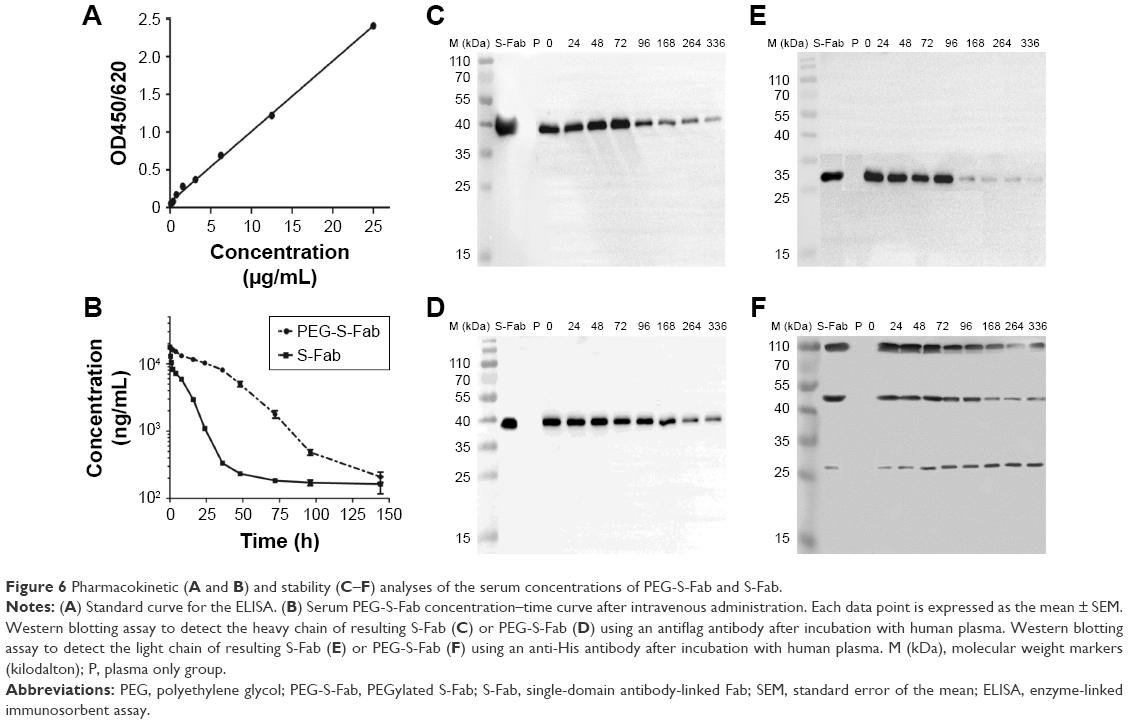 | Figure 6 Pharmacokinetic (A and B) and stability (C–F) analyses of the serum concentrations of PEG-S-Fab and S-Fab. |
The in vitro stability of PEG-S-Fab in human plasma was also assessed. When incubated with human plasma in vitro at 37°C, the level of S-Fab decreased sharply after 72 h for both the heavy chain (~40 kDa) of S-Fab (Figure 6C) and the light chain (~25 kDa) of S-Fab (Figure 6E) likely due to enzymatic digestion in plasma. For PEG-S-Fab, the decrease was much slower for the heavy chain (~40 kDa) (Figure 6D). For the light chain of PEG-S-Fab, which has PEGylation, the double PEGylated light chain (~107 kDa) and signal PEGylated light chain (~45 kDa) showed similar slower reduction as the heavy chain (Figure 6F). Interestingly, the non-PEGylated light chain (~25 kDa) increased slightly during the incubation, suggesting a slow reduction of PEGylation (de-PEGylation). Previous studies have shown that with an extended incubation time and decreased pH, de-PEGylation can occur in vitro.39,40 Different conjugation chemistry can be further explored to study the de-PEGylation.
PEG-S-Fab induces more potent in vivo antitumor activity
The increased in vivo half-life and comparable in vitro cytotoxicity of PEG-S-Fab compared to S-Fab prompted us to assess the in vivo antitumor activity of PEG-S-Fab in an adoptive xenograft model. When NOD–SCID mice were transplanted with LS174T cells and freshly isolated human PBMCs, rapid tumor growth was observed. Compared with the vehicle group, significant tumor growth inhibition (P<0.01) was observed when mice were treated with either S-Fab or PEG-S-Fab in the presence of human PBMCs (Figure 7). Tumor growth inhibition was more pronounced in the presence of PEG-S-Fab compared to S-Fab (P<0.01), indicating that PEGylation of the S-Fab protein enhanced the therapeutic efficacy of the S-Fab in the xenograft mouse model.
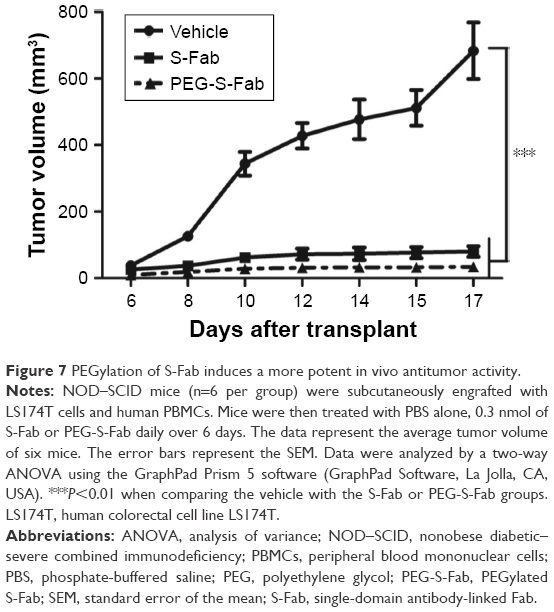 | Figure 7 PEGylation of S-Fab induces a more potent in vivo antitumor activity. |
Discussion
In this study, we demonstrated that the site-specific PEGylation can improve the therapeutic profiles of the bispecific antibody S-Fab. To our knowledge, this is the first report applying PEGylation to a bispecific antibody.
Bispecific antibodies have been actively studied as a powerful approach in cancer immunotherapy. Previously, we reported a bispecific S-Fab that was constructed by linking conventional anti-CD3 Fab to an anti-CEA single-domain VHH at the C-terminus of VH-CH1 using nanobody technology (Figure 1). S-Fab showed potent antitumor activities in vitro and in vivo.8 As a Fab format, S-Fab offers advantages over full-length antibodies, including better penetration into tumor tissues and simple production of the antibody using inexpensive prokaryotic expression systems.17 Meanwhile, S-Fab overcomes the disadvantages of single-chain Fv-based antibodies, such as instability, a tendency to aggregate, and difficulty to produce in bacteria.8 However, the short in vivo half-life of S-Fab limits its potential as a therapeutic agent. In this study, we reported that the PEGylation of S-Fab can extend the in vivo half-life of S-Fab and maintain its potent antitumor effect, making PEG-S-Fab a more feasible therapeutic reagent for further development.
In the case of antibody fragments, PEGylation has been shown to lengthen their circulating half-life, enhance their proteolytic resistance of therapeutic proteins, and reduce their immunogenicity.27,29,41 Various PEGylation strategies have been studied for different therapeutic proteins, such as nonspecific PEGylation, thiol and bridging PEGylation, enzymatic PEGylation, and noncovalent PEGylation,23,27 while several PEGylated proteins have been approved for clinical use.27 To effectively and specifically modify the target proteins, numerous functionalized PEG molecules have also been synthesized in recent years, including amine reactive (such as p-nitro-phenol carbonates, succinimidyl esters, and tresylates), thiol-reactive (such as maleimide, iodoacetamide, and vinyl sulfone), aldehyde-reactive, and alcohol-reactive PEG molecules.27 Additionally, the backbone structure (linear, branched, or star-shaped) and molecular weight of the PEG molecules used for PEGylation influence the effects of the reaction and PEGylated conjugates.27
In this study, the site-specific PEGylation was designed at the C-terminus of VL-CL by adding two cysteines with a short GGGG space linker. Based on the analysis of VH-CH1-VHH and the VL-CL chain before and after PEGylation (Figures 2 and 3), double PEGylation at the VL-CL terminus likely accounted for the majority of conjugation. No PEGylation of the heavy chain VH-CH1-VHH was observed, even though it has four cysteine residues. A small portion of mono-PEGylation was observed on VL-CL. Only slightly increased multiple conjugations were observed when the PEG:protein ratio rose >40 in the conjugation reaction. These data suggest that PEGylation can be controlled to be conjugated at the expected sites.
PEGylation has been previously reported to potentially decrease enzymatic proteins or the binding affinities of Fabs.23 In an attempt to minimize the impact of PEGylation of S-Fab on CD3 and CEA binding, the site-specific conjugation at the C-terminus of VL-CL is distant to both the CD3- and CEA-binding sites. Flow cytometry analysis showed that PEGylation had a slight effect on the binding of S-Fab to tumor cells and T cells (Figure 4) and slightly reduced the in vitro cytotoxicity (Figure 5). However, PEGylation increased the circulation t1/2 of S-Fab by 12-fold in vivo (Figure 6A and B). Previous studies have shown that the enhancement of the in vivo half was due to the hydrodynamic radius and enhanced molecular size of the PEGylated conjugate, leading to reduced renal clearance and increased resistance of the PEGylated conjugate to proteolysis.27,28,42,43 In addition, the enhanced permeability and retention (EPR) effect may be an important factor for the slow clearance and prolonged t1/2 of PEG-S-Fab in plasma. The EPR of the PEGylated conjugate can also cause entrapment by the tumor vasculature that is highly disorganized and hyperpermeable, which further prolongs the elimination half-life.44 The increased stability in plasma may also play a role in the longer in vivo half-life of PEG-S-Fab (Figure 6C and F). Those factors ultimately prolong the circulation half-life of S-Fab.29
In mouse models, PEG-S-Fab showed more potent antitumor activity than S-Fab (Figure 7), likely due to the increased half-life of PEG-S-Fab. PEG-S-Fab may also have enhanced the permeability and retention effects in tumors, which may contribute to the more potent in vivo antitumor activity of PEG-S-Fab because it is trapped in tumors. Such opposite effects of PEGylation on proteins in vitro and in vivo have also been shown for other proteins.18,28,45
Conclusion
Although the PEGylation of S-Fab slightly reduced the in vitro binding affinity of S-Fab to its antigen CEA or CD3, it extended the circulation t1/2 of S-Fab by 12-fold in vivo, which contributes to enhancing its in vivo antitumor efficacy. Therefore, this study supports the use of PEGylation to extend the circulating half-life of the bispecific antibody S-Fab and enhance its therapeutic potential in the clinic. This strategy can be potentially applied to a broad range of immunotherapies.
Acknowledgment
This project was financially supported by the Department of Science and Technology of Guangdong Province, People’s Republic of China (2016A050503028).
Disclosure
The authors report no conflicts of interest in this work.
References
Agadjanyan MG, Zagorski K, Petrushina I, et al. Humanized monoclonal antibody armanezumab specific to N-terminus of pathological tau: characterization and therapeutic potency. Mol Neurodegener. 2017;12(1):33. | ||
Nelson AL, Dhimolea E, Reichert JM. Development trends for human monoclonal antibody therapeutics. Nat Rev Drug Discov. 2010;9(10):767–774. | ||
Xu MM, Pu Y, Weichselbaum RR, Fu YX. Integrating conventional and antibody-based targeted anticancer treatment into immunotherapy. Oncogene. 2017;36(5):585–592. | ||
Lameris R, de Bruin RCG, Schneiders FL, et al. Bispecific antibody platforms for cancer immunotherapy. Crit Rev Oncol Hematol. 2014;92(3):153–165. | ||
Seckinger A, Delgado JA, Moser S, et al. Target expression, generation, preclinical activity, and pharmacokinetics of the BCMA-T cell bispecific antibody EM801 for multiple myeloma treatment. Cancer Cell. 2017;31(3):396–410. | ||
Moores SL, Chiu ML, Bushey BS, et al. A novel bispecific antibody targeting EGFR and cMet is effective against EGFR inhibitor-resistant lung tumors. Cancer Res. 2016;76(13):3942–3953. | ||
Osada T, Patel SP, Hammond SA, Osada K, Morse MA, Lyerly HK. CEA/CD3-bispecific T cell-engaging (BiTE) antibody-mediated T lymphocyte cytotoxicity maximized by inhibition of both PD1 and PD-L1. Cancer Immunol Immunother. 2015;64(6):677–688. | ||
Li L, He P, Zhou CH, et al. A novel bispecific antibody, S-Fab, induces potent cancer cell killing. J Immunother. 2015;38(9):350–356. | ||
Cheng M, Santich BH, Xu H, Ahmed M, Huse M, Cheung NK. Successful engineering of a highly potent single-chain variable-fragment (scFv) bispecific antibody to target disialoganglioside (GD2) positive tumors. Oncoimmunology. 2016;5(6):e1168557. | ||
Freedman JD, Hagel J, Scott EM, et al. Oncolytic adenovirus expressing bispecific antibody targets T-cell cytotoxicity in cancer biopsies. EMBO Mol Med. 2017;9(8):1067–1087. | ||
Li AF, Xing JY, Li L, et al. A single-domain antibody-linked Fab bispecific antibody Her2-S-Fab has potent cytotoxicity against Her2-expressing tumor cells. AMB Express. 2016;6(1):32. | ||
Wu XF, Sereno AJ, Huang F, et al. Fab-based bispecific antibody formats with robust biophysical properties and biological activity. MAbs. 2015;7(3):470–482. | ||
De Meyer T, Muyldermans S, Depicker A. Nanobody-based products as research and diagnostic tools. Trends Biotechnol. 2014;32(5):263–270. | ||
De Vos J, Devoogdt N, Lahoutte T, Muyldermans S. Camelid single-domain antibody-fragment engineering for (pre)clinical in vivo molecular imaging applications: adjusting the bullet to its target. Expert Opin Biol Ther. 2013;13(8):1149–1160. | ||
Rozan C, Cornillon A, Petiard C, et al. Single-domain antibody-based and linker-free bispecific antibodies targeting Fc gamma RIII induce potent antitumor activity without recruiting regulatory T cells. Mol Cancer Ther. 2013;12(8):1481–1491. | ||
Bannas P, Hambach J, Koch-Nolte F. Nanobodies and nanobody-based human heavy chain antibodies as antitumor therapeutics. Front Immunol. 2017;8:1603. | ||
Chan LDJ, Ascher DB, Yadav R, et al. Conjugation of 10 kDa linear PEG onto trastuzumab Fab’ is sufficient to significantly enhance lymphatic exposure while preserving in vitro biological activity. Mol Pharm. 2016;13(4):1229–1241. | ||
Freches D, Patil HP, Machado Franco M, Uyttenhove C, Heywood S, Vanbever R. PEGylation prolongs the pulmonary retention of an anti-IL-17A Fab’ antibody fragment after pulmonary delivery in three different species. Int J Pharm. 2017;521(1–2):120–129. | ||
Koussoroplis SJ, Paulissen G, Tyteca D, et al. PEGylation of antibody fragments greatly increases their local residence time following delivery to the respiratory tract. J Control Release. 2014;187:91–100. | ||
Akbarzadehlaleh P, Mirzaei M, Mashahdi-Keshtiban M, Shamsasenjan K, Heydari H. PEGylated human serum albumin: review of PEGylation, purification and characterization methods. Adv Pharm Bull. 2016;6(3):309–317. | ||
Duncan R. The dawning era of polymer therapeutics. Nat Rev Drug Discov. 2003;2(5):347–360. | ||
Duncan R. Polymer conjugates as anticancer nanomedicines. Nat Rev Cancer. 2006;6(9):688–701. | ||
Pfister D, Morbidelli M. Process for protein PEGylation. J Control Release. 2014;180:134–149. | ||
Abuchowski A, McCoy JR, Palczuk NC, van Es T, Davis FF. Effect of covalent attachment of polyethylene glycol on immunogenicity and circulating life of bovine liver catalase. J Biol Chem. 1977;252(11):3582–3586. | ||
Abuchowski A, van Es T, Palczuk NC, Davis FF. Alteration of immunological properties of bovine serum albumin by covalent attachment of polyethylene glycol. J Biol Chem. 1977;252(11):3578–3581. | ||
Davis FF. Commentary – the origin of pegnology. Adv Drug Deliv Rev. 2002;54(4):457–458. | ||
Chapman AP. PEGylated antibodies and antibody fragments for improved therapy: a review. Adv Drug Deliv Rev. 2002;54(4):531–545. | ||
Vine KL, Lobov S, Chandran VI, Harris NL, Ranson M. Improved pharmacokinetic and biodistribution properties of the selective urokinase inhibitor PAI-2 (SerpinB2) by site-specific PEGylation: implications for drug delivery. Pharm Res. 2015;32(3):1045–1054. | ||
Lawrence PB, Price JL. How PEGylation influences protein conformational stability. Curr Opin Chem Biol. 2016;34:88–94. | ||
Harris JM, Chess RB. Effect of pegylation on pharmaceuticals. Nat Rev Drug Discov. 2003;2(3):214–221. | ||
Behar G, Chames P, Teulon I, et al. Llama single-domain antibodies directed against nonconventional epitopes of tumor-associated carcinoembryonic antigen absent from nonspecific cross-reacting antigen. FEBS J. 2009;276(14):4305–4317. | ||
Zheng CY, Ma GH, Su ZG. Native PAGE eliminates the problem of PEG-SDS interaction in SDS-PAGE and provides an alternative to HPLC in 2 characterization of protein PEGylation. Electrophoresis. 2007;28(16):2801–2807. | ||
Xing JY, Lin LM, Li J, et al. BiHC, a T-cell-engaging bispecific recombinant antibody, has potent cytotoxic activity against Her2 tumor cells. Transl Oncol. 2017;10(5):780–785. | ||
Junttila TT, Li J, Johnston J, et al. Antitumor efficacy of a bispecific antibody that targets HER2 and activates T cells. Cancer Res. 2014;74(19):5561–5571. | ||
Zhu Z, Carter P. Identification of heavy chain residues in a humanized anti-CD3 antibody important for efficient antigen binding and T cell activation. J Immunol. 1995;155(4):1903–1910. | ||
Cignetto S, Modica C, Chiriaco C, et al. Dual constant domain-Fab: a novel strategy to improve half-life and potency of a met therapeutic antibody. Mol Oncol. 2016;10(6):938–948. | ||
Kang HJ, Kim HJ, Cha SH. Isolation of human anti-serum albumin Fab antibodies with an extended serum-half life. Immunol Lett. 2016;169:33–40. | ||
Read T, Olkhov RV, Williamson ED, Shaw AM. Label-free Fab and Fc affinity/avidity profiling of the antibody complex half-life for polyclonal and monoclonal efficacy screening. Anal Bioanal Chem. 2015;407(24):7349–7357. | ||
Kim HK, Van den Bossche J, Hyun SH, Thompson DH. Acid-triggered release via dePEGylation of fusogenic liposomes mediated by heterobifunctional phenyl-substituted vinyl ethers with tunable pH-sensitivity. Bioconjug Chem. 2012;23(10):2071–2077. | ||
Bruun J, Larsen TB, Jolck RI, et al. Investigation of enzyme-sensitive lipid nanoparticles for delivery of siRNA to blood-brain barrier and glioma cells. Int J Nanomedicine. 2015;10:5995–6008. | ||
Do BH, Kang HJ, Song JA, et al. Granulocyte colony-stimulating factor (GCSF) fused with Fc Domain produced from E. coli is less effective than polyethylene glycol-conjugated GCSF. Sci Rep. 2017;7:6480. | ||
Fishburn CS. The pharmacology of PEGylation: balancing PD with PK to generate novel therapeutics. J Pharm Sci. 2008;97(10):4167–4183. | ||
Reichard EE, Nanaware-Kharade N, Gonzalez GA 3rd, Thakkar S, Owens SM, Peterson EC. PEGylation of a high-affinity anti-(+)methamphetamine single chain antibody fragment extends functional half-life by reducing clearance. Pharm Res. 2016;33(12):2954–2966. | ||
Maeda H, Wu J, Sawa T, Matsumura Y, Hori K. Tumor vascular permeability and the EPR effect in macromolecular therapeutics: a review. J Control Release. 2000;65(1–2):271–284. | ||
Sekiya T, Yamagishi J, Gray JHV, et al. PEGylation of a TLR2-agonist-based vaccine delivery system improves antigen trafficking and the magnitude of ensuing antibody and CD8(+) T cell responses. Biomaterials. 2017;137:61–72. |
 © 2018 The Author(s). This work is published and licensed by Dove Medical Press Limited. The full terms of this license are available at https://www.dovepress.com/terms.php and incorporate the Creative Commons Attribution - Non Commercial (unported, v3.0) License.
By accessing the work you hereby accept the Terms. Non-commercial uses of the work are permitted without any further permission from Dove Medical Press Limited, provided the work is properly attributed. For permission for commercial use of this work, please see paragraphs 4.2 and 5 of our Terms.
© 2018 The Author(s). This work is published and licensed by Dove Medical Press Limited. The full terms of this license are available at https://www.dovepress.com/terms.php and incorporate the Creative Commons Attribution - Non Commercial (unported, v3.0) License.
By accessing the work you hereby accept the Terms. Non-commercial uses of the work are permitted without any further permission from Dove Medical Press Limited, provided the work is properly attributed. For permission for commercial use of this work, please see paragraphs 4.2 and 5 of our Terms.