")
Back to Journals » OncoTargets and Therapy » Volume 12
SIRT4 inhibits the proliferation, migration, and invasion abilities of thyroid cancer cells by inhibiting glutamine metabolism
Authors Chen Z, Lin J, Feng S, Chen X, Huang H, Wang C, Yu Y, He Y, Han S, Zheng L, Huang G
Received 2 October 2018
Accepted for publication 4 February 2019
Published 28 March 2019 Volume 2019:12 Pages 2397—2408
DOI https://doi.org/10.2147/OTT.S189536
Checked for plagiarism Yes
Review by Single anonymous peer review
Peer reviewer comments 2
Editor who approved publication: Dr Sanjeev K. Srivastava
Zhouxun Chen,1,* Jiahao Lin,2,* Shuyi Feng,2,* Xuxu Chen,2 Hanzhang Huang,3 Chen Wang,3 Yujun Yu,3 Yu He,3 Shaoliang Han,3 Linfeng Zheng,4 Guoyu Huang3
1Department of Colorectal and Anal Surgery, The First Affiliated Hospital, Wenzhou Medical University, Wenzhou, China; 2School of The First Clinical Medical Sciences, Wenzhou Medical University, Wenzhou, China; 3Department of Gastrointestinal Surgery, The First Affiliated Hospital, Wenzhou Medical University, Wenzhou, China; 4Department of Radiology, Shanghai General Hospital, Shanghai Jiao Tong University, Shanghai, China
*These authors contributed equally to this work
Background: SIRT4, a protein localized in the mitochondria, is one of the least characteristic members of the sirtuin family. It is known that SIRT4 has deacetylase activity and plays a role in energy metabolism, but little is known about its possible role in carcinogenesis. Recently, several studies have suggested that SIRT4 may function as either a tumor oncogene or a tumor suppressor gene. However, its relationship with thyroid cancer remains unclear.
Methods: We stably overexpressed SIRT4 or silenced its expression in the human thyroid cancer cell line BCPAP by means of lentiviral vectors. We conducted a variety of tests, such as CCK-8, wound healing, migration, and invasion assays, to investigate the role of SIRT4 in the proliferation, migration, and invasion abilities of thyroid cancer cells. We also investigated the effects of SIRT4 overexpression on cell cycle progression and apoptosis of BCPAP cells and studied the role of glutamine metabolism in the effects of SIRT4 on BCPAP cell migration and invasion. Finally, we analyzed SIRT4 expression levels in thyroid cancer specimens by immunohistochemistry and investigated their association with clinicopathological features.
Results: Overexpression of SIRT4 inhibited the proliferation, migration, and invasion abilities of BCPAP thyroid cancer cells, blocked the cell cycle in the G0/G1 phase, and induced apoptosis. Mechanistically, SIRT4 inhibited BCPAP migration and invasion by inhibiting glutamine metabolism. Moreover, we found that SIRT4 protein levels in thyroid cancer tissues were markedly lower than in their non-neoplastic tissue counterparts (P<0.001).
Conclusion: SIRT4 plays a pivotal role in the growth and metastasis of thyroid cancer cells and could be a potential therapeutic target in thyroid cancer.
Keywords: SIRT4, thyroid cancer, proliferation, migration, invasion, glutamine
Introduction
Thyroid cancer is the most common malignant tumor of the endocrine glands, and its incidence in the past few decades has increased rapidly worldwide.1–3 There are four types of thyroid cancers: papillary thyroid cancer, follicular thyroid cancer, medullary thyroid cancer, and anaplastic thyroid cancer. Papillary thyroid cancer accounts for 80% of all thyroid malignancies.4
Great progress has been made in recent years investigating the molecular pathological changes in thyroid cancer.4 Its etiology and pathogenesis are highly complex and involve many risk factors and a variety of genetic and epigenetic alterations. Some of the key genes and signaling pathways that have been found to play a role in the development of thyroid cancer include the BRAFV600E mutation, PIK3CA, CTNNB1, TP53, EGFR, NF-κB pathway, FOXO pathway, and the MAPK and PI3K-AKT signaling pathways.5
The SIRT family (SIRT1-7) includes a group of NAD+-dependent deacetylases and ADP-ribosyltransferases that play important roles in pressure resistance, genomic stability, energy metabolism, and aging.6 SIRT4 is an NAD+-dependent ADP-ribosyltransferase located in the mitochondria which catalyzes the transfer of ADP ribosyl moieties to glutamate dehydrogenase (GDH).7 SIRT4 has been found to regulate metabolic functions, such as insulin secretion and fatty acid oxidation.7–10 Recent studies also indicate that SIRT4 may exert a tumor suppressor function by regulating the metabolism of glutamine.10–14 However, other studies have shown that SIRT4 may function as an oncogene.15,16 Thus, the role played by SIRT4 in cancer is still unclear and no studies have investigated its effects in thyroid cancer cells.
In the current study, we investigated the effects of SIRT4 on thyroid cancer cell proliferation, migration, invasion, and apoptosis, and cell cycle distribution. We also investigated a potential mechanism that could explain some of the effects of SIRT4 on thyroid cancer cells. Finally, we analyzed SIRT4 protein levels in thyroid cancer specimens by immunohistochemistry and investigated the association between SIRT4 levels and clinicopathological features.
Materials and methods
This study was approved by the First Affiliated Hospital of Wenzhou Medical University (Wenzhou, China), and was conducted in accordance with the principles of the Declaration of Helsinki.
Patient and tissue samples
Eighty-nine individual thyroid cancer patient tissue samples were purchased between February 2009 and March 2012. The patients’ ages ranged from 14 to 91 years, with an average of 50 years. Various clinical and pathological parameters were recorded, including patient age, gender, tumor size, pathological grade, depth of tumor infiltration, lymph node status, and American Joint Committee on Cancer (AJCC, seventh Edition) staging information. The main clinicopathological parameters are shown in Table 1.
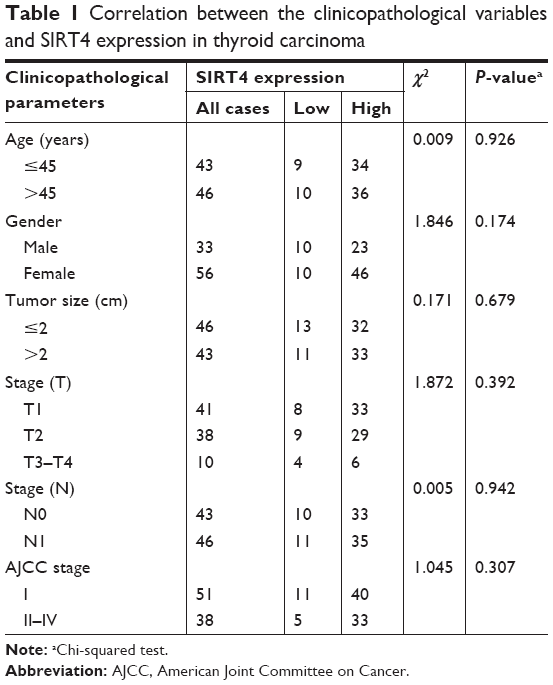 | Table 1 Correlation between the clinicopathological variables and SIRT4 expression in thyroid carcinoma |
Tissue array chips were obtained from Superchip Inc. (Shanghai, China). We analyzed a total of 89 patient samples containing every point of papillary thyroid carcinoma and the corresponding adjacent non-tumor tissue samples. The tissue microarray blocks had a diameter of 2.0 mm, and all points were covered with paraffin.
Immunohistochemistry
Tissue microarrays were first prepared by incubating the samples for 2 hours in an oven at 60°C and then incubating them in xylene for 2 minutes at room temperature. The tissue microarrays were then sequentially immersed and incubated for 5 minutes in decreasing (100%, 100%, 95%, 85%, and 70%) ethanol concentration solutions to rehydrate the samples. Antigen retrieval was carried out in citrate buffer (10 mM citrate and 0.05% Tween 20, pH 6.0), incubating in an autoclave for 5 minutes at 170 kPa and 120°C. The microarray chips were then incubated for 15 minutes at room temperature in 0.3% H2O2 in Tris–HCl buffer to inhibit endogenous peroxidase activity. Next, tissue microarrays were incubated overnight at 4°C with rabbit polyclonal anti-SIRT4 antibody (HPA029691, 1:400; Sigma, St Louis, MO, USA). The secondary antibody was applied using a GT Vision Kit (GeneTech Inc., Tokyo, Japan). The microarray chips were then stained with diaminobenzidine and counterstained with hematoxylin. Finally, the chips were dehydrated and sealed with a coverslip. Tissues treated only with the buffer solution (without antibody) were used as negative controls.
The SIRT4 immunostaining intensity was assessed under an optical microscope by two independent pathologists who were blinded to the sample information. A score based on the staining intensity multiplied by the stained area was assigned to each tissue point. The staining intensity was classified into four categories: 0= no staining, 1= weak staining, 2= medium staining, and 3= strong staining. The staining area was evaluated as follows: 0= <5% of cells stained positive, 1=5%–25% of cells stained positive, 2=26%–50% of cells stained positive, 3=51%–75% of cells stained positive, and 4= >75% of the cells stained positive. The final scores were classified into two categories: 0–5= low expression and 6–12= high expression. When the assessment of the staining pattern was inconsistent, both pathologists met and reached a consensus.
Cell lines and culture conditions
The human thyroid cancer cell line BCPAP was purchased from the Shanghai Institute of Cell Biology, Chinese Academy of Sciences. The cells were grown at 37°C under 5% CO2 in DMEM (Thermo Fisher Scientific, Waltham, MA, USA) supplemented with 10% FBS (Thermo Fisher Scientific) and penicillin/streptomycin (Thermo Fisher Scientific). Stable overexpression or silencing of SIRT4 was achieved by infecting with lentiviruses for 72 hours and then culturing with puromycin for 2 weeks.
Vector and virus production
The siRNA sequence targeting SIRT4 was 5′-TCCTATACAGCTACGGCTC-3′, and the negative control sequence was 5′-TGTCACTCTCCGGAACGTT-3′. Lentiviruses inducing overexpression or silencing (shSIRT4) of SIRT4 were purchased from a biotechnology company (Hanbio, Shanghai, China). The viral vector used was pHBLV-CMVIE-ZsGreen-T2A-Puro. The final titer of the lentivirus and the negative control virus was 2×10⁸ PFU/mL.
Reverse transcription (RT)-PCR
Total RNA was purified by using the TRIzol kit (Thermo Fisher Scientific), following the manufacturer’s protocol. A total of 500 ng of cDNA was synthesized using an RT kit (PrimeScript™ RT Master Mix; TaKaRa, Kusatsu, Japan). The cDNA was diluted three times in SYBR® Premix Ex Taq™ II (TaKaRa) and amplified by means of an RT-PCR reaction apparatus (DNA Engine Opticon2; BioRad). GAPDH was selected as the reference gene. The primer sequences for each gene were as follows: SIRT4 forward primer 5′-GCGAGAAACTTCGTAGGCTG-3′, reverse primer 5′-TCAGGACTTGGAAACGCTCT-3′; and GAPDH forward primer 5′-TCAAGAAGGTGGTGAAGCAGG-3′, reverse primer 5′-TCAAAGGTGGAGGAGTGGGT-3′. The PCR conditions were as follows: 2 minutes at 94°C; followed by 40 cycles of 30 seconds at 94°C, 30 seconds at 57°C, and 1 minute at 72°C; and ending with 5 minutes at 72°C and cooling at 4°C. After the reaction, the melting curve was analyzed to ensure uniformity of the PCR product. Gene expression was calculated by means of the 2−ΔΔCt method.
Western blot
Cells were lysed with RIPA lysis buffer (Beyotime, Haimen, China) supplemented with a protease inhibitor cocktail (Beyotime). Protein concentrations were determined by using a BCA protein assay kit (Beyotime). Cell lysates were separated by SDS-PAGE and transferred onto polyvinylidene fluoride membranes. The antibodies used in this assay were: rabbit polyclonal anti-human SIRT4 antibody (clone HPA029691; Sigma), rabbit monoclonal anti-human cyclin D antibody (60816-1-IG; Proteintech, Rosemont, IL, USA), rabbit monoclonal anti-human cyclin E antibody (Ab33911; Abcam, London, UK), rabbit polyclonal anti-human ERK antibody (9102; CST, Danvers, MA, USA), rabbit polyclonal anti-human p-ERK antibody (4370; CST), rabbit polyclonal anti-human caspase 3 (35/18 kD) antibody (9662; CST), rabbit polyclonal anti-human caspase 9 (46 kD) antibody (10380-1-AP; Proteintech), rabbit polyclonal anti-human p65 (65 kD) antibody (10745-1-AP; Proteintech), rabbit polyclonal anti-human MMP9 (78 kD) antibody (10375-2-AP; Proteintech), rabbit monoclonal anti-human n-cadherin (99 kD) antibody (14472; CST), rabbit monoclonal anti-human e-cadherin (135 kD) antibody (Ab124397; Abcam, Cambridge, UK), goat anti-rabbit detection antibody (ab97200; Abcam), and rabbit polyclonal anti-human GAPDH antibody (AB-P-R 001; Hangzhou Goodhere Biotechnology Co., Ltd., Hangzhou, China).
GDH/GLDH ELISA
Enzyme concentrations were determined using the human glutamate dehydrogenase (GLDH) test kit from Jiancheng Bioengineering Institute (catalog # A123; Jiancheng Bioengineering Institute, Nanjing, China), according to the manufacturer’s instructions.
Cell proliferation assay
Cells were seeded at 1,000/well in a 96-well plate, and 10 mL of CCK-8 (Dojindo, Kumamoto, Japan) solution was added to each well. The absorbance at 450 nm was determined after incubating for 2 hours in a CO2 incubator. In the experiments involving bis-2-(5-phenylacetoamido-1,2,4-thiadiazol-2-yl)ethyl sulfide (BPTES) (SML0601; Sigma), this compound was added to the control group at a final concentration of 10 μmol/L after seeding the cells.
Wound healing assay
BCPAP cells in which SIRT4 was overexpressed or silenced, and the corresponding negative control, were seeded at 5×10⁵ per well in a six-well plate and cultured overnight. When the cell density reached approximately 90%, a straight scratch was created with a 200 mL pipette tip held perpendicular to the bottom of the six-well plate. The cells were then washed three times with PBS and cultured in serum-free medium. In the experiment involving dimethyl α-ketoglutarate (DM-KG; 349631; Sigma), this compound was added to the control group after scratching at a final concentration of 8 mM. Distances covered by migrating cells were quantified.
Cell migration and invasion assays
Migration and invasion assays were performed as described previously.17 Briefly, for the migration assay, the transfected cells (6×10⁴ cells) were suspended in 0.2 mL of serum-free medium and seeded in the upper chambers of 24-well transwell plates (Corning Inc., Corning, NY, USA). The lower chambers were filled with 0.6 mL of growth medium containing 10% FBS. Cells were cultured at 37°C and allowed to migrate for 18 hours. After migration, cells in the top chambers were detached with a cotton swab, and the cells in the bottom chambers were fixed with 4% paraformaldehyde and stained with 0.1% crystal violet (Sigma). The stained cells were counted with a microscope (Olympus). For the invasion assay, a similar protocol was followed, except that the top chambers of the transwell plates were precoated with Matrigel (BD Biosciences). In the experiment involving DM-KG (349631; Sigma), this compound was added at a final concentration of 8 mM/L to the control group after seeding the cells.
Flow cytometry to analyze apoptosis and cell cycle
After trypsinization, cells were harvested, centrifuged, and resuspended in PBS containing 3% FBS. Cellular apoptosis was measured by flow cytometry (C6; BD, Franklin Lakes, NJ, USA), after annexin V-Allophycocyanin (APC) and 7-Aminoactinomycin D (7-AAD) (BD) staining. Only the early apoptotic rate was calculated. The survival rate was calculated based on cells unstained by annexin V-APC and 7-AAD. Mortality was calculated as 100%- surviving cells. Flow cytometry data were analyzed by means of the Accuri C6 software (BD). The cell cycle was analyzed by means of the Propidium Iodide (PI)/Nase kit (BD), according to the manufacturer’s instructions. The cell cycle results were analyzed using the ModFit software (Verity Software House, Topsham, ME, USA).
Statistical analysis
Statistical analysis was performed using SPSS software, version 20.0 (IBM, Armonk, NY, USA). The paired Student’s t-test was used to compare the final scores of the tumor and non-tumor tissues. Chi-squared analysis was used to assess the relationship between SIRT4 expression and clinicopathological parameters. Unless specified otherwise, all other experiments were analyzed by means of the unpaired t-test. P<0.05 (two-tailed) was considered statistically significant.
Results
Effects of SIRT4 on the proliferation, migration, and invasion abilities of a thyroid cancer cell line
We generated strains of thyroid papillary carcinoma BCPCP cells in which SIRT4 was stably overexpressed or downregulated by means of specific lentiviruses and verified SIRT4 expression levels by RT-PCR (Figure 1A) and Western blot (Figure 1B). The cell proliferation assay showed that SIRT4 overexpression significantly inhibited the proliferation of BCPAP cells (Figure 1C). On the contrary, when SIRT4 expression was downregulated, the proliferation of BCPAP cells was significantly higher with respect to negative control and untransfected cells (Figure 1D). The wound healing assay showed that the healing rate slowed down after overexpression of SIRT4 (Figure 1E) but that it accelerated following interference with SIRT4 expression (Figure 1F). In addition, we found that the migration and invasion abilities of BCPAP cells decreased significantly after overexpression of SIRT4 (Figure 1G and I) but increased after downregulating SIRT4 expression (Figure 1H and J). Collectively, these results suggest that SIRT4 plays a crucial role in the proliferation, migration, and invasion abilities of thyroid cancer cells.
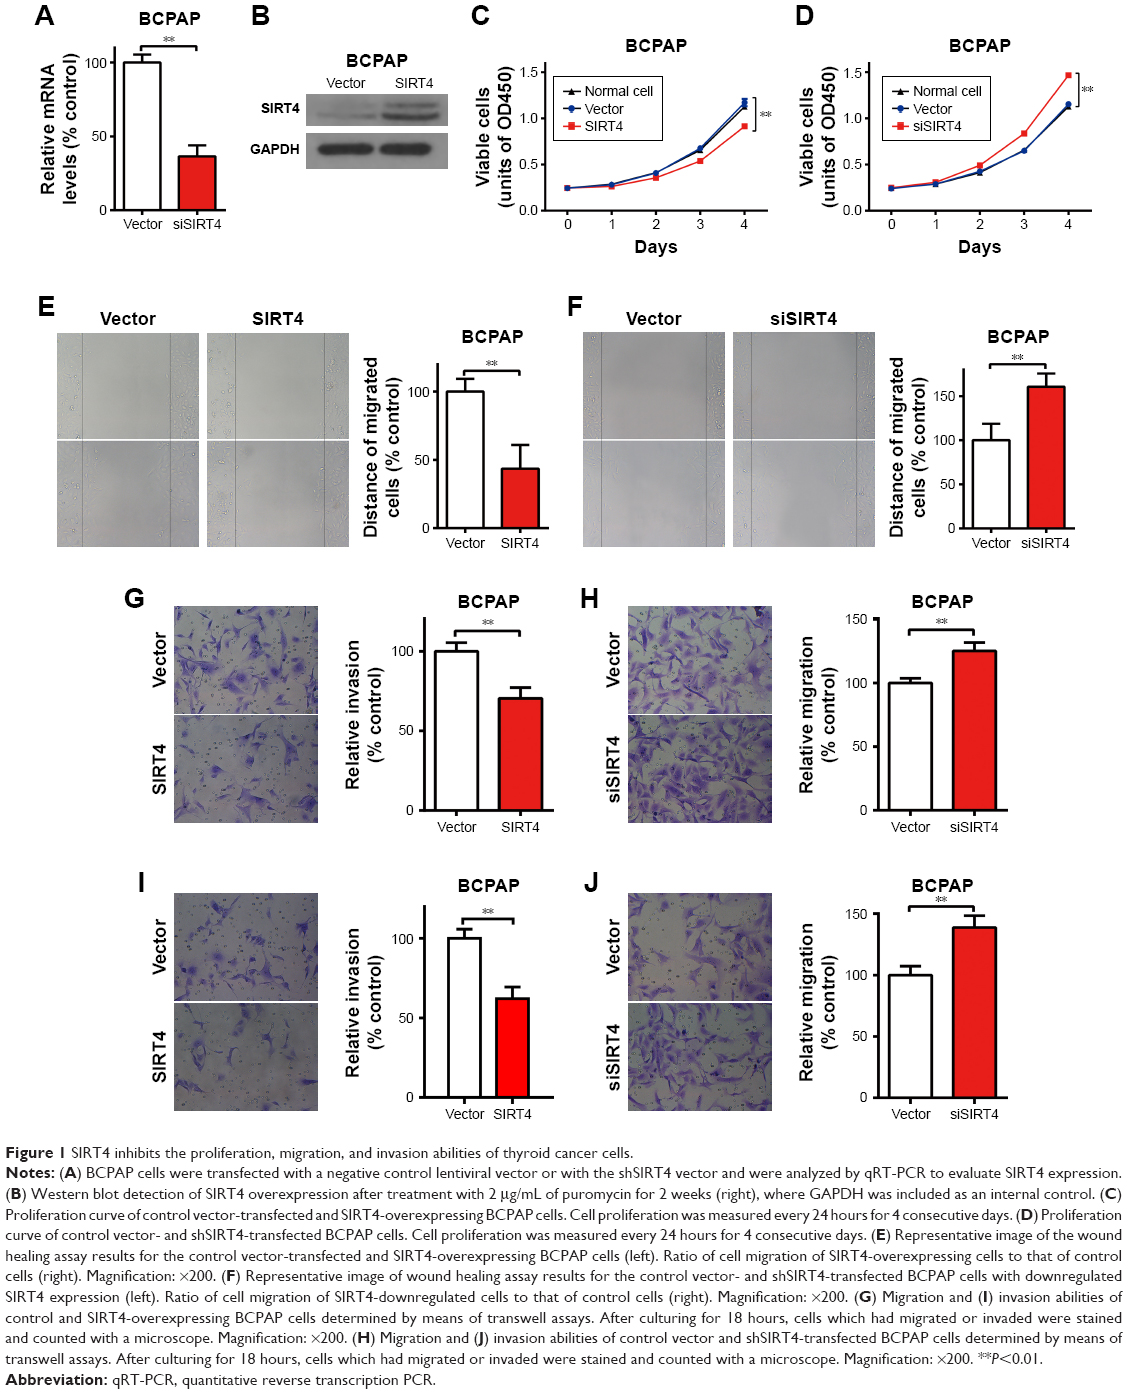 | Figure 1 SIRT4 inhibits the proliferation, migration, and invasion abilities of thyroid cancer cells. |
Overexpression of SIRT4 induces cell cycle arrest in the G0/G1 phase
To characterize the influence of SIRT4 on the BCPAP cell cycle, we stained the DNA with propidium iodide and analyzed the results with flow cytometry. Overexpression of SIRT4 significantly increased the proportion of cells in the G0/G1 phase and reduced the proportion of cells in the S phase, when compared with the negative control (Figure 2A), suggesting that overexpression of SIRT4 induced G0/G1 phase arrest. Next, the expression of G1 phase regulatory proteins was analyzed by Western blot. We found that SIRT4 overexpression decreased the expression of cyclin D1 and cyclin E1 (Figure 2B). It also decreased the expression of p-ERK, and thus inactivated ERK, which is consistent with the G0/G1 phase arrest. These results suggest that the G0/G1 phase arrest is linked to the suppression of cell proliferation observed when SIRT4 is overexpressed.
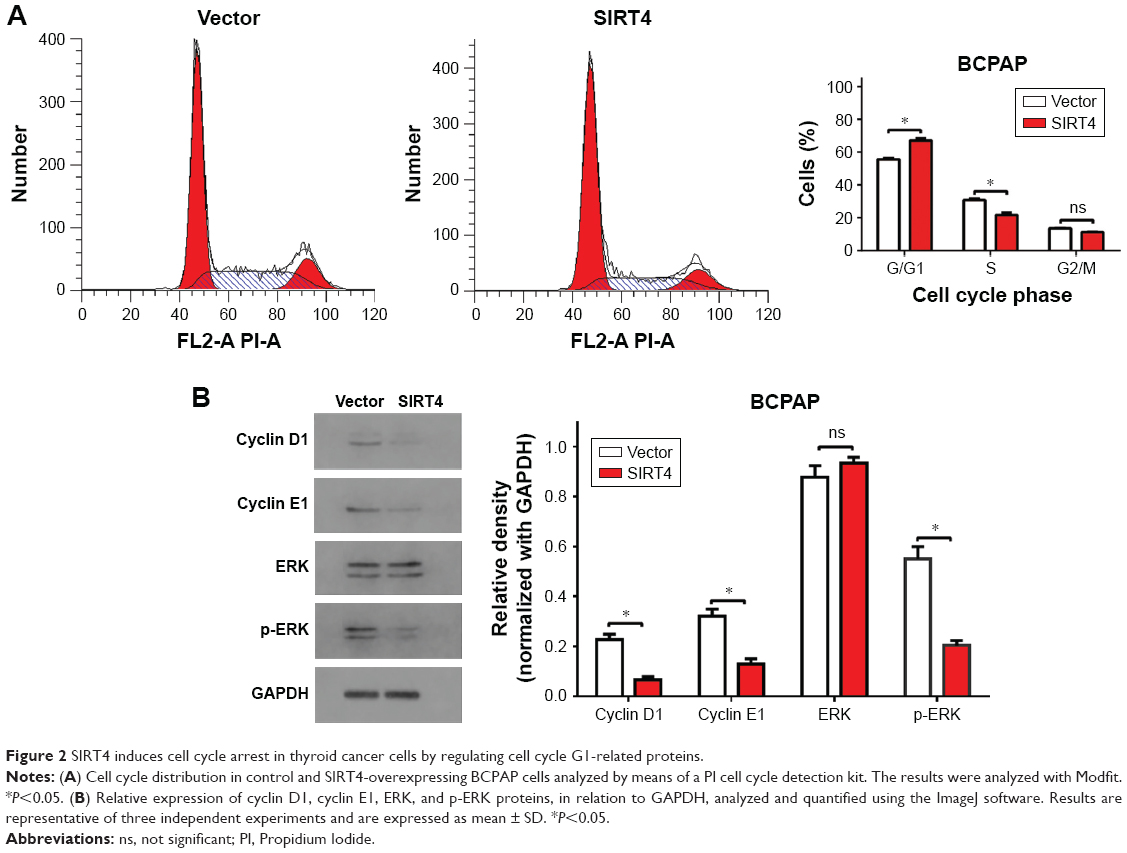 | Figure 2 SIRT4 induces cell cycle arrest in thyroid cancer cells by regulating cell cycle G1-related proteins. |
Overexpression of SIRT4 induces apoptosis
Next, we investigated whether SIRT4 overexpression induced apoptosis of thyroid cancer cells. We found that overexpression of SIRT4 significantly increased the number of BCPAP apoptotic cells when compared with the negative control group (Figure 3A). To investigate the underlying molecular mechanism of SIRT4-induced apoptosis of BCPAP cells, we analyzed the expression of apoptosis regulatory proteins by Western blot when SIRT4 was overexpressed. Our results showed that SIRT4 overexpression led to increased expression of caspase 3 18 kD and caspase 9, and decreased expression of p65 (Figure 3B). These results agree with our previous flow cytometry results and suggest that SIRT4 promotes cell apoptosis by regulating apoptosis-related proteins.
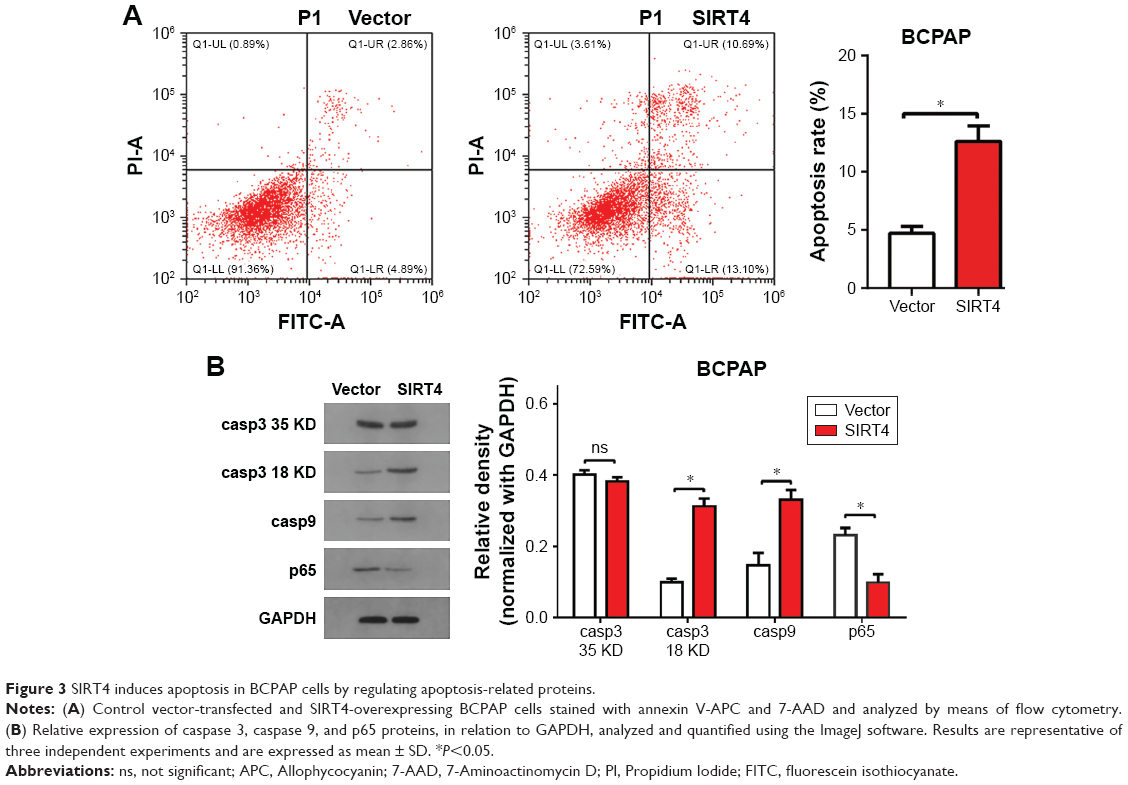 | Figure 3 SIRT4 induces apoptosis in BCPAP cells by regulating apoptosis-related proteins. |
SIRT4 regulates the proliferation, migration, and invasion abilities of thyroid cancer cells by inhibiting glutamine metabolism
To explore the potential mechanisms underlying SIRT4-induced inhibition of migration and invasion, the expression of epithelial–mesenchymal transition-related proteins was analyzed by Western blot. We found that SIRT4 overexpression resulted in increased expression of E-cadherin but decreased expression of N-cadherin and matrix metalloproteinase (Figure 4A). These results suggest that SIRT4 plays an important role in thyroid cancer cell migration and invasion.
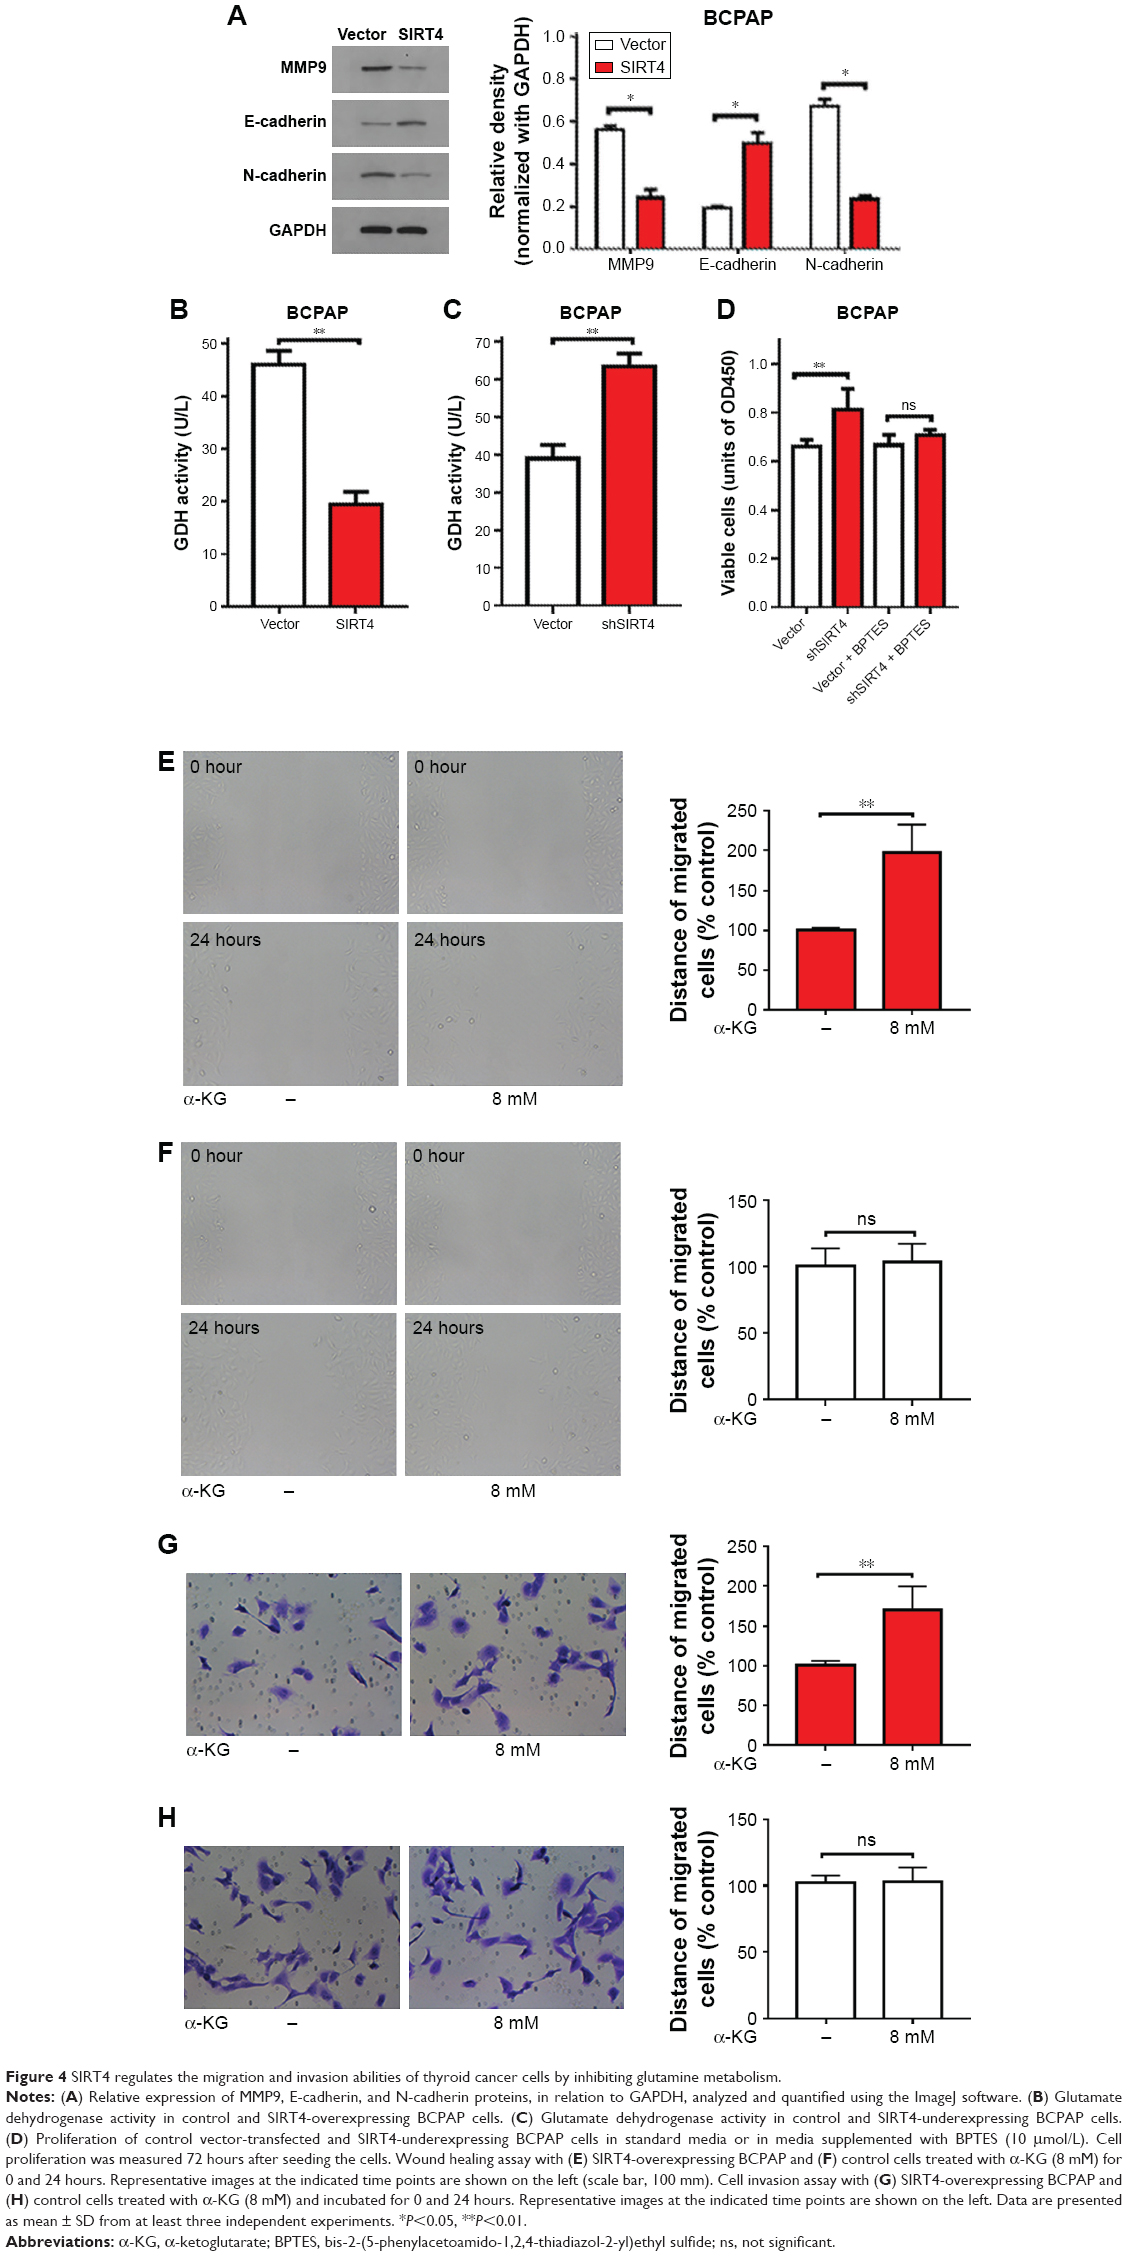 | Figure 4 SIRT4 regulates the migration and invasion abilities of thyroid cancer cells by inhibiting glutamine metabolism. |
Some studies have reported that SIRT4 inhibits the activity of GDH enzymes, limiting the metabolism of glutamate and glutamine, and thus reducing ATP production.7 We measured the activity of GDH in BCPAP cells and found that it was significantly suppressed when SIRT4 was overexpressed (Figure 4B), but that it increased following downregulation of SIRT4 expression (Figure 4C). Glutamine is converted to glutamic acid by glutaminase and then to α-ketoglutarate (α-KG) by GDH or by a transaminase coupling reaction.18 α-KG is an important product of glutamine metabolism. Therefore, we wondered whether SIRT4 inhibited the migration and invasion of thyroid cancer cells by interfering with glutamine metabolism. We found that treatment with BPTES, an inhibitor of GLS1, abrogated the increased proliferation seen after downregulation of SIRT4 expression (Figure 4D). We also found that when cell-permeable DM-KG was added to the medium in which BCPAP cells were being cultured, the wound healing rate increased significantly when SIRT4 was overexpressed (Figure 4E), but not when it was added to negative control cells expressing baseline levels of SIRT4 (Figure 4F), implying that the inhibitory effect of SIRT4 on wound healing depended on repressed production of DM-KG. Similarly, the invasion rate of BCPAP cells overexpressing SIRT4 increased significantly when DM-KG was added (Figure 4G), but in the case of negative control cells it did not change significantly (Figure 4H). These results suggest that SIRT4 inhibits the migration and invasion of BCPAP cells by inhibiting glutamine metabolism.
SIRT4 protein expression levels are significantly reduced in thyroid carcinoma
Immunohistochemical staining of human thyroid cancer and adjacent non-tumor tissues showed that SIRT4 was mainly expressed in the cytoplasm. Importantly, SIRT4 staining intensity was lower in tissues from thyroid carcinoma patients (Figure 5A) than in adjacent non-neoplastic thyroid tissue (Figure 5B). This difference was statistically significant (Figure 5C).
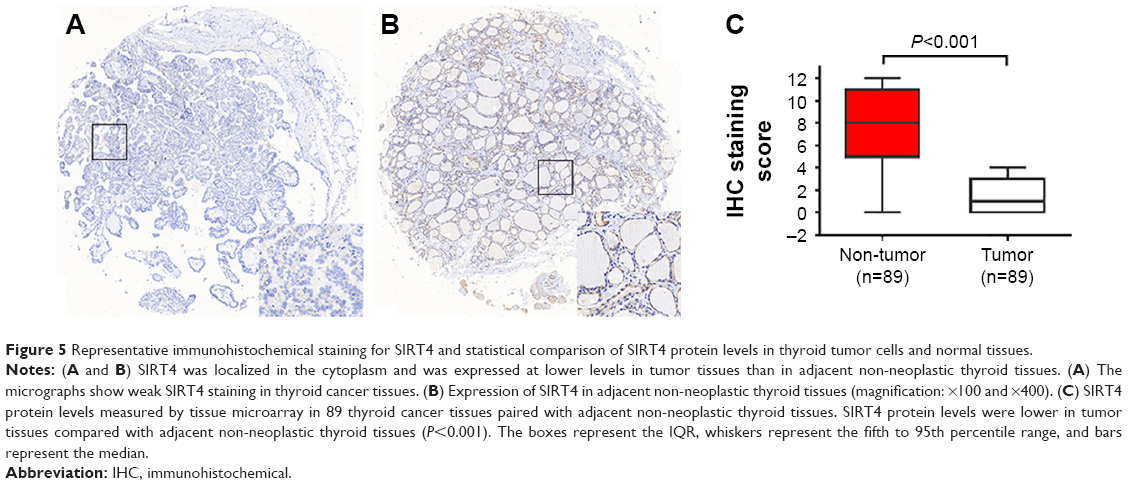 | Figure 5 Representative immunohistochemical staining for SIRT4 and statistical comparison of SIRT4 protein levels in thyroid tumor cells and normal tissues. |
Association between SIRT4 expression and clinicopathological characteristics
To elucidate the clinical significance of SIRT4 expression in thyroid cancer patients, we analyzed the relationship between SIRT4 expression and clinicopathological parameters. We found that SIRT4 levels were not associated with age, tumor size, tumor invasion depth (T), lymph node positive number (N), distant metastasis (M), or AJCC stage (P>0.05). The relationship between SIRT4 expression and clinicopathological characteristics of human thyroid cancer is summarized in Table 1.
Discussion
According to previous studies, different SIRT family members play different roles in different tumors, depending on the specific tissue and tumor type.19 For example, SIRT1 is highly expressed in gastric cancer,20 colon cancer,21 prostate cancer,22 and skin cancer,23 as well as in other tumors, suggesting that it promotes the formation of tumors in these tissues. However, other studies have found that SIRT1 expression is reduced in breast cancer,24 and its expression in the mouse APC model blocked the formation of intestinal tumors.25 These results are similar to those seen in the case of SIRT2, which was downregulated in breast cancer,26 glioma,27 and skin cancer,28 but upregulated in acute myeloid leukemia29 and prostate cancer.30 Thus, one cannot easily extrapolate the observations made in one tumor type to another.
Although there are only a few studies investigating the functional activity and importance of SIRT4 in tumors, they all agree that it functions to inhibit cancer. For example, Jeong et al10 found that SIRT4 inhibited tumor formation by inhibiting glutamine metabolism. Overexpression of SIRT4 inhibits the growth of HeLa cells,10 and SIRT4 knockout in mouse embryonic fibroblasts (MEF) cells blocks their ability to form large tumors in nude mice.10 SIRT4-knockout mice spontaneously develop lung, liver, breast, and lymphoma tumors. Csibi et al11 also found that overexpression of SIRT4 blocked the growth of the human colon cancer cell line DLD-1 and the human prostate cancer cell line DU145. Jeong et al31 found that SIRT4 inhibited the growth of Myc-induced B cell lymphoma. We and others have found that SIRT4 expression in colon and esophageal cancer is associated with a reduction in the number of adverse outcomes associated with these tumors.13,32 In the present study, we overexpressed and interfered with SIRT4 gene expression in BCPAP thyroid cancer cells and found that SIRT4 inhibited the proliferation, migration, and invasion abilities of these cells. In addition, SIRT4 protein levels in thyroid carcinoma tissues were found to be significantly lower than in adjacent non-neoplastic thyroid tissues. To our knowledge, this study is the first to investigate the activity of SIRT4 in thyroid cancer cells and to analyze the relationship between SIRT4 expression levels and clinicopathological parameters in human thyroid cancer specimens, especially at the protein level.
To understand the mechanism through which SIRT4 inhibited the proliferation of thyroid cancer cells, we studied the cell cycle distribution in BCPAP cells overexpressing SIRT4 and found that SIRT4 blocked the cell cycle in the G0/G1 phase. Studies have shown that increased expression of cyclin D1 in cancer cells promotes the transition from the G0/G1 phase to the S phase by phosphorylating the retinoblastoma tumor suppressor gene, leading to uncontrolled cell growth.33 ERK has been reported to control the G1 cell cycle phase by regulating cyclin D1,34 and cyclin E1 was also found to play a critical role regulating the G1- to S-phase transition.35,36 Our results demonstrated that SIRT4 overexpression resulted in decreased expression of cyclin D1, cyclin E1, and p-ERK, which may explain the observed G0/G1 arrest.
Defective apoptosis is considered one of the main causes of cancer. The caspase family of proteases lies at the core of the cell death signaling network. Caspase 3 is the mammalian homolog of the Caenorhabditis elegans cell death gene ced-3 and is a member of the caspase family of executioners, which play an important role in many apoptosis-related events, while caspase 9 is located upstream of caspase 3.37,38 The transcription factor NF-κB is composed of five component subunits that form a variety of homo- or heterodimers, including p65 and NF-κB1 (p105/p50). It has antiapoptotic effects,39 and the p65 subunit is responsible for most of the functions of NF-κB.40 We observed that overexpression of SIRT4 increased caspase 3 18 kD and caspase 9, but decreased p65 levels. Our results suggest that SIRT4 induces apoptosis to inhibit the proliferation of BCPAP cells.
An alteration of energy metabolism is another characteristic feature of tumor cells.41 Research on SIRT4 has shown that it can interfere with tumor cell metabolism, especially by inhibiting glutamine metabolism,10,11,42 and thus plays the role of a tumor suppressor gene. SIRT4 is thought to be the gatekeeper of cell energy metabolism.42 Tumor cells and normal cells have distinct metabolic patterns, with tumor cells often showing enhanced glucose and glutamine metabolism to provide the energy needed for tumor cell growth.43,44
Currently, agents that block the metabolic pathways of tumor cells are being developed as novel anticancer compounds.45,46 For example, agents that inhibit glucose metabolic pathways have been used in cancer therapy.45–47 However, tumor cells can survive under conditions of suppressed glucose metabolism by activating additional metabolic pathways, including glutamine metabolism. Therefore, mitochondrial glutamine metabolism can compensate for glucose deficiency and complement the mitochondrial tricarboxylic acid cycle.26,29 In addition, recent studies have found that KRas-driven cancer cells enter the S phase and stagnate due to insufficient nucleotide biosynthesis in a glutamine-deprived environment.48 Cells arrested in the S phase are susceptible to the cytotoxic drugs capecitabine, paclitaxel, and rapamycin.49–51 Glutamine deprivation leads to “synthetic fatality” in KRas-driven cancer cells treated with capecitabine, paclitaxel, and rapamycin. Therefore, blocking glutamine metabolism, simultaneously blocking glucose and glutamine metabolism, or combining these strategies with synergistic chemotherapeutic drugs has great potential in cancer therapy.52 In this study, we found that SIRT4 downregulated the expression of migration- and invasion-associated proteins and inhibited the proliferation, migration, and invasion abilities of BCPAP cells, and this effect was dependent on the inhibition of glutamine metabolism. The higher the degree of malignancy, the faster the rate of proliferation and the higher the demand for energy. Our results show that SIRT4 can inhibit glutamine metabolism, in line with its properties as a tumor suppressor gene. Thus, these results highlight the therapeutic potential of targeting SIRT4 in thyroid cancer, particularly when combined with an inhibitor of glucose metabolism.
Conclusion
To our knowledge, this is the first study to investigate SIRT4 activity in the context of thyroid cancer tissue and cells. Our results suggest that SIRT4 may participate in the development of thyroid cancer.
Acknowledgments
This research was financially supported by the Zhejiang Natural Science Foundation (No. LY18H160055) and the National Natural Science Foundation of China (No. 81271384). Linfeng Zheng would also like to express his gratitude to the State Scholarship Fund from the China Scholarship Council and to the Shanghai Jiao Tong University Medical Engineering Crossover Fund Project (No. YG2016MS26).
Disclosure
The authors report no conflicts of interest in this work.
References
Sprague BL, Warren Andersen S, Trentham-Dietz A. Thyroid cancer incidence and socioeconomic indicators of health care access. Cancer Causes Control. 2008;19(6):585–593. | ||
Leenhardt L, Grosclaude P, Chérié-Challine L, Thyroid Cancer Committee. Increased incidence of thyroid carcinoma in France: a true epidemic or thyroid nodule management effects? report from the French thyroid cancer Committee. Thyroid. 2004;14(12):1056–1060. | ||
Hundahl SA, Fleming ID, Fremgen AM, Menck HR. A National Cancer Data Base report on 53,856 cases of thyroid carcinoma treated in the U.S., 1985–1995 [see comments]. Cancer. 1998;83(12):2638–2648. | ||
Schneider DF, Chen H. New developments in the diagnosis and treatment of thyroid cancer. CA Cancer J Clin. 2013;63(6):373–394. | ||
Xing M. Molecular pathogenesis and mechanisms of thyroid cancer. Nat Rev Cancer. 2013;13(3):184–199. | ||
Finkel T, Deng CX, Mostoslavsky R. Recent progress in the biology and physiology of sirtuins. Nature. 2009;460(7255):587–591. | ||
Haigis MC, Mostoslavsky R, Haigis KM, et al. SIRT4 inhibits glutamate dehydrogenase and opposes the effects of calorie restriction in pancreatic beta cells. Cell. 2006;126(5):941–954. | ||
Nasrin N, Wu X, Fortier E, et al. SIRT4 regulates fatty acid oxidation and mitochondrial gene expression in liver and muscle cells. J Biol Chem. 2010;285(42):31995–32002. | ||
Ahuja N, Schwer B, Carobbio S, et al. Regulation of insulin secretion by SIRT4, a mitochondrial ADP-ribosyltransferase. J Biol Chem. 2007;282(46):33583–33592. | ||
Jeong SM, Xiao C, Finley LWS, et al. SIRT4 has tumor-suppressive activity and regulates the cellular metabolic response to DNA damage by inhibiting mitochondrial glutamine metabolism. Cancer Cell. 2013;23(4):450–463. | ||
Csibi A, Fendt SM, Li C, et al. The mTORC1 pathway stimulates glutamine metabolism and cell proliferation by repressing SIRT4. Cell. 2013;153(4):840–854. | ||
Huang G, Cui F, Yu F, et al. Sirtuin-4 (SIRT4) is downregulated and associated with some clinicopathological features in gastric adenocarcinoma. Biomed Pharmacother. 2015;72(0):135–139. | ||
Miyo M, Yamamoto H, Konno M, et al. Tumour-suppressive function of SIRT4 in human colorectal cancer. Br J Cancer. 2015;113(3):492–499. | ||
Huang G, Cheng J, Yu F, et al. Clinical and therapeutic significance of Sirtuin-4 expression in colorectal cancer. Oncol Rep. 2016;35(5):2801–2810. | ||
Jeong SM, Hwang S, Seong RH. SIRT4 regulates cancer cell survival and growth after stress. Biochem Biophys Res Commun. 2016;470(2):251–256. | ||
Lai X, Yu Z, Chen X, Huang G. SIRT4 is upregulated in Chinese patients with esophageal cancer. Int J Clin Exp Pathol. 2016;9(10):10543–10549. | ||
Zhang J, Xu K, Shi L, et al. Overexpression of MicroRNA-216a suppresses proliferation, migration, and invasion of glioma cells by targeting leucine-rich repeat-containing G protein-coupled receptor 5. Oncol Res. 2017;25(8):1317–1327. | ||
Deberardinis RJ, Lum JJ, Hatzivassiliou G, Thompson CB. The biology of cancer: metabolic reprogramming fuels cell growth and proliferation. Cell Metab. 2008;7(1):11–20. | ||
Roth M, Chen WY. Sorting out functions of sirtuins in cancer. Oncogene. 2014;33(13):1609–1620. | ||
Cha EJ, Noh SJ, Kwon KS, et al. Expression of DBC1 and SIRT1 is associated with poor prognosis of gastric carcinoma. Clin Cancer Res. 2009;15(13):4453–4459. | ||
Stünkel W, Peh BK, Tan YC, et al. Function of the SIRT1 protein deacetylase in cancer. Biotechnol J. 2007;2(11):1360–1368. | ||
Huffman DM, Grizzle WE, Bamman MM, et al. SIRT1 is significantly elevated in mouse and human prostate cancer. Cancer Res. 2007;67(14):6612–6618. | ||
Hida Y, Kubo Y, Murao K, Arase S. Strong expression of a longevity-related protein, SIRT1, in Bowen’s disease. Arch Dermatol Res. 2007;299(2):103–106. | ||
Wang RH, Sengupta K, Li C, et al. Impaired DNA damage response, genome instability, and tumorigenesis in SIRT1 mutant mice. Cancer Cell. 2008;14(4):312–323. | ||
Firestein R, Blander G, Michan S, et al. The SIRT1 deacetylase suppresses intestinal tumorigenesis and colon cancer growth. PLoS One. 2008;3(4):e2020. | ||
Kim HS, Vassilopoulos A, Wang RH, et al. SIRT2 maintains genome integrity and suppresses tumorigenesis through regulating APC/C activity. Cancer Cell. 2011;20(4):487–499. | ||
Hiratsuka M, Inoue T, Toda T, et al. Proteomics-based identification of differentially expressed genes in human gliomas: down-regulation of SIRT2 gene. Biochem Biophys Res Commun. 2003;309(3):558–566. | ||
Ming M, Qiang L, Zhao B, He YY. Mammalian SIRT2 inhibits keratin 19 expression and is a tumor suppressor in skin. Exp Dermatol. 2014;23(3):207–209. | ||
Dan L, Klimenkova O, Klimiankou M, et al. The role of Sirtuin 2 activation by nicotinamide phosphoribosyltransferase in the aberrant proliferation and survival of myeloid leukemia cells. Haematologica. 2012;97(4):551–559. | ||
Hou H, Chen W, Zhao L, et al. Cortactin is associated with tumour progression and poor prognosis in prostate cancer and SIRT2 other than HADC6 may work as facilitator in situ. J Clin Pathol. 2012;65(12):1088–1096. | ||
Jeong SM, Lee A, Lee J, Haigis MC. SIRT4 suppresses tumor formation in genetic models of Myc-induced B cell lymphoma. J Biol Chem. 2014;289(7):4135–4144. | ||
Huang G, Cheng J, Yu F, et al. Clinical and therapeutic significance of Sirtuin-4 expression in colorectal cancer. Oncol Rep. 2016;35(5):2801–2810. | ||
Hall M, Peters G. Genetic alterations of cyclins, cyclin-dependent kinases, and CDK inhibitors in human cancer. Adv Cancer Res. 1996;68:67–108. | ||
Chambard JC, Lefloch R, Pouysségur J, Lenormand P. ERK implication in cell cycle regulation. Biochim Biophys Acta. 2007;1773(8):1299–1310. | ||
Ohtsubo M, Theodoras AM, Schumacher J, Roberts JM, Pagano M. Human cyclin E, a nuclear protein essential for the G1-to-S phase transition. Mol Cell Biol. 1995;15(5):2612–2624. | ||
Ohtsubo M, Roberts JM. Cyclin-dependent regulation of G1 in mammalian fibroblasts. Science. 1993;259(5103):1908–1912. | ||
Larsen BD, Sørensen CS. The caspase-activated DNase: apoptosis and beyond. FEBS J. 2017;284(8):1160–1170. | ||
Creagh EM. Caspase crosstalk: integration of apoptotic and innate immune signalling pathways. Trends Immunol. 2014;35(12):631–640. | ||
Ghosh S, May MJ, Kopp EB. NF-kappa B and Rel proteins: evolutionarily conserved mediators of immune responses. Annu Rev Immunol. 1998;16:225–260. | ||
Farhana L, Dawson MI, Fontana JA. Apoptosis induction by a novel retinoid-related molecule requires nuclear factor-kappaB activation. Cancer Res. 2005;65(11):4909–4917. | ||
Hanahan D, Weinberg RA. Hallmarks of cancer: the next generation. Cell. 2011;144(5):646–674. | ||
Mathias RA, Greco TM, Oberstein A, et al. Sirtuin 4 is a lipoamidase regulating pyruvate dehydrogenase complex activity. Cell. 2014;159(7):1615–1625. | ||
Daye D, Wellen KE. Metabolic reprogramming in cancer: unraveling the role of glutamine in tumorigenesis. Semin Cell Dev Biol. 2012;23(4):362–369. | ||
Tennant DA, Durán RV, Gottlieb E. Targeting metabolic transformation for cancer therapy. Nat Rev Cancer. 2010;10(4):267–277. | ||
Zhao Y, Butler EB, Tan M. Targeting cellular metabolism to improve cancer therapeutics. Cell Death Dis. 2013;4(3):e532. | ||
Galluzzi L, Kepp O, vander Heiden MG, Kroemer G. Metabolic targets for cancer therapy. Nat Rev Drug Discov. 2013;12(11):829–846. | ||
Ahmad IM, Abdalla MY, Aykin-Burns N, et al. 2-deoxyglucose combined with wild-type p53 overexpression enhances cytotoxicity in human prostate cancer cells via oxidative stress. Free Radic Biol Med. 2008;44(5):826–834. | ||
Gaglio D, Soldati C, Vanoni M, Alberghina L, Chiaradonna F. Glutamine deprivation induces abortive S-phase rescued by deoxyribonucleotides in K-Ras transformed fibroblasts. PLoS One. 2009;4(3):e4715. | ||
Mukhopadhyay S, Saqcena M, Foster DA. Synthetic lethality in KRas-driven cancer cells created by glutamine deprivation. Oncoscience. 2015;2(10):807–808. | ||
Saqcena M, Patel D, Menon D, Mukhopadhyay S, Foster DA. Apoptotic effects of high-dose rapamycin occur in S-phase of the cell cycle. Cell Cycle. 2015;14(14):2285–2292. | ||
Saqcena M, Mukhopadhyay S, Hosny C, Alhamed A, Chatterjee A, Foster DA. Blocking anaplerotic entry of glutamine into the TCA cycle sensitizes K-ras mutant cancer cells to cytotoxic drugs. Oncogene. 2015;34(20):2672–2680. | ||
Le A, Lane AN, Hamaker M, et al. Glucose-independent glutamine metabolism via TCA Cycling for proliferation and survival in B cells. Cell Metab. 2012;15(1):110–121. |
 © 2019 The Author(s). This work is published and licensed by Dove Medical Press Limited. The full terms of this license are available at https://www.dovepress.com/terms.php and incorporate the Creative Commons Attribution - Non Commercial (unported, v3.0) License.
By accessing the work you hereby accept the Terms. Non-commercial uses of the work are permitted without any further permission from Dove Medical Press Limited, provided the work is properly attributed. For permission for commercial use of this work, please see paragraphs 4.2 and 5 of our Terms.
© 2019 The Author(s). This work is published and licensed by Dove Medical Press Limited. The full terms of this license are available at https://www.dovepress.com/terms.php and incorporate the Creative Commons Attribution - Non Commercial (unported, v3.0) License.
By accessing the work you hereby accept the Terms. Non-commercial uses of the work are permitted without any further permission from Dove Medical Press Limited, provided the work is properly attributed. For permission for commercial use of this work, please see paragraphs 4.2 and 5 of our Terms.