")
Back to Journals » International Journal of Nanomedicine » Volume 9 » Issue 1
Sinoporphyrin sodium, a novel sensitizer, triggers mitochondrial-dependent apoptosis in ECA-109 cells via production of reactive oxygen species
Authors Wang H, Wang X, Zhang S, Wang P, Zhang K, Liu Q
Received 17 December 2013
Accepted for publication 7 February 2014
Published 25 June 2014 Volume 2014:9(1) Pages 3077—3090
DOI https://doi.org/10.2147/IJN.S59302
Checked for plagiarism Yes
Review by Single anonymous peer review
Peer reviewer comments 4
Haiping Wang,1 Xiaobing Wang,1 Shaoliang Zhang,2 Pan Wang,1 Kun Zhang,1 Quanhong Liu1
1Key Laboratory of Medicinal Resources and Natural Pharmaceutical Chemistry, Ministry of Education, National Engineering Laboratory for Resource Developing of Endangered Chinese Crude Drugs in Northwest of China, College of Life Sciences, Shaanxi Normal University, Xi'an, Shaanxi, 2Qinglong High-Tech Co, Ltd, Yichun, Jiangxi, People's Republic of China
Background: Sonodynamic therapy (SDT) is a promising method that uses ultrasound to activate certain chemical sensitizers for the treatment of cancer. The purpose of this study was to investigate the sonoactivity of a novel sensitizer, sinoporphyrin sodium (DVDMS), and its sonotoxicity in an esophageal cancer (ECA-109) cell line.
Methods: The fluorescence intensity of DVDMS, hematoporphyrin, protoporphyrin IX, and Photofrin II was detected by fluorescence microscopy and flow cytometry. Generation of singlet oxygen was measured using a 1, 3-diphenylisobenzofuran experiment. A 3-(4, 5-dimethylthiazol-2-yl)-2, 5-diphenyl tetrazolium bromide assay was used to examine cell viability. Production of reactive oxygen species (ROS) and destabilization of the mitochondrial membrane potential were assessed by flow cytometry. Apoptosis was analyzed using Annexin-PE/7-amino-actinomycin D staining. Confocal microscopy was performed to assess mitochondrial damage and identify release of cytochrome C after treatment. Western blots were used to determine expression of oxidative stress-related and apoptosis-associated protein. Ultrastructural changes in the cell were studied by scanning electron microscopy.
Results: DVDMS showed higher autofluorescence intensity and singlet oxygen production efficiency compared with other photosensitizers in both cancerous and normal cells. Compared with hematoporphyrin, DVDMS-mediated SDT was more cytotoxic in ECA-109 cells. Abundant intracellular ROS was found in the SDT groups, and the cytotoxicity induced by SDT was effectively remitted by ROS scavengers. DVDMS located mainly to the mitochondria of ECA-109 cells, which were seriously damaged after exposure to SDT. Release of cytochrome C, an increased rate of apoptosis, and activated apoptosis protein were detected in the SDT group. In addition, relatively severe cell damage was observed on scanning electron microscopy after treatment with DVDMS and SDT.
Conclusion: These results suggest that DVDMS could be activated by ultrasound, and that DVDMS mediates SDT-induced mitochondrial-dependent apoptosis in ECA-109 cells via production of ROS.
Keywords: sonodynamic therapy, sinoporphyrin sodium, reactive oxygen species, mitochondrial damage, apoptosis, ECA-109 cells
Introduction
Ultrasound, a mechanical wave with periodic vibrations of particles in a continuous and elastic medium,1 is used for diagnostic imaging of soft tissues. Previous research shows that ultrasound can have different biological effects at different intensities and frequencies.2 The thermal effects and thermal ablation induced by high-intensity ultrasound have been studied in various applications, including relief of inflammation and necrosis of solid tumors. Low-intensity ultrasound may have nonthermal effects, eg, oscillating and cavitating bubbles3 have been used in the targeting and controlled release of drugs and might be important in gene therapy.4–7
An important application of low-intensity ultrasound, ie, sonodynamic therapy (SDT), lies in the activation of certain sensitizers used in the treatment of cancer. Because of its good penetrability, ultrasound can focus energy on tumors and kill them effectively, with few side effects in normal tissue.8–11 The direct mechanical stress and indirect chemical reactions caused by ultrasound, such as generation of reactive oxygen species (ROS), can cause lethal sonodamage, including cellular apoptosis and necrosis.12 Recently, SDT has been widely investigated for its ability to damage a broad range of cancers, and found to have certain curative effects.1,13 It has been reported that SDT is an effective anticancer therapy when combined with microbubbles or nanoparticles and chemotherapeutic drugs.
The physical and chemical properties of sonosensitizers directly determine the therapeutic efficacy of SDT. Many sonosensitizers are derived from photosensitizers that have been used widely in photodynamic therapy. To date, many conventional photosensitizers, eg, hematoporphyrin,14–16 Photofrin II,7,17 ATX-70,18,19 chlorin e6,20 and ATX-S10,21 have been confirmed to trigger cell death after activation by ultrasound. Therefore, development of photosensitizers may be an indirect way of identifying sonosensitizers. At the Chinese Academy of Medical Sciences, Fang and Yang isolated a compound from Photofrin II that they named sinoporphyrin sodium, also known as DVDMS.22 DVDMS is a porphyrin dimer connected by an ether bond (Figure 1). Then DVDMS was compound based on the chemical structure. The compound is patented in the People’s Republic of China.23 Details of the synthesis and characteristics of DVDMS are described in the patent document. Compared with Photofrin II, DVDMS has demonstrated an advantage as a new photosensitizer because of its strong antitumor photosensitivity and low skin sensitivity.25 In addition, our previous work shows that DVDMS has good activity at an appropriate ultrasound intensity both in vivo and in vitro22,24 suggesting that it may be a potential sonosensitizer, but the mechanism of DVDMS-mediated SDT remains unclear. Therefore, we undertook this study to evaluate the cytotoxicity of DVDMS-mediated SDT in ECA-109 cells and to clarify the underlying mechanism.
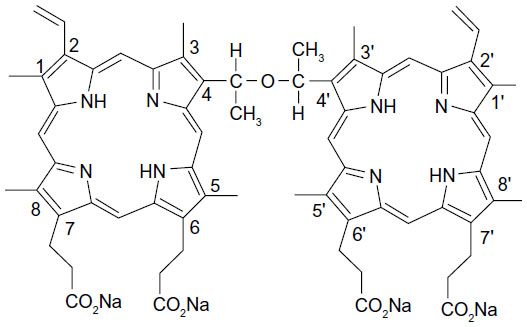 | Figure 1 Molecular structure of DVDMS (sinoporphyrin sodium). |
Materials and methods
Chemicals
DVDMS is marketed by Qinglong Hi-tech Co, Ltd (Jiangxi, People’s Republic of China) and was kindly provided by Professor Qicheng Fang from the Chinese Academy of Medical Sciences (Beijing, People’s Republic of China). The DVDMS was of 98.5% purity. It was dissolved in phosphate-buffered saline with a storage concentration of 0.815 mM, and stored in the dark at −20°C.
3-(4, 5-dimethylthiazol-2-yl)-2, 5-diphenyltetrazolium bromide tetrazolium (MTT), N-acetylcysteine, Hoechst 33258, and 1, 3-diphenylisobenzofuran (DPBF) were purchased from Sigma Chemical Company (St Louis, MO, USA). Mito-Tracker Green (MTG), Mito-Tracker Red (MTR), Lyso-Tracker Green (LTG), 2′, 7′-dichlorodihydrofluorescein diacetate (DCFH-DA), and 5,5′,6,6′-tetrachloro-1,1′,3,3′-tetraethyl benzimidaloyl carbocyanine iodide (JC-1) were supplied by Molecular Probes Inc., (Invitrogen, Carlsbad, CA, USA). All other reagents were commercial products of analytical grade.
Cell culture
Human esophageal cancer (ECA-109) cells, human embryo kidney (HEK-293) cells, and human breast cancer (MDA-MB-231) cells were obtained from the cell bank at the Chinese Academy of Science. ECA-109 cells were cultured in Roswell Park Memorial Institute 1640 medium (Sigma-Aldrich, St Louis, MO, USA) containing 10% fetal bovine serum (Thermo Scientific Hyclone, Logan, UT, USA), 1% penicillin-streptomycin (penicillin 100 U/mL and streptomycin 100 μg/mL), and 1% glutamine. HEK-293 and MDA-MB-231 cells were cultured in Dulbecco’s Modified Eagle’s Medium (Gibco, Life Technologies, Carlsbad, CA, USA) containing 10% fetal bovine serum, 1% penicillin-streptomycin, and 1% glutamine. All cells were cultured in a humidified 5% CO2 and 95% air atmosphere incubator at 37°C.
Ultrasound apparatus and SDT protocol
The ultrasonic apparatus used in this study has been described in a previous paper.27 A 35 mm diameter planar transducer (Institution of Applied Acoustics, Shaanxi Normal University, Shaanxi Province, People’s Republic of China) was submerged in an acrylic tank filled with distilled, degassed water. Continuous-wave ultrasound was provided by a generator (T&C Power Conversion, Rochester, NY, USA). For sonication, cells in a 35 mm culture dish (Corning Inc., Corning, NY, USA) were placed in a water bath 10 mm above the transducer in a horizontal position. To minimize the reflected ultrasound, the end of the tank was covered with 6 mm thick polyester film. The frequency was 1.0 MHz, the output power was 4 W, and the duration of exposure to ultrasound was 1–3 minutes.
Cells were seeded in a 35 mm culture dish (3 × 10⁵ cells per dish), incubated at 37°C for 12 hours, and then divided randomly into four groups, ie, a control group, an ultrasound control group, a sensitizer control group, and an SDT group. For the sensitizer control and SDT groups, cells were incubated with various concentrations of sensitizers for 3 hours. After incubation, the sensitizers were replaced by culture medium, and the cells were then treated with ultrasound.
As an inhibitory experiment, N-acetylcysteine (5 mM), a ROS scavenger, was added to the cells one hour before loading the sensitizer. The inhibitor did not appear to be cytotoxic to the cultured cells at the concentration used.
In vitro imaging and fluorescence intensity
For the flow cytometry assay, ECA-109 cells and HEK-239 cells were incubated with 4 μM DVDMS, hematoporphyrin, protoporphyrin IX, and Photofrin II for 3 hours, then washed with phosphate-buffered saline, harvested by trypsinization, and resuspended in culture medium containing 10% fetal bovine serum. The samples were then immediately analyzed by flow cytometry (Guava easyCyte 8 HT, EMD Millipore, Billerica, MA, USA). The mean fluorescence intensity representing uptake of sensitizers by ECA-109 cells and HEK-293 cells was analyzed using FCS Express version 3 software (DeNovo Software, Los Angeles, CA, USA). For each group, 2,000 cells were analyzed. After incubation with the different sensitizers, the cells were washed in phosphate-buffered saline and then imaged using an E-600 fluorescence microscope (Nikon Corporation, Tokyo, Japan).
Detection of singlet oxygen generation
We used photo-oxidation of DPBF as a quantitative method to evaluate production of singlet oxygen. In this absorption spectrophotometric assay, DPBF is oxidized to its corresponding diketone upon interaction with singlet oxygen in stoichiometric equivalents. Loss of DPBF absorbance at about 410 nm represented the production of singlet oxygen.18,19 DPBF was dissolved in anhydrous alcohol and attenuated by saline to 0.2 mM. DVDMS 10 μM and hematoporphyrin, protoporphyrin IX, and Photofrin II dissolved in 0.2 mM DPBF were irradiated by laser light (excitation wavelength 635 nm, energy power 5 J), and absorbance of DPBF at 414 nm was monitored using an ultraviolet spectrophotometer.
Assessment of cytotoxicity
The cytotoxicity of SDT was analyzed in the different types of cells using the MTT assay, as previously described.25 Cell survival was calculated using the following equation:

Determination of intracellular ROS
DCFH-DA, a nonfluorescent cell-permeant compound, is cleaved by endogenous esterases within the cell and the de-esterified product can be converted into the fluorescent compound, dichlorofluorescein (DCF), upon oxidation by intracellular ROS. Therefore, we studied production of ROS by measuring the fluorescence intensity of DCF.
One hour after treatment, the cells were washed with phosphate-buffered saline and incubated with Roswell Park Memorial Institute 1640 containing 4 μM DCHF-DA at 37°C in an incubator for 20 minutes with gentle shaking. After incubation, the samples were washed in phosphate-buffered saline and harvested by trypsinization, then detected immediately by flow cytometry (Guava easyCyte 8HT). Histograms were analyzed using FCS Express version 3 software.
Estimating subcellular localization of DVDMS
ECA-109 cells were incubated with DVDMS for 3 hours, then coloaded with 3 nM MTG (excitation wavelength 490 nm, emission wavelength 516 nm) or LTG (excitation wavelength 504 nm, emission wavelength 511 nm). After incubation, the cells were washed with phosphate-buffered saline and imaged using an inverted TCS SP5 confocal laser scanning microscope (Leica, Wetzlar, Germany). During multichannel imaging, photomultiplier sensitivities and offsets were set to a level at which bleed through effects from one channel to another were negligible.
Monitoring the structural and functional changes of mitochondria
MTG was used to track the mitochondrial changes in living cells. After treatment, the cells were washed in phosphate-buffered saline then imaged using an inverted confocal laser scanning microscope. JC-1 was used to evaluate perturbation of the mitochondrial membrane potential. Cells were harvested and washed in phosphate-buffered saline, then incubated with JC-1 for 20 minutes at 37°C. After staining, cells were washed with incubation buffer then immediately analyzed by flow cytometry.
Release of cytochrome c
Cells in each treatment group were incubated with 0.5 mM MTR (excitation wavelength 579 nm, emission wavelength 599 nm) in phosphate-buffered saline at 37°C for 20 minutes, fixed in 4% paraformaldehyde at 4°C for 15 minutes, and subsequently permeabilized with 0.1% Triton X-100 at 4°C for 5 minutes; between steps, cells were washed with phosphate-buffered saline. After permeation, cells were blocked with goat serum at 37°C for one hour, and then incubated with anti-cytochrome c antibody (Santa Cruz Biotechnology, Santa Cruz, CA, USA) overnight at 4°C. After being washed with phosphate-buffered saline, the samples were incubated with fluorescein isothiocyanate-conjugated secondary antibody. Cells were also labeled with the nucleus dye, Hoechst 33258, and observed by inverted confocal laser scanning microscopy.
Assay for detection of apoptosis
The Guava Nexin assay kit (EMD Millipore) was used to quantify the amount of cells in apoptosis. Annexin V-PE can detect phosphatidylserine on the external membrane of apoptotic cells; the cell-impermeant dye 7-aminoactinomycin D is also used as an indicator of cell membrane integrity. Briefly, cells were harvested by trypsinization in each group, and 100 μL of cells from each sample was suspended in a mixture of 100 μL Annexin V-PE and 7-aminoactinomycin D binding buffer and incubated at room temperature for 20 minutes. Samples were investigated using flow cytometry (Guava easyCyte 8 HT).
Western blot analysis
After treatment, cells were lysed in radioimmunoprecipitation buffer (containing 50 mM Tris-HCl [pH 7.4], 150 mM NaCl, 1 mM ethylenediamine tetraacetic acid, 1% Triton X-100, 1% sodium deoxycholate, 0.1% sodium dodecyl sulfate, 1 mM phenylmethylsulfonyl fluoride, 1 mM leupeptin, and 0.01 mM aprotinin). Similar amounts of protein were analyzed in each lane. Electrophoresis was carried out on 10%–15% acrylamide gels and the proteins were transferred to polyvinylidene fluoride membranes (EMD Millipore, 0.22 mM pore size). After washing and blocking, the membranes were incubated overnight at 4°C with primary antibodies against rabbit polyclonal caspase-3 (Cell Signaling Technology, Danvers, MA, USA) and rabbit polyclonal phospho-p38 mitogen-activated protein kinase (MAPK, Cell Signaling Technology). After washing, the membranes were incubated for one hour with IRDye® 680-labeled secondary antibodies (LI-COR Biosciences, Lincoln, NE, USA) at room temperature for one hour. The infrared fluorescence was detected using the Odyssey infrared imaging system (LI-COR Biosciences). Anti-β-actin was used to ensure equal loading.
Scanning electron microscopy
Four hours after SDT, cells in each group were fixed with 2.5% glutaraldehyde and dehydrated by graded alcohol after being washed in phosphate-buffered saline, dried at the critical point, conductive coating, and then observed under a S-3400N scanning electron microscope (SEM, Hitachi, Tokyo, Japan).
Statistical analysis
All values are expressed as the mean ± standard deviation. Differences between the treatment groups were assessed with one-way analysis of variance. Statistical significance was established at a P-value<0.05. Each experiment was repeated three times.
Results
In vitro imaging and fluorescence intensity
Fluorescence microscopy and flow cytometry analysis indicated the intracellular fluorescence intensity of different sensitizers in ECA-109 (cancerous) cells and HEK-293 (normal) cells. As seen in Figure 2A, compared with other sensitizers, 4 μM DVDMS showed brighter fluorescence in both cancerous cells and normal cells, but the fluorescence intensity of the sensitizers in cancer cells was much higher than in normal cells. Further quantificational testing with flow cytometry demonstrated clearly that the fluorescence intensity of DVDMS (Figure 2B) was approximately 10-fold of the other three sensitizers, and the fluorescence intensity of DVDMS in cancer cells was much higher than in normal cells (Figure 2C).
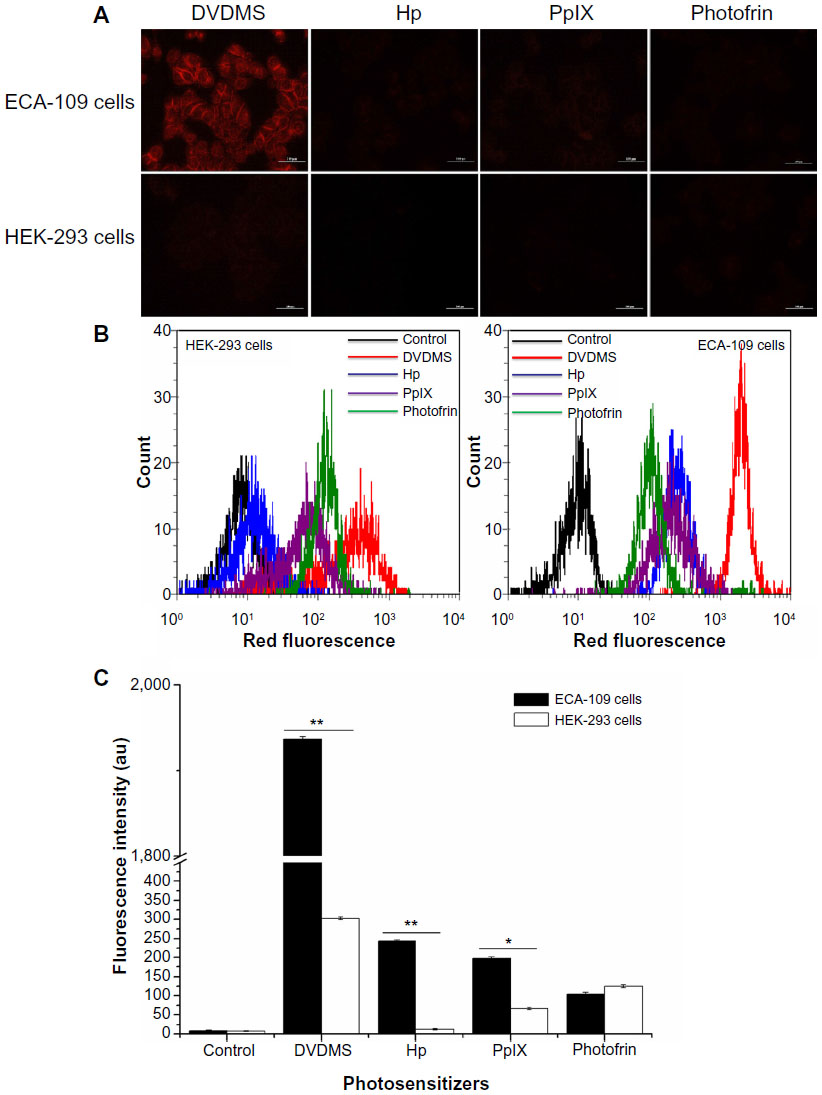 | Figure 2 Fluorescence intensity of the different photosensitizers in normal cells and cancerous cells under the same experimental conditions. |
Detection of singlet oxygen production
Single oxygen production was detected to compare the photoactivity of the different photosensitizers. The absorbance of DPBF was 1.98±0.10 and decreased to 1.749±0.09 (P<0.05), 1.739±0.08 (P<0.05), 1.637±0.06 (P<0.05), and 1.607±0.15 (P<0.05) in the presence of hematoporphyrin, DVDMS, protoporphyrin IX, and Photofrin II dissolved in DPBF, respectively. After irradiated by 5 J laser light, DPBF absorbance decreased to 1.611±0.08 (P<0.05), 1.059±0.07 (P<0.01), 1.362±0.07 (P<0.01), and 1.460±0.06 (P<0.01) when the sensitizers were hematoporphyrin, DVDMS, protoporphyrin IX, and photofrin II, respectively (Figure 3).
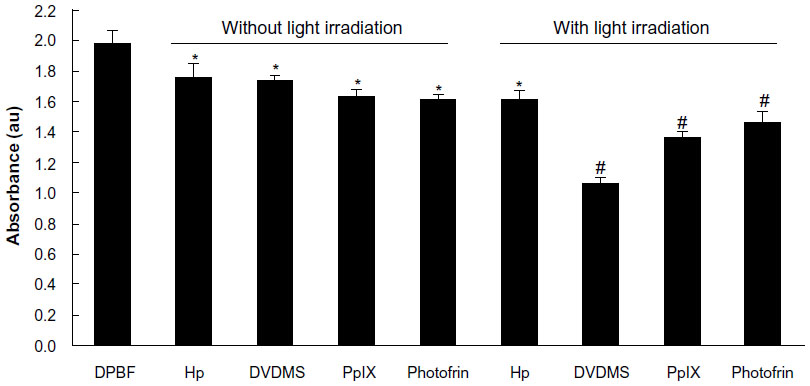 | Figure 3 Detection of singlet oxygen production on exposure to the different sensitizers. Absorbance of DPBF was analyzed by ultraviolet spectrophotometry after dissolution in 4 μM DVDMS, protoporphyrin IX, hematoporphyrin, and Photofrin II in DPBF with or without light irradiation. *P<0.05 and #P<0.01 versus DPBF only group. |
Cytotoxicity assessment
The cytotoxicity of DVDMS-mediated SDT on the different cell lines was evaluated by MTT assay. For ECA-109 cells (Figure 4A), DVDMS alone did not achieve significant cell growth inhibition, with a survival rate of 105.76%, 102.54%, and 96.65% when the concentration was 1, 2, and 4 μM, respectively. The cell damage caused by ultrasound alone was minor, with only 15.01% dead cells detected when the irradiation time was 3 minutes. A more marked inhibitory effect on cell proliferation was seen with increasing DVDMS concentration and longer ultrasound exposure time. The cytotoxicity increased significantly from 32.66% (P<0.05) to 67.13% (P<0.01) when the ultrasound irradiation time was increased from one minute to 3 minutes in the presence of 4 μM DVDMS, and was similar in the other SDT groups (DVDMS concentration 1 μM or 2 μM). For MDA-MB-231 cells (with p53 mutation), treatment with DVDMS alone inhibited cell proliferation in a dose-dependent manner when compared with the control group (96.10%), and cell viability decreased to 68.77% (P<0.05) in the 4 μM DVDMS group. In the SDT groups, cell viability decreased from 54.41% to 34.92% when the exposure time was one minute and 3 minutes, respectively, in the presence of 4 μM DVDMS (Figure 4B). We also investigated the viability of HEK-293 cells after SDT mediated by 4 μM DVDMS; interestingly, in contrast with tumor cells, no significant changes were observed in the viability of normal cells (Figure 4C). On the basis of these findings, we suggest that DVDMS can selectively kill tumor cells, and this may be related to its preferential accumulation in tumor cells.
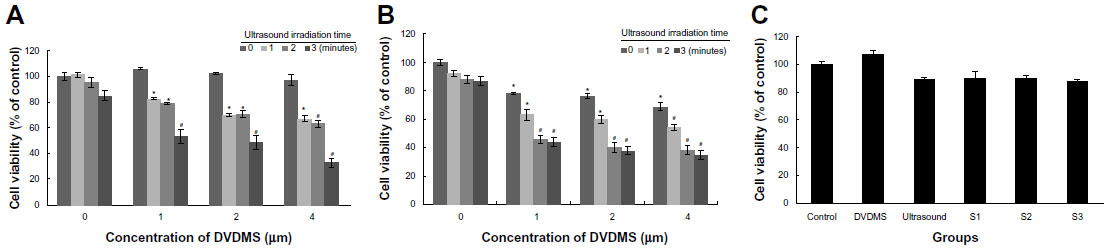 | Figure 4 Cytotoxicity of DVDMS-mediated sonodynamic therapy in ECA-109 cells (A), MDA-MB-231 cells (B), and HEK-293 cells (C). |
Figure 5 shows cell survival after treatment with hematoporphyrin and SDT, and there were no inhibitory effects in the hematoporphyrin only groups at the concentrations tested (1–32 μM). When the hematoporphyrin dose was <8 μM, the inhibition rate was not significantly different from that with ultrasound alone. A cell death rate of 28.35% was achieved when the ultrasound exposure time was 3 minutes in the presence of 4 μM hematoporphyrin. In the presence of 32 μM hematoporphyrin, cell viability decreased to 83.12%, 67.56%, and 54.80% when the ultrasound irradiation time was one, 2, and 3 minutes, respectively. These results confirm that DVDMS had better sonotoxicity than the classical hematoporphyrin sensitizer.
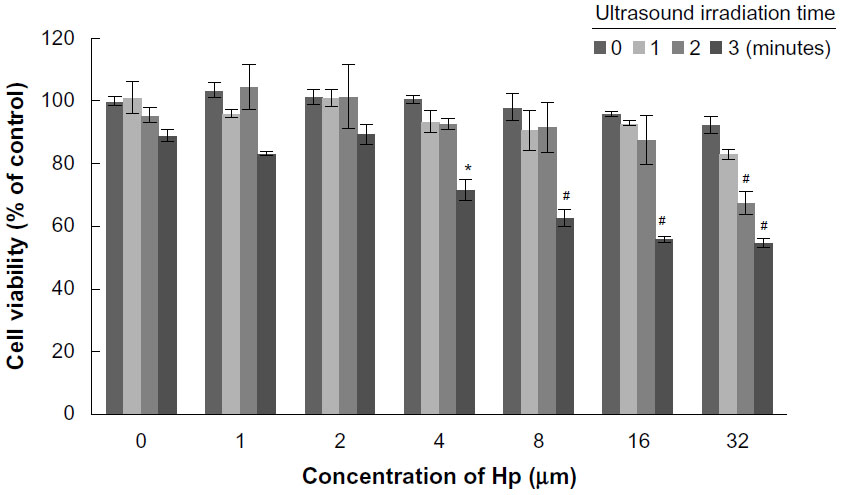 | Figure 5 Viability of ECA-109 cells 4 hours after hematoporphyrin-mediated sonodynamic therapy by MTT assay. All data are expressed as the percentage of untreated cells, and the error bars represent standard deviations of the means of three independent experiments. *P<0.05 and #P<0.01 versus untreated cells. |
Determination of intracellular ROS
Intracellular ROS was measured by DCFH-DA combined with flow cytometry to determine whether ROS was involved in SDT. Figure 6 demonstrates that, compared with the control, ultrasound alone caused 1.90% (P>0.05), 6.59% (P>0.05), and 7.70% (P>0.05) high DCF fluorescence when the ultrasound exposure time was one, 2, and 3 minutes, respectively. However, 4 μM DVDMS alone could enhance high DCF fluorescence by only 3.35% (P>0.05). Cells in the SDT group showed markedly increased DCF fluorescence in the presence of 4 μM DVDMS, with 17.65% (P<0.05), 58.60% (P<0.01), and 70.35% (P<0.01) of cells displaying high DCF fluorescence when the exposure time was one, 2, and 3 minutes, respectively. Under the same conditions, 4 μM hematoporphyrin-mediated SDT caused 14.85% (P<0.05), 24.20% (P<0.05), and 37.50% (P<0.01) high DCF fluorescence with ultrasound exposure times of one, 2, and 3 minutes, respectively.
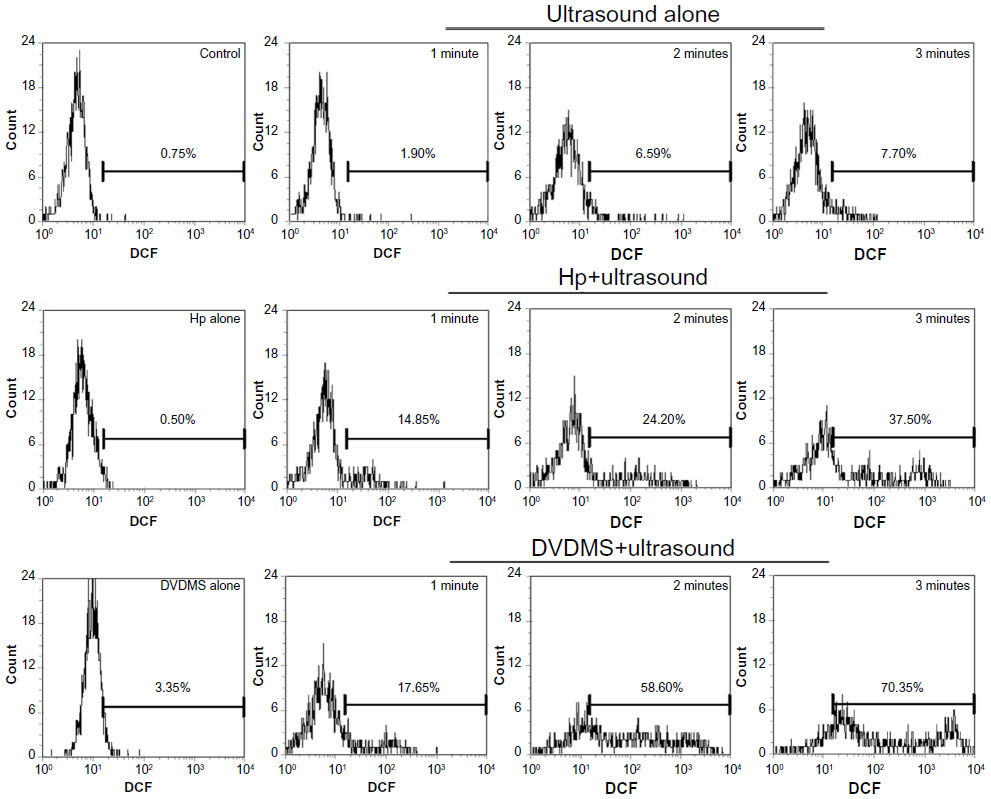 | Figure 6 Measurement of intracellular reactive oxygen species in ECA-109 cells. At one hour posttreatment, cells were labeled with DCFH-DA, and the fluorescence intensity of the oxidized product (DCF) was detected in individual cells by flow cytometry. The data shown are representative of three independent experiments. |
In order to investigate the role of ROS in SDT-induced cell death, ECA-109 cells were pretreated with N-acetylcysteine, a specific ROS scavenger. Cytotoxicity was determined using the MTT assay. The data in Figure 7 indicate that N-acetylcysteine decreased the cytotoxic effect of sonication with DVDMS, suggesting that enhanced generation of ROS plays an important role in SDT.
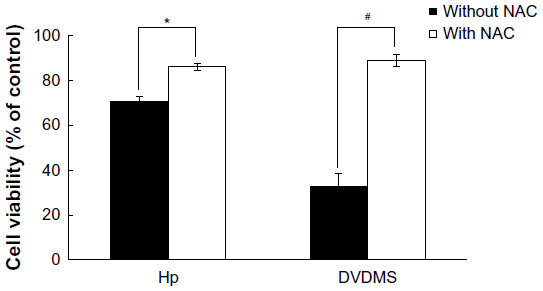 | Figure 7 Effect of NAC, a reactive oxygen species scavenger, on sonodynamic therapy-induced cytotoxicity in ECA-109 cells. |
Estimating subcellular localization of DVDMS
Red DVDMS fluorescence corresponded well with green MTG fluorescence, but did not overlap with LTG green fluorescence, suggesting that DVDMS accumulated mainly in the mitochondria of ECA-109 cells (Figure 8).
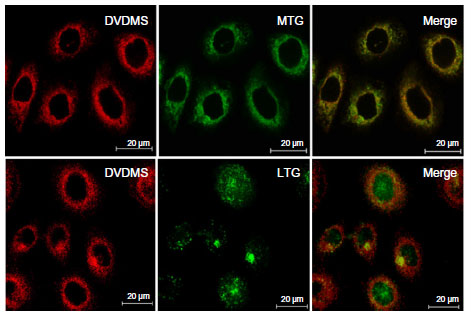 | Figure 8 Subcellular localization of DVDMS in ECA-109 cells. |
Monitoring changes in mitochondrial activity
MTG was used to detect mitochondrial changes in ECA-109 cells after DVDMS-mediated SDT because it is a specific tracker probe for mitochondrial activity. As demonstrated in Figure 9A, in the control group, abundant mitochondria distributed in ECA-109 cells in a regular manner and the bright green fluorescence represent the assemblies of mitochondria in cells, after SDT treatment, apparent decrease of bright green fluorescence blots, and irregular distribution of mitochondria were observed. However, these changes in the mitochondria can be effectively rescued by N-acetylcysteine.
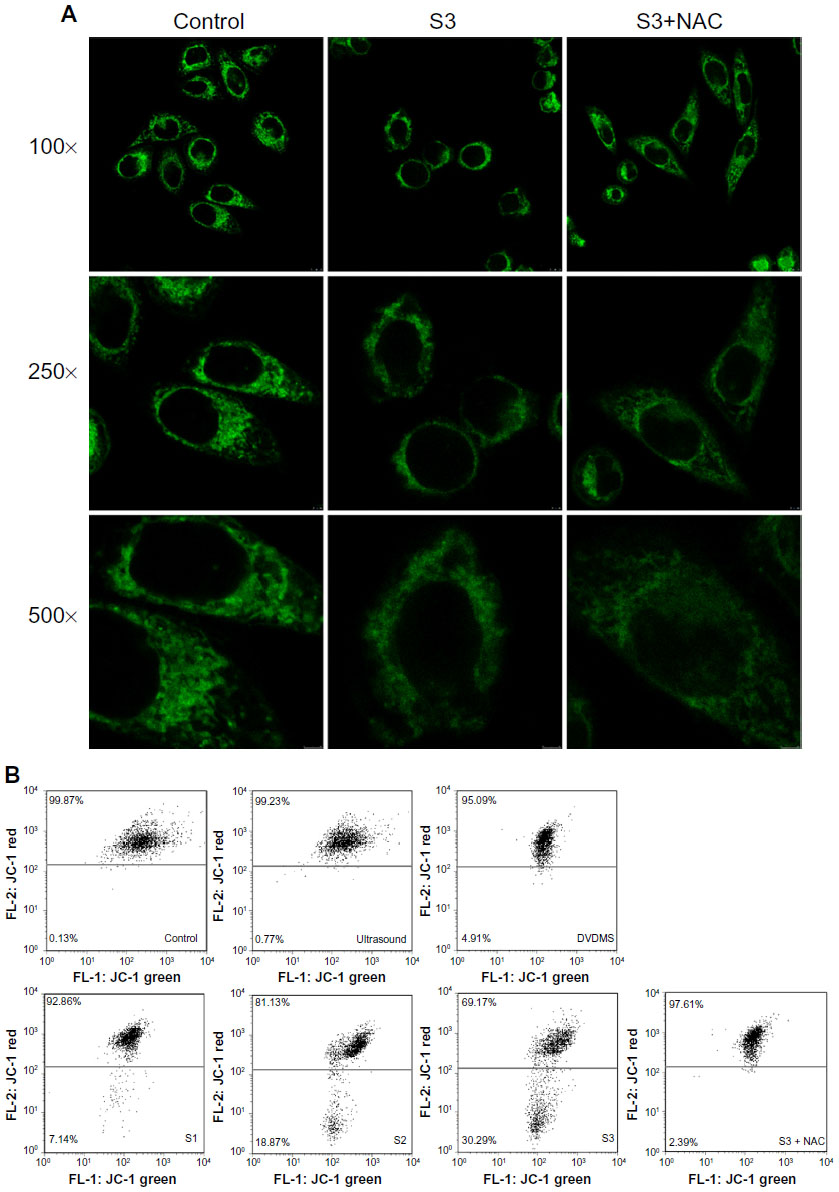 | Figure 9 Detection of mitochondrial damage. Mitochondrial distribution was observed by Mito-Tracker Green staining (Molecular Probes Inc., [Invitrogen, Carlsbad, CA, USA]) (A), and changes in mitochondrial membrane potential were analyzed by JC-1 staining (B) in ECA-109 cells after sonodynamic therapy. Cells were photographed at three magnifications (100×, 250×, and 500×). |
JC-1 is a potential sensitizing cationic dye capable of entering selectively into the mitochondria, and it reversibly changes its color from red to green as the membrane potential decreases. Figure 9B indicates that 0.77% and 4.91% of cells showed low red fluorescence intensity when cells were treated with ultrasound alone (3 minutes) and DVDMS (4 μM) alone, respectively. While cells in the SDT groups showed a marked decrease in mitochondrial membrane potential, 7.14%, 18.87%, and 30.29% of cells displayed low red fluorescence intensity when the ultrasound irradiation time was one, 2, and 3 minutes, respectively. However, the markedly decreased mitochondrial membrane potential in the SDT group was effectively inhibited by N-acetylcysteine, and only 2.39% of cells showed low red fluorescence in the SDT group (3 minutes of irradiation time) in the presence of N-acetylcysteine.
Release of cytochrome c
Figure 10 shows cytochrome c release for each group after treatment. The green fluorescence of cytochrome c overlapped very well with the red fluorescence of MTR, a specific mitochondrial dye, in control cells. Cells in the SDT groups displayed diffuse cytochrome c green fluorescence that did not overlap very well with MTR red fluorescence, suggesting cytochrome c was partially released from the mitochondria, while in the SDT + N-acetylcysteine group, cytochrome c release was obviously suppressed.
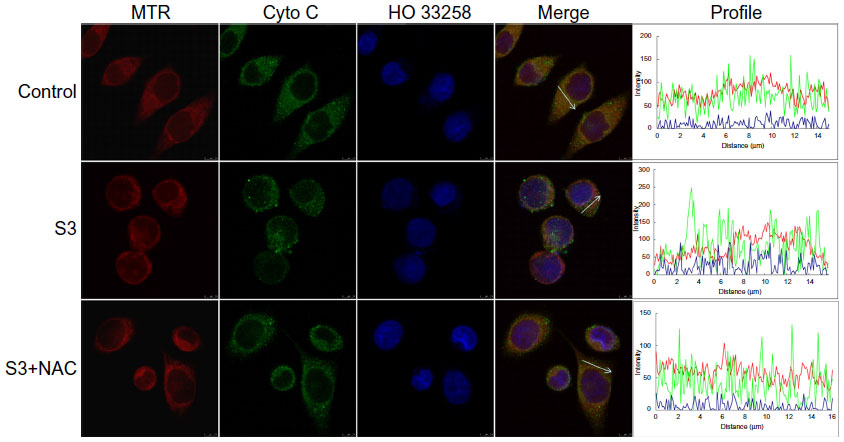 | Figure 10 Detection of release of cytochrome c from mitochondria in ECA-109 cells after sonodynamic therapy. The fluorescence images were acquired by confocal microscopy. Control, untreated cells; S3, cells treated with 4 μM DVDMS plus 3 minutes of ultrasound irradiation; S3 + N-acetylcysteine, cells treated with 4 μM DVDMS plus 3 minutes of ultrasound irradiation in the presence of N-acetylcysteine. |
Assay for detection of apoptosis
According to the manufacturer’s instructions, Annexin V-positive staining is an indicator of both early and late apoptosis, whereas 7-aminoactinomycin D only labels cells dying by necrosis. For our purposes, double-negative cells were considered viable; the Annexin V-positive populations were all collectively counted as apoptotic, and the single 7-aminoactinomycin D-positive cells were considered to be necrotic. Figure 11 shows that there are 93.65% viable cells and 5.90% apoptotic cells in the control group. In the ultrasound only (3 minutes) and DVDMS only (4 μM) groups, the proportion of viable cells decreased to 89.25% and 90.81%, respectively, and the proportion of apoptotic cells increased to 10.25% and 8.94%, respectively. When cells were treated with SDT, their viability decreased to 82.95%, 70.25%, and 54.70%, whereas the proportion of apoptotic cells increased to 17.00%, 29.70%, and 43.30% when the ultrasound exposure time was one, 2, and 3 minutes, respectively.
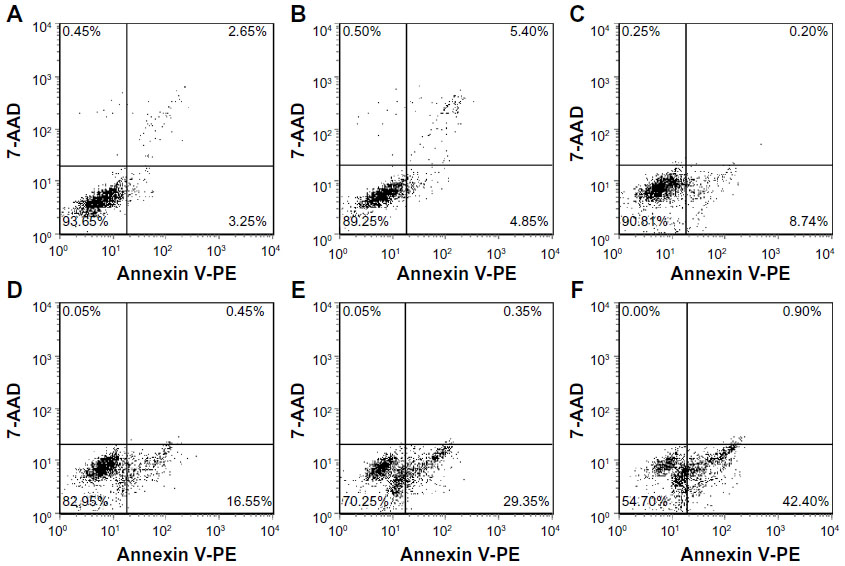 | Figure 11 Dot plots of Annexin V-PE and 7-AAD uptake by differently treated cells. (A) Control cells, (B) cells treated with ultrasound for 3 minutes, (C) cells treated with 4 μM DVDMS only, (D) cells treated with 4 μM DVDMS plus 1 minute of ultrasound irradiation, (E) cells treated with 4 μM DVDMS plus 2 minutes of ultrasound irradiation, and (F) cells treated with 4 μM DVDMS plus 3 minutes of ultrasound irradiation. Data shown are representative of three independent experiments. |
In addition, the activity of apoptosis-related protein caspase-3 and oxidative stress-associated protein phospho-p38 MAPK were analyzed by Western blotting. Figure 12 shows that the ratio of cleaved caspase-3 and phospho-p38 MAPK to β-actin increased significantly compared with the control (24.688% to 59.262% [P<0.01] and 15.479% to 30.373% [P<0.05], respectively) in the SDT group when the ultrasound irradiation time was 3 minutes with 4 μM DVDMS, but the expression level of cleaved-caspase-3 and phospho-p38 MAPK reverted to the levels seen in the control group in the present of N-acetylcysteine.
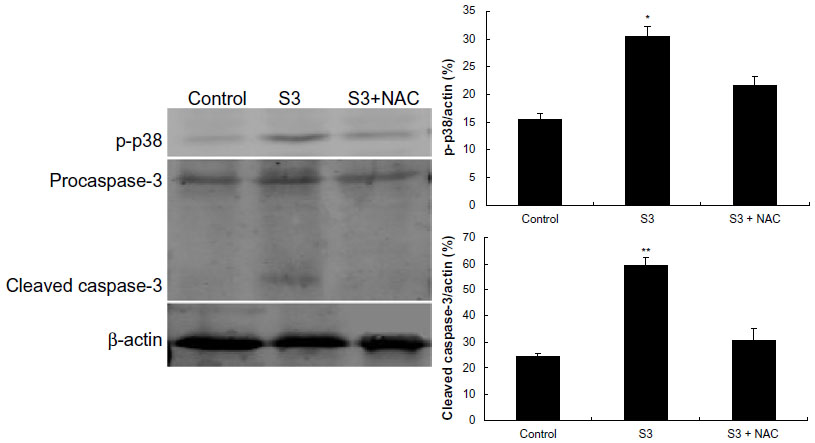 | Figure 12 Activation of apoptosis and oxidative stress-related proteins in ECA-109 cells posttreatment. Cleavage of caspase-3 and phospho-p38 was detected by Western blotting analysis, with β-actin used as a loading control. The ratios of cleaved caspase-3 and phospho-p38 were analyzed by Quantity One software. Control, untreated cells; S3, cells treated with 4 μM DVDMS plus 3 minutes of ultrasound irradiation; S3 + N-acetylcysteine, cells treated with 4 μM DVDMS plus 3 minutes of ultrasound irradiation in the presence of N-acetylcysteine. Data are presented as the mean ± standard deviation of three independent assessments. *P<0.05 and **P<0.01 versus untreated control. |
Observations on SEM
The morphological effects of DVDMS-SDT were observed by SEM (Figure 13). In the control group, cells appeared to show their normal polygonal shape with an intact membrane and abundant microvilli. Cells treated with 3 minutes of irradiation only or 4 μM DVDMS only were not significantly different when compared with control cells. However, when the cells were treated with DVDMS-SDT, they showed marked shrinkage and a sharp decrease in numbers of microvilli numbers. This deformation became more significant and apparent with increasing ultrasound exposure time, with the cytoplasm appearing to flow out through cell membranes that had been fractured by 3 minutes of ultrasound exposure in the SDT group.
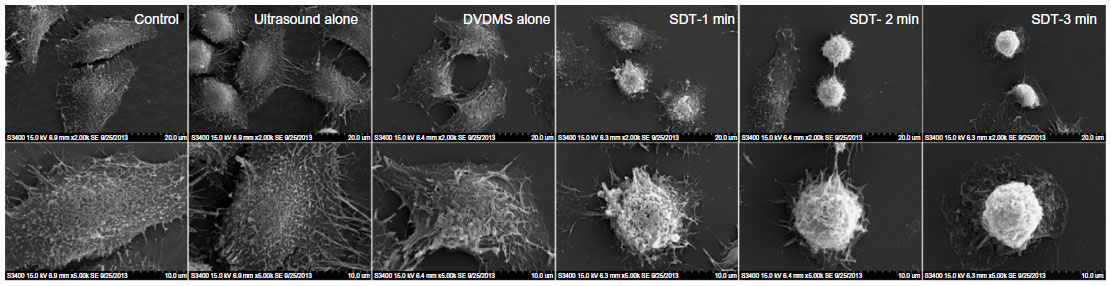 | Figure 13 Scanning electron microscopic images of ECA-109 cells 4 hours after treatment. |
Discussion
SDT is a minimally invasive therapeutic approach, which can kill tumor cells to a maximum extent without affecting normal tissue.10 Many photosensitizers (such as hematoporphyrin, Photofrin II, protoporphyrin IX, photophyrin, ZnPcS2P2, and chlorin e6) can be activated by ultrasound. Another is DVDMS, a novel chemical compound derived from Photofrin II by Fang and Yang. The high chemical purity, water solubility, explicit active ingredients, and good singlet oxygen yield of active DVDMS23 has laid a solid foundation for its application in photodynamic therapy. Researchers have demonstrated the photochemical activity of DVDMS in a number of cancer cell lines with short-time skin sensitivity.26 Moreover, our own previous work has confirmed that DVDMS also had ultrasound activity in K562 and U937 leukemia cells in vitro,22 as well as an anticancer effect in vivo.24 The aim of the study described here was to add to our knowledge of DVDMS-mediated SDT by investigating the sonodynamic effect of DVDMS in ECA-109 cells.
Given that DVDMS is a novel sensitizer, we initially carried out a series of fundamental investigations comparing DVDMS with other clinical sensitizers. Selective accumulation of DVDMS in tumor cells was found in this study, and may be due to the acidic environment around tumors, more low-density lipoprotein on tumor surfaces, poor lymphatic drainage, or leaky vasculature.27 The preferential accumulation of DVDMS in tumor cells paves the way for targeted therapy. Moreover, compared with hematoporphyrin, protoporphyrin IX, and Photofrin II, DVDMS shows higher red fluorescence, which may have advantages in further clinical applications, eg, accurate tracing of tumors and imaging. Given that the main mechanism of photodynamic therapy is related to generation of singlet oxygen, the yield of singlet oxygen might be proportional to the effectiveness of photodynamic therapy.28 Figure 3 shows the higher singlet oxygen production associated with DVDMS compared with other photosensitizers.
We also monitored the cytotoxicity of DVDMS-mediated SDT in both normal cells and cancer cells. Figure 4A–C shows that DVDMS-mediated SDT had a selective lethal effect on cancer cells and that the cytotoxicity of DVDMS was cancer cell line-selective, which is consistent with our previous study.22 Subsequently, we compared the sonotoxicity of DVDMS with that of hematoporphyrin, which is also used in the People’s Republic of China. Figure 5 indicates a significant loss of viability in the DVDMS-SDT groups, whereas the cytotoxicity induced by hematoporphyrin-SDT was very slight under the same experimental conditions.
As described by other researchers,19,23,29–31 ROS may be one of the key factors in SDT-induced cell damage. Excessive ROS may damage lipids, proteins, and DNA, and cause mitochondrial dysfunction, deregulation of ion balance, and loss of membrane integrity. Substantial enhancement of ROS was detected one hour after DVDMS and hematoporphyrin-mediated SDT. In addition, the yield of ROS triggered by the combination of DVDMS and ultrasound was about two-fold that in the hematoporphyrin-SDT groups (Figure 6). The crucial role of ROS in SDT-induced cell death was verified by application of the ROS scavenger, N-acetylcysteine. Figure 7 shows that cell survival was significantly enhanced in the presence of N-acetylcysteine in both the DVDMS-mediated and hematoporphyrin-mediated SDT groups, indicating the vital role of ROS in SDT.
Given the key role of ROS in the cytotoxicity caused by SDT and the short existence time and diffusion distance of radical products derived from the sensitizer during the SDT process, localization of the sensitizer in cells is potentially important in SDT.20,32 We determined the subcellular localization of DVDMS, and the results shown in Figure 8 indicate that DVDMS was mainly located in the mitochondria of ECA-109 cells. On the basis of this finding, we speculated that the mitochondria may be targeted for damage by SDT. MTG staining clearly showed the changes in distribution of mitochondria and their decreased numbers after SDT (Figure 9A). The cleaning systems of the cells themselves may also contribute to the elimination of damaged mitochondria. Furthermore, JC-1 staining showed that SDT caused the mitochondria membrane potential to collapse (Figure 9B). Mitochondria, as the major energy generators in cells, play a vital role in cell apoptosis induced by many stimuli.6,33 As reported elsewhere, impaired mitochondria may initiate apoptotic responses, including release of cytochrome c from mitochondria into the cytoplasm and excitation of the caspase protein family.34,35 The results of the Annexin V-PE assay in our study demonstrated changes in cell apoptosis after DVDMS-mediated SDT (Figure 11), as well as other hallmarks of mitochondrial apoptosis in ECA-109 cells after SDT, such as release of cytochrome c and activation of caspase-3 (Figures 10 and 12). As mentioned earlier, DVDMS-mediated SDT led to abundant production of ROS, the significance of which have been confirmed in the current work. Literatures have provided that the activation of MAPK played a major role in ROS-induced signaling pathways as the response to photodynamic therapy and sonodynamic therapy.36,37 Here we observed an increase in expression of phospho-p38 MAPK immediately after SDT, whereas in the presence of the ROS scavenger, N-acetylcysteine, expression of this protein was markedly suppressed.
The SDT-induced cell damage was observed further by SEM. Consistent with previous findings, no significant morphological changes were observed in either the ultrasound alone or DVDMS alone groups, whereas cells treated with DVDMS-mediated SDT showed decreased numbers of microvilli and cell shrinkage on SEM (Figure 13). Changes on the surface of the cell membrane affect cellular function directly, and may eventually lead to death of the cell,38 so the results of our morphological evaluation were considered to be consistent with the cell viability trends reported above.
Conclusion
Taken together, our results clearly demonstrate the advantages of DVDMS when compared with other clinical sensitizers, as well as a synergistic effect between DVDMS and ultrasound. As a potential sonosensitizer agent, DVDMS-mediated SDT resulted in significant production of ROS and severe mitochondrial damage in ECA-109 cells. In this way, ROS and oxidative stress might contribute to the initiation of mitochondrial apoptosis.
Acknowledgments
This work was supported by Fundamental Research Funds for the Central Universities (GK201102020), Excellent Doctor Innovation Project of Shaanxi Normal University (S2014YB03), and the “DVDMS mediated sonodynamic therapy in anti-cancer research” project underway with Qinglong Hi-tech Co, Ltd. The authors also thank Professor Qicheng Fang at the Chinese Academy of Medical Sciences for his contribution to this research.
Disclosure
The authors report no conflicts of interest in this work.
References
Rosenthal I, Sostaric JZ, Riesz P. Sonodynamic therapy – a review of the synergistic effects of drugs and ultrasound. Ultrason Sonochem. 2004;11(6):349–363. | |
Suslick KS. Sonochemistry. Science. 1990;247(4949):1439–1445. | |
Ahmed HU, Moore C, Emberton M. Minimally-invasive technologies in uro-oncology: the role of cryotherapy, HIFU and photodynamic therapy in whole gland and focal therapy of localised prostate cancer. Surg Oncol. 2009;18(3):219–232. | |
Marmottant P, Hilgenfeldt S. Controlled vesicle deformation and lysis by single oscillating bubbles. Nature. 2003;4(23):153–156. | |
Ogawa K, Tachibana K, Uchida T, et al. High-resolution scanning electron microscopic evaluation of cell-membrane porosity by ultrasound. Med Electron Microsc. 2001;34(4):249–253. | |
Mehier-Humbert S, Bettinger T, Yan F, Guy RH. Plasma membrane poration induced by ultrasound exposure: implication for drug delivery. J Control Release. 2005;104(1):213–222. | |
Larkin JO, Casey GD, Tangney M, et al. Effective tumor treatment using optimized ultrasound-mediated delivery of bleomycin. Ultrasound Med Biol. 2008;34(3):406–413. | |
Shanei A, Sazgarnia A, Tayyebi Meibodi N, et al. Sonodynamic therapy using protoporphyrin ix conjugated to gold nanoparticles: an in vivo study on a colon tumor model. Iran J Basic Med Sci. 2012;15(2):759–767. | |
Bai WK, Shen E, Hu B. Induction of the apoptosis of cancer cell by sonodynamic therapy: a review. Chin J Cancer Res. 2012;24(4):368–373. | |
Chen Z, Li J, Song X, Wang Z, Yue W. Use of a novel sonosensitizer in sonodynamic therapy of U251 glioma cells in vitro. Exp Ther Med. 2012;3(2):273–278. | |
Tachibana K, Feril LB Jr, Ikeda-Dantsuji Y. Sonodynamic therapy. Ultrasonics. 2008;48(4):253–259. | |
Wang XB, Wang P, Zhang K, Su XM, Hou J, Liu QH. Initiation of autophagy and apoptosis by sonodynamic therapy in murine leukemia L1210 cells. Toxicol In Vitro. 2013;27(4):1247–1259. | |
Ashush H, Rozenszajn LA, Blass M, et al. Apoptosis induction of human myeloid leukemic cells by ultrasound exposure. Cancer Res. 2000;60(4):1014–1020. | |
Tang W, Liu QH, Wang XB, et al. Involvement of caspase 8 in apoptosis induced by ultrasound-activated hematoporphyrin in sarcoma 180 cells in vitro. J Ultrasound Med. 2008;27(4):645–656. | |
Su XM, Wang P, Wang XB, Cao B, Li L, Liu QH. Apoptosis of U937 cells induced by hematoporphyrin monomethyl ether-mediated sonodynamic action. Cancer Biother Radiopharm. 2013;28(3):207–217. | |
Liang L, Xie S, Jiang L, Jin H, Li S, Liu J. The combined effects of hematoporphyrin monomethyl ether-SDT and doxorubicin on the proliferation of QBC939 cell lines. Ultrasound Med Biol. 2013;39(1):146–160. | |
Xu ZY, Wang K, Li XQ, et al. The ABCG2 transporter is a key molecular determinant of the efficacy of sonodynamic therapy with Photofrin in glioma stem-like cells. Ultrasonics. 2013;53(1):232–238. | |
Umemura S, Yumita N, Nishigaki R. Enhancement of ultrasonically induced cell damage by a gallium-porphyrin complex, ATX-70. Jpn J Cancer Res. 1993;84(5):582–588. | |
Yumita N, Sasaki K, Umemura S, Yukawa A, Nishigaki R. Sonodynamically induced antitumor effect of gallium-porphyrin complex by focused ultrasound on experimental kidney tumor. Cancer Lett. 1997;112(1):79–86. | |
Wang HP, Liu QH, Zhang K, et al. Comparison between sonodynamic and photodynamic effect on MDA-MB-231 cells. J Photochem Photobiol B. 2013;127:182–191. | |
Yumita N, Nishigaki R, Sakata I, Nakajima S, Umemura S. Sonodynamically induced antitumor effect of 4-formyloximethylidene-3-hydroxyl-2-vinyl-deuterio-porphynyl(IX)-6, 7-diaspartic acid (ATX-S10). Jpn J Cancer Res. 2000;91(2):255–260. | |
Hu JM, Wang XB, Zhang K, et al. Sinoporphyrin sodium: a novel sensitizer in sonodynamic therapy. Anticancer Drugs. 2013;25(2):174–182. | |
Fang QC, Yang D. A porphyrin dimer combined with an ether bond and its manufacturing method. Patent ZL200910179116.5. People’s Republic of China; 2012. | |
Li CF, Zhang K, Wang P, et al. Sonodynamic antitumor effect of a novel sonosensitizer on S180 solid tumor. Biopharm Drug Dispos. 2014;35(1):50–59. | |
Wang HP, Wang XB, Wang P, Zhang K, Yang S, Liu QH. Ultrasound enhances the efficacy of chlorin E6-mediated photodynamic therapy in MDA-MB-231 cells. Ultrasound Med Biol. 2013;39(9):1713–1724. | |
Jiang ZH, Shi R, Li C, Wang AP. Inhibitory effects of DVDMS-2- based-photodynamic therapy on the growth of tumor and in vitro in vivo. Teratog Carcinog Mutagen. 2013;25(3):163–167. | |
James NS, Ohulchanskyy TY, Chen Y, et al. Comparative tumor imaging and PDT efficacy of HPPH conjugated in the mono- and di-forms to various polymethine cyanine dyes: part- 2. Theranostics. 2013;3(9):703–718. | |
Gorman A, Killoran J, O’Shea C, Kenna T, Gallagher WM, O’Shea DF. In vitro demonstration of the heavy-atom effect for photodynamic therapy. J Am Chem Soc. 2004;126(34):10619–10631. | |
St Denis TG, Vecchio D, Zadlo A, et al. Thiocyanate potentiates antimicrobial photodynamic therapy: in situ generation of the sulfur trioxide radical anion by singlet oxygen. Free Radic Biol Med. 2013;65:800–810. | |
Yumita N, Iwase Y, Nishi K, et al. involvement of reactive oxygen species in sonodynamically induced apoptosis using a novel porphyrin derivative. Theranostics. 2012;2(9):880–888. | |
Su XM, Li YX, Wang P, Wang XB, et al. Protoporphyrin IX-mediated sonodynamic action induces apoptosis of K562 cells. Ultrasonics. 2014;54(1):275–284. | |
Maftoum-Costa M, Naves KT, Oliveira AL, Tedesco AC, da Silva NS, Pacheco-Soares C. Mitochondria, endoplasmic reticulum and actin fiC. Mit behavior after PDT with chloroaluminum phthalocyanine liposomal in HeLa cells. Cell Biol Int. 2008;32(8):1024–1028. | |
Oleinick NL, Morris RL, Belichenko I. The role of apoptosis in response to photodynamic therapy: what, where, why, and how. Photochem Photobiol Sci. 2002;1(1):1–21. | |
Kluck RM, Bossy-Wetzel E, Green DR, Newmeyer DD. The release of cytochrome c from mitochondria: a primary site for Bcl-2 regulation of apoptosis. Science. 1997;275(5303):1132–1136. | |
Li H, Kolluri SK, Gu J, et al. Cytochrome c release and apoptosis induced by mitochondrial targeting of nuclear orphan receptor TR3. Science. 2000;289(5482):1159–1164. | |
Su XM, Wang P, Wang XB, Guo L, Li S, Liu QH. Involvement of MAPK activation and ROS generation in human leukemia U937 cells undergoing apoptosis in response to sonodynamic therapy. Int J Radiat Biol. 2013;89(11):915–927. | |
Ha YM, Park MK, Kim HJ, et al. High concentrations of ascorbic acid induces apoptosis of human gastric cancer cell by p38-MAP kinase-dependent up-regulation of transferrin receptor. Cancer Lett. 2009;277(1):48–54. | |
Cool SK, Geers B, Roels S, et al. Coupling of drug containing liposomes to microbubbles improves ultrasound triggered drug delivery in mice. J Control Release. 2013;172(3):885–893. |
 © 2014 The Author(s). This work is published and licensed by Dove Medical Press Limited. The full terms of this license are available at https://www.dovepress.com/terms.php and incorporate the Creative Commons Attribution - Non Commercial (unported, v3.0) License.
By accessing the work you hereby accept the Terms. Non-commercial uses of the work are permitted without any further permission from Dove Medical Press Limited, provided the work is properly attributed. For permission for commercial use of this work, please see paragraphs 4.2 and 5 of our Terms.
© 2014 The Author(s). This work is published and licensed by Dove Medical Press Limited. The full terms of this license are available at https://www.dovepress.com/terms.php and incorporate the Creative Commons Attribution - Non Commercial (unported, v3.0) License.
By accessing the work you hereby accept the Terms. Non-commercial uses of the work are permitted without any further permission from Dove Medical Press Limited, provided the work is properly attributed. For permission for commercial use of this work, please see paragraphs 4.2 and 5 of our Terms.