")
Back to Journals » OncoTargets and Therapy » Volume 13
Simultaneous Treatment with Soluble Forms of GAS1 and PTEN Reduces Invasiveness and Induces Death of Pancreatic Cancer Cells
Authors Daniel-García L, Vergara P, Navarrete A, González RO, Segovia J
Received 30 April 2020
Accepted for publication 6 September 2020
Published 17 November 2020 Volume 2020:13 Pages 11769—11779
DOI https://doi.org/10.2147/OTT.S260671
Checked for plagiarism Yes
Review by Single anonymous peer review
Peer reviewer comments 2
Editor who approved publication: Dr Jianmin Xu
Lizbeth Daniel-García,1 Paula Vergara,1 Araceli Navarrete,1 Rosa O González,2 Jose Segovia1
1Departamento de Fisiología, Biofísica y Neurociencias, Centro de Investigación y de Estudios Avanzados del IPN, Mexico City 07300, Mexico; 2Departamento de Matemáticas, Universidad Autónoma Metropolitana-Iztapala, Mexico City 09340, México
Correspondence: Jose Segovia
Departamento de Fisiología, Biofísica y Neurociencias, Centro de Investigación y de Estudios Avanzados del IPN, Av. IPN # 2508, Mexico City 07300, México
Tel +52 55 5747-3958
Fax +52 55 5061-3754
Email [email protected]
Introduction: Pancreatic carcinoma cells exhibit a pronounced tendency to invade along and through intra and extrapancreatic nerves, even during the early stages of the disease, a phenomenon called perineural invasion (PNI). Thus, we sought to determine the effects of the simultaneous expression of soluble forms of GAS1 and PTEN (tGAS1 and PTEN-L) inhibiting tumor growth and invasiveness.
Materials and Methods: We employed a lentiviral system to simultaneously express tGAS1 and PTEN-L; in order to determine the effects of the treatments, cell viability and apoptosis as well as the expression of the transgenes by ELISA and intracellular signaling as ascertained by the activation of AKT and ERK1/2 were measured; cell invasiveness was determined using a Boyden chamber assay; and the effects of the treatment were measured in vivo in a mouse model.
Results: In the present work, we show that the combined treatment with tGAS1 and PTEN-L inhibits the growth of pancreatic cancer cells, by reducing the activities of both AKT and ERK 1/2, decreases cell invasiveness, and restrains tumor growth in a mouse model.
Conclusion: The combined administration of tGAS1 and PTEN-L could be a valuable adjunct therapy for the treatment of pancreatic cancer.
Keywords: growth arrest specific 1, PTEN-L, pancreatic cancer, perineural invasion, artemin, GFRα 3
Introduction
Pancreatic cancer is a very aggressive disease with a poor prognosis and it is expected to become the second leading cause of cancer death.1 A crucial process of pancreatic tumor spread is Perineural Invasion (PNI), a form of cancer progression in which tumor cells invade (around or through) nerves and indicates a poor clinical outcome associated with pain, paresthesia, augmented cancer recurrence, and reduced patient survival.2–4 PNI is a common occurrence in various cancer types including prostate, head and neck, breast, colon and gastric.5–9 Glial Cell Derived Neurotrophic Factor (GDNF) is found in intrapancreatic nerves as well as in normal pancreas and it is highly expressed in pancreatic cancer together with RET and the GFRα1 receptor, and the expression of both molecules correlates with cell invasion, survival, proliferation and decreased survival after surgical resection.10 On the other hand, the phosphorylation of RET induced by the GDNF-GFRα1 complex activates both ERK and AKT, which in turn induces PNI and proliferation of pancreatic adenocarcinoma cells (PDAC).11 GDNF and Artemin (ARTN), a ligand of the GDNF family, are present in the pancreatic cancer environment, as well as the GFRα1 and GFRα3 receptors, which are released by the PDACs themselves, and also by intra and extrapancreatic nerves into the perineural space.12 Soluble forms of GFRα1 released from nerves stimulate the movement of RET-expressing cancer cells along a chemotactic gradient of members of the GDNF family of ligands (GFLs), to invade the perineural space and move along nerve fibers toward the central nervous system.12 This invasive process, as previously mentioned, is linked to poor prognosis, neuropathy and tumor-related pain. Artemin promotes invasiveness and neurotrophic activity of pancreatic adenocarcinoma. Moreover, the presence of ARTN has also been observed in other types of cancer such as endometrial, breast, and non-small cell lung carcinoma and it is related to proliferation and metastasis.13
On one hand, Growth Arrest Specific 1 (GAS1) is a 37 kDa protein anchored to the external cell membrane by a glycosylphosphatidylinositol molecule (GPI) capable of inducing cell arrest and apoptosis of different tumors including glioma, and neuroblastoma.14,15 GAS1 inhibits the GDNF-induced phosphorylation of RET on Tyr 1062 and thus causes an important decrease in AKT phosphorylation; this process facilitates the dephosphorylation of BAD that then translocates to the mitochondria and promotes the release of Cytochrome-C into the cytosol which activates caspase-9 and caspase-3, which in turn induces apoptosis.16 We previously demonstrated the effect of tGAS1, a soluble form of GAS1, inhibiting the growth of MDA-MB-231 human breast cancer cells.17 Interestingly, the MDA-MB-231 cells lack both RET and GFRα117 but express ARTN and GFRα3. Although RET is not present in MDA-MB-231 cells, GFRα-GFL complexes can initiate signaling in a RET-independent manner, probably through the adhesion of molecules such as NCAM, which induces Fyn that in turn inhibits cell adhesion.18,19
On the other hand, phosphatase and tensin homolog deleted on chromosome 10 (PTEN) is a molecule with a central function in counteracting phosphatidylinositol 3-kinase (PI3K) signaling.20,21 The fact that PI3K and its mediator AKT are constitutively activated in pancreatic cancer, might be the result of the aberrant expression of their natural antagonist PTEN, which can also regulate ERK1/2.22 PTEN decreases AKT activity and survival-proliferative pathways, making PTEN one of the most important tumor suppressors. Moreover, PTEN acts as a tumor suppressor in pancreatic cancer23 and a soluble form of PTEN (PTEN-L) that is released from producer cells and enters into tumor cells reduces tumor growth.24 Furthermore, we recently determined an additive effect of the simultaneous effect of tGAS1 and PTEN-L inhibiting glioma growth.25
This information prompted us to study whether the combined administration of tGAS1-PTEN-L could inhibit cancer cell invasion in vitro and tumor growth in a murine pancreatic cancer model. Interestingly, HPAF-II pancreatic cancer cells do not express GDNF, RET, PTEN, or GFRα1. However, they express ARTN and GFRα3, and the application of tGAS1-PTEN-L inhibits the activation of ERK1/2 and AKT in an RET-independent manner. Furthermore, tGAS1 and PTEN-L inhibited the invasion of pancreatic cancer cells, and the lentiviral-mediated delivery of tGAS1-PTEN-L prevented pancreatic tumor growth in a murine model.
Materials and Methods
Cell Culture
HPAF-II human pancreatic cancer cells were cultured in RPMI-1640 medium supplemented with 10% fetal bovine serum (Gibco by Life Technologies), 100 U/mL of Penicillin, 100 µg/mL of Streptomycin (Gibco by Life Technologies), and maintained at 37°C in a 95% air, 5% CO2 atmosphere. SH-SY5Y human neuroblastoma cells and U-87 MG human glioblastoma cells were cultured in DMEM-HG (Dulbecco’s Modified Eagle Medium High-Glucose) (Gibco by Life Technologies) supplemented with 10% heat-inactivated fetal bovine serum (Gibco by Life Technologies), 2 mM L-glutamine (Sigma-Aldrich), 100 U/mL of Penicillin, 100 µg/mL of Streptomycin (Gibco by Life Technologies), and maintained at 37°C in a 95% air, 5% CO2 atmosphere. Cells lines were obtained from ATCC.
Reverse Transcription PCR
Total RNA extraction was performed using the Trizol Reagent (Invitrogen), according to the manufacturer’s instructions. Subsequently, 2 μg of RNA was treated with DNAse (Invitrogen) and retro-transcribed to cDNA using M-MLV reverse transcriptase (Invitrogen), to perform the PCR. To amplify human gas1, the following primers were used: forward 5′-CTGTGCCTGATGGCGCTGCTGC-3′ and reverse 5ʹ-ATGAGGGCCGAGATGCAGTGA-3ʹ, for human β-actin: forward 5′-TGGCACCACACCTTCTACA-3′ and reverse 5′-TCACGCACGATTTCCC-3′. To amplify human gdnf, the following primers were used: forward 5ʹ- GAAGTTATGGGATGTCGTGGC-3ʹ and reverse 5ʹ-GACAGGTCATCATCAAAGGCG-3ʹ. To amplify human artemin, the following primers were used: forward 5ʹ-CAGCCTAAAAGACACCAGAGAC-3ʹ and reverse 5ʹ-GCACTTTCAACCAAGCAACTGC-3ʹ. To amplify human gfrα1, the following primers were used: forward 5´-CTGCAGCACCAAGTACCGCA-3ʹ and reverse 5ʹ-ACCTTGACTCTGGCTGGCAGT-3ʹ. To amplify human gfrα3, the following primers were used: forward 5ʹ-CTCTGCCTCAAGTTTGCCATG-3ʹ and reverse 5ʹ-CAGGGTTTTCATTCTGGTGTGC-3ʹ. To amplify human ret, the following primers were used: forward 5ʹ-GGGATCACCAGGAACTTCTCC-3ʹ and reverse 5ʹ-GGGAGGCGTTCTCTTTCAGC-3ʹ. PCR products were obtained after 40 cycles of amplification with an annealing temperature of 55ºC–66ºC.
Transfection of Expression Vectors
For all treatments, 1×10⁶ HPAF-II cells were seeded in 60 mm dishes and grown until they reached a confluence of approximately 80–90%. After 24 h, cells were transfected using Lipofectamine 3000 (Invitrogen) according to the manufacturer’s protocol, with each of the following expression plasmids: tGAS1 (pLenti6.3/TO/V5-tGAS1), and PTEN-L (JpExpress404 PTEN-Long); or combinations: tGAS1 and PTEN-LONG (PTEN-L) (pLenti6.3/TO/V5-tGAS1 and JpExpress404 PTEN-Long), previously described.31 As a control, pDsRed2-N1 (Red Fluorescent Protein) was transfected, Lipofectamine only treated cells and non-treated cells were also used as controls. All transfections were carried out under the same conditions: 10 μg of plasmids and 24 μL of Lipofectamine 3000 (Invitrogen, Cat. # L3000001).
Cellular Viability Assays
Cell viability was determined by the Trypan Blue exclusion technique (Sigma Aldrich), at different times after exposure to the treatments.
Western Blot Analysis
Protein extraction was performed using a lysis buffer containing a protease inhibitor cocktail (Complete; Sigma-Aldrich), and protein quantification was performed using the bicinchoninic acid method (Pierce; Rockford, IL). 50 μg of protein per condition was run on SDS-PAGE gels and then transferred onto PVDF membranes (BioRad), which were subsequently blocked for 1 h with a solution of 5% skim milk/in TBS/Tween 0.1%. Membranes were incubated overnight with primary antibodies against PTEN (A2B1) (diluted 1:250; Cat No. 7974, Santa Cruz Biotechnology), AKT (diluted 1:5000; Cat No. 4691, Cell Signaling Technology), phospho-AKT (diluted 1:1000; Cat No. 9271, Cell Signaling Technology), β-Actin (diluted 1:10,000; Cat No. A3854, Sigma Aldrich), ERK1/2 (diluted 1:5000; Cat No. 9102S, Cell Signaling Technology) and pERK1/2 (diluted 1:500; Cat No. 9106S, Cell Signaling Technology). Subsequent washes were performed with TBS/Tween 0.1% and then membranes were incubated for 1 h with anti-rabbit and anti-mouse secondary antibodies diluted 1:3000 (Invitrogen), followed by washes with TBS/0.1% Tween. The presence of the proteins was revealed by chemiluminescence (Perkin-Elmer). Images were captured and analyzed using a UVP BioImaging System and LabWorks Image Acquisition and Analysis Software (UVP, Inc. Upland, CA).
Determination of Apoptosis
Proteins were obtained and quantified from cell cultures and tumors as described in the precedent section. 50 μg of protein per condition was run on SDS-PAGE gels and then transferred into PVDF membranes (BioRad) which were subsequently blocked for 1 h with a solution of 5% skim milk/in TBS/Tween 0.1%. Membranes were incubated overnight with primary antibodies against human Caspase-3 (diluted 1:300; Cat No. 9662, Cell Signaling Technology). Subsequent washes were performed with TBS/Tween 0.1% and then membranes were incubated for 1 h with anti-rabbit diluted 1:500 (Invitrogen), followed by washes with TBS/0.1% Tween. The presence of proteins was revealed by chemiluminescence (Perkin-Elmer). Images were captured and analyzed as previously described.
Primary Culture of Dorsal Root Ganglion Cells
Dorsal root ganglia (DRG), from postnatal 2–7 day-old CD1 mice were used for in vitro invasiveness assays. All animal procedures were performed according to current Mexican legislation NOM-062-ZOO-1999 (SAGARPA) and in agreement with the Guide for the Care and Use of Laboratory Animals of the National Institutes of Health (NIH) and approved by the Institutional Committee (CICUAL del CINVESTAV). DRG were incubated at 37°C in a 95% air and 5% CO2 atmosphere for 30 min and mechanically dissociated with a pasteur pipette. The product of this procedure was centrifuged for 2 min in RPMI and washed with cold Balanced Hank’s Saline Solution (HBSS) (Gibco by Life Technologies); this procedure was performed three times. After the last wash, the supernatant was removed, and the cell suspension was placed in a 35 mm culture dish (Corning) with 12 x 10 mm coverslips (Corning) pretreated with poly-L-lysine (Sigma-Aldrich). Cells were incubated in Neurobasal medium with supplements: B27 (Gibco B-27 supplement 50X, Cat No. 17504-044) N2 (Gibco N-2 supplement 100X, Cat No. 17502-048), Pyruvate, 2mM L-glutamine (Sigma-Aldrich), 100 U/mL of Penicillin and 100 µg/mL of Streptomycin (Gibco by Life Technologies), and maintained at 37°C in a 95% air and 5% CO2 atmosphere.
Immunofluorescence
Cultures of DRG were fixed with 4% p-formaldehyde (Sigma-Aldrich) prepared in PBS (pH 7.4) and incubated with 1% BSA (Jackson ImmunoResearch) and the antibody against β-Tubulin-III (TUJ-1) (diluted 1:500, Cat No. MCA-1B12, Encor Biotechnology). The secondary antibody was a Fluorescein (FITC)-Affinipure Goat-Anti-Mouse IgG (H+L) (diluted 1:300 Cat No. 115-095-003, Jackson ImmunoResearch). Cells were counterstained with DAPI to reveal the nuclei. Images were obtained with an Olympus BX51 epifluorescence microscope coupled to a CoolSNAP-Procf Color camera with the Image-Pro PLUS software (Media Cybernetics, Inc.).
Effect of Soluble Forms of tGAS1, PTEN-L and tGAS1-PTEN-L on Neural Invasion
Conditioned media from cells transfected with the expression plasmids tGAS1, PTEN and tGAS1-PTEN-L were obtained from HPAF-II cells transfected with Lipofectamine 3000 (Invitrogen). The conditioned media were centrifuged and filtered before their application.
In vitro Invasion Assay
Invasion assays were performed using a modified Boyden chamber method in 24-well plates containing 12 cell culture inserts with 8 µm pore size membranes (Costar, Corning Inc.). Briefly, 50 μL of Matrigel (Falcon) was added into culture inserts and kept for 1 h at 37ºC. Cancer cells were seeded onto the upper chamber of 24-well plates at a density of 3×10⁴ cells in serum free culture medium. The lower chambers were seeded with DRG cells (see Materials and Methods) and cells incubated with the media obtained from cultures containing tGAS1, PTEN-L and tGAS1-PTEN-L, and control media containing 10% FBS. Cells were allowed to invade through the Matrigel-coated membrane for 48 h and non-invading cells were removed from the top membrane. Cells were stained with 0.1% crystal violet and cells that crossed the filters counted.
Lentiviral Production
Lentiviral vectors were obtained as previously described.25 Briefly, pLenti6.3/TO/V5-tGAS1-p2A-PTEN-L and pLenti6.3/TO/V5-EGFP were produced according to the manufacturer’s protocol (ViraPowerTM HiPerformTM T-RExTM GatewayTM Expression System. Invitrogen) and independently transfected into HEK 293FT cells using Lipofectamine 3000 (Invitrogen, Cat No. L3000001). After 48 h, culture media containing the lentivirus were collected, spin-dried, filtered and concentrated. The viral title was subsequently determined according to the manufacturer’s protocol.
Determination of GAS1 and PTEN Levels
ELISA was performed using commercial kits for human Gas1 DuoSet ELISA (R&D Systems, USA; Cat No. DY2636), and for human PTEN (Cell Signaling Technology, USA; Cat No. #7882), according to the manufacturer’s instructions.
In vivo Tumor Model
Experiments were performed according to current Mexican legislation NOM-062-ZOO-1999 (SAGARPA) and in agreement with the Guide for the Care and Use of Laboratory Animals of the National Institutes of Health and approved by the Institutional Committee (CICUAL del CINVESTAV). Animals (nu/nu male mice) were maintained with ad libitum access to food and water in aseptic conditions with climate and light-controlled systems. 1×10⁶ HPAF-II cells were subcutaneously inoculated into the flanks of 6–8-week-old male nude mice (nu/nu) and allowed to grow until the tumor volume reached approximately 30 mm3. Animals were then injected intratumorally for 3 days (days 0, 2 and 4) with 1.5 × 10⁶ vp (viral particles) of tGAS1-p2A-PTEN-L virus, EGFP lentivirus, or culture medium without serum, at a final volume of 6 μL. Tumor growth was monitored and tumor volume was calculated using the following formula: V = (length × width2)/2. Four weeks after the initiation of the treatments, animals were sacrificed by cervical dislocation, tumors dissected, weighted, homogenized, and processed for protein extraction with a lysis buffer containing a protease inhibitor cocktail (Complete; Sigma-Aldrich) to determine the expression of AKT, ERK1/2, and their phosphorylated forms and caspase-3 by Western blot assays, as previously described.
Statistical Analysis
For cell viability, protein levels determined by Western blot analysis, invasion assay, tumor weight and levels of GAS1, PTEN by ELISA in tumors we used one-way ANOVA followed by Duncan´s or Tukey’s multiple comparison test. For the analysis of tumor growth, in vivo data of tumor volume with independent observations through time on the same experimental unit were analyzed using a split-plot method, according to the following model for tumor volume: Vi,j,k= μ+ Tri + εij + tk+ [Tr *t]i,k + δi,j,k; where εij ~ N[0,σ2 fp] and δi,j,k ~ N[0, σ2 sp] (where fp is full plot and sp is split plot), treatments (Tr) i = 1, 2 and 3 stand for vehicle, EGFP, and tGAS1-PTEN-L, repetitions j = 1, 2, and 3, time k = 0, 2, 4, 6, 8, 10,13,16,19 and 28 days, Duncan’s post-hoc tests were performed to show differences among the treatments and treatments’ time interaction. Tests were performed using either the NCSS or the SPSS software. p<0.05 was considered significant.
Results
Characterization of HPAF-II Pancreatic Cancer Cells
The goal of this study was to evaluate the effect of the administration of tGAS1-PTEN-L on pancreatic cancer cell growth, survival and invasiveness. Thus, we first determined the phenotypic characteristics of the HPAF-II human pancreatic cancer cells used in this work. We performed RT-PCR assays to assess the expression of gas1, gdnf, artemin, gfrα1, gfrα3, and ret mRNAs utilizing confluent SH-SY5Y and U87 cells as positive controls. The cells express artemin and gfrα3, but do not express gas1, gdnf, gfrα1 or ret (Figure 1A). Moreover, they do not express PTEN, as demonstrated by Western blot analysis (Figure 1B). Therefore, these cells are a good model to study the effects of GAS1 and PTEN inhibiting cancer growth and invasiveness.
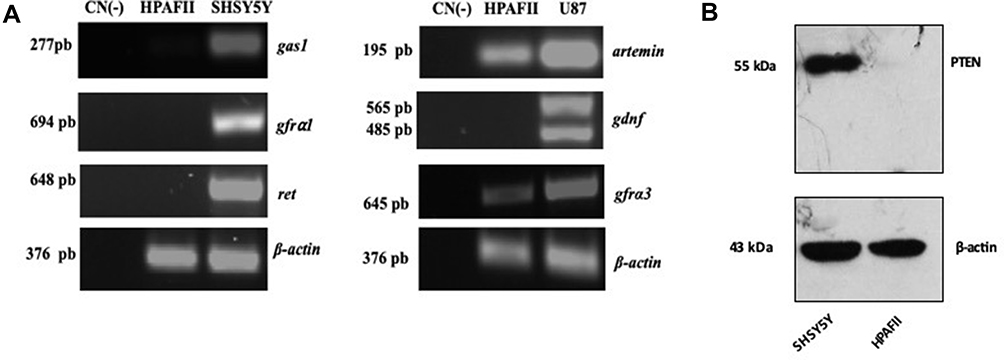 |
Figure 1 Characterization of HPAF-II pancreatic cancer cells. (A) HPAF-II cells do not express gas1, gfrα1, ret, or gdnf but express both artemin and its receptor gfrα3. SHSY5Y and U87-MG cells were used as positive controls. (B) HPAF-II cells do not express PTEN, as assessed by Western blot analysis; SH-SY5Y cells were used as positive control; β-actin is the loading control. |
Effects of tGAS1, PTEN and tGAS1-PTEN-L on the Viability of Pancreatic Cancer Cells
To compare the effect of soluble forms of tGAS1 and PTEN on cell viability, we transfected the plasmids coding for tGAS1, PTEN-L and tGAS1-PTEN-L together, and assessed their effects on the viability of HPAF-II cells for 24, 48, 72 and 96 h. As controls, we used cells treated only with Lipofectamine, cells transfected with a vector expressing red fluorescent protein (RFP) and cells without treatment. It was observed that both tGAS1 and PTEN-L had a significant effect on reducing the viability of HPAF-II cells; however, we also observed that the simultaneous transfection of tGAS1 and PTEN-L had a better effect reducing cell viability than when the factors were independently used (Figure 2).
 |
Figure 2 Comparison of the effect of soluble forms of GAS1 and PTEN on cell viability. The graphs show the percentage of viable HPAF-II cells, as determined by Trypan blue exclusion at different times after transfection with GAS1, PTEN, or both simultaneously transfected (24, 48, 72 and 96 h). Controls were non-treated HPAF-II cells, cells treated with Lipofectamine or transfected with the Red Fluorescent Protein plasmid (RFP). tGAS1 and PTEN-L were more effective together than when individually transfected. One-way ANOVA followed by Duncan´s test. *p< 0.05, **p<0.01, ***p<0.001; n= 3. |
Effects of Soluble tGAS1 and PTEN-L and tGAS-PTEN-L on the Activities of ERK and AKT and Apoptosis of HPAF-II Cancer Cells
To evaluate the molecular mechanism underlying the effect of tGAS1, PTEN-L and the simultaneous application of tGAS1-PTEN-L on cell viability, we determined the activity of signaling pathways associated with these proteins: AKT and ERK1/2. HPAF-II cells were transfected independently with tGAS1, PTEN-L and tGAS1-PTEN-L together, as controls, we used cells treated only with Lipofectamine, with RFP and control non-treated cells. Forty-eight hours after transfection, it was observed that PTEN-L induced a significant decrease in AKT activity (Figure 3A). Although a decrease was observed, tGAS1 did not significantly reduce AKT phosphorylation (Figure 3A). On the other hand, both tGAS1 and PTEN-L induced significant decreases in ERK 1/2 phosphorylation, an effect that was even stronger when they were simultaneously transfected (Figure 3B). To determine whether cell death was associated with the reduction of cell survival, we assessed the activation of caspase-3 as a marker of apoptosis. We observed a discrete activation of caspase-3, after exposure to tGAS1, but a more intense effect after the treatment with PTEN-L, or the simultaneous expression of both agents (Figure 3C). These data show that the combined treatment with tGAS1 and PTEN-L induces an apoptotic process in HPAF-II cells.
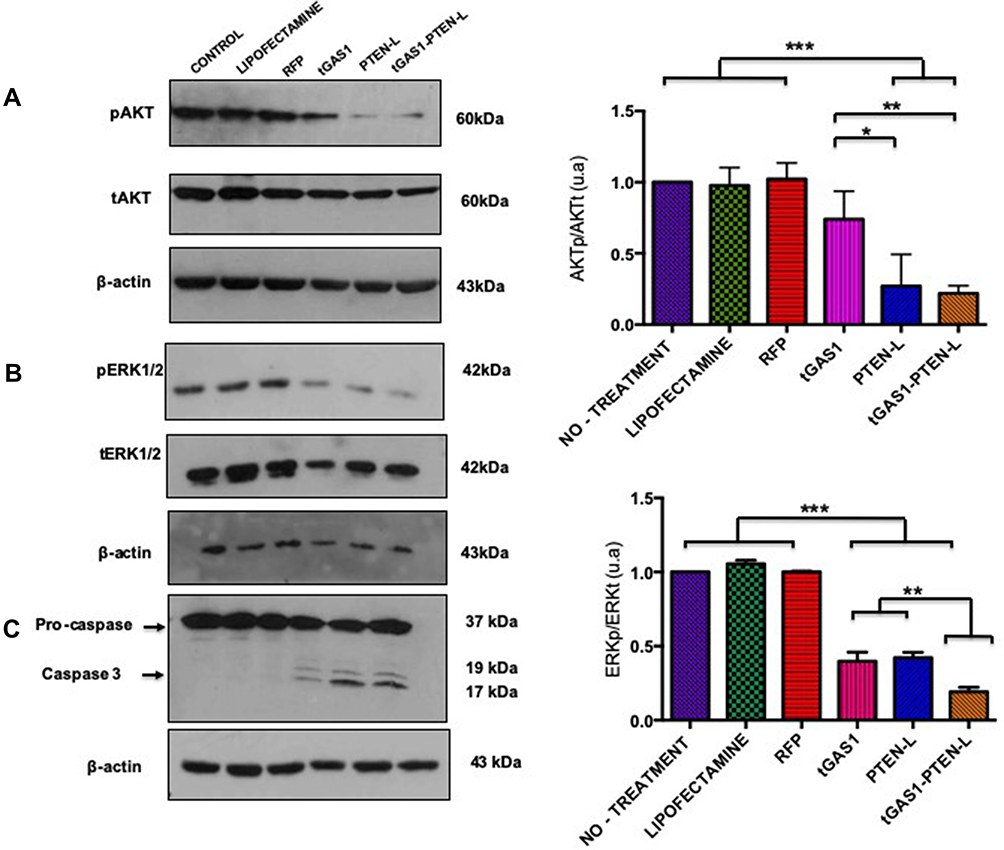 |
Figure 3 Effects of soluble forms of GAS1 and PTEN on intracellular signaling pathways and apoptosis. (A) Effects of the soluble forms of GAS1 and PTEN, and when transfected simultaneously on the activity of AKT (pAKT is the phosphorylated molecule and tAKT is the total); (B) effects of the soluble forms of GAS1 and PTEN, and transfected together on the activity of ERK1/2 (pERK1/2 is the phosphorylated molecule and tERK1/2 is the total); left panels show representative experiments and right panels, the statistical analysis of three independent experiments; (C) apoptosis demonstrated by the activation of caspase-3, β-Actin is the loading control. One-way ANOVA followed by Tukey’s multiple comparisons test. *p< 0.05, **p<0.01, ***p<0.001; n=3. |
Effect of the Administration of tGAS1-PTEN-L on Pancreatic Cancer Invasiveness
To explore the potential effects of tGAS1 and PTEN-L inhibiting the invasiveness of HPAF-II pancreatic cancer cells, we used an in vitro model employing Boyden chamber assays. To perform the assay, DRG neurons were seeded on the lower chamber, and HPAF-II cells on the upper chamber, on Matrigel-coated filters with 8.0 µm pores. We first determined the levels of both tGAS1 and PTEN-L in the conditioned media from producer HPAF-II cells transfected with the plasmids of tGAS1 and PTEN independently (Figure 4A). Interestingly, and in contrast to the effect on tumor cells, we observed that neither tGAS1 nor PTEN-L, or the combined treatment had any effect on the survival of DRG neurons, suggesting that these treatments do not affect healthy primary non-tumor cells (Figure 4B). We also showed that the primary cultures of DRG were enriched with neurons as shown by immunofluorescence against β-tubulin III. In these cultures over 95% of the cells were positive for this neuronal marker (Figure 4C). Next, we determined the effects of the treatments on the invasiveness of HPAF-II cells. As can be observed in Figure 4D, incubation with media containing tGAS1 or PTEN-L significantly reduced the migration of tumor cells. However, the combined application of the two agents had an even stronger effect. These data demonstrate that the presence of soluble forms of GAS1 and PTEN-L inhibits the invasiveness of pancreatic tumor cells to neurons.
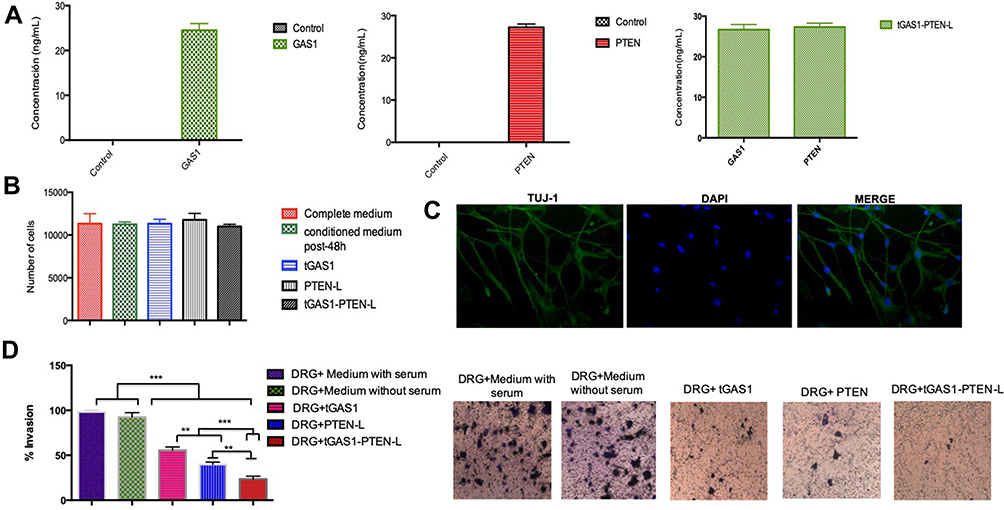 |
Figure 4 Effect of soluble forms of GAS1 and PTEN, and when simultaneously applied on pancreatic cancer cell invasiveness. (A) Levels of the soluble forms of GAS1 and PTEN in conditioned media from HPAF-II producer cells (left transfected with tGAS1; middle with PTEN-L; right with tGAS1 and PTEN-L); (B) number of DRG viable cells in the presence of the different media; (C) Immunofluorescence of DRG cultures against β-III Tubulin (left panel), nuclei revealed by DAPI (middle panel) and merge of the two channels (right panel). (D) Percentage of HPAF-II cancer cells that crossed the membrane towards DRG cells incubated in the presence of the different media; right panel shows a representative experiment. One-way ANOVA followed by Tukey’s multiple comparisons test. **p<0.01, ***p<0.001; n=3. |
In vivo Effects of the Lentiviral Vector Expressing Soluble Forms of tGAS1-PTEN-L
Since we had observed that the combined treatment with both tGAS1 and PTEN-L exerted the strongest effects inhibiting tumor cell growth and in vitro invasion of pancreatic cancer cells, we decided to test a lentiviral expression system that produces equimolar amounts of both proteins25 in an in vivo mouse model. HPAF-II cells were subcutaneously inoculated into the flanks of male nude mice. When the tumors reached a volume of approximately 30 mm3, they received tGAS1-p2A-PTEN-L-producing lentivirus, EGFP-producing lentivirus, or the same volume of vehicle on days 0, 2 and 4. Tumor growth was determined for 28 days after the start of the treatment when mice were sacrificed and a significant decrease in tumor growth was observed, as determined by tumor weight and volume in mice treated with the tGAS1-PTEN-L virus compared with controls (Figure 5).
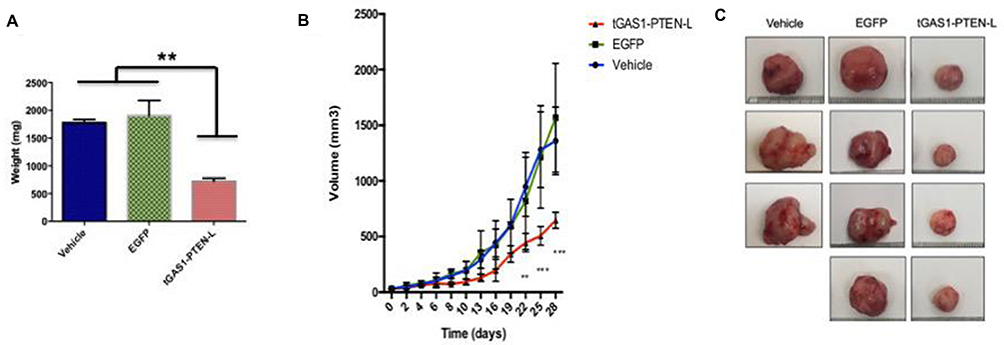 |
Figure 5 Effect of the expression of tGAS1-PTEN-L on tumor growth. HPAF-II cells were subcutaneously inoculated into the flanks of nu/nu mice, and when tumors reached approximately 30 mm3, they received the same volume of vehicle (culture medium without serum), EGFP-expressing virus, or tGAS1-PTEN-L-expressing virus. (A) Weight of tumors after the different treatments (B) Volume of tumors treated with tGAS1-PTEN-L compared with controls through time. (C) Size of the tumors after the treatments (ruler is in cm). ANOVA followed by Tukey´s (A); and Duncan´s post-hoc test (B). **p<0.01, ***p<0.001; n=3 for vehicle; n=4 for EGFP and n=4 for tGAS1-PTEN-L treatments. |
To determine the molecular mechanisms associated with the inhibition of tumor growth, we measured the levels of both GAS1 and PTEN in treated tumors. As previously reported, the expression of both agents induced high and equal levels of expression in treated tumors,25 whereas low or undetectable expression of both GAS1 and PTEN-L were seen in control tumors (Figure 6A and B). Consistent with prior in vitro results, we observed large decreases in the active forms of both AKT and ERK 1/2 in treated tumors, compared with the control groups (Figure 6C and D). Moreover, we also showed activation of caspase-3 in tGAS1-PTEN-L-treated tumors, compared to the controls, demonstrating an apoptotic process caused by the tGAS1-PTEN-L treatment (Figure 6E).
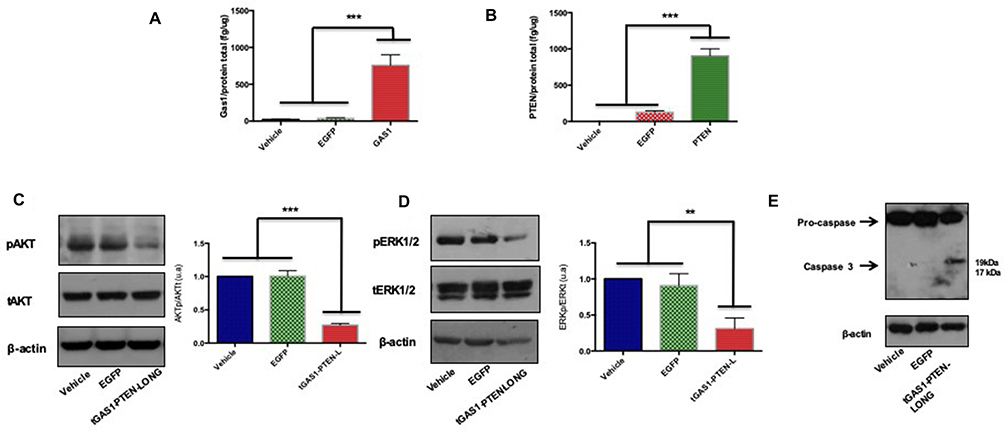 |
Figure 6 Effects of tGAS1-PTEN-L on tumor cells intracellular pathways and apoptosis. (A and B) Levels of Gas1 and PTEN in tumors; (C) activity of AKT in tumors, left representative experiment, right statistical analysis; (D) activity of ERK1/2 in tumors, left representative experiment, right statistical analysis; (E) apoptosis of tumor cells as shown by caspase-3 activity. One-way ANOVA followed by Tukey’s multiple comparisons test. **p<0.01, ***p<0.001; n=3–4 (A–D). |
Altogether, the present data demonstrate that the simultaneous expression of soluble forms of GAS1 and PTEN induces inhibition of cell growth, apoptosis and, interestingly, reduces the invasiveness of pancreatic cancer cells. Thus, the combined treatment seems to strike pancreatic cancer by both killing the cells and reducing PNI, a feature that facilitates metastasis, a major factor associated with the malignancy of pancreatic cancer.
Discussion
It is known that there is an interaction between pancreatic innervation and pancreatic cancer cells that facilitates PNI.26,27 The presence of GDNF, ARTN and their cognate receptors in pancreatic cancer indicates the participation of the GDNF family in tumor progression and invasiveness.13,18,28 Also, a role for the GDNF-RET signaling pathway is recognized in cancer28 as well as the capacity of ARTN to promote pancreatic cancer invasion.13 Moreover, the capacity of ARTN to induce migration and invasiveness of pancreatic cancer cells is mediated by CXCR4; this effect is mediated by the activation of AKT and ERK 1/2 signaling, that stimulates the accumulation of NF-κB which in turn promotes the expression of CXCR4.29 On the other hand, PTEN is frequently deleted in pancreatic ductal adenocarcinoma (PDA), but it acts as a tumor suppressor regulating the NF-κB network, indicating the participation of the PTEN/PI3K pathway, inhibiting cancer growth.22
Based on the previous information, we considered that manipulating both the GDNF-family signaling pathways and the PI3K pathway could be a relevant approach to inhibit both cell survival and the invasiveness of pancreatic cancer cells. GAS1 is a protein that induces cell arrest and apoptosis of glioma and neuroblastoma cells by blocking the GDNF/RET pathway.14–16 Interestingly, we have also observed that GAS1 inhibits tumor growth and angiogenesis in a breast cancer model, through a RET-independent mechanism that involves interfering with the ARTN-GFRα3-mediated signaling and the corresponding inhibition of ERK1/2.17 Moreover, we have generated a soluble, releasable form of GAS1 (tGAS1) that exerts both autocrine and paracrine effects eliminating tumor cells.30 GAS1 released from producing cells can also potentially interact with soluble GFRαs, as occurs with nerve-released GFRα1 that enhances PNI.31 PTEN-L is a soluble form of PTEN that decreases PI3K signaling in both producing cells and neighboring cells, inhibiting tumor growth.24 We have previously employed a p2A lentiviral system that produces equimolar amounts of tGAS1 and PTEN-L and observed an additive effect inhibiting glioma growth.25
In the present work, we used the pancreatic cancer cell line HPAF-II and determined that these cells neither express GAS1 nor PTEN, making them a good model to test the effects of the expression of these tumor suppressors. Moreover, the cells express Artemin and GFRα3, but no GDNF, GFRα1 or RET (Figure 1). We tested the effect of the independent treatments with GAS1, PTEN-L or both together on the viability of HPAF-II cells, and it was observed that both agents decreased the number of viable cells, but that their combined effect was significantly more marked (Figure 2). To determine the molecular mechanisms underlying these effects, we ascertained the activities of AKT and ERK 1/2. As can be seen in Figure 3A, tGAS1 did not significantly reduce AKT phosphorylation, whereas PTEN-L had a significant effect on reducing AKT activity. On the other hand, both GAS1 and PTEN-L reduced the activity of ERK 1/2 and when both proteins were simultaneously expressed in HPAF-II cells, their effect was the best one (Figure 3B). These results are consistent with our previous data, showing that GAS1 does not reduce the activation of AKT, in cells lacking RET, but that it is capable of inhibiting ERK 1/2 activation in a RET-independent manner, through an Artemin-GFRα3-dependent, non-canonical pathway.17
Taking into consideration previous reports that showed ARTN facilitates pancreatic cancer invasiveness,13 we assessed the effects of soluble forms of GAS1 and PTEN-L in an in vitro assay of tumor cell invasiveness toward a primary culture of DRG neurons. It was observed that both tGAS1 and PTEN-L reduced the invasiveness of HPAF-II cells, but that the effect was more pronounced when both proteins were expressed together, indicating an additive effect (Figure 4). It is conceivable that the effects of tGAS1 and PTEN-L could be caused, at least in part, by their capacity to kill primary neurons of the culture, thus reducing the production and release of attractant substances. However, neither tGAS1 nor PTEN-L had any effect reducing the viability of DRG neurons. All these data indicate that soluble GAS1 is capable of inhibiting the invasiveness of pancreatic cancer cells, likely by interfering with attractant molecules released by nerves, such as soluble GFRαs.
Considering that the effects of the combined application of tGAS1 and PTEN-L on pancreatic tumor cell viability and invasiveness were stronger than when used independently (Figures 2 and 4), we decided to employ a lentiviral p2A-enabled dual expression system, that allows the production of both proteins in equimolar amounts, to test its effects in a mouse cancer model. The viral vector was directly injected into tumors inoculated in mice and we observed a significant decrease in tumor growth, compared to control mice and with mice receiving a virus expressing a reporter gene (Figure 5). To ascertain the molecular mechanisms responsible for the inhibition of tumor growth, we determined that tGAS1 and PTEN-L were expressed in tumors injected with the tGAS1-PTEN-L-producing virus but with low or undetectable levels in the control groups (Figure 6). Moreover, in agreement with the in vitro results presented in this paper, and our previous reports, we determined a significant reduction of the phosphorylation of both AKT and ERK 1/2 in tumors expressing tGAS1 and PTEN-L, which are also associated with apoptosis, as revealed by the activation of caspase-3 (Figure 6).
Conclusions
The results presented in this paper show that the simultaneous application of soluble forms of GAS1 and PTEN inhibits the growth and invasiveness of pancreatic cancer cells. These effects are caused by inhibiting both the AKT and ERK 1/2 intracellular signaling pathways. The advantage of using soluble forms of GAS1 and PTEN is that they have autocrine effects on producing cells but also paracrine effects on neighboring cells, thus augmenting the therapeutic range of the combined treatment. Moreover, it is also likely that soluble GAS1 interferes with nerve-secreted GFRαs, reducing PNI and the resulting formation of metastasis. We consider that the combined administration of tGAS1 and PTEN-L could be a valuable adjunct therapy for the treatment of pancreatic cancer.
Acknowledgments
This work was partially supported by Conacyt grant 1563 Fronteras de la Ciencia (J.S.); LDG received a scholarship (237332) from Conacyt. We want to thank Dr. Alejandro Sandoval Romero, School of Medicine FES Iztacala (UNAM) for expert advice and support for DRG primary cultures and R. Sánchez for laboratory assistance.
Disclosure
The authors declare that they have no conflict of interest.
References
1. Haeberle L, Esposito I. Pathology of pancreatic cancer. Transl Gastroenterol Hepatol. 2019;4:1–12. doi:10.21037/tgh.2019.06.02
2. Amit M, Na’Ara S, Gil Z. Mechanisms of cancer dissemination along nerves. Nat Rev Cancer. 2016;16(6):399–408. doi:10.1038/nrc.2016.38
3. Alrawashdeh W, Jones R, Dumartin L, et al. Perineural invasion in pancreatic cancer: proteomic analysis and in vitro modelling. Mol Oncol. 2019;13(5):1075–1091. doi:10.1002/1878-0261.12463
4. Liang D, Shi S, Xu J, et al. New insights into perineural invasion of pancreatic cancer: more than pain. Biochim Biophys Acta Rev Cancer. 2016;1865(2):111–122. doi:10.1016/j.bbcan.2016.01.002
5. Kuang AG, Nickel JC, Andriole GL, Castro-Santamaria R, Freedland SJ, Moreira DM. Both acute and chronic inflammation are associated with less perineural invasion in men with prostate cancer on repeat biopsy. BJU Int. 2019;123(1):91–97. doi:10.1111/bju.14428
6. Schmitd LB, Scanlon CS, D’Silva NJ. Perineural invasion in head and neck cancer. J Dent Res. 2018;97(7):742–750. doi:10.1177/0022034518756297
7. Elfituri O, Emmadi R. Perineural and intraneural involvement in ductal carcinoma in-situ of breast: case report. Pathol Res Pract. 2019;215(11):1–3. doi:10.1016/j.prp.2019.152624
8. Leijssen LGJ, Dinaux AM, Taylor MS, et al. Perineural invasion is a prognostic but not a predictive factor in nonmetastatic colon cancer. Dis Colon Rectum. 2019;62(10):1212–1221. doi:10.1097/DCR.0000000000001450
9. Lu L, Ma GQ, Liu XD, et al. Correlation between GDF15, MMP7 and gastric cancer and its prognosis. Eur Rev Med Pharmacol Sci. 2017;21(3):535–541.
10. Choi YD, Jung JY, Baek M, et al. APE1 promotes pancreatic cancer proliferation through GFRα1/Src/ERK axis-cascade signaling in response to GDNF. Int J Mol Sci. 2020;21(10):1–15. doi:10.3390/ijms21103586
11. Amit M, Na’Ara S, Leider-Trejo L, et al. Upregulation of RET induces perineurial invasion of pancreatic adenocarcinoma. Oncogene. 2017;36(23):3232–3239. doi:10.1038/onc.2016.483
12. Mulligan LM. GDNF and the RET receptor in cancer: new insights and therapeutic potential. Front Physiol. 2019;10(JAN):1–13. doi:10.3389/fphys.2018.01873
13. Gao L, Bo H, Wang Y, Zhang J, Zhu M. Neurotrophic factor artemin promotes invasiveness and neurotrophic function of pancreatic adenocarcinoma in vivo and in vitro. Pancreas. 2015;44(1):134–143. doi:10.1097/MPA.0000000000000223
14. Segovia J, Zarco N. Gas1 is a pleiotropic regulator of cellular functions: from embryonic development to molecular actions in cancer gene therapy. Mini Rev Med Chem. 2014;14(14):1139–1147. doi:10.2174/1389557514666141127142301
15. Zamorano A, Lamas M, Vergara P, Naranjo JR, Segovia J. Transcriptionally mediated gene targeting of gas1 to glioma cells elicits growth arrest and apoptosis. J Neurosci Res. 2003;71(2):256–263. doi:10.1002/jnr.10461
16. Zarco N, González-Ramírez R, González RO, Segovia J. GAS1 induces cell death through an intrinsic apoptotic pathway. Apoptosis. 2012;17(6):627–635. doi:10.1007/s10495-011-0696-8
17. Jiménez A, López-Ornelas A, Estudillo E, González-Mariscal L, González RO, Segovia J. A soluble form of GAS1 inhibits tumor growth and angiogenesis in a triple negative breast cancer model. Exp Cell Res. 2014;327(2):307–317. doi:10.1016/j.yexcr.2014.06.016
18. Ilieva M, Nielsen J, Korshunova I, et al. Artemin and an artemin-derived peptide, artefin, induce neuronal survival, and differentiation through ret and NCAM. Front Mol Neurosci. 2019;12(February):1–14. doi:10.3389/fnmol.2019.00047
19. Zhu S, Li Y, Bennertt S, et al. The role of glial cell line-derived neurotrophic factor family member artemin in neurological disorders and cancers. Cell Prolif 2020;53(7):1–10.
20. Worby CA, Dixon JE. Pten. Annu Rev Biochem. 2014;83(1):641–669. doi:10.1146/annurev-biochem-082411-113907
21. Chen CY, Chen J, He L, Stiles BL. PTEN tumor suppressor and metabolic regulator. Front Endocrinol (Lausanne). 2018;9(JUL):1–12. doi:10.3389/fendo.2018.00338
22. Baer R, Cintas C, Therville N, Guillermet-Guibert J. Implication of PI3K/Akt pathway in pancreatic cancer: when PI3K isoforms matter? Adv Biol Regul. 2015;59:19–35. doi:10.1016/j.jbior.2015.05.001
23. Zhang H, Liu A, Feng X, et al. MiR-132 promotes the proliferation, invasion and migration of human pancreatic carcinoma by inhibition of the tumor suppressor gene PTEN. Prog Biophys Mol Biol. 2019;148:65–72. doi:10.1016/j.pbiomolbio.2017.09.019
24. Hopkins BD, Fine B, Steinbach N, et al. A secreted PTEN phosphatase that enters cells to alter signaling and survival. Science. 2013;341(6144):399–402. doi:10.1126/science.1234907
25. Sánchez-Hernández L, Hernández-Soto J, Vergara P, González RO, Segovia J. Additive effects of the combined expression of soluble forms of GAS1 and PTEN inhibiting glioblastoma growth. Gene Ther. 2018;25(6):439–449. doi:10.1038/s41434-018-0020-0
26. Gasparini G, Pellegatta M, Crippa S, et al. Nerves and pancreatic cancer: new insights into a dangerous relationship. Cancers (Basel). 2019;11(7):1–26. doi:10.3390/cancers11070893
27. Chen S-H, Zhang B-Y, Zhou B, Zhu C-Z, Sun L-Q, Feng Y-J. Perineural invasion of cancer: a complex crosstalk between cells and molecules in the perineural niche. Am J Cancer Res. 2019;9(1):1–21.
28. Fielder GC, Yang TWS, Razdan M, et al. The GDNF family: a role in cancer? Neoplasia (United States). 2018;20(1):99–117. doi:10.1016/j.neo.2017.10.010
29. Wang J, Wang H, Cai J, et al. Artemin regulates CXCR4 expression to induce migration and invasion in pancreatic cancer cells through activation of NF-κB signaling. Exp Cell Res. 2018;365(1):12–23. doi:10.1016/j.yexcr.2018.02.008
30. López-Ornelas A, Mejía-Castillo T, Vergara P, Segovia J. Lentiviral transfer of an inducible transgene expressing a soluble form of Gas1 causes glioma cell arrest, apoptosis and inhibits tumor growth. Cancer Gene Ther. 2011;18(2):87–99. doi:10.1038/cgt.2010.54
31. He S, Chen CH, Chernichenko N, et al. GFRα1 released by nerves enhances cancer cell perineural invasion through GDNF-RET signaling. Proc Natl Acad Sci U S A. 2014;111(19):E2008–E2017. doi:10.1073/pnas.1402944111
 © 2020 The Author(s). This work is published and licensed by Dove Medical Press Limited. The full terms of this license are available at https://www.dovepress.com/terms.php and incorporate the Creative Commons Attribution - Non Commercial (unported, v3.0) License.
By accessing the work you hereby accept the Terms. Non-commercial uses of the work are permitted without any further permission from Dove Medical Press Limited, provided the work is properly attributed. For permission for commercial use of this work, please see paragraphs 4.2 and 5 of our Terms.
© 2020 The Author(s). This work is published and licensed by Dove Medical Press Limited. The full terms of this license are available at https://www.dovepress.com/terms.php and incorporate the Creative Commons Attribution - Non Commercial (unported, v3.0) License.
By accessing the work you hereby accept the Terms. Non-commercial uses of the work are permitted without any further permission from Dove Medical Press Limited, provided the work is properly attributed. For permission for commercial use of this work, please see paragraphs 4.2 and 5 of our Terms.