")
Back to Journals » Drug Design, Development and Therapy » Volume 14
Simultaneous Quantitative Analysis of Six Proton-Pump Inhibitors with a Single Marker and Evaluation of Stability of Investigated Drugs in Polypropylene Syringes for Continuous Infusion Use
Authors Chen F, He X, Fang B, Wang S
Received 28 August 2020
Accepted for publication 23 November 2020
Published 24 December 2020 Volume 2020:14 Pages 5689—5698
DOI https://doi.org/10.2147/DDDT.S279302
Checked for plagiarism Yes
Review by Single anonymous peer review
Peer reviewer comments 2
Editor who approved publication: Professor Anastasios Lymperopoulos
Fuchao Chen,1,2,* Xudong He,2,* Baoxia Fang,2 Sicen Wang1,2
1School of Pharmacy, Xi’an Jiaotong University, Xi’an, Shanxi 710061, People’s Republic of China; 2Affiliated Dongfeng Hospital, Hubei University of Medicine, Shiyan, Hubei 442008, People’s Republic of China
*These authors contributed equally to this work
Correspondence: Sicen Wang
School of Pharmacy, Xi’an Jiaotong University, 76# Yanta West Road, Xi’an, Shanxi 710061, People’s Republic of China
Email [email protected]
Objective: We developed and validated a simple, convenient and reproducible method for simultaneous estimation of six proton-pump inhibitors (PPIs), omeprazole (OPZ), esomeprazole (EOPZ), lansoprazole (LPZ), pantoprazole (PPZ), rabeprazole (RPZ) and ilaprazole (IPZ) in pharmaceutical dosage forms by a single marker. Meanwhile, the stability of the cited PPIs in 0.9% sodium chloride injection stored in polypropylene syringes up to 48 hours for continuous infusion use was investigated.
Materials and Methods: The chromatographic separation was achieved on an InterSustain® C18 column (150 × 4.6 mm, 5 μm). The isocratic mobile phase made up of 0.05 M potassium dihydrogen phosphate buffer (pH 4.0): acetonitrile (65:35, v/v) was pumped through the column at a temperature maintained at 30°C and a flow rate of 1.0 mL/min. The relative retention time, UV spectral similarity and relative correction factors between OPZ and the other five PPIs were calculated and investigated using the quantitative analysis of multi-components with a single marker (QAMS) method. The stability study examined physical parameters, pH values and drug concentrations of the PPIs mixtures.
Results: Under these conditions, all cited PPIs were separated simultaneously at a retention time of 6.0, 7.3, 7.3, 9.9, 12.5 and 13.9 min for RPZ, OPZ, EOPZ, IPZ, PPZ and LPZ, respectively, with a total run time less than 20.0 min. Comparative analysis results indicated that there were no significant differences observed between the QAMS method and the external standard method. The percentage of initial concentration of each PPI gradually decreased during the storage time.
Conclusion: The proposed method, which is selective, economical and accurate, was applied successfully for determination of the cited PPIs in their respective pharmaceutical dosage forms. Admixtures of OPZ, EOPZ, PPZ, IPZ in 0.9% sodium chloride injection were stable for 24 hours and LPZ, RPZ in 0.9% sodium chloride injection were stable for 8 hours in polypropylene syringes.
Keywords: proton-pump inhibitors, quantitative analysis of multi-components with a single marker, relative correction factor, relative retention time, HPLC, stability
Introduction
Gastrointestinal disease is a difficult problem in today’s world with a high incidence including peptic ulcer, stress ulcers, Zollinger-Ellison syndrome, gastrointestinal hemorrhage, Helicobacter pylori infections, and gastro-esophageal reflux disease.1–4 Proton-pump inhibitors (PPIs) have been available for more than two decades for clinical use to treat gastrointestinal disease. They work by blocking the K+-H+- adenosine triphosphates enzyme system (the proton pump) and thereby inhibit gastric acid.5,6 The first PPI, omeprazole (OPZ), was introduced in 1989, and other drugs in the class now include esomeprazole (EOPZ), lansoprazole (LPZ), pantoprazole (PPZ), rabeprazole (RPZ) and ilaprazole (IPZ).7–10
OPZ is substituted benzimidazole and has the chemical name 5-methoxy-2- [[(4-methoxy-3, 5-dimethyl-2-pyridinyl) methyl] sulfinyl] −1H-benzimidazole. EOPZ is an S-enantiomer of omeprazole. It has been found to be superior to other racemic PPIs for increasing gastric pH and maintaining gastric alkalization in humans. LPZ is the only PPI with no substitutions on the benzimidazole ring; it has the chemically name 2-[[[3-Methyl-4-(2, 2, 2-trifluoroethoxy)-2-pyridyl] -methyl] sulfinyl]-1H-benzimidaze. RPZ as the chemical name 2-[[4-(3- methoxypropoxy) −3-methylpyridine−2-yl] methylsulfinyl]-1H-benzoimidazole. PPZ is the fourth PPI marketed in the US and has the chemically name 5-(2, 2-difluoromethoxy)-2-[[(3, 4-dimethoxy-2-pyridyl) methyl] sulfinyl]-1H-benzimidazole. IPZ is the latest PPI and has the chemically name 2-4- [[methoxy−3-methylpyridin-2-yl] methyl]thio]-5-[1H-pyrrol-1-yl]benzoimidazole.
Literature survey revealed that there are several HPLC methods available for simultaneous determination of two to five PPIs but there seem to be no reports concerning methods for the simultaneous determination of all six PPIs using HPLC in the commercial pharmaceutical preparations.11–27 At present, the simultaneous determination of multi-components by the external standard methods needs many expensive standard substances, lower selectivity, and a lot of time, thereby limiting its application. Quantitative analysis of multi-components by a single marker (QAMS), is an economical, convenient and environmentally sound method that simultaneously determines the concentrations of multi-components by a single reference standard. The QAMS model was established to study the quality control of Chinese herbal medicines, chemical drugs and drug impurities, and has been widely applied.28–34 Thus, the present research work was to develop an accurate and rapid HPLC method for the determination of the six PPIs by QAMS and external standard method (ESM). This method was successfully applied to the quality control of the cited PPIs in pharmaceutical formulation and evaluates the stability of the PPIs in 0.9% sodium chloride solution stored in polypropylene syringes for up to 48 hours for continuous infusion use.
Materials and Methods
Chemicals and Reagents
Six references of PPIs (Figure 1) and uridine were procured from the National Institute for Food and Drug Control (Beijing, China). All references were checked for purity by pharmacopeia methods which showed levels of 95.2%, 95.0%, 99.6%, 95.8%, 99.7%, 99.8% and 99.6% for OPZ, EOPZ, LPZ, PPZ, RPZ, IPZ and uridine, respectively. HPLC-grade acetonitrile was acquired from Tianjin Komio Chemical Reagent Co., Ltd. The following reagents were analytical grade: potassium dihydrogen phosphate, phosphoric acid, and triethylamine (Nanjing Chemical, Jiangsu, China). All aqueous solutions including the buffer for the mobile phase were prepared with Milli Q (Millipore, Milford, MA, USA) grade water. Branded formulations of OPZ, EOPZ, LPZ, PPZ, RPZ and IPZ were purchased from China National Pharmaceutical Group Co., Ltd (Beijing, China).
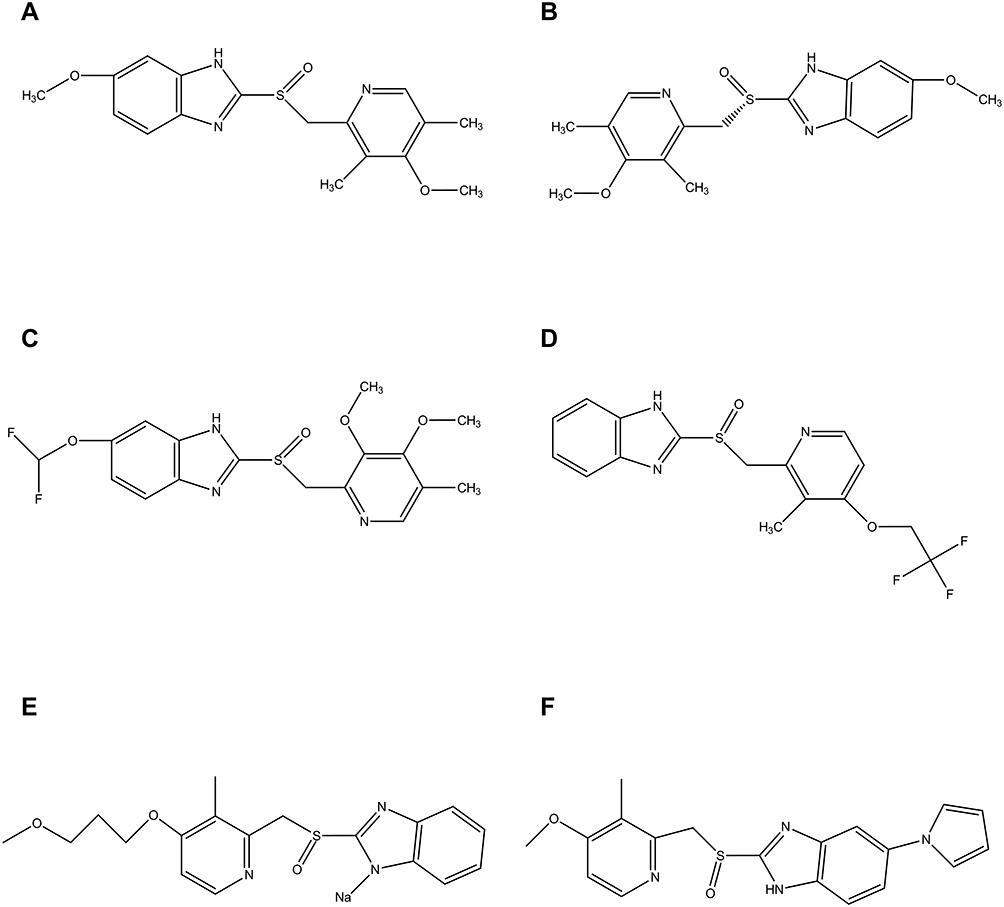 |
Figure 1 Chemical structure of OPZ (A), EOPZ (B), PPZ (C), LPZ (D), RPZ (E) and IPZ (F). |
Chromatographic System
The chromatographic system was Dionex Ultimate 3000 series (USA) equipped with a quaternary solvent delivery system, a temperature controlled auto injector, a column oven, a diode array detector and SHIMADZU InterSustain C18 (4.6 mm × 150 mm, 5 μm) column. Chromeleon Data system Software (Version 7.1) was used for data processing and evaluation. The isocratic mobile phase system consisting of 0.05 M potassium dihydrogen phosphate buffer (adjusting the pH to 4.0 with 2 M phosphoric acid): acetonitrile (65:35, v/v) was delivered at a flow rate of 1.0 mL·min−1.
Standard Stock Solutions and Sample Preparation
Standard stock solutions of each analyte and the uridine were prepared separately as 20 mg in 0.9% sodium chloride solution (except RPZ and IPZ, these being first dissolved in about 5 mL 0.1 M NaOH, respectively, before dilution to mark with 0.9% sodium chloride solution) and at 4–6 ºC. For the mixed working test solution was prepared by diluting the six standard stock solutions of PPIs as a certain concentration in 0.9% sodium chloride solution. For test sample solution, 1 mL of the drug injectable solution, which contains 4 mg OPZ, 4 mg EOPZ, 3 mg LPZ, 4 mg PPZ, 2 mg RPZ and 4 mg IPZ were transferred to a 100 mL volumetric flask, diluted to the volume with 0.9% sodium chloride solution and vortexed for about 1 minute. The solution was filtered through Nylon 0.45 µm membrane filter.
Method Validation
The method was validated as per ICH and FDA guidelines for specificity, linearity and range, accuracy, intra- and inter-day precision, and robustness. To investigate chromatographic selectivity and the stability of QAMS method, three different HPLC instruments were employed, including Dionex Ultimate 3000RS (Thermo Scientific, USA), Agilent 1260 series (Agilent Technologies, USA), and Shimadzu LC-20A (Shimadzu, Japan). Three models of chromatographic columns were employed, namely Agilent Zorbax Extend C18, Shimadzu HC-C18 column, and Kromasil C18 (150 mm × 4.6 mm, 5 um). Analysis was determined at the different pH value of the mobile phase of 3.8, 4.0, 4.2, at flow rates of 0.98 mL/min, 1.0 mL/min and 1.02 mL/min with the column temperatures of 29°C, 30°C and 31°C.
Establishment of the QAMS Method
UV Spectral Similarity Analysis
The mixed standard solutions were injected into HPLC under the above chromatographic conditions. The chromatogram map and ultraviolent spectrum were recorded. The original spectral, first-order spectral and second-order spectral similarity of the above six PPIs were examined. The spectral similarity analysis was done by the ChemStation software Version C.01.10 serves.
Computation of Relative Retention Time
The same mixed standard solutions of the six PPIs were tested with the above chromatographic conditions to identify the relative retention time (RRT) and the RSD %. The RRT is calculated by the following Equation (1).

Where tA, t0 and tR represents the relative retention time of analyte, urine pyrimidine and OPZ, respectively.
Computation of Relative Correction Factors
The QAMS method was applied to the quality control of the six PPIs by using relative correction factors (RCF) that were calculated based on each component, which was proportional to the detector within a certain range. OPZ was selected as the internal reference substance to calculate the RCFs by using Equation (2).

Where  is the peak area of internal reference substance,
  is the HPLC injection concentration of internal reference substance,
  is the peak area of component i, and
  is the HPLC injection concentration of component i in the sample solution. From Equation (2), we can deduce Equation (3).

We can calculate the concentration of each chemical component in the sample solution using Equation (3).
Similarity Evaluation of the QAMS and ESM Methods
As shown in the Section Sample Preparation, the amounts of individual compound in six PPIs samples were calculated by the method of QAMS and ESM. Comparative analysis between the QAMS with ESM method was calculated according to the cosine ratio value method.32–34
Stability Study of the PPIs in Mixtures
Based upon previously published meta-analyses and evidence-based guidelines on peptic ulcer, this study was carried out to mimic as closely as possible a projected routine use of the six PPI agents.6–10 Commercially available OPZ, EOPZ, LPZ, PPZ, RPZ or IPZ were mixed in 50 mL polypropylene syringes (Jierui, Weigao Med., Shangdong, China) of 0.9% sodium chloride injection at concentrations of 1.6 mg/mL, 1.6 mg/mL, 1.2 mg/mL, 1.6 mg/mL, 0.8 mg/mL and 0.8 mg/mL, respectively. All admixtures were investigated at room temperature (25±0.5°C) over 48 hours with light protection or light exposure. The physical parameters such as color change, presence of turbidity and precipitate or changes in the pH values were evaluated qualitatively whenever samples were withdrawn. The concentrations of OPZ, EOPZ, LPZ, PPZ, RPZ or IPZ were determined by the above-described HPLC–ESM method. All concentrations analyses were conducted in triplicate and designed to measure the amount of drug remaining of the initial concentrations. Drug stability was defined as 90% remaining of the initial value of each drug.
Results and Discussion
Optimization of Chromatographic Conditions
In this study, to obtain a good separation degree, higher theoretical plate number, and good symmetry of chromatographic peaks, different mobile phase conditions such as different pH values and buffering agents were investigated for a system adaptability test. Figure 2 shows the typical chromatogram for simultaneous separation of the six PPIs with different buffer pH. It was found that baseline separation of OPZ, EOPZ, LPZ, PPZ, RPZ and IPZ was achieved on InterSustain C18 column maintained at 30ºC using an isocratic mixture of 0.05 M potassium dihydrogen phosphate buffer (pH 4.0): acetonitrile (65:35, v/v) with 1.0 mL/min flow rate. The total run time was 20 min. The present proposed method was compared with the reported method in the literature and this comparison is shown in Table 1. Literature survey revealed that no method is available for simultaneous quantification of these six PPIs viz. OPZ, EOPZ, LPZ, PPZ, RPZ and IPZ in dosage forms.
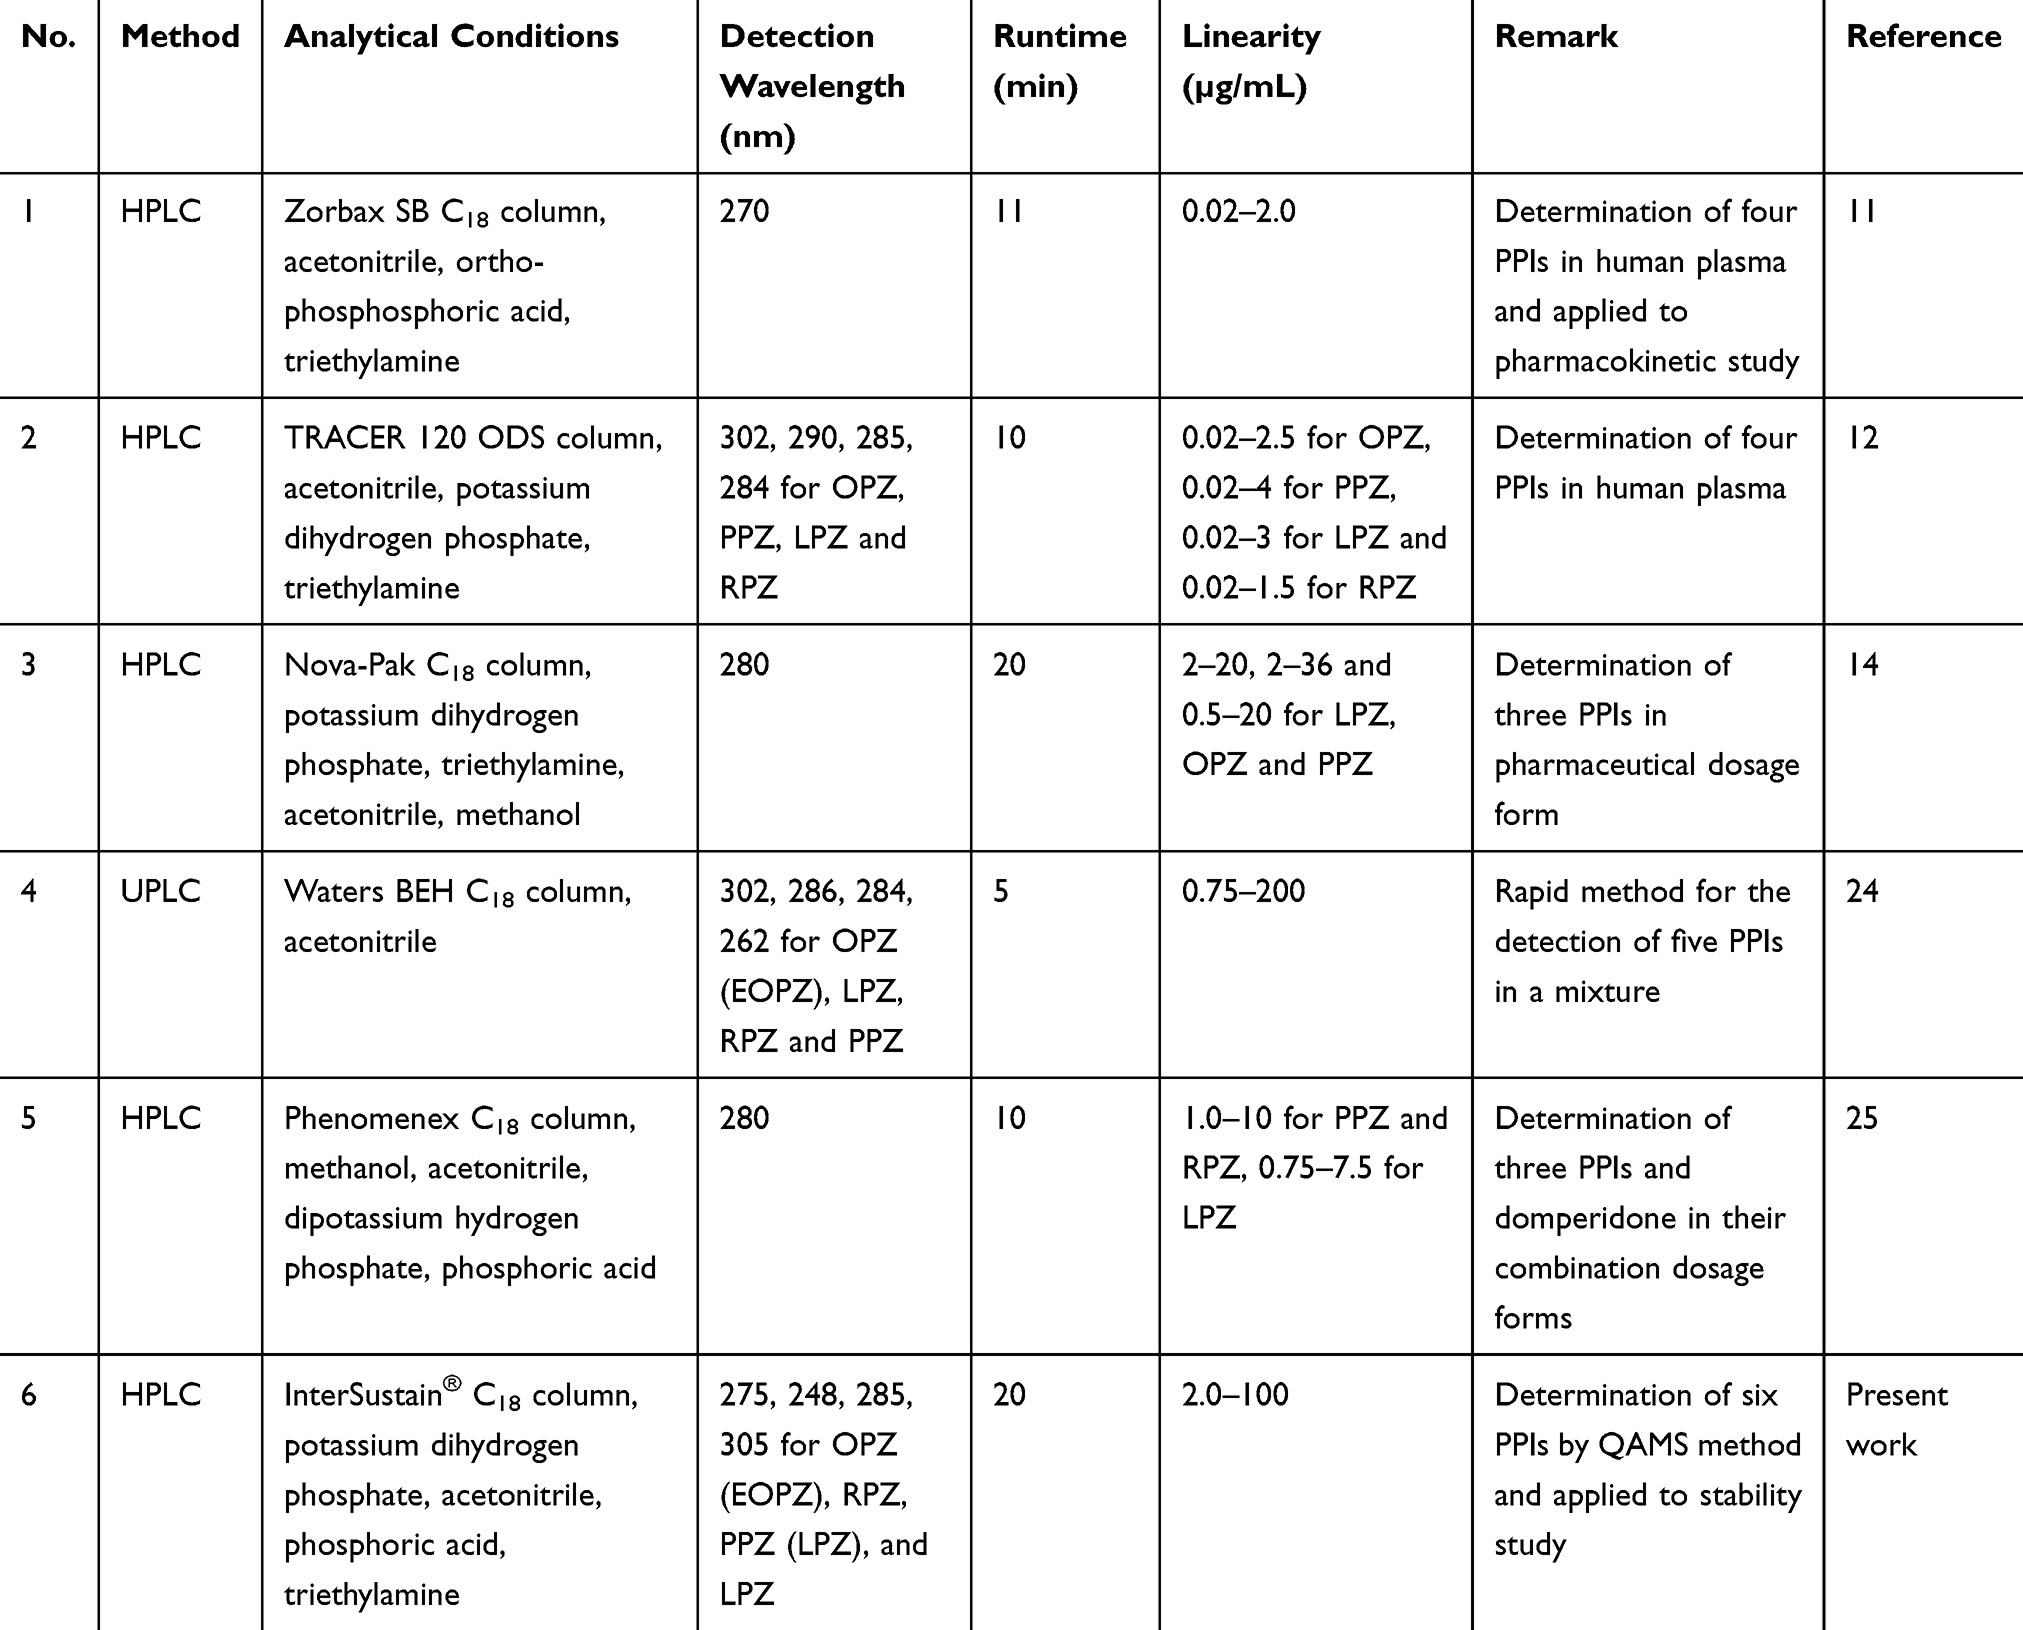 |
Table 1 Comparison of the Performance Characteristics of the Present Method with the Published Methods |
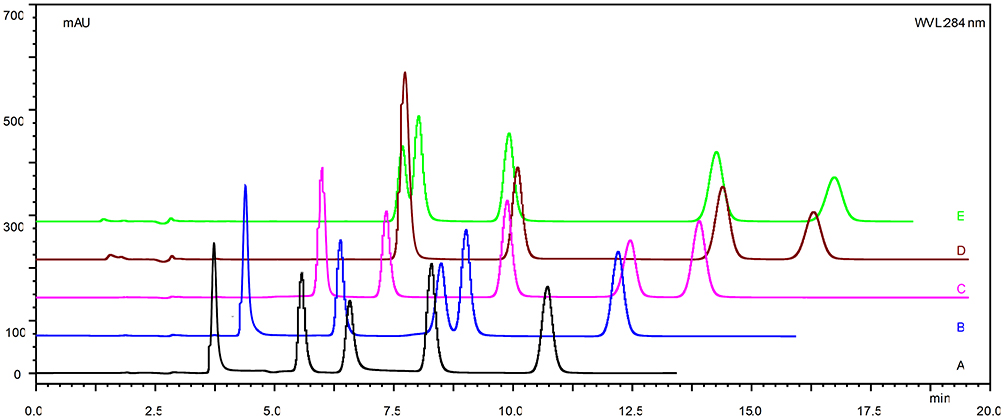 |
Figure 2 Typical HPLC chromatogram for simultaneous separation of OPZ (EOPZ), LPZ, PPZ, RPZ and IPZ. Chromatographic conditions were acetonitrile 0.05 mol/L: potassium dihydrogen phosphate (35: 65, v/v) and the buffer pH varied. (A) pH 3.0. (B) pH 3.5. (C) pH 4.0. (D) pH 5.0. (E) pH 6.0. |
Method Validation
Linear Range
On the basis of mentioned chromatographic conditions, a series volume of mixed standard solutions containing all the reference substances was taken by volume with 1 uL, 5 uL, 10 uL, 20 uL, 30 uL, 50 uL and then injected into HPLC to conduct analyses. The chromatogram was recorded and the reference curve was constructed by considering the concentrations of the reference solution (X) as abscissa and considering the peak area (Y) of the chromatogram as the vertical axis. The results are presented in Table 2, which illustrated that six reference substances of PPIs performed favorable linearity in their proper ranges.
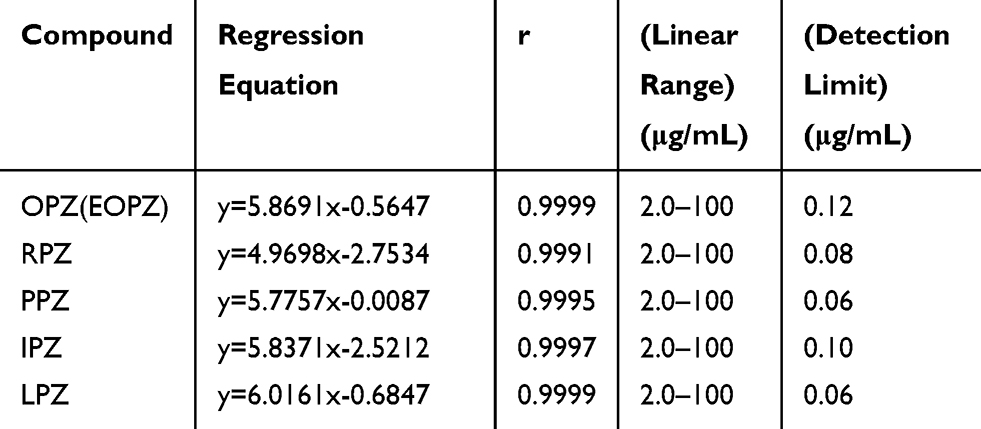 |
Table 2 Regression Equation, Correlation Coefficient (r), Linear Range and Detection Limit of the Six Proton-Pump Inhibitors |
Precision
The intra-day precision of this method was determined by injecting the mixed standard solutions of the six PPIs six times in one day. Inter-day precision of the method was also evaluated by analyzing the mixed standard solutions on different days (6 days). The results are presented in Table 3. The RSDs of the chromatographic peak area of OPZ, EOPZ, LPZ, PPZ, RPZ and IPZ were found to be less than 2.5%, which illustrated a high instrument precision and showed that the proposed method has favorable precision.
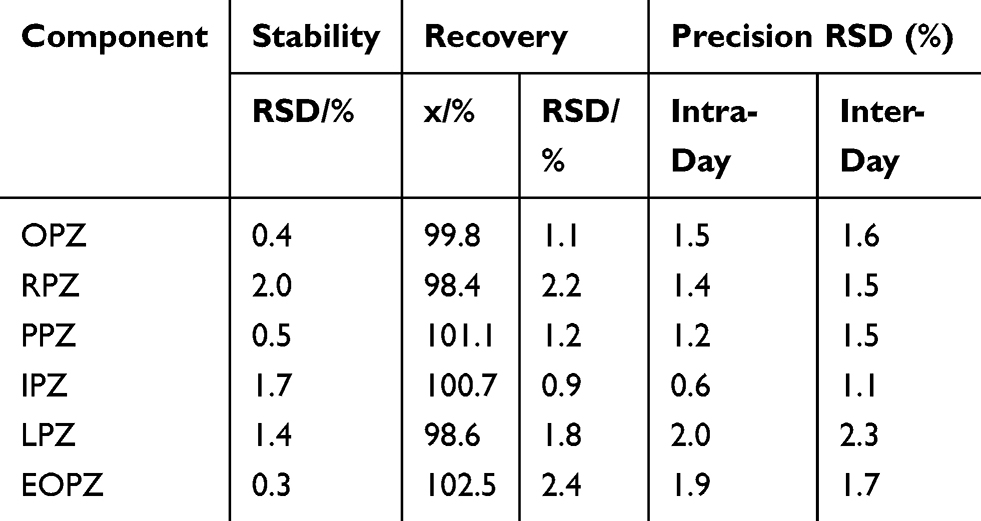 |
Table 3 Precision, Stability and Recovery Test Results of the HPLC Method |
Stability
The same mixed standard solution was firstly placed at room temperature for 1, 2, 4, 6, 8, 12 hours, and then injected into HPLC, respectively. The stability was evaluated in terms of RSD calculated according to the chromatographic peak area of these six reference substances. The results (Table 2) show the sample solution has high stability within 12 hours at the room temperature.
Recovery
For the recovery test, three known concentrations at the levels of 50%, 100% and 150% of targeted concentration of the mixed reference standards were spiked into nine sample solutions. The contents of the six PPIs were determined from the respective chromatograms. The percentage recovery for the amount added was calculated. The values are given in Table 3. The average recovery rates of the six PPIs were in the range of 98.4–102.5% and RSD 0.9–2.4%, which illustrated that the proposed method has favorable accuracy.
Validation of the QAMS Method
Spectral Similarity
The results of the original, first-order and second-order spectral similarity and the vector graph of the six PPIs are shown in Tables 4–6 and Figure 3. It was found that the original similarities of these six PPIs were close, but the first-order and second-order similarities of the six PPIs show more characteristic details, which further expands the difference between the PPIs and improves the accuracy of the characterization.
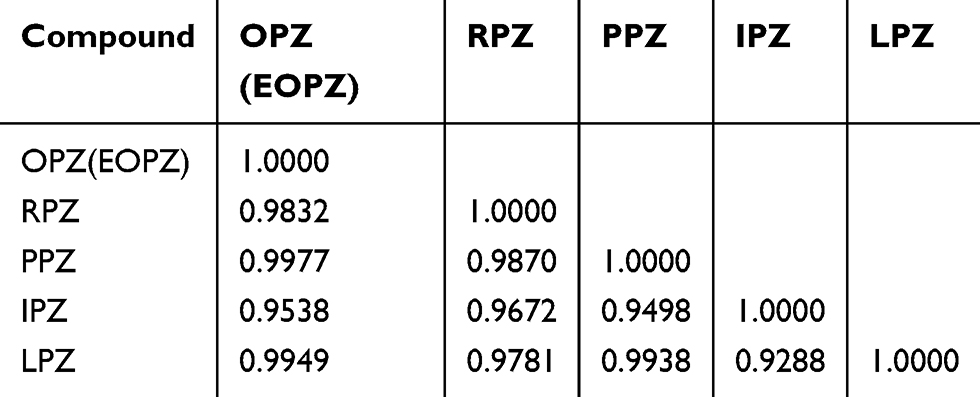 |
Table 4 UV Spectra Similarity of the Six Proton-Pump Inhibitors |
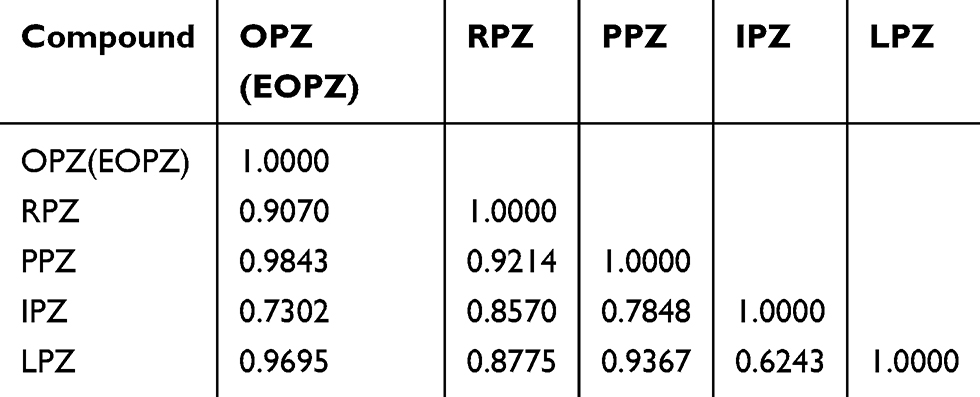 |
Table 5 1st UV Spectra Similarity of the Six Proton-Pump Inhibitors |
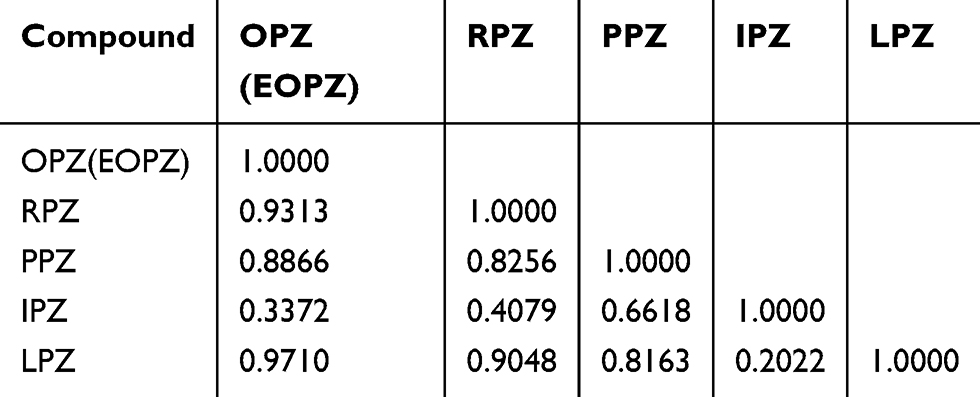 |
Table 6 2nd UV Spectra Similarity of the Six Proton-Pump Inhibitors |
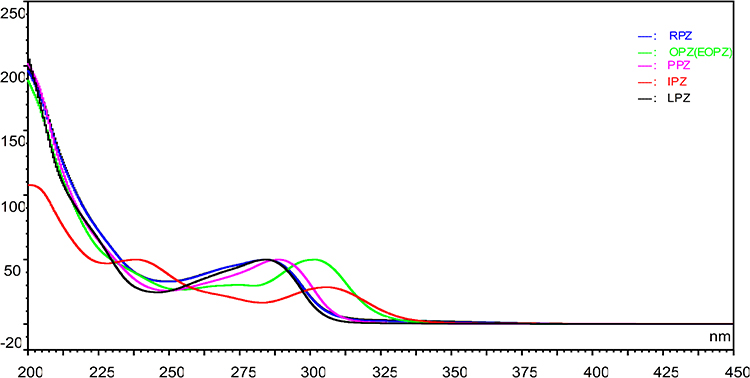 |
Figure 3 The UV spectra of OPZ (EOPZ), LPZ, PPZ, RPZ and IPZ. |
Calculation and Stability of the RRTs
In this study, OPZ was chosen as the internal standard substance of the QAMS method, because OPZ is low in price, available in large amounts and is obtained easily, firstly. In addition, as the internal standard substance, it has great separation and its chromatographic peak has no interference with adjacent substances. The main problem of the QAMS method is how to accurately locate the remaining five target peaks of EOPZ, LPZ, PPZ, RPZ and IPZ by only one single reference substance of OPZ. To solve this problem, the spectral similarity and RRTs were introduced; the two parameters could be used as the position markers of the other five PPIs’ peaks. The robustness of the RRTs for the six PPIs is shown in Table 7. The results revealed that these influencing parameters such as different instruments, chromatographic column packing, flow rates or flow volume of the mobile phase, and column temperatures did not exert any considerable influence on the RRTs (with RSD values lower than 5.0%). However, the changes of pH values of the mobile phase had some effects on the RRTs. Thus, the spectral similarity and RRTs was chosen to be another position marker of the target peaks when the reference was unavailable.
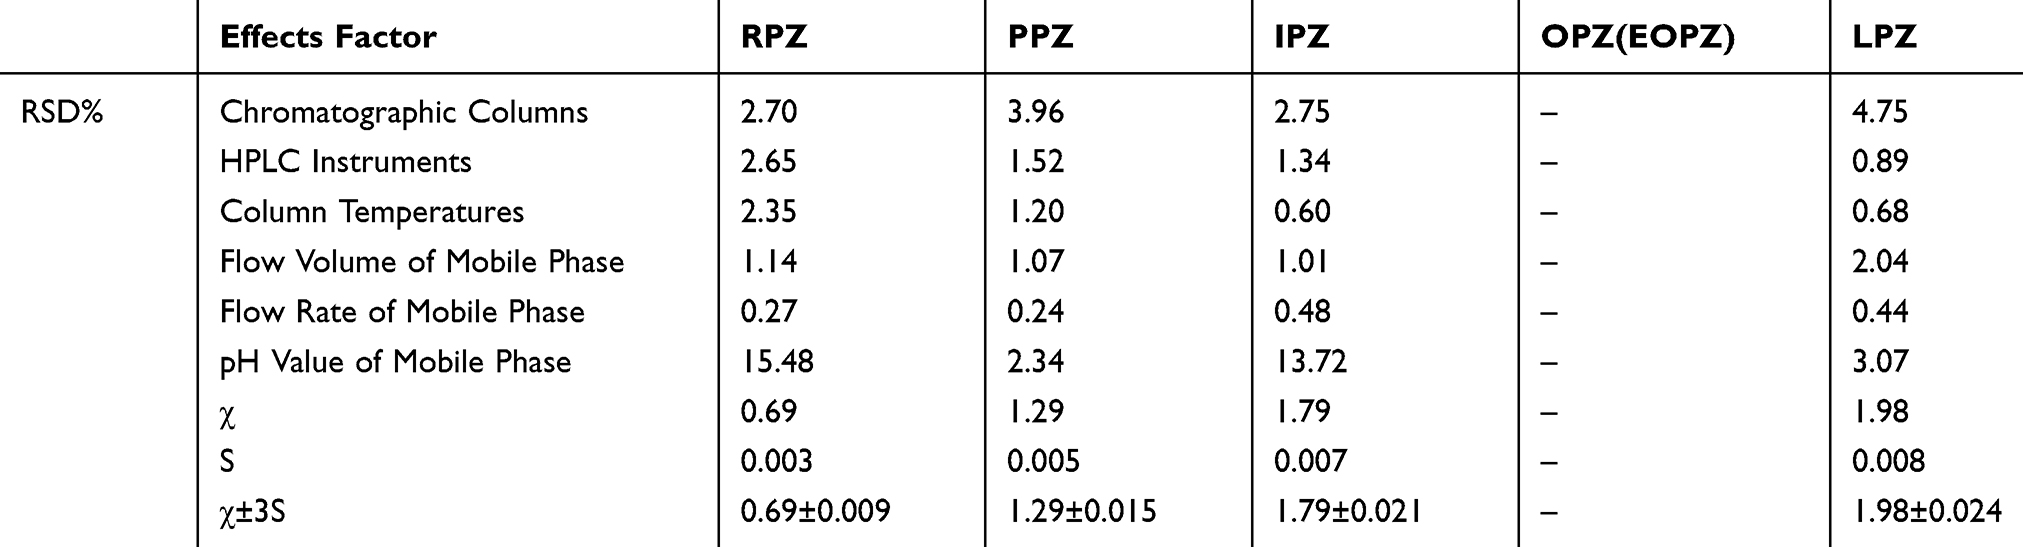 |
Table 7 Effects of Different Instruments, Columns, Column Temperatures, Flow Rates, Volume and pH on RRTs (n = 3) |
Calculation and Stability of the RCFs
The RCFs of the six PPIs are shown in Table 8. The results indicated that the values of RCFs had good repeatability in different experimental conditions. These results ensured that the HPLC-based QAMS analytical method could be well applied into routine analysis.
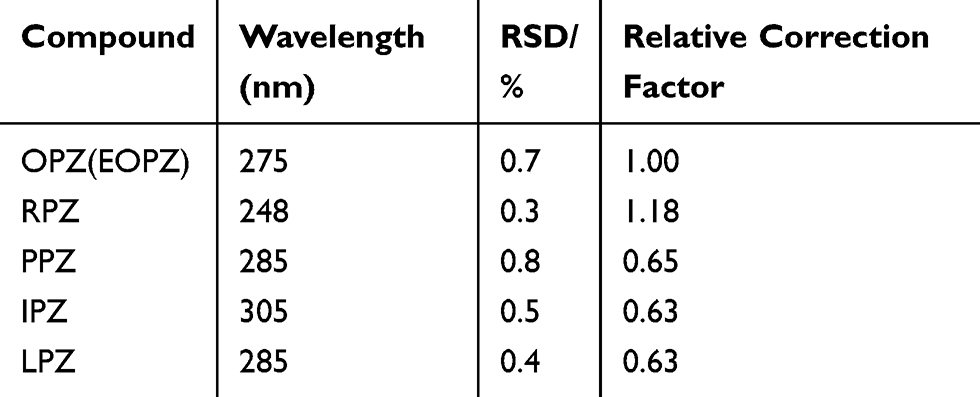 |
Table 8 Relative Correction Factor of the Six Proton-Pump Inhibitors |
Application of Proposed Method to Six PPIs Injectable Samples
The amounts of individual compound in the six PPIs injectable samples were calculated both by the QAMS and ESM methods and the results are shown in Table 9. Comparative analysis results indicated that there were no remarkable differences observed between the two analytical methods, which indicated that the method established above was accurate and reliable.
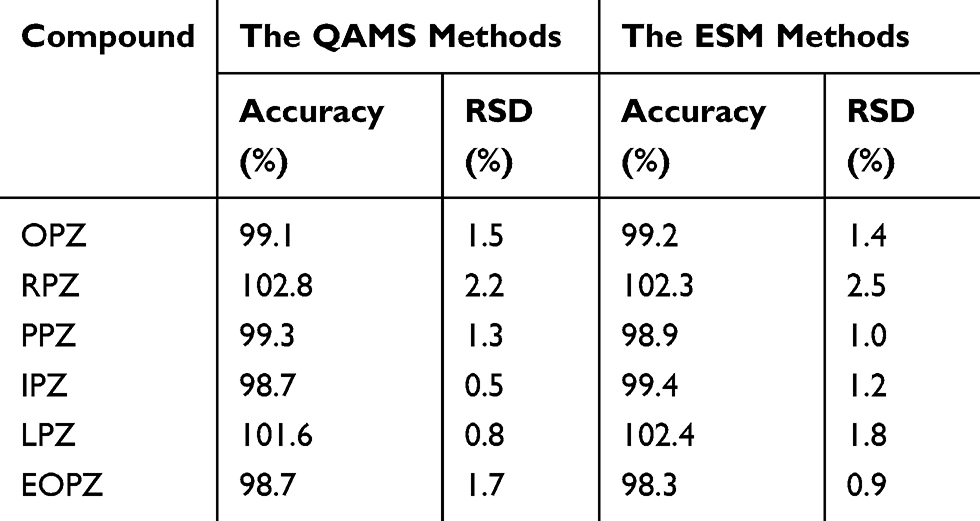 |
Table 9 Results of the Comparison of the Six Proton-Pump Inhibitors Samples |
Stability of Investigated PPIs in Mixtures
The mean concentrations over time of OPZ, EOPZ, LPZ, PPZ, RPZ and IPZ diluted with 0.9% sodium chloride injection and packaged in polypropylene syringes are outlined in Figure 4. Taking 90% stability as a limit, it clearly appears that OPZ, EOPZ, PPZ, and IPZ were stable for 24 hours and LPZ, RPZ were stable for 8 hours in polypropylene syringes at 25°C, respectively. The pH values of all the PPIs admixtures were between 9.0 and 10.5 and decreased by only about 0.8 units during the storage period; this change was considered insignificant. There were no visible signs of particulate matter of OPZ, EOPZ, LPZ, PPZ, and IPZ admixtures during the 48 hours study period. In contrast, a minor increase in color intensity (to light yellow) was noted in RPZ admixtures kept at 25°C for 8 hours. Thereafter, the yellow color deepens over time. It is known that the PPIs are either imidazopyridine derivatives or substituted pyridylmethylsulfinyl benzimidazole such as OPZ, EOPZ, LPZ, PPZ, RPZ and IPZ, etc. An important physical chemistry feature of PPIs is an instability to heat, light, and acidic media due to their special chemical structures.35 The rate of degradation of the investigated PPIs had a direct relationship with the basicity of benzimidazole nitrogen of individual PPIs.36 LPZ and RPZ with lipophilic weak base, seems to be especially sensitive to such attack compared with the other members of PPIs.
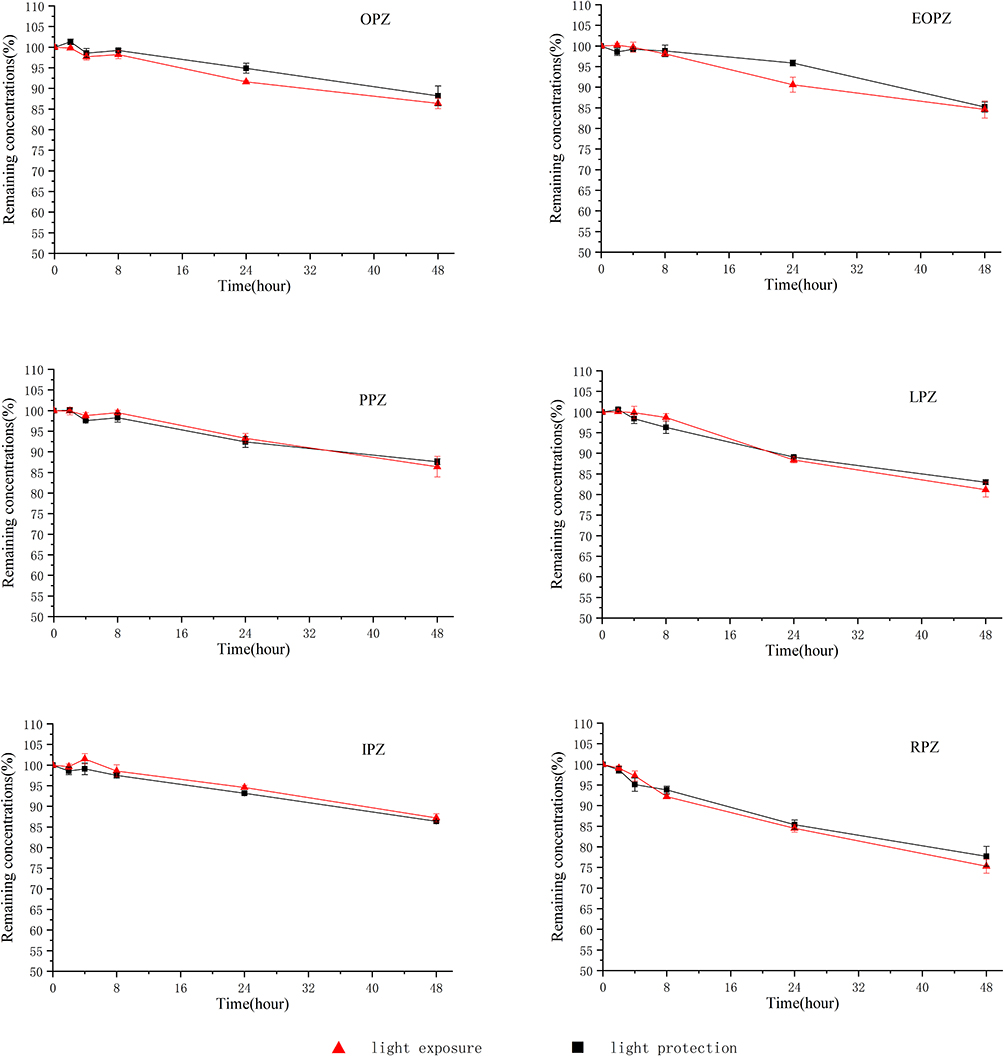 |
Figure 4 Drug concentrations (mean ± SD [%]; n=3) of OPZ, EOPZ, LPZ, PPZ, RPZ and IPZ in 0.9% sodium chloride injection when packaged in polypropylene syringes, and with light protection or light exposure over 48 hours at 25°C. |
Conclusion
The newly developed QAMS method is reported here for the first time to assess the quality of the contents of six PPIs simultaneously. This method proved to have good linearity, precision, recovery, stability and ruggedness and it can be used even when reference standards are unavailable. The established method has been successfully applied as part of hospital-based quality control of the six PPIs in their injection dosage form. In summary, the analytical method exhibited powerful potential for the quantitative analysis of PPIs in other medicinal materials. On the basis of the results of the stability study, OPZ, EOPZ, PPZ, IPZ in 0.9% sodium chloride injection were stable for 24 hours and LPZ, RPZ in 0.9% sodium chloride injection were stable for 8 hours in polypropylene syringes at 25°C.
Acknowledgments
The authors gratefully acknowledge the financial support for the research: Hubei Province health and family planning scientific research project, China (number WJ2015MB215) and Technology Key Program of Shiyan, China (number 18Y73). Fuchao Chen and Xudong He are co-first authors for this study.
Disclosure
The authors declare that there is no conflict of interests regarding the publication of this paper.
References
1. Lassalle M, Le Tri T, Bardou M, et al. Use of proton pump inhibitors in adults in France: a nationwide drug utilization study. Eur J Clin Pharmacol. 2020;76(3):449–457. doi:10.1007/s00228-019-02810-1.
2. Scarpignato C, Gatta L, Zullo A, et al. Effective and safe proton pump inhibitor therapy in acid-related diseases-a position paper addressing benefits and potential harms of acid suppression. BMC Med. 2016;14(1):179. doi:10.1186/s12916-016-0718-z.
3. Kherad O, Restellini S, Martel M, et al. Proton pump inhibitors for upper gastrointestinal bleeding. Best Pract Res Clin Gastroenterology. 2019;42–43:101609. doi:10.1016/j.bpg.2019.04.002.
4. Worden JC, Hanna KS. Optimizing proton pump inhibitor therapy for treatment of nonvariceal upper gastrointestinal bleeding. Am J Health Sys Pharm. 2017;74(3):109–116. doi:10.2146/ajhp151032.
5. Sachar H, Vaidya K, Laine L. Intermittent vs continuous proton pump inhibitor therapy for high-risk bleeding ulcers: a systematic review and meta-analysis. JAMA Intern Med. 2014;174(11):1755–1762. doi:10.1001/jamainternmed.2014.4056
6. Luo H, Fan Q, Bian T, et al. Awareness, attitude and behavior regarding proton pump inhibitor among medical staff in the southwest of China. BMC Health Services Res. 2019;19(1):880. doi:10.1186/s12913-019-4725-6.
7. Schnoll-Sussman F, Niec R, Katz PO. Proton pump inhibitors: the good, bad, and ugly. Gastrointestinal Endoscopy Clin North Am. 2020;30(2):239–251. doi:10.1016/j.giec.2019.12.005
8. Othman F, Card TR, Crooks CJ. Proton pump inhibitor prescribing patterns in the UK: a primary care database study. Pharmacoepidemiol Drug Saf. 2016;25(9):1079–1087. doi:10.1002/pds.4043.
9. Wang B-Y, Zhang J, Wang J-L, et al. Intermittent high dose proton pump inhibitor enhances the antitumor effects of chemotherapy in metastatic breast cancer. J Exp Clin Cancer Res. 2015;34(1):85. doi:10.1186/s13046-015-0194-x.
10. Jung SW, Kim SY, Choe JW, et al. Standard and double-dose intravenous proton pump inhibitor injections for prevention of bleeding after endoscopic resection.J Gastroenterology Hepatology. 2017;32(4):778–781. doi:10.1111/jgh.13597.
11. Bharathi DV, Hotha KK, Jagadeesh B, et al. Simultaneous estimation of four proton pump inhibitors-lansoprazole, omeprazole, pantoprazole and rabeprazole: development of a novel generic HPLC-UV method and its application to clinical pharmacokinetic study. Biomed Chromatography. 2009;23(7):732–739. doi:10.1002/bmc.1177.
12. Noubarani M, Keyhanfar F, Motevalian M, et al. Improved HPLC method for determination of four PPIs, omeprazole, pantoprazole, lansoprazole and rabeprazole in human plasma. J Pharm Pharm Sci. 2010;13(1):1–10. doi:10.18433/J3GP4Q
13. Polonini HC, Silva SL, Loures S, et al. Compatibility of proton pump inhibitors in a preservative-free suspending vehicle. Eur J Hospital Pharm. 2018;25(3):150–156. doi:10.1136/ejhpharm-2016-001034
14. El-Sherif ZA, Mohamed AO, El-Bardicy MG, et al. Reversed-phase high performance liquid chromatographic method for the determination of lansoprazole, omeprazole and pantoprazole sodium sesquihydrate in presence of their acid-induced degradation products. Chem Pharm Bull (Tokyo). 2006;54(6):814–818. doi:10.1248/cpb.54.814
15. Ashour S, Omar S. A modified high-performance liquid chromatographic method for the analysis of pantoprazole sodium in pharmaceutical dosage forms using lansoprazole as internal standard. Arabian J Chem. 2016;9(Supply 1):S114–S119. doi:10.1016/j.arabjc.2011.02.010
16. Ekpe A, Jacobsen T. Effect of various salts on the stability of lansoprazole, omeprazole, and pantoprazole as determined by high-performance liquid chromatography. Drug Dev Indus Pharm. 1999;25(9):1057–1065. doi:10.1081/ddc-100102270.
17. Zhao P, Deng M, Huang P, et al. Solid-phase extraction combined with dispersive liquid-liquid microextraction and chiral liquid chromatography-tandem mass spectrometry for the simultaneous enantioselective determination of representative proton-pump inhibitors in water samples. Anal Bio Anal Chem. 2016;408(23):6281–6292. doi:10.1007/s00216-016-9753-z.
18. Perumal SS, Ekambaram SP, Raja S. Analytical method development and validation of simultaneous estimation of rabeprazole, pantoprazole, and itopride by reverse-phase high-performance liquid chromatography. J Food Drug Anal. 2014;22(4):520–526. doi:10.1016/j.jfda.2014.05.003.
19. Patel BH, Suhagia BN, Patel MM, et al. Determination of pantoprazole, rabeprazole, esomeprazole, domperidone and itopride in pharmaceutical products by reversed phase liquid chromatography using single mobile phase. Chromatographia. 2007;65(11–12):743–748.
20. Rajab A, Touma M, Rudler H, et al. Slow, spontaneous degradation of lansoprazole, omeprazole and pantoprazole tablets: isolation and structural characterization of the toxic antioxidants 3H-benzimidazole-2-thiones. Die Pharmazie. 2013;68(9):749–754.
21. Chennuru LN, Choppari T, Duvvuri S, et al. Enantiomeric separation of proton pump inhibitors on new generation chiral columns using LC and supercritical fluid chromatography. J Sep Sci. 2013;36(18):3004–3010. doi:10.1002/jssc.201300419
22. Hishinuma T, Suzuki K, Yamaguchi H, et al. Simple quantification of lansoprazole and rabeprazole concentrations in human serum by liquid chromatography/tandem mass spectrometry. J Chromatography B. 2008;870(1):38–45. doi:10.1016/j.jchromb.2008.05.034.
23. Zhang Y, Chen X, Gu Q, et al. Quantification of rabeprazole in human plasma by liquid chromatography-tandem mass spectrometry. Anal Chim Acta. 2004;523:171–175.
24. Addo RT, Davis K, Ubale R, et al. Development and validation of a UPLC method for rapid and simultaneous analysis of proton pump inhibitors. AAPS PharmSciTech. 2015;16(1):30–34. doi:10.1208/s12249-014-0207-7
25. Vaithiyanathan SJ, Rajappan M, Kannappan V. Stability-indicating HPLC method for the simultaneous determination of pantoprazole, rabeprazole, lansoprazole and domperidone from their combination dosage forms. Int J Drug Dev Res. 2011;3(4):323–335.
26. El-Kommos ME, Khashaba PY, Ali HRH, et al. Different chromatographic and electrophoretic methods for analysis of proton pump inhibitors (PPIs): a review. J Liquid Chromatography Related Tech. 2015;38(18):1639–1659. doi:10.1080/10826076.2015.1079722
27. Ghadge MR, Tambe VS, Darade PG. Analysis of proton pump inhibitors in bulk and in different dosage forms -a review. Int J Pharma Res Rev. 2014;3(1):45–57.
28. Yi H, Zhou J, Shang XY, et al. Multi-component analysis of ilex kudingcha c. j. tseng by a single marker quantification method and chemometric discrimination of HPLC fingerprints. Molecules. 2018;23(4):854. doi:10.3390/molecules23040854
29. Li Y, Zhang Y, Zhang Z, et al. Quality evaluation of gastrodia elata tubers based on HPLC fingerprint analyses and quantitative analysis of multi-components by single marker. Molecules. 2019;24(8):1521. doi:10.3390/molecules24081521.
30. Zhu C, Li X, Zhang B, et al. Quantitative analysis of multi-components by single marker—a rational method for the internal quality of Chinese herbal medicine. Integrative Med Res. 2017;6(1):1–11. doi:10.1016/j.imr.2017.01.008
31. Chen LH, Wu Y, Guan YM, et al. Analysis of the high-performance liquid chromatography fingerprints and quantitative analysis of multicomponents by single marker of products of fermented cordyceps sinensis. J Anal Methods Chem. 2018;59(43):914. doi:10.1155/2018/5943914.
32. Wang S, Xu Y, Wang Y, et al. Simultaneous determination of six active components in oviductus ranae via quantitative analysis of multicomponents by single marker. J Anal Methods Chem. 2017;91(9):48. doi:10.1155/2017/9194847
33. Wang C-Q, Jia X-H, Zhu S, et al. A systematic study on the influencing parameters and improvement of quantitative analysis of multi-component with single marker method using notoginseng as research subject. Talanta. 2015;134:587–595. doi:10.1016/j.talanta.2014.11.028.
34. Chen A, Sun L, Yuan H, et al. A holistic strategy for quality and safety control of traditional Chinese medicines by the “iVarious” standard system. J Pharm Anal. 2017;7(5):271–279. doi:10.1016/j.jpha.2017.07.008.
35. Kristl A. Acido-basic properties of proton pump inhibitors in aqueous solutions. Drug Dev Ind Pharm. 2009;35(1):114–117. doi:10.1080/03639040802220284.
36. Gupta HP, Saini K, Dhingra P, et al. Study of acid catalyzed reactions of proton pump inhibitors at D.M.E. Portugaliae Electrochimica Acta. 2007;26(5):433–448. doi:10.4152/pea.200805433.
 © 2020 The Author(s). This work is published and licensed by Dove Medical Press Limited. The full terms of this license are available at https://www.dovepress.com/terms.php and incorporate the Creative Commons Attribution - Non Commercial (unported, v3.0) License.
By accessing the work you hereby accept the Terms. Non-commercial uses of the work are permitted without any further permission from Dove Medical Press Limited, provided the work is properly attributed. For permission for commercial use of this work, please see paragraphs 4.2 and 5 of our Terms.
© 2020 The Author(s). This work is published and licensed by Dove Medical Press Limited. The full terms of this license are available at https://www.dovepress.com/terms.php and incorporate the Creative Commons Attribution - Non Commercial (unported, v3.0) License.
By accessing the work you hereby accept the Terms. Non-commercial uses of the work are permitted without any further permission from Dove Medical Press Limited, provided the work is properly attributed. For permission for commercial use of this work, please see paragraphs 4.2 and 5 of our Terms.