")
Back to Journals » Diabetes, Metabolic Syndrome and Obesity » Volume 15
Simple Method to Predict Insulin Resistance in Children Aged 6–12 Years by Using Machine Learning
Received 8 July 2022
Accepted for publication 13 September 2022
Published 27 September 2022 Volume 2022:15 Pages 2963—2975
DOI https://doi.org/10.2147/DMSO.S380772
Checked for plagiarism Yes
Review by Single anonymous peer review
Peer reviewer comments 2
Editor who approved publication: Professor Gian Paolo Fadini
Qian Zhang, Nai-jun Wan
Department of Pediatrics, Beijing Jishuitan Hospital, Beijing, People’s Republic of China
Correspondence: Nai-jun Wan, Department of Pediatrics, Beijing Jishuitan Hospital, 31# Xinjiekou Dongjie, West District, Beijing, 100035, People’s Republic of China, Tel +86-10-58398102, Email [email protected]
Background: Due to the increasing insulin resistance (IR) in childhood, rates of diabetes and cardiovascular disease may rise in the future and seriously threaten the healthy development of children. Finding an easy way to predict IR in children can help pediatricians to identify these children in time and intervene appropriately, which is particularly important for practitioners in primary health care.
Patients and Methods: Seventeen features from 503 children 6– 12 years old were collected. We defined IR by HOMA-IR greater than 3.0, thus classifying children with IR and those without IR. Data were preprocessed by multivariate imputation and oversampling to resolve missing values and data imbalances; then, recursive feature elimination was applied to further select features of interest, and 5 machine learning methods—namely, logistic regression (LR), support vector machine (SVM), random forest (RF), extreme gradient boosting (XGBoost), and gradient boosting with categorical features support (CatBoost)—were used for model training. We tested the trained models on an external test set containing information from 133 children, from which performance metrics were extracted and the optimal model was selected.
Results: After feature selection, the numbers of chosen features for the LR, SVM, RF, XGBoost, and CatBoost models were 6, 9, 10, 14, and 6, respectively. Among them, glucose, waist circumference, and age were chosen as predictors by most of the models. Finally, all 5 models achieved good performance on the external test set. Both XGBoost and CatBoost had the same AUC (0.85), which was highest among those of all models. Their accuracy, sensitivity, precision, and F1 scores were also close, but the specificity of XGBoost reached 0.79, which was significantly higher than that of CatBoost, so XGBoost was chosen as the optimal model.
Conclusion: The model developed herein has a good predictive ability for IR in children 6– 12 years old and can be clinically applied to help pediatricians identify children with IR in a simple and inexpensive way.
Keywords: children, insulin resistance, machine learning, artificial intelligence
Introduction
Insulin resistance (IR) refers to the decreased ability of certain organs, including the liver and muscles, to uptake and process glucose under normal doses of insulin. With the increase in obesity rates among children and adolescents, the incidence of IR has also risen considerably.1,2 In the early stage of IR, the body can secrete high levels of insulin to maintain the blood glucose balance; however, with the gradual decline in β-cell function, the secretion of insulin eventually decreases, and the speed of this decline can be faster in childhood and adolescence.3 Since type 2 diabetes mellitus (T2DM) can be regarded as a continuation of IR, and also has the risk of causing other chronic illnesses, proper management of children with IR could delay or stop the development of T2DM, which means that early detection of IR is imperative.4 In addition, IR has also been shown to be associated with a variety of diseases, such as hypertension and polycystic ovary syndrome.5,6 In summary, IR and hyperinsulinemia can cause a homeostasis imbalance and trigger a series of metabolic disorders, which can pose unknown dangers to children’s future healthy growth. Therefore, it is necessary to find a method to predict IR to help pediatricians make proper medical decisions. Using previous risk factors and models to predict metabolic diseases may reduce the accuracy.7 Therefore, it is essential to predict children with IR based on new risk factors. Recent studies have confirmed that basic information, daily habits, and blood cells are risk factors for IR and can provide help in predicting the occurrence of IR.8–11
In recent years, advanced technologies guided by artificial intelligence and machine learning (ML) have made computers increasingly intelligent and independent. These technologies are now applied effectively in every step of clinical work, including disease diagnosis, differential diagnosis, personalized treatment, and prognosis.12,13 For example, in oncology, researchers have trained with imaging and blood test data to develop corresponding prediction models, which in turn assist physicians in diagnosing tumors early and making survival predictions.14,15 Several studies have shown that models constructed by applying daily habits, basic information, and some blood tests as features can effectively predict abnormal metabolic states in humans. For example, Kim et al16 applied lifestyle habits and blood tests to predict metabolic syndrome (METS), and similar features have been used to build a predictive model for T2DM.17 All these explorations have achieved good prediction results. However, few studies to date have explored predictive models for IR by using ML in children. Park et al and Lee et al both explored the prediction of IR; however, the main populations of these existing investigations were adults or patients with chronic kidney disease, in contrast to the pediatric patients we desired.18,19 In addition, many features were included in these studies, especially some biochemical blood tests, which, on the one hand, are not often performed during routine physical examinations in primary care hospitals as they may increase the expenses of families, and, on the other hand, require fast blood samples, which may be intimidating or aversive for many children. These reasons may hinder the diffusion of these models. Therefore, in this study, we attempted to construct an IR prediction model by applying easily available and child-friendly tests as features to better help pediatricians.
Materials and Methods
Study Participants and Insulin Resistance Definition
In this study, data about children 6–12 years of age were gathered from the China Health and Nutrition Survey (CHNS) database and used as the training set. The CHNS is an international collaborative project between the Carolina Population Center at the University of North Carolina at Chapel Hill and the National Institute for Nutrition and Health (formerly the National Institute of Nutrition and Food Safety) at the Chinese Center for Disease Control and Prevention in which the nutrition and health status of the Chinese population in 15 provinces was monitored from 1989–2015. The CHNS 2009 data contain biomarkers for children, which is important for this study; therefore, these data were used in our analysis. Ultimately, data from a total of 503 eligible children were included in the training set.
In addition, information about children 6–12 years of age between January 2019 and December 2020 was gathered from the Pediatrics Department of Beijing Jishuitan Hospital to be used as the test set. Basic demographic information and blood samples were collected. Ultimately, data were collected on a total of 133 children aged 6–12 years.
The hyperinsulinemic euglycemic clamp is the gold standard for the diagnosis of IR, but it is time-consuming and expensive to apply and sees less clinical application. In addition to this method, researchers have explored other ways to diagnose IR, such as the homeostatic model assessment for insulin resistance (HOMA-IR) and triglyceride–glucose index.20,21 Among these indices, HOMA-IR calculation method is simple, and has a good correlation with the hyperinsulinemic–euglycemic clamp technique and is more widely used in clinical applications. Yin et al22 studied the HOMA-IR cutoff point in Chinese children, in whom the cutoff point for diagnosing IR was defined based on the HOMA-IR distribution in the reference population, and those above the 95th percentile were diagnosed with IR. In this study, the 95th percentile HOMA-IR point for healthy reference children was 3.0; thus, children with a HOMA-IR score of >3.0 were defined as children with IR in this study. The HOMA-IR is calculated as (fasting insulin mU/L) × (fasting glucose mmol/L)/22.5.
Data Preprocessing
The collected data from the CHNS included missing values and outliers. It was important to address this problem. So the following data preprocessing steps were performed. First, the entire row or column was deleted if >50% of the data were missing; then, for the remaining missing values, a multivariate imputation method was employed. For the imputation process, we used the IterativeImputer package in the scikit-learn library in Python (version 3.6). IterativeImputer is executed in an iterative loop: at each step, the element target column is designated as the output y and the other columns are designated as inputs x. A regressor is used to fit (x, y) on a sample with a known (unmissing) y. This regressor is then used to predict the missing y values. In finding outliers, continuous variables and categorical variables were approached differently. For continuous variables, we used the standard deviation method, treating data appearing outside the range of 3 standard deviations as outliers. For categorical variables, we treated data that did not conform to the assignment rules as outliers. The outliers were treated as missing values and dealt with accordingly. For missing values and outliers in the external test set, we treated them in the same way as in the training set.
The training set included considerably more children without IR than children with IR. We thought that the imbalance in the numbers of the 2 groups may result in poor performance of the constructed model; therefore, the Synthetic Minority Oversampling Technique (SMOTE) method for oversampling was adopted to balance the data. The basic purpose of the SMOTE algorithm is to analyze the minority samples and synthesize new samples to add to the dataset, which differs from the simple copy strategy of the random oversampling method, effectively avoiding the problem of overfitting.
Feature Selection
In the initial selection of features, we reviewed previous studies for risk factors associated with IR. Some basic information, such as body mass index (BMI) and waist circumference, can reflect the fat distribution of children, which is closely related to IR.23 Among daily habits, sleep and exercise were strongly associated with IR.24,25 Regarding blood tests, previous studies have shown that blood cells, including leukocytes (WBC), erythrocytes (RBC), platelets (PLT), and hemoglobin (HGB), are associated with IR.26–28 These are also tests that can be performed in most primary care hospitals during routine physical examinations, and even by using peripheral blood in many places, which is very child-friendly. In addition, there are also some biochemical tests and genetic tests that have been shown to correlate with IR.29,30 However, since these tests are not part of the routine physical examinations for children, they are likely to bring additional costs to families, and too many features would make the model more complex, so we did not choose them in the end so as to keep the model simpler and easier to generalize.
Finally, combining the data provided by the CHNS database, we selected 17 features for the study, including 7 concerning basic information (age, gender, BMI, systolic blood pressure [SBP], diastolic blood pressure [DBP], hip circumference, and waist circumference), 5 about daily habits (sleep duration, outdoor sports activities, outdoor sports activities per week, sports activities in school, and sports activities in school per week), and 5 laboratory tests (WBC, RBC, HGB, PLT, and glucose).
With a limited number of samples, using a large number of features to train a model may lead to prolonged training time and the curse of dimensionality. Additionally, too many features may also lead to overfitting problems, resulting in poor model generalizability. To minimize these effects, feature selection by ML was performed. In this study, we adopted recursive feature elimination (RFE), which is representative of the wrapper method, to perform feature selection. The selection process started with training the estimator with an initial feature set and obtaining the importance weights of the features through the coef_ or feature_importances_ attributes. Subsequently, features were selected by recursively considering smaller and smaller sets of features.
Model Construction and Test
Five ML algorithms that are widely used by clinics were trained for model building—namely, logistic regression (LR), support vector machine (SVM), random forest (RF), extreme gradient boosting (XGBoost), and gradient boosting with categorical features support (CatBoost). LR assumes that the data follow the Bernoulli distribution and uses the maximum likelihood function method to estimate the parameters and classify the data. It is widely used in binary classification tasks and is computationally small, fast, and easy to understand and implement. RF is an ensemble algorithm that combines multiple independent weak classifiers and then uses voting or averaging to make the final decision. Since the decision tree nodes can be randomly selected to divide the features, this allows efficient training of the model even when the sample features are of high dimensionality. The basic principle of SVM is to find the hyperplane that can correctly divide the training dataset and produce the largest geometric interval between classes in the feature space. SVM has a large number of kernel functions to use, thus allowing flexibility to solve various non-linear classification regression problems. XGBoost is an improvement upon the gradient boosting decision tree approach. The basic idea is to let the new base model fit the deviation of the previous model, thereby continuously reducing the deviation of the additive model. XGBoost adds a regular term to the objective function to control the complexity of the model and thus reduce the risk of overfitting. CatBoost is another improved implementation of the gradient boosting decision tree algorithm framework whose main advantage is the efficient and reasonable handling of category-based features, and it proposes new methods to deal with the gradient bias and prediction shift problems, thus improving the accuracy and generalizability of the algorithm.
After imputation and oversampling, the data from CHNS were used as the training set and incorporated into the ML algorithms. Hyperparameters are parameters that are set before the start of the learning process, and the choice of different hyperparameters has a crucial impact on model performance. The grid search method was used to optimize the hyperparameter selection in the training process; the intervals in which the parameters were searched for using grid search are listed in Table 1. Ten-fold cross-validation was used—that is, the training set was divided randomly into 10 parts, 1 of which was used as the verification set in turn, while the remaining 9 parts were used as the training set. Following cross-validation, different verification scores were obtained for different hyperparameters, and the ones with the highest scores were ultimately selected. The model trained with these hyperparameters was the final model.
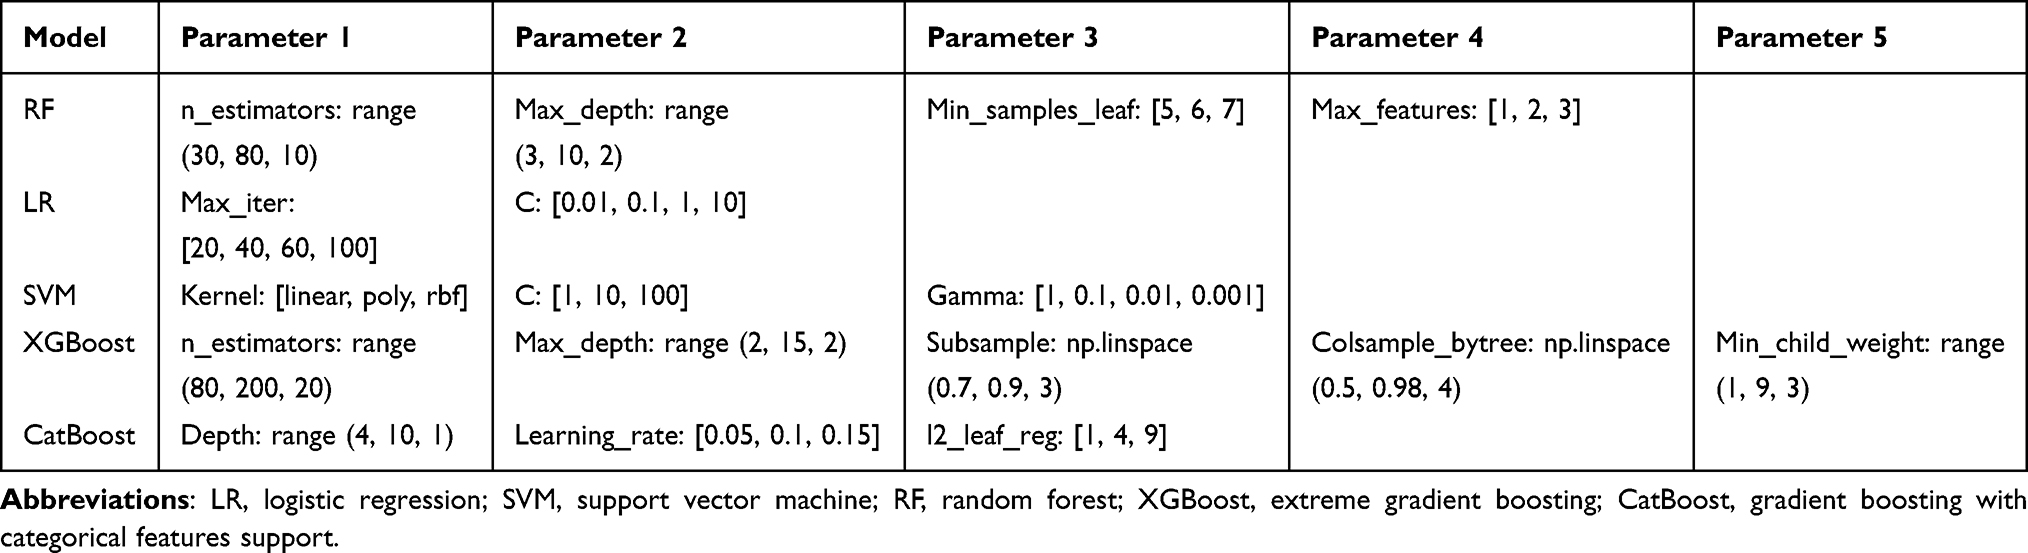 |
Table 1 Grid Search Parameter Intervals for Model Training |
To further evaluate the performance and generalizability of the models, they were evaluated during the external test using the data collected from our hospital. This was different from the data source of the training set and can better demonstrate the generalization ability of the model. We incorporated the features from the test set into the already constructed model to obtain the corresponding IR prediction results, then compared them with the actual situation to learn the real performance capability of the model. Testing the models on new and unseen data can yield valuable information on their generalizability and applicability in the clinic. The detailed process for model training and testing is presented in Figure 1.
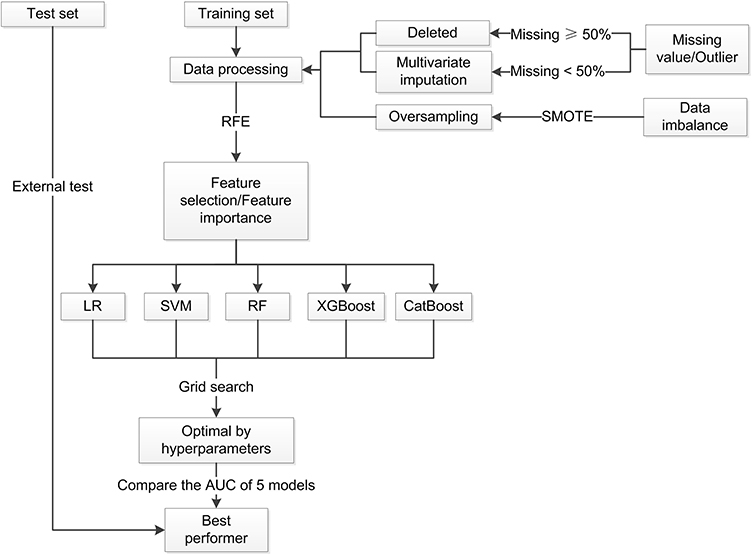 |
Figure 1 Flowchart of the model training and test procedure in this study. Abbreviations: SMOTE, Synthetic Minority Oversampling Technique; RFE, recursive feature elimination; LR, logistic regression; SVM, support vector machine; RF, random forest; XGBoost, extreme gradient boosting; CatBoost, gradient boosting with categorical features support; AUC, area under the curve. |
Model Evaluation and Data Statistics
The performance of each model was evaluated using receiver operating characteristic (ROC) curves. The areas under the ROC curve (AUCs) of the models were then calculated to compare their classification ability. Five additional performance metrics were calculated—namely, accuracy, sensitivity, specificity, precision, and F1 score—to better understand the differences between the models.
SPSS version 22.0 (IBM Corporation, Armonk, NY, USA) was used for the statistical analysis. An independent t-test was used to compare continuous variables, and the chi-squared or Fisher’s exact test was used to compare categorical variables. All tests were 2-tailed, and p < 0.05 was considered to be statistically significant.
Results
Subject Characteristics
Information from a total of 503 children from the CHNS database was collected; however, 13 children were excluded due to missing information on >50% of the features, so 490 children were eventually included in the training set. In total, there were 135 children with IR and 355 children without IR, with IR defined by HOMA-IR > 3.0. In order to balance the 2 groups of data and thus ensure the robustness of the model, we performed a data-balancing process. During the preprocessing process, the SMOTE method was applied to amplify the group with fewer samples in order to ensure the balance of data during the training process. After the processing, we ended up with a sample of 710. Accordingly, 4 children were excluded and 129 children were included in the external test set, and the data in the test set was not preprocessed by applying oversampling.
As mentioned above, during the initial feature selection process, we selected 17 features covering basic information, lifestyle habits, and blood tests. Among them, data on outdoor sports activities per week were deleted because they were missing for >50% of the subjects. In the end, a total of 16 features entered feature selection. The distribution of missing features in the 2 sets is shown in Figure 2.
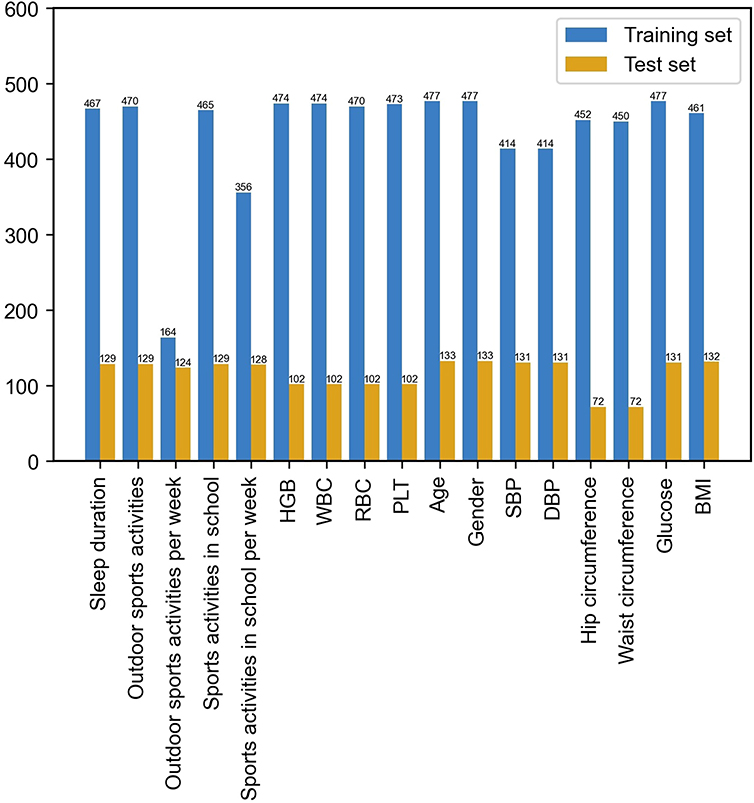 |
Figure 2 Distribution of missing features in the training set and test set. Abbreviations: HGB, haemoglobin; WBC, leukocytes; RBC, erythrocytes; PLT, platelets; SBP, systolic blood pressure; DBP, diastolic blood pressure; BMI, body mass index. |
The feature information of the training set and the test set were compared, and the results are shown in Tables 2 and 3. No significant difference was detected between the 2 sets in sex composition, sports activities in school, sleep duration, age, DBP, or glucose (p > 0.05). In contrast, the differences between the 2 sets in the percentage of children with IR, outdoor exercise, sports activities in school per week, WBC, HGB, RBC, PLT, SBP, and hip circumference were statistically significant (p < 0.05).
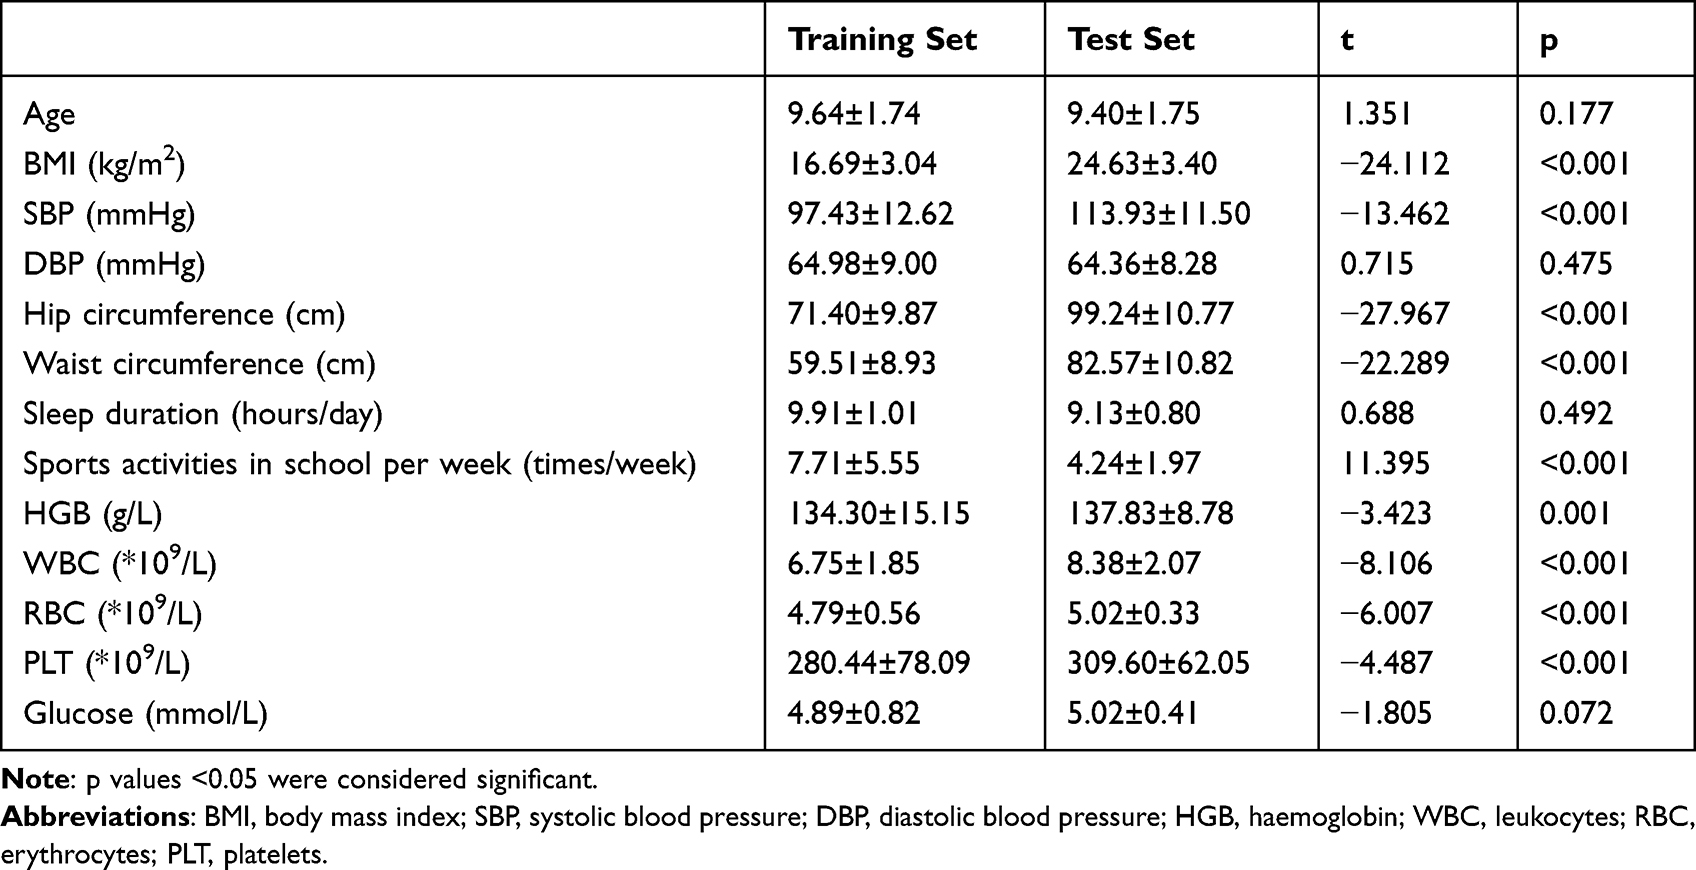 |
Table 2 Feature Comparison Between the Training Set and Test Set- Continuous Variables (Mean± SD) |
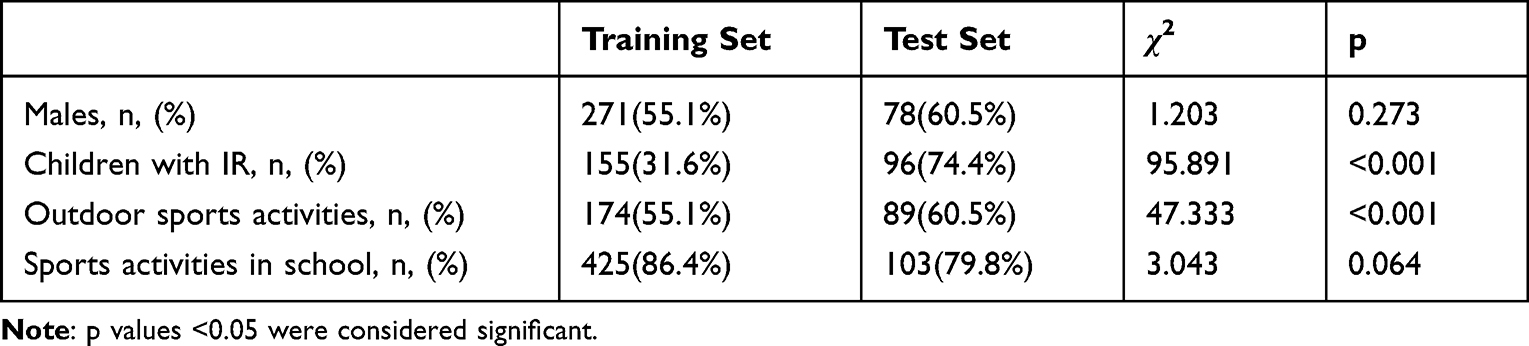 |
Table 3 Feature Comparison Between the Training Set and Test Set - Categorical Variables |
The basic information for the 2 sexes in the 2 sets was compared, and the results are shown in Figure 3. In the training set, no difference was detected between boys and girls in basic information. In the test set, however, there were significant differences between the sexes. In particular, significant differences were found in the hip circumference, waist circumference, SBP and BMI between the boys in the training set and the test set. All basic information features showed significant differences between the 2 sets in girls.
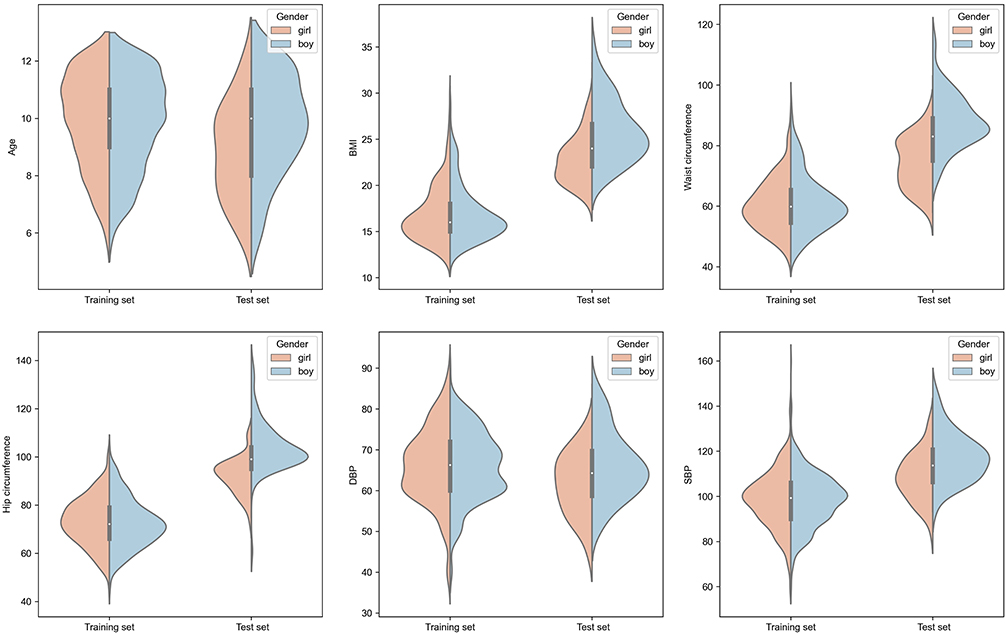 |
Figure 3 Violin plot depicting the comparison of basic information between the training set and the external test set. Abbreviations: BMI, body mass index; SBP, systolic blood pressure; DBP, diastolic blood pressure. |
Feature Selection and Feature Importance
RFE was used for feature selection, and the selection results based on AUCs are shown in Figure 4. Since the AUC did not increase significantly after 6 (LR), 9 (SVM), 10 (RF), 14 (XGBoost), or 6 (CatBoost) features were included in model training, and considering the desire to produce a simple and convenient mode, the numbers of chosen features for the LR, SVM, RF, XGBoost, and CatBoost models were 6, 9, 10, 14, and 6, respectively. The features included in each model are listed in Table 4.
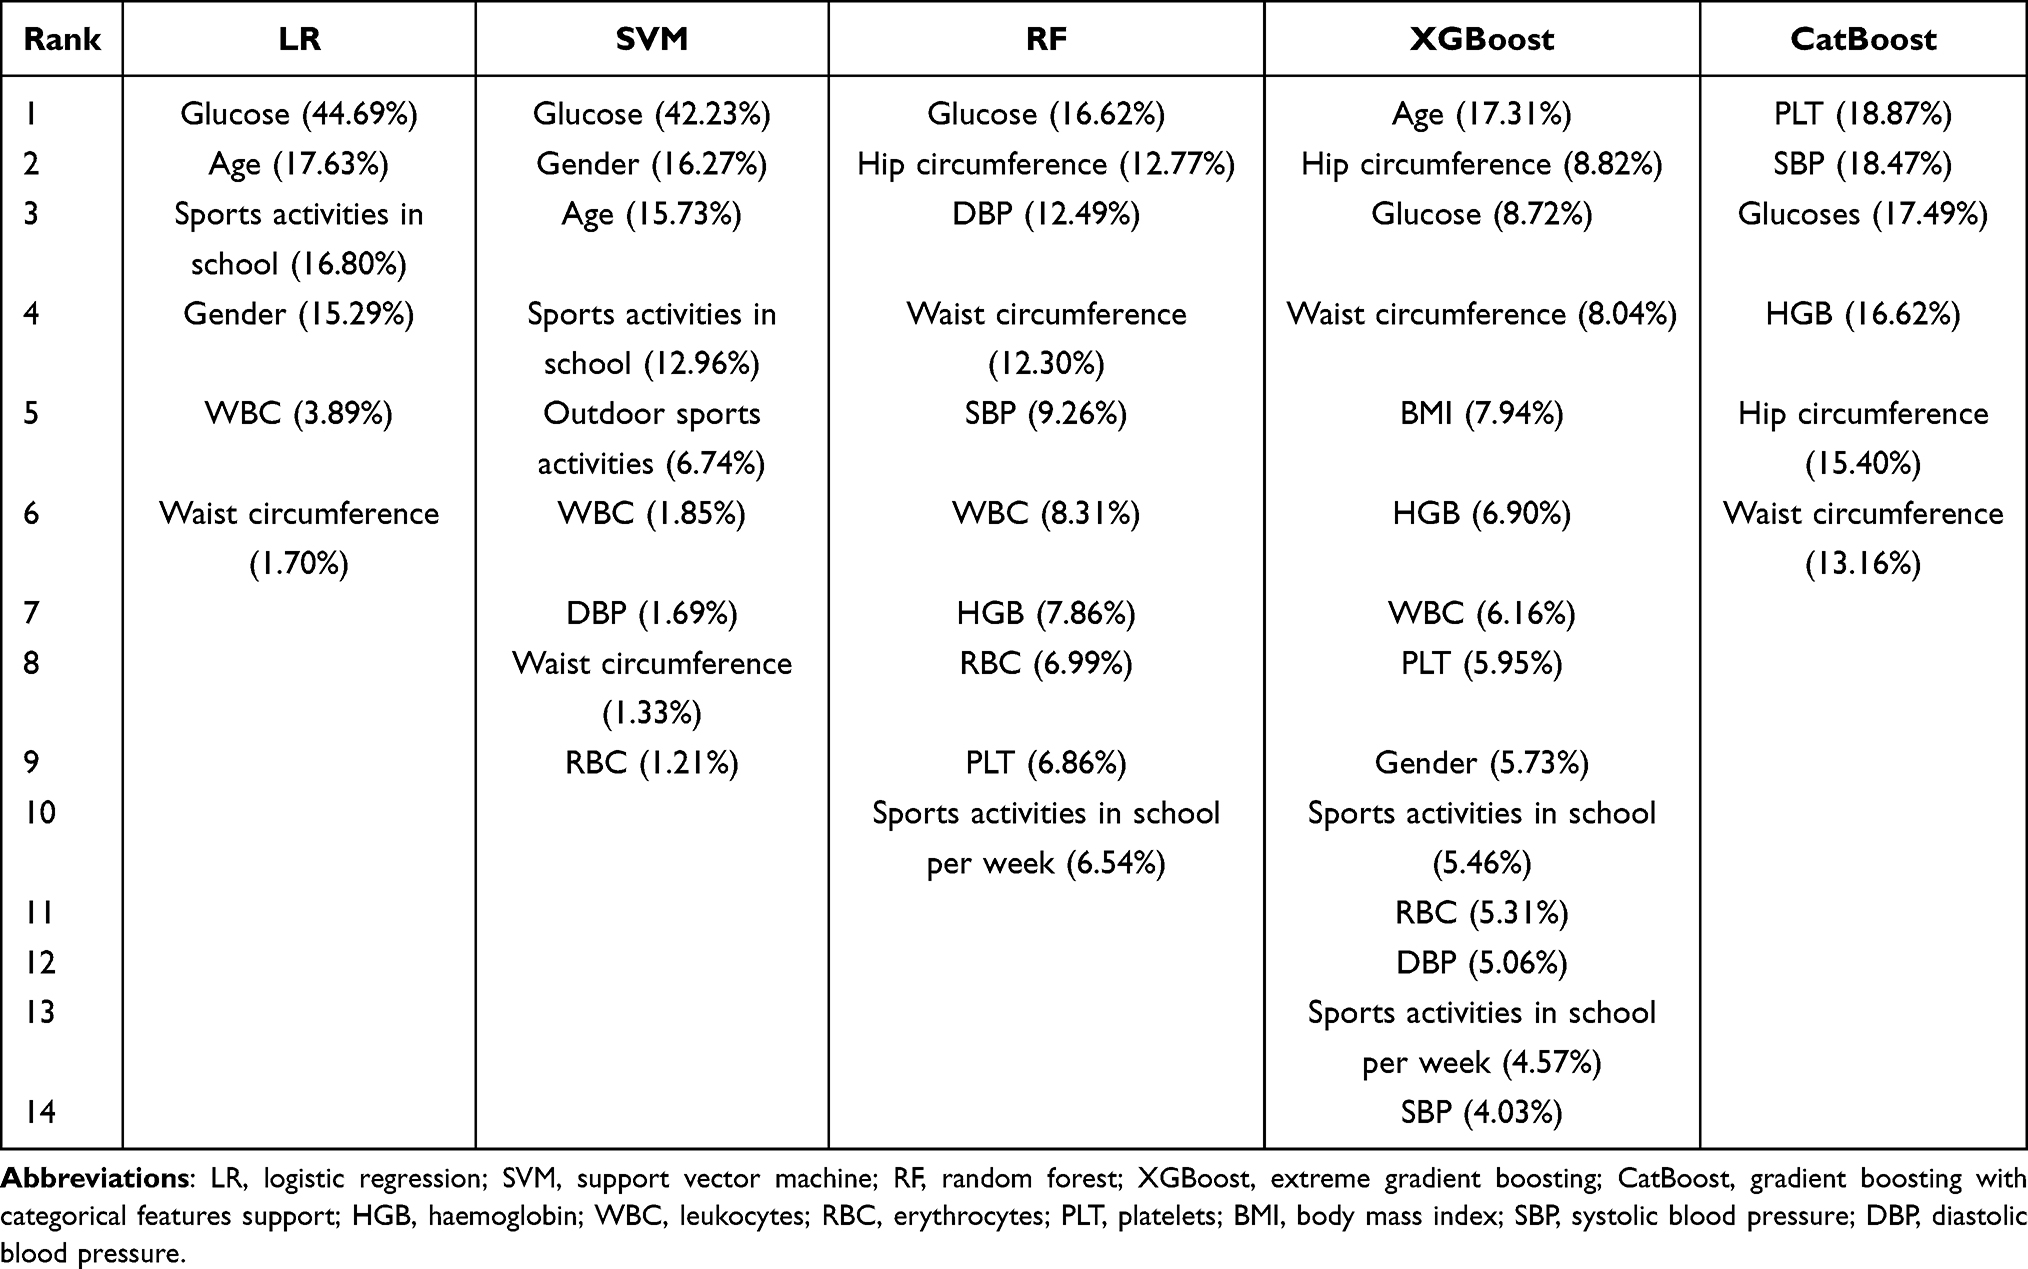 |
Table 4 Features Selected by Different Models, Displayed in Descending Order of Importance Percentage |
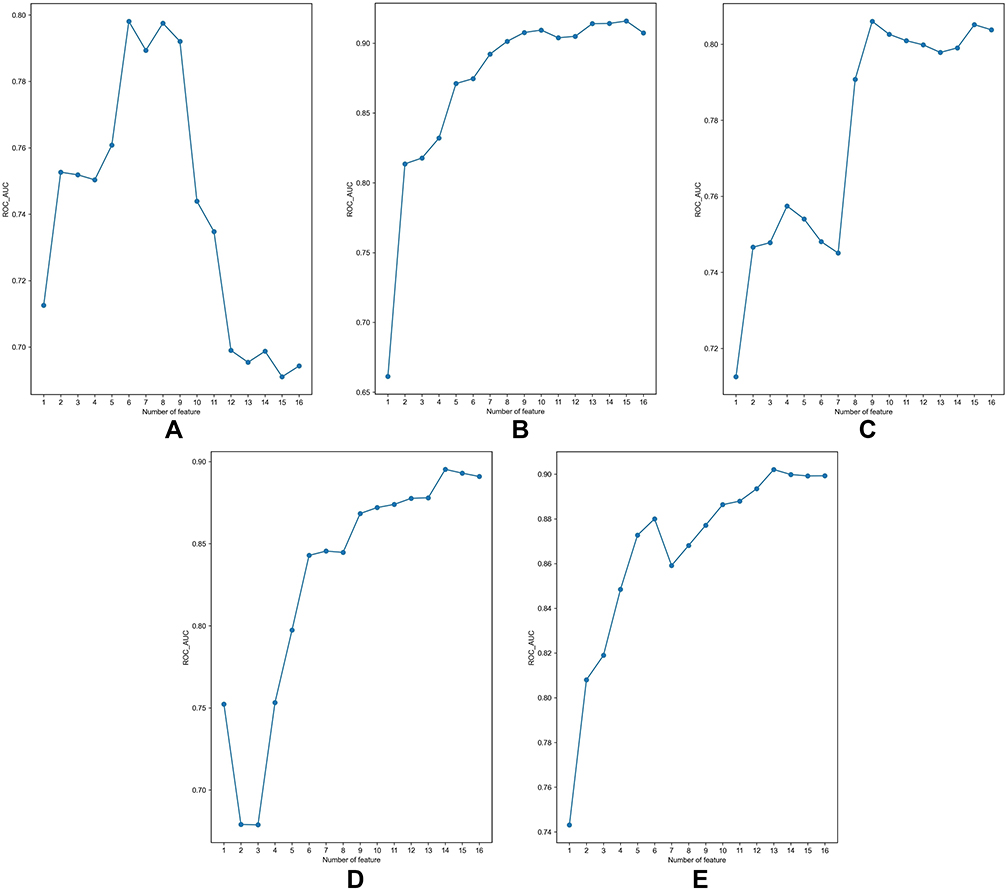 |
Figure 4 Feature selection for different models by the RFE method. (A) LR; (B) RF; (C) SVM; (D) XGBoost; (E) CatBoost. Abbreviations: RFE, recursive feature elimination; LR, logistic regression; SVM, support vector machine; RF, random forest; XGBoost, extreme gradient boosting; CatBoost, gradient boosting with categorical features support. |
In addition to differences in the number of features for each model, their importance also varied. Table 4 shows the importance ranking of features selected by the different models and their importance percentages.
Model Training and Evaluation
The following values were used for the hyperparameters of each model, following application of the grid search method: LR: C: 1, max_iter: 100; SVM: C: 10, kernel: linear; RF: max_depth: 9, max_features: 1, min_samples_leaf: 5, n_estimators: 50; XGBoost: colsample_bytree: 0.5, max_depth: 8, min_child_weight: 1, n_estimators: 180, subsample: 0.8; and CatBoost: depth: 9, l2_leaf_reg: 1, learning_rate: 0.05.
The ROC curves for the external test set and their corresponding AUCs are shown in Figure 5. In the external test set, the AUCs of LR, SVM, RF, XGBoost, and CatBoost were 0.79, 0.81, 0.79, 0.85, and 0.85, respectively. XGBoost and CatBoost achieved the same and largest AUC.
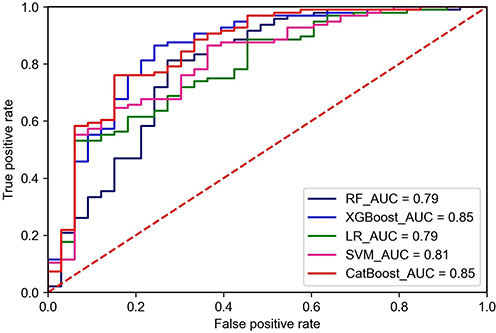 |
Figure 5 ROC curves for the test set. Abbreviations: ROC, receiver operating characteristic; AUC, area under the curve; LR, logistic regression; SVM, support vector machine; RF, random forest; XGBoost, extreme gradient boosting; CatBoost, gradient boosting with categorical features support. |
The prediction performance of the 5 models in terms of additional metrics is shown in Table 5. XGBoost and CatBoost had the same AUC and similar values of accuracy, sensitivity, precision, and F1 scores. However, XGBoost had significantly higher specificity than CatBoost, suggesting that it will have better prediction performance. Thus, the XGBoost model was chosen as the optimal model.
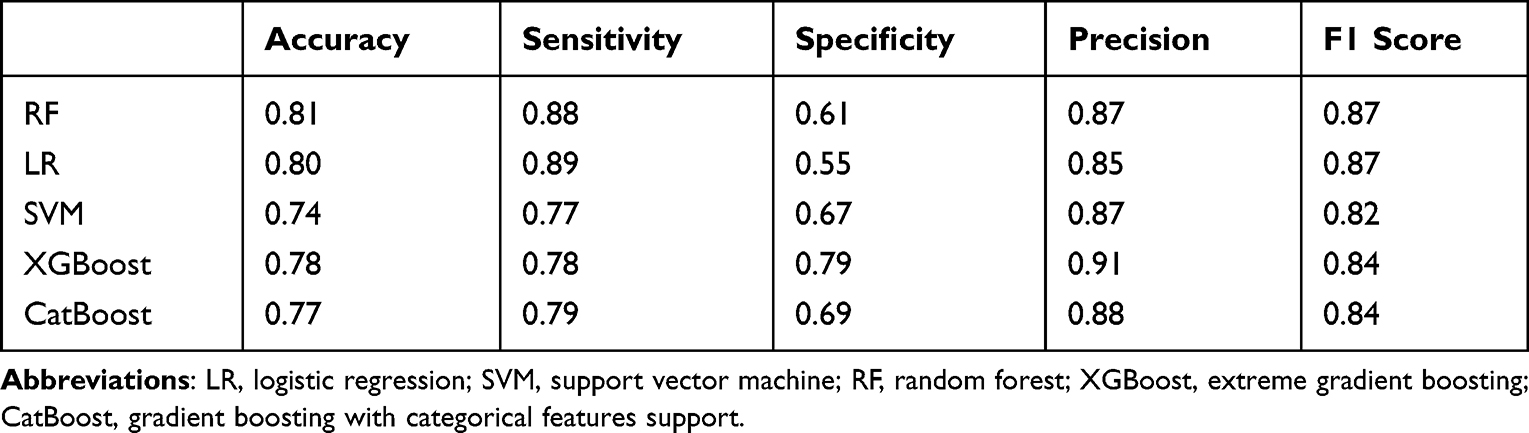 |
Table 5 Evaluation Metrics for the Different Models |
Discussion
Although IR may seem like a minor problem and does not cause discomfort in children in the moment, it is important to realize that IR, as an important risk factor for many metabolic diseases, will likely affect the growth and development of these children if it persists. If we can identify at-risk children in time at the IR stage and give appropriate interventions, we will be able to promote healthier child development. Research on IR has mostly focused on the predictive ability of specific variables, such as waist circumference.31 However, only certain correlations were revealed between the variables and IR; moreover, they were not sufficiently comprehensive for predicting IR, and it was difficult to develop accurate evaluation standards or methods. In published studies, many models for metabolic diseases in adults integrate these single factors to achieve predictive goals for these diseases. For example, Xu et al applied variables such as waist circumference and hip circumference to predict T2DM,32 while Karimi-Alavijeh et al used variables such as age, sex, and blood pressure to predict the onset of METS33 and Choe et al added data on daily habits, such as smoking status and exercise, to these variables to predict METS.34 These researchers emphasized the importance of the early detection of metabolic abnormalities through some simple data. This is in line with our focus. However, in contrast to our study, these prediction models were aimed at adults and not appropriate for children. In addition, these models focused on DM or METS, states that are often the result of further IR progression, whereas our model on IR has the potential to stop disease onset at an earlier stage. Stawiski et al35 applied neural network techniques to construct a predictive model for IR in children and achieved good predictive performance. However, in terms of the population to which it was adapted, their study mainly focused on children with T1DM, while our study faced a broader population covering all children aged 6–12 years. Moreira et al36 conducted a study on IR prediction in healthy children in which basal vital signs, body fat percentage, and biochemical tests were used. Lin et al37 found that unique circulating miRNA signatures indicating IR in children and could be used as biomarkers to detect the occurrence of IR, which could be indeed valuable in precision medicine. As we mentioned earlier, these tests, although they can accurately predict IR, may enjoy only limited use because some features used in this study are not part of the routine physical examination in primary care hospitals. Ultimately, the results of this study show that our initial hypothesis was correct. ML techniques can indeed work well in the field of IR, detecting IR at a very early stage and helping clinicians to predict it early in school-aged children with relative ease.
In this study, we initially envisaged that the models constructed by ML should satisfy 2 objectives, as follows: (1) good classification performance should be achieved to ensure the effectiveness of the model, and (2) the model should be inexpensive, convenient, and avoid increasing the burden on pediatricians and patients. Our final results showed that we largely achieved these objectives. External tests confirmed that each model achieved relatively good performance; in particular, XGBoost achieved the highest AUC, accuracy, and F1 score. The SVM model did not perform well, which may be due to the fact that this algorithm is very sensitive to missing values and outliers. Although we performed imputation work, the imputation was inferred from the original data, which may have caused the feature differentiation between IR and non-IR children to be reduced, which also allowed the distance between the 2 sets of data to decrease, resulting in the lack of classification ability of the hyperplane of the SVM. As for RF, although its accuracy was the highest, its specificity was low, which meant that this model works better for positive results but poorly for negative results, which could result in a higher misdiagnosis rate and thus a waste of medical resources. Thus, XGBoost was chosen as the optimal model. Furthermore, the features we used are easy to obtain clinically. Most of the features were lifestyle habits and basic physical signs, and the described laboratory tests are routinely performed in many areas, require only small amounts of blood, and their acquisition cost is also very low. Therefore, in medical institutions with insufficient capacity, pediatricians can initially screen high-risk children, then transfer them to qualified hospitals so as to achieve rational use of medical resources. This showed that our model had good practicability and can be recommended in clinical use.
ML has the potential to help us gain more insight into the strength of the association between features and a disease. In the process of model construction, we determined the importance of features in different models. Although the features selected by each model and their importance varied, these models showed a tendency to select similar features, and the features selected by most of the models, such as glucose, waist circumference, and age, were ranked high. In our study, glucose was unsurprisingly ranked high since it is one of the parameters used to calculate HOMA-IR. A large waist circumference indicates abdominal fat accumulation. High free fatty acid levels can reduce insulin receptor–related uptake and signaling, which will antagonize the effect of insulin in the liver.38 Velásquez-Rodríguez et al’s research also shows that waist circumference has an important effect on children with IR.39 Aging often brings about hormonal and metabolic changes in the body, which is an important factor in the development of IR.40 The tendency toward consistency in the feature selection process suggests that ML techniques are likely to be able to help clinicians find risk factors that are more closely related to diseases. This view is also corroborated by previous research, indicating that the application of ML in the clinical field is very promising.41,42
The main advantages we observed in this study were as follows. First, few current prediction models on IR are suitable for children, while our study focused on school-aged children, which is a broader range of adaptation. Second, IR is often the starting point for glucose metabolism abnormalities. Our model can detect these abnormalities at the IR stage and help pediatricians make the right decisions, which can potentially help reverse the trend of glucose metabolism abnormalities in these children. Finally, the features used in the model are data that are easily obtained in the clinic, even in primary care hospitals or poor areas, and therefore may be more helpful to pediatricians in these locations. However, this study also had some shortcomings. The sample sizes of both the training and test sets were small, which could inevitably result in an overfitting problem, although the use of an external test set in this study showed that the scope of this problem was acceptable Second, the data collected for the external test set came from a single center, so data samples from other institutions need to be included in the training process of the models, thus increasing the sample size, to ensure that our model will have good generalizability.
Conclusion
In this study, we applied 5 ML algorithms. After testing, XGBoost achieved the highest AUC and other metrics also showed good performance. The XGBoost model used features that can be easy to obtain to accurately predict the occurrence of IR and is worthy of promotion in clinical work. Next, we need to further expand the sample size so as to enhance the effectiveness of the model.
Abbreviations
IR, insulin resistance; AUC, area under the curve; ROC, receiver operating characteristic; T2DM, type-2 diabetes; AI, artificial intelligence; ML, machine learning; HOMA-IR, homeostatic model assessment for insulin resistance; CHNS, China Health and Nutrition Survey; CCDC, Chinese Center for Disease Control and Prevention; NINH, North Carolina at Chapel Hill and the National Institute for Nutrition and Health; SMOTE, Synthetic Minority Oversampling Technique; RFE, recursive feature elimination; METS, metabolic syndrome; LR, logistic regression; SVM, support vector machine; RF, random forest; XGBoost, extreme gradient boosting; CatBoost, gradient boosting with categorical features support; BMI, body mass index; HGB, haemoglobin; WBC, leukocytes; RBC, erythrocytes; PLT, platelets; BMI, body mass index; SBP, systolic blood pressure; DBP, diastolic blood pressure.
Data Sharing Statement
The datasets analysed during the current study for the model construction are available in the CHNS repository, https://www.cpc.unc.edu/projects/china. The datasets analysed during the current study for model test are available from the corresponding author on reasonable request.
Ethics Approval and Consent to Participate
The study for model construction was an analysis of a third-party anonymized publicly available database with pre-existing institutional review board approval. The study for model test was performed according to the World Medical Association’s Declaration of Helsinki, and approved by the institutional review board and the ethics committee of the Beijing Jishuitan Hospital, Beijing, China (201808-03). When both participants and parents or legal guardians were agreed on the participation in the study, parents or legal guardians gave written informed consent. We confirm that all methods in this study were carried out in accordance with the relevant guidelines and regulations.
Acknowledgments
Thanks all the participants for their involvement in the study.
Author Contributions
All authors made a significant contribution to the work reported, whether that is in the conception, study design, execution, acquisition of data, analysis and interpretation, or in all these areas; took part in drafting, revising or critically reviewing the article; gave final approval of the version to be published; have agreed on the journal to which the article has been submitted; and agree to be accountable for all aspects of the work.
Funding
This research was funded by The Special Fund of the Pediatric Medical Coordinated Development Center of Beijing Hospital Authority, No.XTZD20180401, which provide financial support in the design of the study and collection, analysis, and interpretation of data and in writing the manuscript.
Disclosure
The authors declare that they have no competing interests.
References
1. Afshin A, Forouzanfar MH, Reitsma MB, et al. Health effects of overweight and obesity in 195 countries over 25 years. N Engl J Med. 2017;377(1):13–27. doi:10.1056/NEJMoa1614362
2. Song P, Yu J, Chang X, Wang M, An L. Prevalence and correlates of metabolic syndrome in Chinese children: the China health and nutrition survey. Nutrients. 2017;9(1). doi:10.3390/nu9010079
3. Weiss R, Santoro N, Giannini C, Galderisi A, Umano GR, Caprio S. Prediabetes in youth - mechanisms and biomarkers. Lancet Child Adolesc Health. 2017;1(3):240–248. doi:10.1016/s2352-4642(17)30044-5
4. Esquivel Zuniga R, DeBoer MD. Prediabetes in adolescents: prevalence, management and diabetes prevention strategies. Diabetes Metab Syndr Obes. 2021;14:4609–4619. doi:10.2147/DMSO.S284401
5. Abbott DH, Bacha F. Ontogeny of polycystic ovary syndrome and insulin resistance in utero and early childhood. Fertil Steril. 2013;100(1):2–11. doi:10.1016/j.fertnstert.2013.05.023
6. Soleimani M. Insulin resistance and hypertension: new insights. Kidney Int. 2015;87(3):497–499. doi:10.1038/ki.2014.392
7. Bethel MA, Hyland KA, Chacra AR, et al. Updated risk factors should be used to predict development of diabetes. J Diabetes Complications. 2017;31(5):859–863. doi:10.1016/j.jdiacomp.2017.02.012
8. Alias-Hernandez I, Galera-Martinez R, Garcia-Garcia E, et al. Insulinaemia and insulin resistance in Caucasian general paediatric population aged 2 to 10 years: associated risk factors. Pediatr Diabetes. 2018;19(1):45–52. doi:10.1111/pedi.12533
9. Medrano M, Arenaza L, Migueles JH, Rodriguez-Vigil B, Ruiz JR, Labayen I. Associations of physical activity and fitness with hepatic steatosis, liver enzymes, and insulin resistance in children with overweight/obesity. Pediatr Diabetes. 2020;21(4):565–574. doi:10.1111/pedi.13011
10. Krisnamurti DGB, Purwaningsih EH, Tarigan TJE, Soetikno V, Louisa M. Hematological indices and their correlation with glucose control parameters in a prediabetic rat model. Vet World. 2022;15(3):672–678. doi:10.14202/vetworld.2022.672-678
11. Park JM, Lee DC, Lee YJ. Relationship between high white blood cell count and insulin resistance (HOMA-IR) in Korean children and adolescents: Korean national health and nutrition examination survey 2008–2010. Nutr Metab Cardiovasc Dis. 2017;27(5):456–461. doi:10.1016/j.numecd.2017.03.002
12. Ngiam KY, Khor IW. Big data and machine learning algorithms for health-care delivery. Lancet Oncol. 2019;20(5):e262–e273. doi:10.1016/s1470-2045(19)30149-4
13. Yu KH, Beam AL, Kohane IS. Artificial intelligence in healthcare. Nat Biomed Eng. 2018;2(10):719–731. doi:10.1038/s41551-018-0305-z
14. Ksiazek W, Gandor M, Plawiak P. Comparison of various approaches to combine logistic regression with genetic algorithms in survival prediction of hepatocellular carcinoma. Comput Biol Med. 2021;134:104431. doi:10.1016/j.compbiomed.2021.104431
15. Rehman A, Kashif M, Abunadi I, Ayesha N. Lung cancer detection and classification from chest CT scans using machine learning techniques. 2021.
16. Kim J, Mun S, Lee S, Jeong K, Baek Y. Prediction of metabolic and pre-metabolic syndromes using machine learning models with anthropometric, lifestyle, and biochemical factors from a middle-aged population in Korea. BMC Public Health. 2022;22(1):664. doi:10.1186/s12889-022-13131-x
17. Zou Q, Qu K, Luo Y, Yin D, Ju Y, Tang H. Predicting diabetes mellitus with machine learning techniques. Front Genet. 2018;9:515. doi:10.3389/fgene.2018.00515
18. Park S, Kim C, Wu X. Development and validation of an insulin resistance predicting model using a machine-learning approach in a population-based cohort in Korea. Diagnostics. 2022;12(1). doi:10.3390/diagnostics12010212
19. Lee CL, Liu WJ, Tsai SF. Development and validation of an insulin resistance model for a population with chronic kidney disease using a machine learning approach. Nutrients. 2022;14(14). doi:10.3390/nu14142832
20. Tagi VM, Giannini C, Chiarelli F. Insulin resistance in children. Front Endocrinol. 2019;10:342. doi:10.3389/fendo.2019.00342
21. Han R, Zhang Y, Jiang X. Relationship between four non-insulin-based indexes of insulin resistance and serum uric acid in patients with type 2 diabetes: a cross-sectional study. Diabetes Metab Syndr Obes. 2022;15:1461–1471. doi:10.2147/DMSO.S362248
22. Yin J, Li M, Xu L, et al. Insulin resistance determined by Homeostasis Model Assessment (HOMA) and associations with metabolic syndrome among Chinese children and teenagers. Diabetol Metab Syndr. 2013;5(1):71. doi:10.1186/1758-5996-5-71
23. Pan SY, de Groh M, Aziz A, Morrison H. Relation of insulin resistance with social-demographics, adiposity and behavioral factors in non-diabetic adult Canadians. J Diabetes Metab Disord. 2015;15:31. doi:10.1186/s40200-016-0253-7
24. Koren D, Taveras EM. Association of sleep disturbances with obesity, insulin resistance and the metabolic syndrome. Metabolism. 2018;84:67–75. doi:10.1016/j.metabol.2018.04.001
25. Myers J, Kokkinos P, Nyelin E. Physical activity, cardiorespiratory fitness, and the metabolic syndrome. Nutrients. 2019;11(7):1652. doi:10.3390/nu11071652
26. Lee CT, Harris SB, Retnakaran R, et al. White blood cell subtypes, insulin resistance and β-cell dysfunction in high-risk individuals–the PROMISE cohort. Clin Endocrinol. 2014;81(4):536–541. doi:10.1111/cen.12390
27. Park JM, Lee JW, Shim JY, Lee YJ. Relationship between platelet count and insulin resistance in Korean adolescents: a nationwide population-based study. Metab Syndr Relat Disord. 2018;16(9):470–476. doi:10.1089/met.2018.0016
28. Ferreira D, Severo M, Araújo J, Barros H, Guimarães JT, Ramos E. Association between insulin resistance and haematological parameters: a cohort study from adolescence to adulthood. Diabetes Metab Res Rev. 2019;35(8):e3194. doi:10.1002/dmrr.3194
29. Cruz-Pineda WD, Garibay-Cerdenares OL, Rodriguez-Ruiz HA, et al. Changes in the expression of insulin pathway, neutrophil elastase and alpha 1 antitrypsin genes from leukocytes of young individuals with insulin resistance. Diabetes Metab Syndr Obes. 2022;15:1865–1876. doi:10.2147/DMSO.S362881
30. Flores-Viveros KL, Aguilar-Galarza BA, Ordonez-Sanchez ML, et al. Contribution of genetic, biochemical and environmental factors on insulin resistance and obesity in Mexican young adults. Obes Res Clin Pract. 2019;13(6):533–540. doi:10.1016/j.orcp.2019.10.012
31. Bonneau GA, Pedrozo WR, Berg G. Adiponectin and waist circumference as predictors of insulin-resistance in women. Diabetes Metab Syndr. 2014;8(1):3–7. doi:10.1016/j.dsx.2013.10.005
32. Xu W, Zhang J, Zhang Q, Wei X. Risk Prediction of Type II Diabetes Based on Random Forest Model. IEEE. 2017:382–386.
33. Karimi-Alavijeh F, Jalili S, Sadeghi M. Predicting metabolic syndrome using decision tree and support vector machine methods. ARYA Atheroscler. 2016;12(3):146–152.
34. Choe EK, Rhee H, Lee S, et al. Metabolic syndrome prediction using machine learning models with genetic and clinical information from a nonobese healthy population. Genomics Inform. 2018;16(4):e31. doi:10.5808/GI.2018.16.4.e31
35. Stawiski K, Pietrzak I, Mlynarski W, Fendler W, Szadkowska A. NIRCa: an artificial neural network-based insulin resistance calculator. Pediatr Diabetes. 2018;19(2):231–235. doi:10.1111/pedi.12551
36. Moreira SR, Ferreira AP, Lima RM, et al. Predicting insulin resistance in children: anthropometric and metabolic indicators. J Pediatr. 2008;84(1):47–52. doi:10.2223/JPED.1740
37. Lin H, Tas E, Borsheim E, Mercer KE. Circulating miRNA signatures associated with insulin resistance in adolescents with obesity. Diabetes Metab Syndr Obes. 2020;13:4929–4939. doi:10.2147/DMSO.S273908
38. Svedberg J, Strömblad G, Wirth A, Smith U, Björntorp P. Fatty acids in the portal vein of the rat regulate hepatic insulin clearance. J Clin Invest. 1991;88(6):2054–2058. doi:10.1172/jci115534
39. Velásquez-Rodríguez CM, Velásquez-Villa M, Gómez-Ocampo L, Bermúdez-Cardona J. Abdominal obesity and low physical activity are associated with insulin resistance in overweight adolescents: a cross-sectional study. BMC Pediatr. 2014;14:258. doi:10.1186/1471-2431-14-258
40. Petersen MC, Shulman GI. Mechanisms of insulin action and insulin resistance. Physiol Rev. 2018;98(4):2133–2223. doi:10.1152/physrev.00063.2017
41. Goecks J, Jalili V, Heiser LM, Gray JW. How machine learning will transform biomedicine. Cell. 2020;181(1):92–101. doi:10.1016/j.cell.2020.03.022
42. Saberi-Karimian M, Khorasanchi Z, Ghazizadeh H, et al. Potential value and impact of data mining and machine learning in clinical diagnostics. Crit Rev Clin Lab Sci. 2021;58(4):275–296. doi:10.1080/10408363.2020.1857681
 © 2022 The Author(s). This work is published and licensed by Dove Medical Press Limited. The full terms of this license are available at https://www.dovepress.com/terms.php and incorporate the Creative Commons Attribution - Non Commercial (unported, v3.0) License.
By accessing the work you hereby accept the Terms. Non-commercial uses of the work are permitted without any further permission from Dove Medical Press Limited, provided the work is properly attributed. For permission for commercial use of this work, please see paragraphs 4.2 and 5 of our Terms.
© 2022 The Author(s). This work is published and licensed by Dove Medical Press Limited. The full terms of this license are available at https://www.dovepress.com/terms.php and incorporate the Creative Commons Attribution - Non Commercial (unported, v3.0) License.
By accessing the work you hereby accept the Terms. Non-commercial uses of the work are permitted without any further permission from Dove Medical Press Limited, provided the work is properly attributed. For permission for commercial use of this work, please see paragraphs 4.2 and 5 of our Terms.