")
Back to Journals » International Journal of Nanomedicine » Volume 11
Silver nanoparticles inhibit the function of hypoxia-inducible factor-1 and target genes: insight into the cytotoxicity and antiangiogenesis
Authors Yang T, Yao Q, Cao F, Liu Q, Liu B, Wang XH
Received 1 April 2016
Accepted for publication 27 July 2016
Published 8 December 2016 Volume 2016:11 Pages 6679—6692
DOI https://doi.org/10.2147/IJN.S109695
Checked for plagiarism Yes
Review by Single anonymous peer review
Peer reviewer comments 3
Editor who approved publication: Dr Linlin Sun
Tieshan Yang,1 Qian Yao,1 Fei Cao,1 Qianqian Liu,1 Binlei Liu,2 Xiu-Hong Wang1
1Laboratory for Biomedical Photonics, Institute of Laser Engineering, Beijing University of Technology, 2Cancer Institute and Hospital, Chinese Academy of Medical Sciences and Peking Union Medical College, Beijing, People’s Republic of China
Abstract: Hypoxia-inducible factor-1 (HIF-1) is a transcription factor that is activated upon exposure to hypoxic stress. It modulates a number of cellular responses including proliferation, apoptosis, angiogenesis, and metabolism by activating a panel of target genes in response to hypoxia. The HIF-1 level is often upregulated in the hypoxic microenvironment of solid tumors, which contributes to cancer treatment failure. Here we report that silver nanoparticles (AgNPs), which are widely used as an antimicrobial agent, are an effective inhibitor of HIF-1. AgNPs inhibited the activation of a HIF-dependent reporter construct after the cells were exposed to hypoxic conditions or treated with cobalt chloride, a hypoxia mimetic agent. The AgNPs also interfered with the accumulation of HIF-1α protein and the induction of the endogenous HIF target genes, VEGF-A and GLUT1. Since both HIF-1 and vascular endothelial growth factor-A play an important role in angiogenesis, AgNPs also inhibited angiogenesis in vitro. Our data reveal a new mechanism of how AgNPs act on cellular function, that is, they disrupt HIF signaling pathway. This finding provides a novel insight into how AgNPs can inhibit cancer cell growth and angiogenesis.
Keywords: silver nanoparticles (AgNPs), hypoxia-inducible factor, transcriptional activity, vascular endothelial growth factor-A, angiogenesis
Introduction
A hypoxic tumor microenvironment (TME) is widespread in solid tumors. It is a result of the disrupted balance between supply and consumption of cellular O2, owing to fast tumor growth and irregular vasculature.1–4 Hypoxia and high proliferation of cancer cells, in turn, produce excessive reactive oxygen species, such as hydrogen peroxide, promote angiogenesis, and lead to metastasis of cancer cells.5,6 A hypoxic TME also contributes to the tumor’s resistance to conventional cancer therapy and promotes clinically aggressive phenotypes in cancers.7,8 Hypoxia-inducible factors (HIFs), are oxygen-sensitive transcription factors that respond to the reduction of oxygen level, or hypoxia, in the cellular environment.9,10 The best studied member is HIF-1α, which forms a transcriptionally active heterodimeric complex with HIF-1β.11,12 Under normoxic conditions, the expression of HIF-1α is maintained at very low levels since it is effectively directed to a degradation cascade. However, when the oxygen level is sufficiently reduced, the degradation machinery is disrupted and HIF-1α is stabilized. HIF-1α then translocates to the nucleus and binds, as part of a dimeric complex with the constitutively expressed HIF-1β protein, to hypoxia-responsive elements (HREs) in promoters, modulating the expression of specific downstream target genes.
The largest functional group of genes consistently regulated by HIF-1 in a number of cell types is associated with angiogenesis (vascular endothelial growth factor-A [VEGF-A]), metabolism (glucose transporter type 1 [GLUT1]), and apoptosis/survival (BCL2, E1B).13–15 HIF-1 plays a pivotal role in adaptive responses to hypoxia by modulating various cellular functions through the induction of target genes.16–19 Overexpression of HIF-1 has been found in various cancer types and contributes to cancer progression and resistance to therapy. Its expression is also correlated with diagnostic and prognostic indicators for early relapse and metastatic disease, thus making HIF-1 a potential prognostic biomarker in cancer assessments. The importance of HIF-1 as a transcription factor and the broad spectrum of processes influenced by HIF suggest that it could have major clinical implications.20–22 Therefore, HIF-1 represents a logical target for chemoprevention as well as for inhibiting angiogenesis. To date, various strategies focusing on HIF-1 as a target for drug development have been reported.23–30 However, due to safety concerns, reagent stability, and inconsistent clinical response, the clinical applications of such strategies have been limited.
Silver nanoparticles (AgNPs) have received extensive attention for their broad-spectrum antimicrobial activities. They are used in different commercial products including textiles, humidifiers, wound dressings, and household devices. AgNPs are toxic to both cancer and noncancer cells. Anticancer effects of AgNPs have been reported in several cell lines as well as in animal models.31–37 It was reported that AgNPs are more toxic in cancerous cells than in normal cells because of the distinct cellular condition of cancer cells,38 whereas other reports demonstrated similar cytotoxicity toward cancer and noncancer cells.39,40 The cytotoxicity of AgNPs is reported to be through altering the mitochondrial membrane potential and by the induction of reactive oxygen species. Yet, the precise molecular mechanisms underlying the toxic effects of AgNPs toward cancer cells are largely unknown. In this study, we demonstrate that AgNPs inhibit MCF7 cancer cell growth by attenuating the activity of HIF-1α. We report that AgNPs act to inhibit HIF-1α function in cells under hypoxic conditions, thus leading to downregulation of VEGF-A and GLUT1 and inhibition of angiogenesis. Our data provide a novel insight into the mechanism of how AgNPs inhibit cancer cell growth and angiogenesis.
Materials and methods
Materials
AgNPs with an average size of ~10 nm were obtained from Nanjing XFNANO Materials Tech Co. Ltd. (Nanjing, People’s Republic of China). The human breast cancer cell line MCF7, the human cervical cancer cell line HeLa, and the human lymphoma cell lines Raji and Daudi were obtained from the American Type Culture Collection (Manassas, VA, USA). Human umbilical vein endothelial cells (HUVEC) were obtained from Shanghai AllCells Biotech Co. Ltd. (Shanghai, People’s Republic of China). Human primary chondrocytes were obtained with written consent from Procell Life Technology Co. Ltd. (Wuhan, People’s Republic of China), following ethical approval from the Beijing University of Technology review board. Dulbecco’s Modified Eagle’s Medium, RPMI-1640 medium with penicillin–streptomycin solution, L-glutamine, fetal bovine serum (FBS), and trypsin-ethylenediaminetetraacetic acid were obtained from Thermo Fisher Scientific (Waltham, MA, USA). MCDB-131 medium with L-glutamine, penicillin–streptomycin solution, FBS, heparin, endothelial cells growth supplement, and EGF were obtained from Sigma-Aldrich Co. (USA). Cell culture flasks and other plastic materials were purchased from Corning Incorporated (Corning, NY, USA). CellTiter 96® AQueous One Solution Reagent, ONE-Glo™ Luciferase Assay System, and plasmids were purchased from Promega Corporation (Fitchburg, WI, USA). The endothelial tube formation assay kit was purchased from Cell Biolabs Inc. (San Diego, CA, USA).
Characterization of AgNPs
Transmission electron micrographs were taken by using a JEM-2100 transmission electron microscope (JEOL, Tokyo, Japan) at 200 kV. The AgNPs were mounted on carbon-coated copper grids.
An ESCA+ X-ray photoelectron spectrometer with DAR 400 X-ray source (Scienta Omicron GmbH, Taunusstein, Germany) was used to determine the oxidation state of the AgNPs. The samples were immobilized onto 1×1 cm aluminum sheets, mounted on a sample holder, and quickly installed into the load lock to minimize air exposure. Scans with a spectral resolution of 0.1 eV were collected at 20 eV pass energy for the Ag 3d, O 1s, C 1s, S 2p, and N 1s regions of each sample. All peaks were corrected by referencing the primary peak of the C 1s signal at 284.8 eV. The X-ray photoelectron spectroscopy data were processed with CasaXPS 2.3.17 and Origin 8.0 software.
The zeta potential was measured using a Zetasizer Nano ZS (Malvern Instruments, Malvern, UK).
Cell culture
MCF7, HeLa cells, and human primary chondrocytes were cultured in DMEM with L-glutamine supplemented with 10% FBS and 1% penicillin–streptomycin. The lymphoma cell lines Raji and Daudi were cultured in RPMI-1640 medium with L-glutamine supplemented with 10% FBS and 1% penicillin–streptomycin. HUVEC were cultured in MCDB-131 medium with L-glutamine supplemented with 10% FBS, 0.05 mg/mL heparin, 0.03 mg/mL endothelial cells growth supplement, 0.2 ng/mL EGF, and 1% penicillin–streptomycin. Cells were maintained at 37°C in a humidified atmosphere of 5% CO2 and 95% air in an incubator. To culture cells under hypoxic condition, the cells were placed in a hypoxic chamber and equilibrated with 5% CO2, 94.9% N2, and 0.1% O2. The chamber was then sealed and placed in an incubator at 37°C.
MTS assays for cell viability
In vitro cell viability for different AgNP concentrations was determined using the CellTiter 96® AQueous One Solution Reagent. Cells were seeded onto 96-well plates (5×10³ cells/well) and then kept in an incubator overnight. After incubation, when the cells adhered to the bottom of the plate, the cell culture medium was replaced with fresh complete medium containing the indicated concentrations of AgNPs (0, 20, 40, 60, 80, 100, 200, and 400 μg/mL in medium, respectively). Subsequently, all cells were incubated under identical conditions for 48 hours. Then, 20 μL of 3-(4, 5-dimethylthiazol-2-yl)-5-(3-carboxymethoxyphenyl)-2-(4-sulfophenyl)-2H-tetrazolium, inner salt (MTS) was added and the cells were incubated for another 2 hours. In metabolically active cells, the MTS compound is bioreduced to a formazan product by dehydrogenase enzymes. The absorption of formazan is directly proportional to the number of living cells in the culture. The absorbance of the cell suspensions was measured at 490 nm using an Epoch Microplate Reader (Winooski, BioTek, USA). IC50 values were determined by nonlinear regression analysis using GraphPad Prism software version 5.0 (GraphPad Software, Inc., La Jolla, CA, USA).
Apoptosis assay
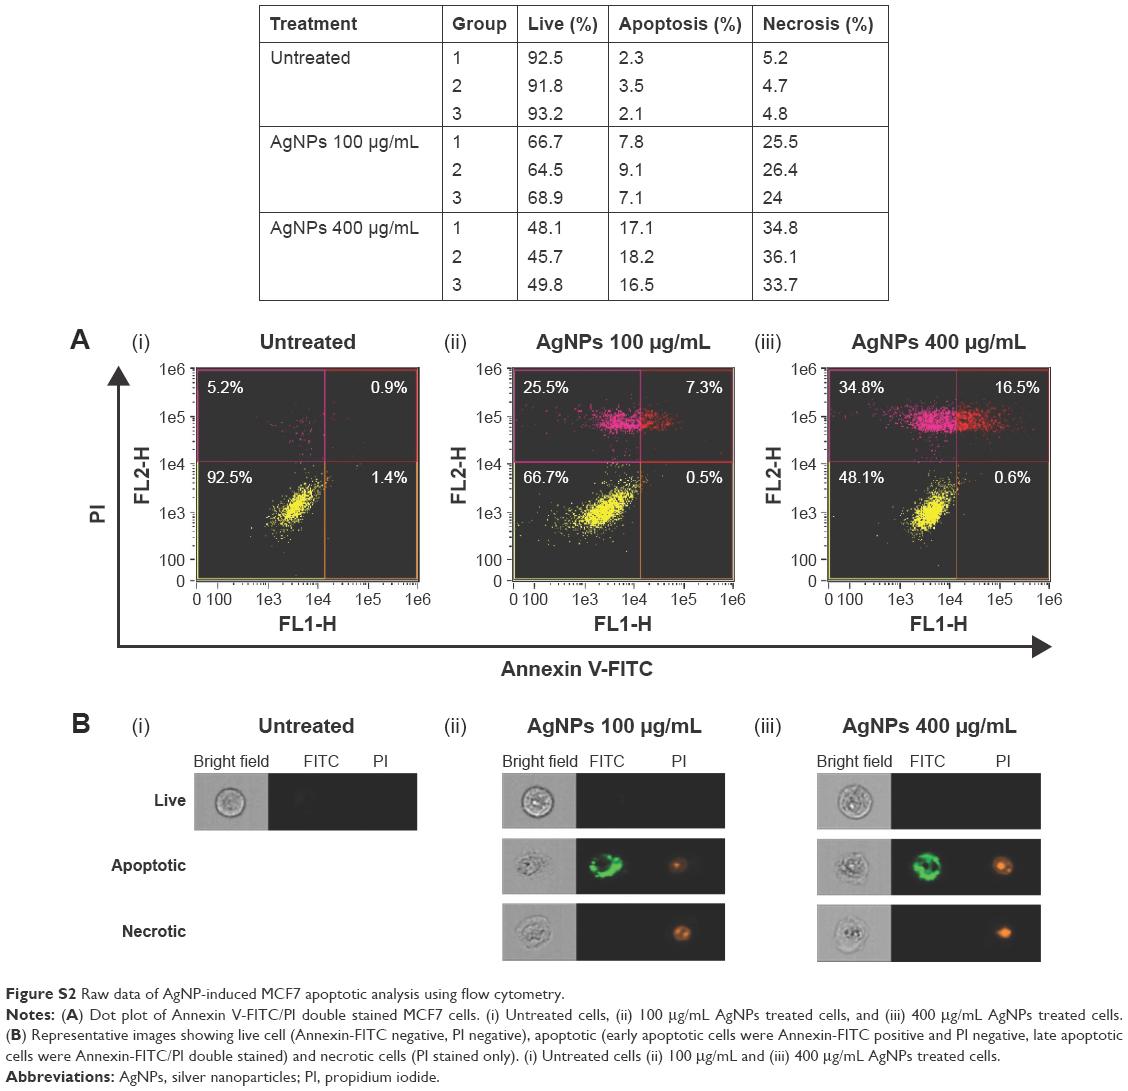
The number of apoptotic cells was measured using an Annexin V-FITC apoptosis detection kit (BD PharMingen, San Diego, CA, USA). MCF7 cells (1.0×10⁶ cells/dish) were cultured in a 6 cm dish, 1 day prior to the assay. On the next day, the cells were treated with various concentrations of AgNPs (0, 100, 400 μg/mL in complete medium, respectively). After 8 hours of treatment, the cells were trypsinized and collected by centrifugation at 1,500 rpm. The cell culture medium containing floating cells was also collected by centrifugation at 1,500 rpm. The cell pellets were then washed twice with 1× phosphate-buffered saline, resuspended in 100 μL of 1× binding buffer (10 mM HEPES/NaOH pH 7.4, 140 mM NaCl, 2.5 mM CaCl2, 0.1% BSA), and stained with 5 μL of Annexin V-FITC and 5 μL of propidium iodide. The cells were incubated in the dark for 15 minutes at room temperature and were then diluted in 400 μL of 1× binding buffer. Apoptosis was analyzed by collecting 10,000 cells using an Amnis FlowSight imaging flow cytometer and IDEAS software (Merk Millipore, Darmstadt, Germany).
Transient transfection and luciferase assays
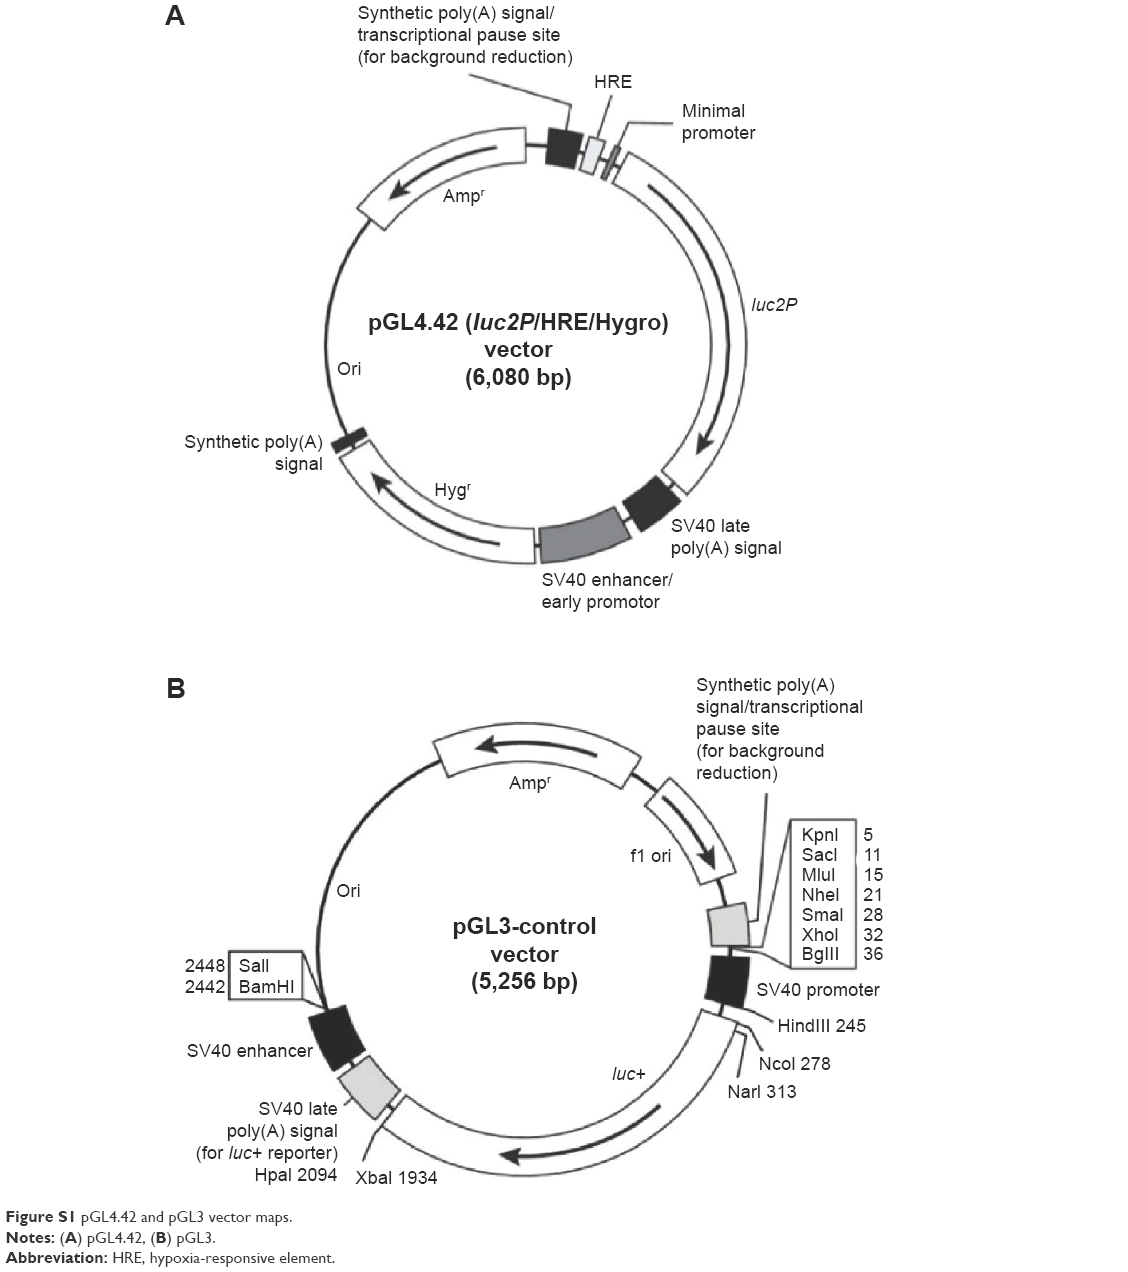
MCF7 cells (grown in a 10 cm tissue culture dish) were transfected with 5 μg of HRE-dependent luciferase reporter construct pGL4.42 or a control construct pGL3-promoter (Promega Corporation, Madison, USA) using the TransFast™ Reagent (Promega Corporation) according to the manufacturer’s instructions (pGL4.42 and pGL3 vector maps are provided in Figure S1). After 24 hours, the transfected cells were disassociated and plated in 96-well plates (5×10³ cells/well). The cells were incubated for 3 hours to be allowed to adhere before being treated with the indicated concentrations of AgNPs (0, 20, 40, 60, 80, and 100 μg/mL in medium). HIF activity was induced by incubating the cells in hypoxic (0.1% O2) conditions or by treating the cells with cobalt chloride (CoCl2, 250 μM) for 16 hours. The luciferase activity was measured after 2 minutes by adding 100 μL of ONE-Glo™ luciferase assay system (Promega Corporation) according to the manufacturer’s instructions using a Multimode Microplate Reader (Berthold Technologies, Bad Wildbad, Germany).
Western blot analysis
MCF7 cells were treated with the indicated concentrations of AgNPs (0, 10, 50, 100, 200 μg/mL) in hypoxic conditions for 24 hours, and then collected by centrifugation, washed twice with phosphate-buffered saline, and resuspended in 200 μL of precooled lysis buffer. After incubation on ice for 30 minutes, the cells were centrifuged at 4°C at 10,000 rpm for 10 minutes and the supernatant was stored at 4°C. The protein concentration was determined by the BCA method (Thermo Fisher Scientific, Shanghai, People’s Republic of China), and 50 μg of protein was loaded onto a precasted 10% sodium dodecyl sulfate-polyacrylamide gel electrophoresis gel. After electrophoresis, the proteins were transferred onto nitrocellulose membranes. The membranes were blocked in 5% nonfat dry milk for 1 hour, followed by incubation with primary antibodies of a mouse monoclonal anti-HIF-1α antibody (1:500 dilution; Abcam Trading Company Ltd, Shanghai, People’s Republic of China), a mouse monoclonal anti-HIF-2α antibody (1:500 dilution, Abcam), a rabbit anti-VEGF-A antibody (Abcam), a mouse anti-GLUT1 antibody (1:1,000 dilution, Abcam), and a rabbit anti-β-actin antibody (1:1,000 dilution; Hangzhou Zhixian Biotech, People’s Republic of China), respectively, overnight at 4°C with gentle shaking. After being washed in TBST, the membranes were probed with peroxidase-linked immunoglobulin G (1:5,000 dilution) conjugates for 2 hours at room temperature with shaking, and washed again in TBST. Then, they were detected by the enhanced chemiluminescence reagent kit (Amersham Life Science, Arlington Hts, IL, USA) using a gel image analysis system (Vilber Lourmat, Collégien, France).
RNA isolation and quantitative polymerase chain reaction analysis
MCF7 cells were lysed and the total RNA was extracted using the RNeasy Mini Kit (Qiagen NV, Venlo, the Netherlands) according to the manufacturer’s instructions. The isolated RNA was quantified using an Epoch Microplate Reader (BioTek). The total RNA was converted into complementary DNA using the GoScript™ reverse transcriptional system (Promega Corporation) with oligo (dT)15 primer following the manufacturer’s instructions. The complementary DNA was synthesized in a 20 μL reaction mixture containing 1 μg of total RNA, oligo (dT)15 primer, and GoScript™ reverse transcriptional system, and then diluted to 100 μL using nuclease-free water. Quantitative real-time polymerase chain reaction was performed in a 20 μL reaction volume containing 5 μL complementary DNA, 10 μL Universal Taqman PCR master mix (Thermo Fisher Scientific), and 1 μL of the Taqman Gene Expression Assay of interest (Thermo Fisher Scientific). The expression assays used in this study were: HIF-1α (Hs00153153_m1), VEGF-A (Hs00173626_m1), GLUT1 (Hs00892681_m1), and β-actin (Hs99999903_m1). All reactions were performed in triplicate using the ABI Prism 7500 Sequence Detection System (Thermo Fisher Scientific). The thermal cycles for the reaction were: 95°C for 10 minutes, followed by 40 cycles of 95°C for 15 seconds alternating with 60°C for 1 minute. The relative expression abundance of each target gene was qualified using the comparative threshold cycle (CT) value with β-actin as an internal control.
Angiogenesis and confocal microscopy
In vitro angiogenesis was assessed by the endothelial tube formation assay kit (Cell Biolabs Inc.) according to the manufacturer’s instructions. The ECM gel solution was thawed out at 4°C, 1 day before the experiment. Then, 50 μL of thawed ECM gel solution was added to each well of a prechilled 96-well plate and then incubated at 37°C for 30 minutes to allow the ECM solution to form a gel. HUVEC were harvested and resuspended in complete culture medium containing various concentrations of AgNPs (0, 50, 100, 200, 400 μg/mL). Then, 150 μL of cell suspension was added to each well (1.5×10⁴ cells/well) and the assay plate was then incubated at 37°C for 16 hours. The cells were stained with a fluorescence dye provided by the manufacturer. The tube formation of HUVEC was observed and analyzed using a confocal microscope (TCS SP8; Leica Microsystems, Wetzlar, Germany) and imaged at 10× magnification.
Statistical analysis
All data are expressed as the mean ± standard deviation of three independent experiments. The statistical significance was determined by either Student’s t-test or analysis of variance. A P-value <0.05 was considered significant.
Results and discussion
AgNPs inhibit cancer cell growth and induce apoptosis
In this study, spherical AgNPs with a diameter of 10 nm were used (Figure 1A [i]). The zeta potential of the AgNPs was found to be −47.8 mV, which suggests that the nanoparticles were negatively charged. The oxidation status of silver was examined by X-ray photoelectron spectroscopy analysis. Figure 1A (ii) shows the high-resolution Ag 3d X-ray photoelectron spectrum of the AgNPs. The Ag 3d peak of the AgNPs shows a remarkable shift (0.3–0.4 eV) to lower binding energy, compared to the Ag 3d peak position of metallic Ag reported in the literature.41 The observed shift of 0.3–0.4 eV correlates with the formation of Ag2O,42,43 suggesting that Ag was in an oxidized form. After the AgNPs were dispersed in cell culture medium for 24, 48, and 72 hours, respectively, the ultraviolet–visible absorbance spectra remained largely unchanged (Figure 1A [iii]), indicating the AgNPs were stable in the test medium.
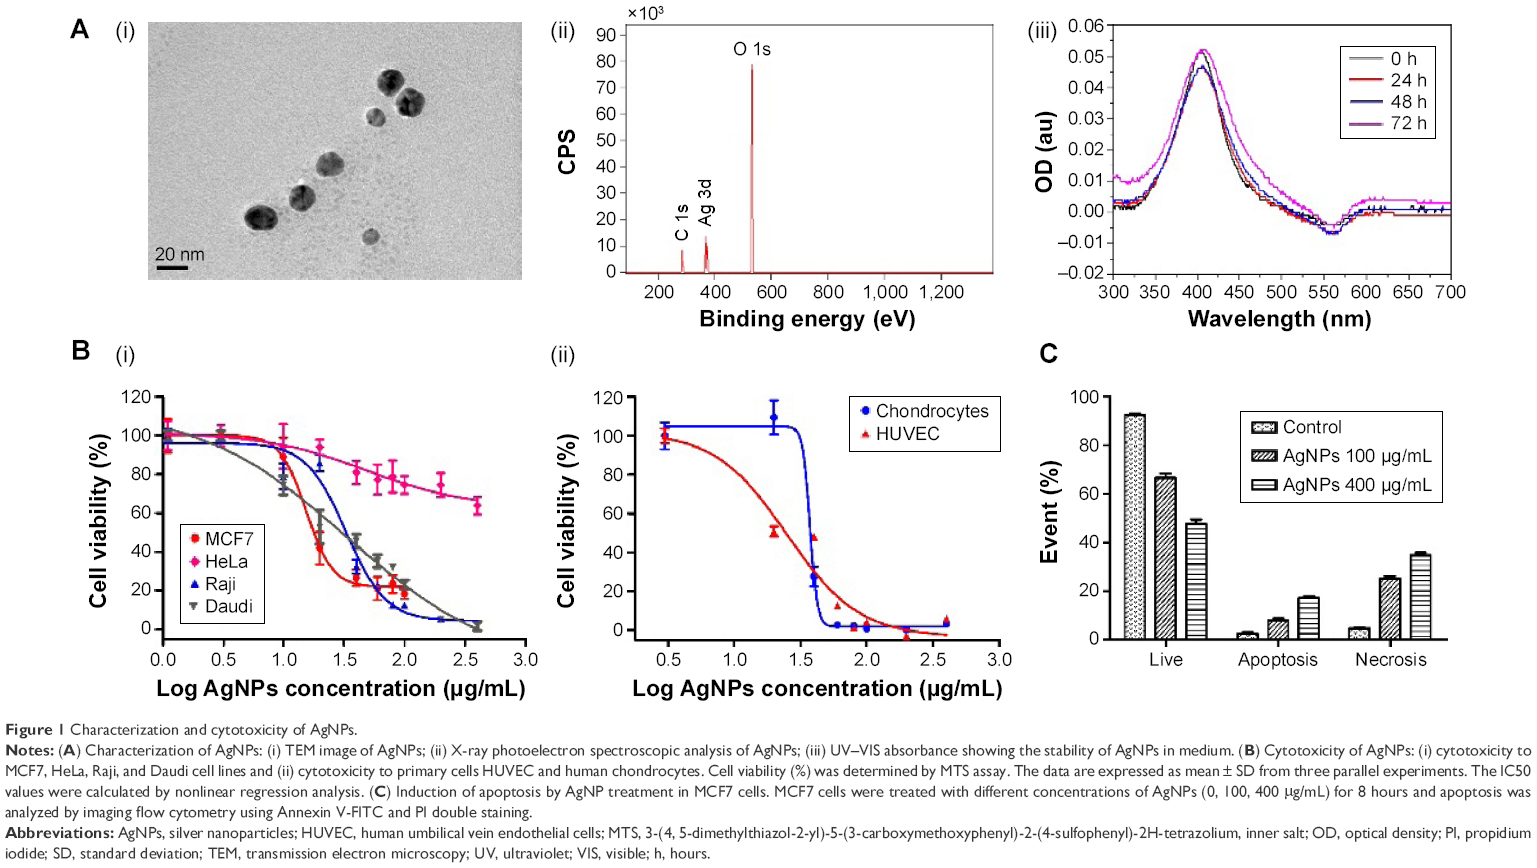 | Figure 1 Characterization and cytotoxicity of AgNPs. |
Human breast cancer cells MCF7, human cervical carcinoma cells HeLa, and human lymphoma cells Raji and Daudi were incubated with various concentrations of AgNPs for 48 hours. Subsequently, MTS assays were performed to determine the cell viability. AgNPs inhibited cancer cell growth in a dose-dependent manner (Figure 1B [i]). The IC50 value of each cell line was determined using a nonlinear regression analysis. The IC50 values for MCF7, Raji, and Daudi cell lines were determined to be 15.5, 33.02, and 34.35 μg/mL, respectively. The cytotoxicity of AgNPs to human primary cells was also measured. The IC50 value for HUVEC was 24.97 μg/mL, and for human chondrocytes, it was 37.35 μg/mL (Figure 1B [ii]). These findings show that the AgNPs have a distinct cytotoxicity toward different cell types (P<0.0001 by analysis of variance). The cytotoxicity of AgNPs largely depends on the intracellular physiological conditions, such as pH, redox state, and so on, which may vary from one type of cell to another, giving rise to a distinct cellular response to the AgNPs and, thus, influencing the cytotoxicity of the AgNPs.
To further analyze the cytotoxicity of the AgNPs, we performed an apoptotic analysis using flow cytometry. MCF7 cells were treated with AgNPs for 8 hours and then double-stained with Annexin V-FITC and propidium iodide. The statistical data are summarized and plotted in Figure 1C (raw data are shown in Figure S2). The AgNPs induced apoptosis in a concentration-dependent manner. The percentage of live MCF7 cells decreased from 92.5% to 66.7% and 48.5%, while the percentage of apoptotic cells increased from 2.3% to 7.8% and 17.1% and the percentage of necrotic cells increased from 5.2% to 25.5% and 34.8% following treatment with 100 and 400 μg/mL AgNPs, respectively. These results indicate that apoptosis played a role in the mechanism of cell death induced by AgNPs.
AgNPs interfere with the transcriptional activity of HIF-1α
AgNPs can enter cells through diffusion or endocytosis and cause mitochondrial dysfunction, lead to generation of reactive oxygen species, which induce damages to proteins and nucleic acids inside the cell, and finally inhibit cell proliferation. The interaction of AgNPs with proteins, nucleic acids, and cell membrane all contribute to the toxicity of AgNPs. However, it is still unclear which key signaling pathways are involved. Cell signaling governs basic cellular activities and coordinates cellular actions through a complex harmonization of responses to the cellular microenvironment. By understanding the effects of AgNPs on cancer cell signaling, new therapeutic approaches may be developed. Since hypoxic microenvironment is a major feature of most solid tumors, we investigated the effects of AgNPs on the HIF signaling pathway.
The central function of HIF-1 is its transcriptional activity. HIF-1 binds to a specific DNA sequence called the HRE of target genes, and activates the transcription of target genes from DNA to messenger RNA (mRNA). Therefore, we first analyzed the effects of AgNPs on the activity of a HRE-dependent reporter construct.44 Since the response to hypoxia in human MCF7 breast cancer cells has been well characterized, we selected MCF7 cells to investigate the effects of AgNPs on HIF-1. MCF7 cells were transfected with the HRE reporter construct. A second reporter construct (pGL3-promoter) which shows no response to hypoxia was included as a control experiment. The transfected cells were treated with increasing amounts of AgNPs and cultured under hypoxic (0.1% O2) conditions. Hypoxia caused a strong induction of the HRE reporter construct (Figure 2A [i]), whereas the activity of the control construct was largely unchanged under hypoxic conditions (Figure 2A [ii]). The AgNPs significantly decreased the activity of the HRE reporter in a dose-dependent manner in cells under hypoxic conditions (Figure 2A [i]). At 100 μg/mL concentration, the AgNPs inhibited ~80% of HIF-1 transcriptional activity. These effects were specific, since the activity of the control reporter construct was unaltered (Figure 2A [ii]).
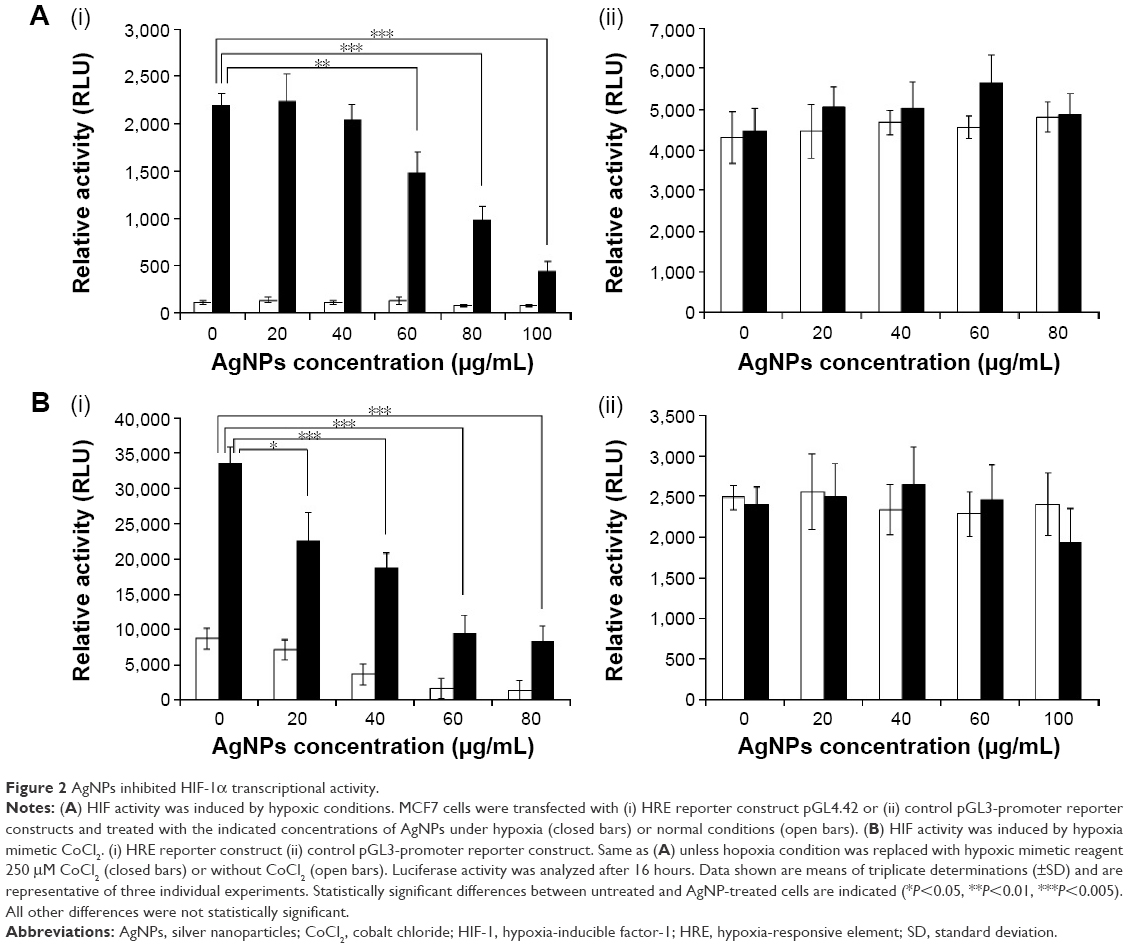 | Figure 2 AgNPs inhibited HIF-1α transcriptional activity. |
Hypoxia can alternatively be induced aerobically by adding hypoxia mimetics like CoCl2. CoCl2 artificially induces hypoxia, a process also known as “pseudohypoxia”, by blocking the degradation of HIF-1α, which leads to a accumulation of HIF-1α in the cell.45,46 Many reports have indicated that both CoCl2 and hypoxia regulate a similar group of genes on a global gene expression level.47 In order to confirm the findings obtained under hypoxic conditions, we also investigated the effects of AgNPs on the transcriptional activity of HIF under pseudohypoxia conditions induced by CoCl2. We transfected the cells with the HRE construct and treated the cells in the presence of CoCl2 with increasing concentrations of AgNPs. We found that, in the absence of AgNPs, CoCl2 caused a marked induction of the HRE reporter construct (Figure 2B [i]), with little effect on the control reporter construct (Figure 2B [ii]). The induction of the HRE construct was inhibited in a dose-dependent manner for increasing concentrations of AgNPs (Figure 2B [i]), while the activity of the control reporter remained unaffected (Figure 2B [ii]).
AgNPs decrease the accumulation of HIF-1α and HIF-2α proteins
To investigate the mechanism by which AgNPs inhibited the HIF-dependent transcription, we first analyzed the effects of AgNPs on protein accumulation of HIF-1α in cells cultured under hypoxic conditions. MCF7 cells were exposed to hypoxia for 16 hours in the presence or absence of AgNPs. The HIF-1α protein level was barely detectable in cells under normoxia, while it was strongly increased in cells exposed to hypoxia, due to inhibition of proteasomal degradation (Figure 3A). The AgNPs decreased the accumulation of the HIF-1α protein in a dose-dependent manner, while the level of the loading control β-actin remained unchanged. The HIF-1α protein level was strongly reduced when the cells were treated with AgNPs at a concentration of 50 μg/mL, and a concentration of 200 μg/mL completely inhibited the accumulation of HIF-1α.
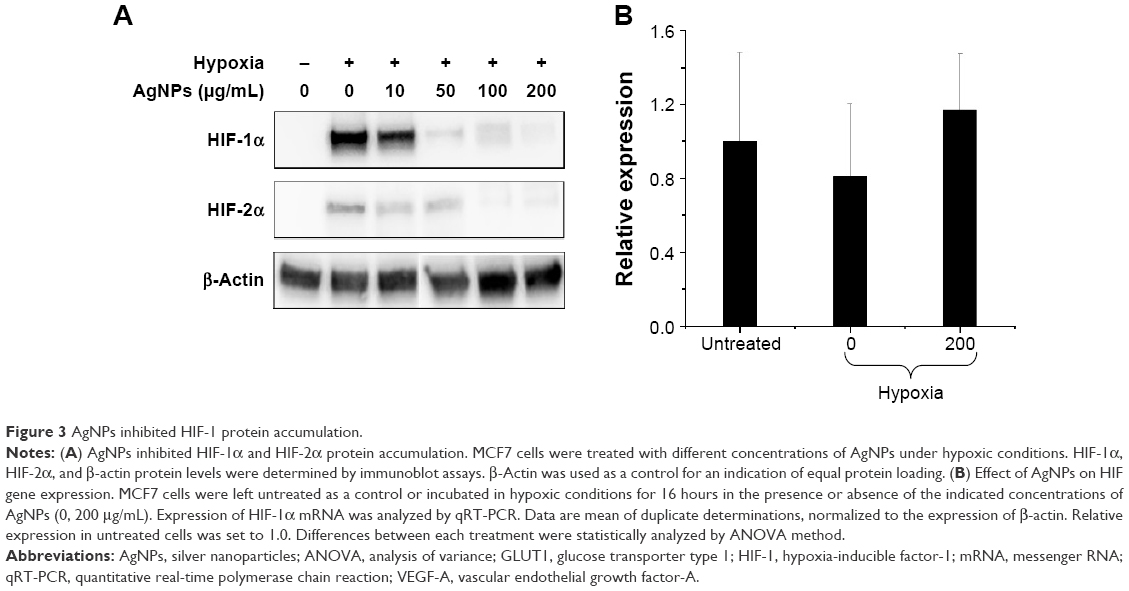 | Figure 3 AgNPs inhibited HIF-1 protein accumulation. |
In addition to HIF-1α, the HIF family of transcription factors also contains HIF-2α, which, like HIF-1α, is also induced by hypoxia and forms transcriptionally active heterodimers with HIF-1β. HIF-2α also appears to play a role in angiogenesis and carcinogenesis, and may regulate the expression of distinct, but overlapping, set of target genes, compared to HIF-1α. Like HIF-1α, HIF-2α is targeted for rapid proteasomal degradation in normoxic conditions. To investigate the effects of AgNPs on HIF-2α, MCF7 cells were exposed to hypoxia for 16 hours in the presence or absence of AgNPs. Similar to HIF-1α, the AgNPs strongly decreased HIF-2α protein accumulation (see Figure 3A).
Although the stabilization of HIF-1α protein plays a major role in the induction of HIF-1 activity in hypoxic cells, HIF-1α RNA transcription is also subject to tight regulation. We, therefore, analyzed the effects of AgNPs on the levels of HIF-1α mRNA with the quantitative real-time polymerase chain reaction technique. The differences between HIF-1α mRNA expression levels upon various treatments were not statistically significant (P<0.05). Exposure to hypoxia did not alter the mRNA expression levels of HIF-1α in the absence of AgNPs treatment and AgNPs treatment did not alter the expression levels of HIF-1α mRNA (Figure 3B), indicating that the transcription of the HIF-1α gene is not affected by the AgNPs. We, therefore, conclude that AgNPs only interfered with the protein accumulation of HIF-1α.
Previously, it was reported that AgNPs increase the expression of HIF-1 when inducing HIF-1 gene expression in the nematode Caenorhabditis elegans due to the oxidative stress induced by the AgNPs.48,49 In mammalian cell lines, however, although AgNPs promote cellular oxidative stress, the connection between HIF-1 activation and oxidative stress remains unclear. Our findings suggest that AgNPs may regulate HIF-1 functions in different organisms differently.
AgNPs repress the expression of HIF-1 target genes
Activation of HIF-1α is associated with increased expression levels of HIF-1 target genes. To determine the effect of AgNPs on HIF-1 target gene expression at mRNA level, MCF7 cells were exposed to hypoxia for 16 hours in the presence or absence of AgNPs and the expression of the HIF-1 target genes VEGF-A and GLUT1 was analyzed by quantitative real-time polymerase chain reaction. The mRNA expression levels of VEGF-A and GLUT1 were strongly induced by hypoxia in the absence of AgNPs, while AgNPs caused a statistically significant inhibition of the induction of VEGF-A and GLUT1 gene expression (Figure 4A [i, ii]). At a concentration of 50 μg/mL, the AgNPs almost completely inhibited the mRNA expression of VEGF-A and GLUT1. This finding is consistent with the ability of the AgNPs to inhibit HIF-dependent transcription, as shown in the “AgNPs interfere with the transcriptional activity of HIF-1α” section.
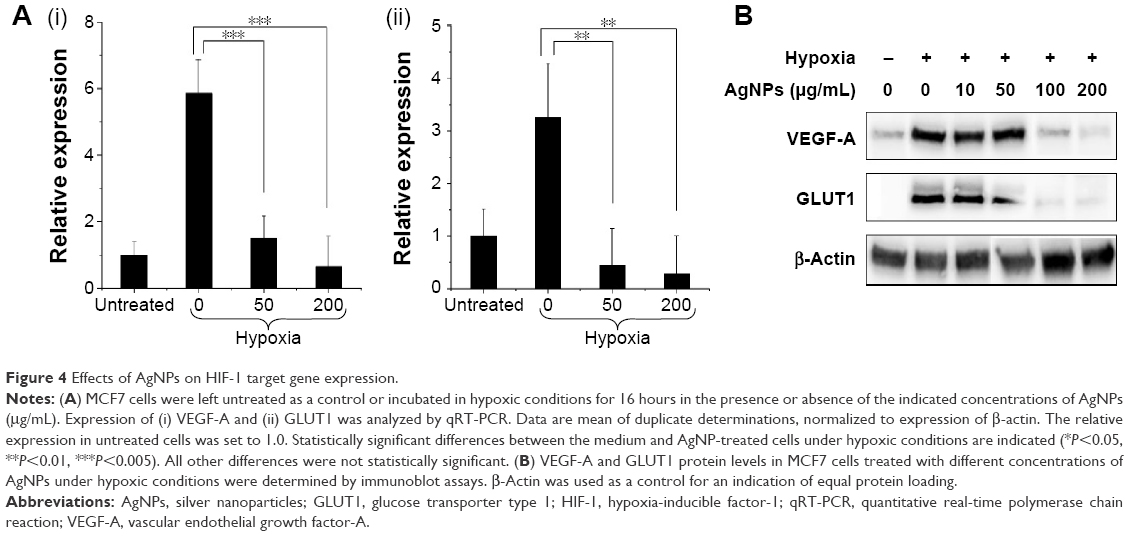 | Figure 4 Effects of AgNPs on HIF-1 target gene expression. |
The effects of AgNPs on VEGF-A and GLUT1 expression at protein level were also evaluated by Western blotting analysis and the results are shown in Figure 4B. Hypoxia treatment strongly induced protein expression of VEGF-A and GLUT1 in the absence of AgNPs, while in the presence of AgNPs, VEGF-A and GLUT1 protein levels were markedly decreased in a dose-dependent manner. Also, 100 μg/mL of AgNPs caused a sharp decrease in VEGF-A protein level and almost completely abolished GLUT1 protein expression.
Cancer cells require a steady source of metabolic energy in order to continue their uncontrolled growth and proliferation. Accelerated glycolysis is, therefore, one of the biochemical characteristics of cancer cells. Recent work indicates that glucose transport and metabolism are essential for the posttreatment survival of tumor cells, leading to poor prognosis. Facilitative glucose transporters (GLUTs) allow the energy-independent transport of glucose across the hydrophobic cell membrane, down its concentration gradient. Malignant cells have accelerated metabolism and increased requirements for adenosine triphosphate production. Upregulation of GLUT1 expression frequently occurs in tumor cells, which may be a fundamental part of the neoplastic process. Inhibition of GLUT1 should, therefore, cut the energy supply of the tumor cells and starve the cells.
Our data reveal that the AgNP-induced cell death was through inhibiting HIF-1α function and subsequently downregulating its target gene expression, providing a new mechanism of AgNP cytotoxicity. Recently, it was reported that hypoxia-induced HIF-1 expression inhibited AgNP-triggered apoptosis by mediating autophagic flux in human lung cancer cells.38 The report revealed one mechanism by which HIF-1 inhibits apoptosis and promotes cell survival. Given the fact that HIF-1 can transactivate genes involved in cell proliferation and survival (VEGF, GLUT1, etc) under hypoxic conditions, it is also possible that HIF-1 inhibits AgNP-induced apoptosis by induction of its target genes responsible for cell survival. Our findings together with the reported data indicate that HIF-1 and AgNPs regulate cell fate toward opposite directions. AgNPs induce cell apoptosis, whereas HIF-1 promotes cell survival. There might be multiple mechanisms involved. Understanding the underlined mechanisms would help to develop new strategies targeting HIF-1 with AgNPs for cancer therapy.
AgNPs inhibit in vitro angiogenesis
Angiogenesis is a physiological process through which new blood vessels form from preexisting vessels. It is a normal and vital process in growth and development, as well as in wound healing and in the formation of granulation tissue. However, it is also a fundamental step in the transition of tumors from a benign state to a malignant one. This motivates the use of angiogenesis inhibitors in cancer treatment. Angiogenesis is a very complex process; up to now, more than 40 molecules have been identified to be involved in blood vessel recruitment. Tube formation of endothelial cells is one of the key steps of angiogenesis.50 VEGF plays a central role in the angiogenic process. By binding to HRE, HIF-1 directly activates the transcription of VEGF and VEGF receptor (VEGFR-1). Since we have found that AgNPs inhibited HIF-1α protein accumulation and HIF-1 targets the gene expression of VEGF-A and GLUT1, we expected that the AgNPs would also inhibit angiogenesis. To put this to the test, we investigated whether AgNPs inhibited capillary-like tube formation of HUVEC. To this end, HUVEC were cultured on an extracellular matrix scaffold in the presence or absence of different concentrations of AgNPs. After 16 hours incubation, HUVEC morphogenesis was monitored. In the absence of AgNPs, HUVEC differentiate into structures loosely resembling capillary vessels (Figure 5A). The angiogenic property was quantified by counting the branch numbers (Figure 5B). AgNP treatment at a concentration of 50 μg/mL inhibited tube formation of HUVEC on Matrigel by 62.5% and at a concentration of 400 μg/mL, it completely inhibited tube formation (Figure 5A and B). These results suggest that AgNPs block in vitro angiogenesis by inhibiting tube formation.
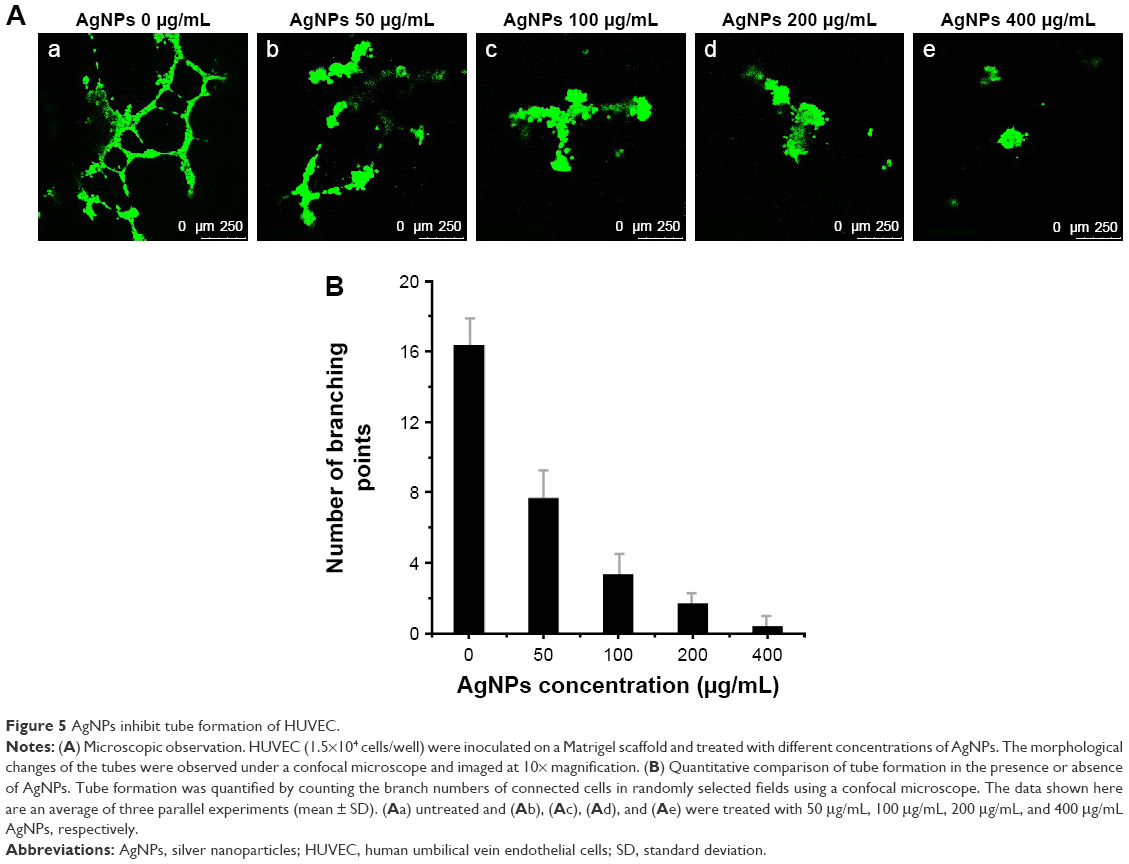 | Figure 5 AgNPs inhibit tube formation of HUVEC. |
Angiogenesis is primarily regulated by VEGF, which plays a critical role in tumor progression and metastasis.51 The molecular mechanisms that promote angiogenesis, metabolism, and apoptosis in cancer cells are complex; however, the HIF family of oxygen-sensitive transcription factors plays a critical role. Tumor cells produce and release VEGF in response to oxygen and nutrient deprivation. VEGF, in turn, stimulates the formation of new vessels and promotes tumor growth and dissemination. Besides its role in new blood vessel formation, VEGF has also been shown to stimulate the proliferation and migration of breast cancer cells. Thus, the switch to a proangiogenic state is a critical step in cancer development.52,53 Previous studies demonstrated the critical role of HIF-1α in the expression of VEGF and other angiogenic cytokines during hypoxia-induced angiogenesis.54,55 In fact, the observation that hypoxic tumors produce large amounts of VEGF supported the strategy of anti-VEGF for the treatment of cancer. The antiangiogenesis property of AgNPs has been elucidated in several reports,56,57 but the molecular mechanisms underlying the inhibition remain unclear. Here we revealed that AgNPs inhibit in vitro angiogenesis by disrupting the HIF signaling pathway and downstream VEGF-A function.
Hypoxia or oxygen deficiency is an important feature of solid tumors. Hypoxic TME has been shown to contribute to the resistance to conventional cancer therapies and tumor relapse, and is correlated with advanced stages of malignancy. In addition, the current antiangiogenic drugs targeting VEGF or its receptors used in cancer treatment may cause hypoxia due to a blockage of the tumor’s blood supply, which may stimulate tumor progression and treatment resistance. To date, various strategies have been proposed to modify the TME and aimed to improve the tumor’s oxygen level in order to improve the outcome of radiotherapy, chemotherapy, and immunotherapy. For example, hypoxia-activated prodrugs have been developed, which are administered in an inactive form and can be activated by a reduction reaction in hypoxic regions, where they then damage the DNA. In this report, we discovered that AgNPs attenuate HIF-1α and HIF-2α accumulation and suppress the transcriptional activity of HIF, very likely by increasing the endogenous oxygen level and modulating the TME (further experiments need to be conducted to confirm the hypothesis). As a result, the expression of downstream target genes VEGF-A and GLUT1 is inhibited. The consequence is that tube formation during angiogenesis is inhibited and the energy supply to the tumor cells is cut (Figure 6). These findings imply a new strategy for utilizing AgNPs in cancer therapy.
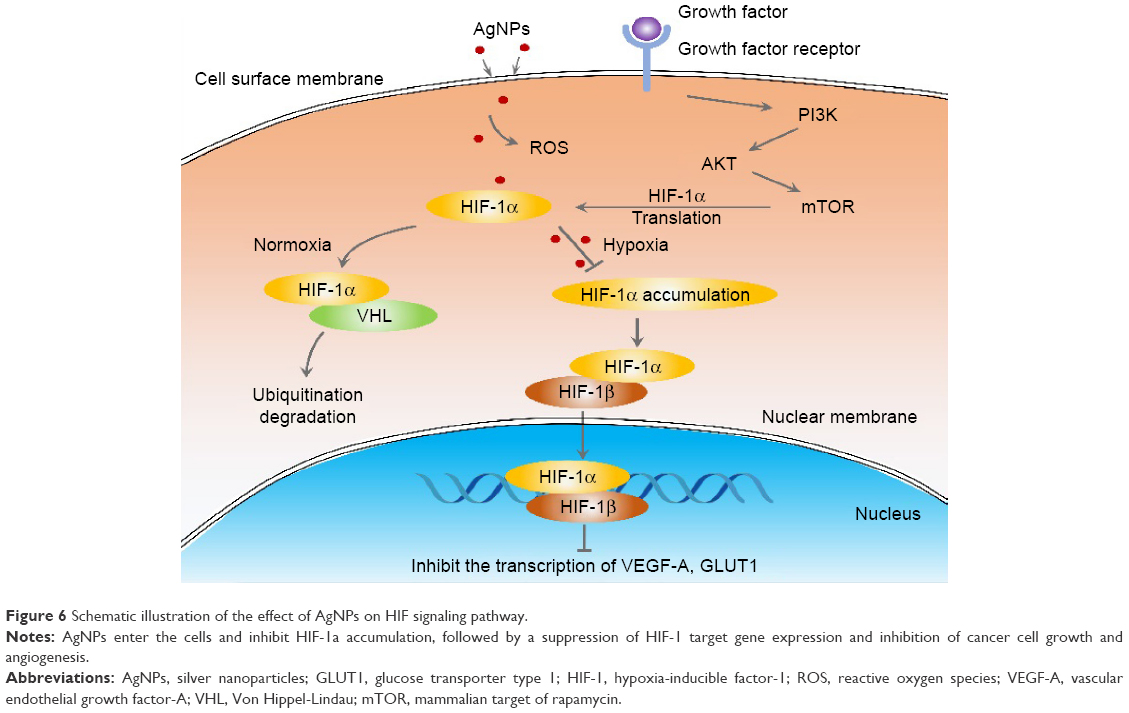 | Figure 6 Schematic illustration of the effect of AgNPs on HIF signaling pathway. |
Conclusion
We have demonstrated that AgNPs inhibit HIF-1 function by attenuating its protein accumulation and downstream target expression, which provides new insight into the mechanism of cytotoxicity and angiogenesis induced by AgNPs. Our data together with previously published results show that AgNPs might be a promising anticancer drug that counteracts the shortcomings of current cancer therapy, such as resistance to radiation therapy. Further in vivo studies and clinical level trails are necessary to address the formulation of AgNPs as an ecofriendly and biocompatible alternative to conventional anticancer drugs.
Acknowledgments
This work was supported by the National Natural Science Foundation of China (No 61378088), fund for Biophotonics Innovative Personnel Base construction (101000541212011), and fund for Advanced Manufacturing Technology (101000541213504) by Beijing University of Technology. We thank Mr Weiping Zhou and Dr Anming Hu of the University of Tennessee for their thoughtful discussions.
Disclosure
The authors report no conflicts of interest in this work.
References
Harris AL. Hypoxia – a key regulatory factor in tumour growth. Nat Rev Cancer. 2002;2(1):38–47. | ||
Joyce JA, Pollard JW. Microenvironmental regulation of metastasis. Nat Rev Cancer. 2008;9(4):239–252. | ||
Kim Y, Lin Q, Glazer PM, Yun Z. Hypoxic tumor microenvironment and cancer cell differentiation. Curr Mol Med. 2009;9(4):425–434. | ||
Quail DF, Joyce JA. Microenvironmental regulation of tumor progression and metastasis. Nat Med. 2013;19(11):1423–1437. | ||
Kondoh M, Ohga N, Akiyama K, et al. Hypoxia-induced reactive oxygen species cause chromosomal abnormalities in endothelial cells in the tumor microenvironment. PLoS One. 2013;8(11):e0080349. | ||
Anderson EJ, Neufer PD. Type II skeletal myofibers possess unique properties that potentiate mitochondrial H2O2 production. AJP Cell Physiology. 2005;290(3):844–851. | ||
Ke QD, Costa M. Hypoxia-inducible factor-1 (HIF-1). Mol Pharmacol. 2006;70(5):1469–1480. | ||
Shiao SL, Coussens LM. The tumor-immune microenvironment and response to radiation therapy. J Mammary Gland Biol. 2010;15(4):411–421. | ||
Acker T, Plate KH. Hypoxia and hypoxia inducible factors (HIF) as important regulators of tumor physiology. Cancer Treat Res. 2004;117:219–248. | ||
Majmundar AJ, Wong WJ, Simon MS. Hypoxia-inducible factors and the response to hypoxic stress. Mol Cell. 2010;40(2):294–309. | ||
Rankin EB, Giaccia AJ. The role of hypoxia-inducible factors in tumorigenesis. Cell Death Differ. 2008;15(4):678–685. | ||
Weidemann A, Johnson RS. Biology of HIF-1alpha. Cell Death Differ. 2008;15(4):621–627. | ||
Kim MR, Choi HS, Yang JW, Park BC, Kim JA, Kang KW. Enhancement of vascular endothelial growth factor-mediated angiogenesis in tamoxifen-resistant breast cancer cells: role of Pin1 overexpression. Mol Cancer Ther. 2009;8(8):2163–2171. | ||
Lee JS, Kim Y, Bhin J, et al. Hypoxia-induced methylation of a pontin chromatin remodeling factor. Proc Natl Acad Sci U S A. 2011;108(33):13510–13515. | ||
Havelund BM, Sørensen FB, Pløen J, Lindebjerg J, Spindler KL, Jakobsen A. Immunohistological expression of HIF-1α, GLUT-1, Bcl-2 and Ki-67 in consecutive biopsies during chemoradiotherapy in patients with rectal cancer. APMIS. 2013;121(2):127–138. | ||
Carmeliet P, Dor Y, Herbert JM, et al. Role of HIF-1α in hypoxia-mediated apoptosis, cell proliferation and tumour angiogenesis. Nature. 1998;394(6692):485–490. | ||
Han ZB, Ren H, Zhao H, et al. Hypoxia-inducible factor (HIF)-1 directly enhances the transcriptional activity of stem cell factor (SCF) in response to hypoxia and epidermal growth factor (EGF). Carcinogenesis. 2008;29(10):1853–1861. | ||
Corzo CA, Condamine T, Lu L, et al. HIF-1alpha regulates function and differentiation of myeloid-derived suppressor cells in the tumor microenvironment. J Exp Med. 2010;207(11):2439–2453. | ||
Shen GM, Zhang FL, Liu XL, Zhang JW. Hypoxia-inducible factor 1-mediated regulation of PPP1R3C promotes glycogen accumulation in human MCF-7 cells under hypoxia. FEBS Lett. 2010;584(20): 4366–4372. | ||
Semenza GL. Targeting HIF-1 for cancer therapy. Nat Rev Cancer. 2003;3(10):721–732. | ||
Onnis B, Rapisarda A, Melillo G. Development of HIF-1 inhibitors for cancer therapy. J Cell Mol Med. 2009;13(9A):2780–2786. | ||
Jalouli M, Déry MC, Lafleur VN, et al. The prolyl isomerase Pin1 regulates hypoxia-inducible transcription factor (HIF) activity. Cell Signal. 2014;26(8):1649–1656. | ||
Ahmad SA, Jung YD, Liu WB, et al. The role of the microenvironment and intercellular cross-talk in tumor angiogenesis. Semin Cancer Biol. 2002;12(2):105–112. | ||
Jain RK. Antiangiogenic therapy for cancer: current and emerging concepts. Oncology (Williston Park). 2005;19(4 Suppl 3):7–16. | ||
Gurunathan S, Lee K, Kalishwaralal K, Sheikpranbabu S, Vaidyanathan R, Eom SH. Antiangiogenic properties of silver nanoparticles. Biomaterials. 2009;30(31):6341–6350. | ||
Wang XH, Cavell BE, Syed Alwi SS, Packham G. Inhibition of hypoxia inducible factor by phenethyl isothiocyanate. Biochem Pharmacol. 2009;78(3):261–272. | ||
Weis SM, Cheresh DA. Tumor angiogenesis: molecular pathways and therapeutic targets. Nat Med. 2011;17(11):1359–1370. | ||
Gregory AD, McGarry Houghton A. Tumor-Associated neutrophils: new targets for cancer therapy. Cancer Res. 2011;71(7):2411–2416. | ||
Bissell MJ, Hines WC. Why don’t we get more cancer? a proposed role of the microenvironment in restraining cancer progression. Nat Med. 2011;17(3):320–329. | ||
Swartz MA, Iida N, Roberts EW, et al. Tumor microenvironment complexity: emerging roles in cancer therapy. Cancer Res. 2012;72(10):2473–2480. | ||
AshaRani PV, Low Kah Mun G, Hande MP, Valiyaveettil S. Cytotoxicity and genotoxicity of silver nanoparticles in human cells. ACS Nano. 2009;3(2):279–290. | ||
van der Zande M, Vandebriel RJ, Van Doren E, et al. Distribution, elimination, and toxicity of silver nanoparticles and silver ions in rats after 28-day oral exposure. ACS Nano. 2012;6(8):7427–7442. | ||
Mohanty S, Mishra S, Jena P, Jacob B, Sarkar B, Sonawane A. An investigation on the antibacterial, cytotoxic, and antibiofilm efficacy of starch-stabilized silver nanoparticles. Nanomedicine. 2012;8(6):916–924. | ||
Couvreur P. Nanoparticles in drug delivery: past, present and future. Adv Drug Deliv Rev. 2013;65(1):21–23. | ||
Pratsinis A, Hervella P, Leroux J, Pratsinis SE, Sotiriou GA. Toxicity of silver nanoparticles in macrophages. Small. 2013;9(15):2576–2584. | ||
Guo DW, Zhu LY, Huang ZH, et al. Anti-leukemia activity of PVP-coated silver nanoparticles via generation of reactive oxygen species and release of silver ions. Biomaterials. 2013;34(32):7884–7894. | ||
Ajitha B, Reddy YAK, Reddy PS. Biosynthesis of silver nanoparticles using Momordica charantia leaf broth: evaluation of their innate antimicrobial and catalytic activities. J Photochem Photobiol B. 2015;146:1–9. | ||
Jeong JK, Gurunathan S, Kang MH, et al. Hypoxia-mediated autophagic flux inhibits silver nanoparticle triggered apoptosis in human lung cancer cells. Sci Rep. 2016;6:21668. | ||
de Lima R, Seabra AB, Durán N. Silver nanoparticles: a brief review of cytotoxicity and genotoxicity of chemically and biogenically synthesized nanoparticles. J Appl Toxicol. 2012;32(11):867–879. | ||
Sambale F, Wagner S, Stahl F, Khaydarov RR, Scheper T, Bahnemann D. Investigations of the toxic effect of silver nanoparticles on mammalian cell lines. J Nanomater. 2015;2015:136765. | ||
Bomben KD, Moulder JF, Sobol PE, Stickle WF. Handbook of X-ray Photoelectron Spectroscopy. 1st ed. Perkin-Elmer: Eden Prairie, MN; 1992. | ||
Waterhouse GIN, Bowmaker GA, Metson JB. Oxidation of a Polycrystalline Silver Foil by Reaction with Ozone. Appl Surf Sci. 2001;183(3–4):191–204. | ||
Bielmann M, Schwaller P, Ruffieux P, Gr€oning O, Schlapbach L, Gröning P. AgO investigated by photoelectron spectroscopy: evidence for mixed valence. Phys Rev B. 2002;65:235431. | ||
Rapisarda A, Uranchimeg B, Scudiero DA, et al. Identification of small molecule inhibitors of hypoxia-inducible factor 1 transcriptional activation pathway. Cancer Res. 2002;62(15):4316–4324. | ||
Jung J, Kim W. Involvement of mitochondrial- and Fas-mediated dual mechanism in CoCl2-induced apoptosis of rat PC12 cells. Neurosci Lett. 2004;371(2–3):85–90. | ||
Battaglia V, Compagnone A, Bandino A, et al. Cobalt induces oxidative stress in isolated liver mitochondria responsible for permeability transition and intrinsic apoptosis in hepatocyte primary cultures. Int J Biochem Cell Biol. 2009;41(3):586–594. | ||
Ji ZY, Yang GR, Shahzidi S, et al. Induction of hypoxia-inducible factor-1α overexpression by cobalt chloride enhances cellular resistance to photodynamic therapy. Cancer Lett. 2006;244(2):182–189. | ||
Lim D, Roh JY, Eom HJ, Choi JY, Hyun J, Choi J. Oxidative stress-related PMK-1 P38 MAPK activation as a mechanism for toxicity of silver nanoparticles to reproduction in the nematode Caenorhabditis elegans. Environ Toxicol Chem. 2012;31(3):585–592. | ||
Eom HJ, Ahn JM, Kim Y, Choi J. Hypoxia inducible factor-1 (HIF-1)-flavin containing monooxygenase-2 (FMO-2) signaling acts in silver nanoparticles and silver ion toxicity in the nematode, Caenorhabditis elegans. Toxicol Appl Pharmacol. 2013;270(2):106–113. | ||
Patan S. Vasculogenesis and angiogenesis. Cancer Treat Res. 2004;117:3–32. | ||
Saharinen P, Eklund L, Pulkki K, Bono P, Alitalo K. VEGF and angiopoietin signaling in tumor angiogenesis and metastasis. Trends Mol Med. 2011;17(7):347–362. | ||
Mac Gabhann F, Qutub AA, Annex BH, Popel AS. Systems biology of pro-angiogenic therapies targeting the VEGF system. Wiley Interdiscip Rev Syst Biol Med. 2010;2(6):694–707. | ||
Neufeld G, Kessler O. Pro-angiogenic cytokines and their role in tumor angiogenesis. Cancer Metastasis Rev. 2006;25(3):373–385. | ||
Chen MC, Lee C, Huang W, Chou T. Magnolol suppresses hypoxia-induced angiogenesis via inhibition of HIF-1α/VEGF signaling pathway in human bladder cancer cells. Biochem Pharmacol. 2013;85(9):1278–1287. | ||
Kieda C, Greferath R, Silva CC, Fylaktakidou KC, Lehn JM, Nicolau C. Suppression of hypoxia-induced HIF-1α and of angiogenesis in endothelial cells by myo-inositol trispyrophosphate-treated erythrocytes. Proc Nat Acad Sci. 2006;103(42):15576–15581. | ||
Baharara J, Namvar F, Mousavi M, Ramezani T, Mohamad R. Anti-angiogenesis effect of biogenic silver nanoparticles synthesized using Salvia officinalis on chick chorioallantoic membrane (CAM). Molecules. 2014;19:13498–13508. | ||
Hullikere MM, Joshi CG, Vijay R, Ananda D, Nivya MT. Anti-angiogenic, cytotoxic and antimicrobial activity of plant mediated silver nano particle from Tragia involucrate. Res J Nanoscience and Nanotechnology. 2015;5:16–26. |
Supplementary materials
 | Figure S1 pGL4.42 and pGL3 vector maps. |
 | Figure S2 Raw data of AgNP-induced MCF7 apoptotic analysis using flow cytometry. |
 © 2016 The Author(s). This work is published and licensed by Dove Medical Press Limited. The full terms of this license are available at https://www.dovepress.com/terms.php and incorporate the Creative Commons Attribution - Non Commercial (unported, v3.0) License.
By accessing the work you hereby accept the Terms. Non-commercial uses of the work are permitted without any further permission from Dove Medical Press Limited, provided the work is properly attributed. For permission for commercial use of this work, please see paragraphs 4.2 and 5 of our Terms.
© 2016 The Author(s). This work is published and licensed by Dove Medical Press Limited. The full terms of this license are available at https://www.dovepress.com/terms.php and incorporate the Creative Commons Attribution - Non Commercial (unported, v3.0) License.
By accessing the work you hereby accept the Terms. Non-commercial uses of the work are permitted without any further permission from Dove Medical Press Limited, provided the work is properly attributed. For permission for commercial use of this work, please see paragraphs 4.2 and 5 of our Terms.