")
Back to Journals » International Journal of Nanomedicine » Volume 11
Silver nanoparticles affect glucose metabolism in hepatoma cells through production of reactive oxygen species
Authors Lee MJ , Lee SJ, Yun SJ, Jang J, Kang H, Kim K, Choi I, Park S
Received 21 August 2015
Accepted for publication 7 October 2015
Published 22 December 2015 Volume 2016:11 Pages 55—68
DOI https://doi.org/10.2147/IJN.S94907
Checked for plagiarism Yes
Review by Single anonymous peer review
Peer reviewer comments 2
Editor who approved publication: Dr Thomas Webster
Mi Jin Lee,1 Seung Jun Lee,1,2,* Su Jin Yun,1,2,* Ji-Young Jang,3 Hangoo Kang,3 Kyongmin Kim,1,2 In-Hong Choi,3,4 Sun Park1,2
1Department of Microbiology, Ajou University School of Medicine, 2Department of Biomedical Sciences, The Graduate School, Ajou University, Suwon, 3Department of Microbiology, The Institute for Immunology and Immunological Diseases, Yonsei University College of Medicine, Seoul, Korea; 4Brain Korea 21 Plus Project for Medical Sciences, Yonsei University College of Medicine, Seoul, Korea
*These authors contributed equally to this work
Abstract: The silver nanoparticle (AgNP) is a candidate for anticancer therapy because of its effects on cell survival and signaling. Although numerous reports are available regarding their effect on cell death, the effect of AgNPs on metabolism is not well understood. In this study, we investigated the effect of AgNPs on glucose metabolism in hepatoma cell lines. Lactate release from both HepG2 and Huh7 cells was reduced with 5 nm AgNPs as early as 1 hour after treatment, when cell death did not occur. Treatment with 5 nm AgNPs decreased glucose consumption in HepG2 cells but not in Huh7 cells. Treatment with 5 nm AgNPs reduced nuclear factor erythroid 2-like 2 expression in both cell types without affecting its activation at the early time points after AgNPs’ treatment. Increased reactive oxygen species (ROS) production was detected 1 hour after 5 nm AgNPs’ treatment, and lactate release was restored in the presence of an ROS scavenger. Our results suggest that 5 nm AgNPs affect glucose metabolism by producing ROS.
Keywords: metal nanoparticles, carbohydrate metabolism, lactic acid, cytotoxicity
Introduction
Silver nanoparticles (AgNPs) have been studied for their effectiveness in the treatment of cancer and infection. AgNPs have been shown to induce death of acute myeloid leukemia and breast cancer cells.1,2 Additionally, AgNPs conjugated with folic acid are preferentially taken up by human ovary cancer cells, inducing an efficient therapeutic response to irradiation with a continuous wave near-infrared laser.3 In addition to anticancer activity, inhibitory effects of AgNPs against various pathogens, including bacteria such as Escherichia coli, fungi such as Candida species, and viruses such as herpes simplex viruses, have been reported.4–6
AgNP-mediated cytotoxicity has been linked with various cellular processes. AgNPs enter the cytosol, mitochondria, and nucleus,7 and uptake of AgNPs has been implicated in their cytotoxicity. AgNPs have been observed in the cytosol of monocytes, which are susceptible to AgNP-mediated cytotoxicity, but not in T-cells, which are resistant to AgNP-mediated cytotoxicity.8 Once inside susceptible cells, AgNPs can damage the mitochondria, reduce ATP content, increase reactive oxygen species (ROS) production, damage DNA, and ultimately lead to cell death.7 AgNPs can activate p53, extracellular signal-regulated kinase (Erk)1/2, and caspase signaling and downregulate B-cell CLL/lymphoma 2 (Bcl2), resulting in apoptosis.9 AgNPs exhibit a strong affinity for the thiol groups found in the antioxidant glutathione (GSH) and may deplete GSH levels in cells; depletion of GSH has been shown to increase the cytotoxicity of AgNPs.10–12 A recent report showed an association between autophagy and AgNP cytotoxicity by demonstrating that cell death in AgNP-treated cells increased when autophagy was inhibited.13 In addition, a preferential cytotoxic effect of AgNPs was observed in cells of a breast cancer subtype compared to non-tumorigenic cells derived from the breast, liver, kidney, and monocyte lineages, although the underlying mechanisms were not been determined.12
Metabolic reprogramming of tumor cells has emerged as a new therapeutic strategy.14 The first metabolic change discovered in tumor cells was the switch from oxidative phosphorylation of glucose to aerobic glycolysis.15 Aerobic glycolysis is characterized by increased glucose uptake and lactate release in the presence of oxygen.15 Inactivation of lactate dehydrogenase A, which is involved in the last step of aerobic glycolysis, has been shown to suppress tumor growth in a mouse model.16 Rapidly growing tumor cells require exogenous glycine and concomitant activation of the glycine synthesis pathway in mitochondria to promote growth.17 Tumor cells exhibit different sensitivities to various molecules that inhibit glycolysis, glutamine metabolism, lipid synthesis, and regulation of redox balance. The sensitivity of a tumor is dependent on its metabolic type, which is determined by the preferred pathway of glucose, glycolysis, or lipogenesis.18 It was recently shown that the cytotoxicity of melatonin in tumor cells is associated with its suppression of aerobic glycolysis.19 However, the effect of AgNPs on tumor cell metabolism has not yet been completely determined.
A recent report demonstrated that zinc oxide nanoparticles, but not titanium dioxide nanoparticles, enhanced glycogenolysis, gluconeogenesis, and glycolysis in a hepatoma cell line.20 In this study, we examined the effect of AgNP treatment on glucose metabolism, such as glucose consumption and lactate release, in human hepatoma cell lines. We found that 5 nm AgNPs but not 100 nm AgNPs affected glucose consumption and lactate release as well as the transcription of molecules regulating glucose metabolic pathways. Additionally, we demonstrated that the 5 nm AgNP-mediated reduction in lactate release was restored by treating hepatoma cells with an ROS scavenger.
Materials and methods
Chemicals
AgNPs of mean sizes 5 and 100 nm were coated with polyvinylpyrrolidone (I&C Technology, Seoul, Korea).
Characterization of AgNPs was previously described.21 Briefly, the average size of AgNPs determined using transmission electron microscopy (model JEM-1011, JEOL, Tokyo, Japan) was 7.9±5.3 nm for 5 nm AgNPs and 70.9±71.3 nm for 100 nm AgNPs. AgNPs of 5 nm were round and relatively uniform, whereas 100 nm AgNPs showed a range of different sized particles with most being larger than 50 nm. Agglomeration states of AgNPs in serum-free Roswell Park Memorial Institute (RPMI) 1640 medium (Thermo Fisher Scientific, Waltham, MA, USA) at 1, 10, and 100 mg/mL were analyzed using dynamic light scattering analysis (Novato, CA, USA). Dynamic light scattering showed that the mean diameter of AgNPs was 3.7 and 95.9 nm for 5 nm and 100 nm AgNPs, respectively. N-Acetylcysteine (NAC) was purchased from Sigma-Aldrich (St Louis, MO, USA). Propidium iodide was purchased from Millipore (Billerica, MA, USA).
Cell lines and culture
The HepG2 cell line (American Type Culture Collection [ATCC], Manassas, VA, USA) was originally derived from a hepatocellular carcinoma in a 15-year-old Caucasian boy, and the THP-1 cell line (ATCC) from an acute monocytic leukemia in a 1-year-old male child. The Huh7 cell line (Japanese Collection of Research Bioresources Cell Bank) was originally derived from a hepatocellular carcinoma in a 57-year-old Japanese man. The HepG2 and Huh7 cells were cultured in Dulbecco’s Modified Eagle’s Medium (Thermo Fisher Scientific) containing 10% fetal bovine serum (Thermo Fisher Scientific), penicillin (100 U/mL, Thermo Fisher Scientific), and streptomycin (100 μg/mL, Thermo Fisher Scientific). The THP-1 cells were cultured in Roswell Park Memorial Institute 1640 (Thermo Fisher Scientific) medium containing 10% fetal bovine serum and penicillin–streptomycin (100 U/mL and 100 μg/mL, respectively) at 37°C in a humidified 5% CO2 incubator. Cells that were passaged between 5 and 40 times after thawing were used in the experiments. Ajou University’s Institutional Review Board determined this study to be exempt (AJIRB-BMR-EXP-15-426).
Assessment of glucose consumption and lactate production
AgNPs were added to the culture of hepatoma cell lines (HepG2 or Huh7 cells) or THP-1 cells. Glucose consumption and lactate production were analyzed using a YSI biochemical analyzer (YSI Life Sciences, Simpsonville, SC, USA). In experiments to block the effect of ROS, 1 mM NAC was added to the culture media 30 minutes before AgNP treatment.
Assessment of cell viability
Cell viability was assessed by labeling with propidium iodide and flow cytometry using a fluorescent-activated cell sorter canto (BD Biosciences, Franklin Lakes, NJ, USA) apparatus.
Western blot analysis
Cells were lysed using RIPA buffer for 6-phosphofructo-2-kinase/fructose-2,6-biphosphatase 3 (PFKFB3) detection. To analyze nuclear factor erythroid 2-like 2 (Nrf2) levels, cytosolic and nuclear compartments were extracted first with cytosol extraction buffer containing HEPES (10 mM) pH 7.9, KCl (10 mM), EDTA (0.1 mM), 0.3% NP-40, and protease inhibitors and then with nucleus extraction buffer containing HEPES (20 mM) pH 7.9, NaCl (0.4 mM), EDTA (1 mM), 0.25% glycerol, and protease inhibitors. The cell lysate was subjected to Western blot analysis using anti-PFKFB3 antibody (Ab) (Abgent, San Diego, CA, USA), anti-Nrf2 Ab (Santa Cruz Biotechnology, Dallas, TX, USA), anti-actin Ab (Bethyl Laboratories Inc., Montgomery, TX, USA), or anti-lamin A/C Ab (Santa Cruz) as a primary Ab and horseradish peroxidase-conjugated anti-rabbit IgG Ab (Thermo Fisher Scientific) as a secondary Ab. Signals were detected using enhanced chemical luminescence (Amersham, Piscataway, NJ, USA). The immunoblot was digitized using an office scanner (UMAX Astra 4100, Taipei, Taiwan), and the intensity of the band of the expected molecular size was quantitated using Image Gauge V 4.0 (Fujifilm Corporation, Tokyo, Japan). The band intensity of PFKFB3 and cytosolic Nrf2 was normalized to actin, and nuclear Nrf2 was normalized to lamin.
RNA isolation and quantitative reverse transcription-polymerase chain reaction
RNA was isolated from cells treated with AgNPs for the indicated time using RNA STAT-60 (Tel-Test, Friendswood, TX, USA). RNA was subjected to quantitative reverse transcription-polymerase chain reaction using primer sets specific to hexokinase-2, PFKFB-3, phosphoenolpyruvate carboxylase (PEPCK)-C, PEPCK-M, Nrf2, transketolase (TKT), phosphogluconate dehydrogenase (6PGD), glucose-6-phosphate dehydrogenase (G6PDH), and transaldolase (TALDO1) (Bioneer, Daejeon, Korea) and Sybr Premix Ex Taq (TaKaRa-Bio, Shiga, Japan). The expression level of each gene was normalized to the expression of actin.
Assessment of intracellular ROS
Cells were treated with AgNPs for 30 minutes and 1, 2, and 3 hours and then harvested. Cells were washed and then treated with 2,7-dichlorofluorescin diacetate (Thermo Fisher Scientific) in Hank’s Balance Salt Solution for 30 minutes at 37°C. Fluorescence intensity was analyzed using a fluorescent-activated cell sorter canto apparatus.
Statistics
Student’s t-test was performed, and P-values were determined to identify significant differences, as indicated in the figures.
Results
Decreased lactate release in cells treated with 5 nm AgNPs
We assessed the effect of AgNP treatment on glucose consumption and lactate production. Because the size of AgNPs is a critical determinant of therapeutic activity and toxicity, we compared the effects of 5 nm AgNPs with those of 100 nm AgNPs in HepG2 and Huh7 cells. Glucose consumption over 3 hours was significantly decreased in HepG2 cells treated with 0.5–7.5 μg/mL 5 nm AgNPs in a concentration-dependent manner (P<0.005) but not in cells treated with 100 nm AgNPs (Figure 1A). Glucose consumption was not significantly altered in Huh7 cells (Figure 1D) or THP-1 cells with or without lipopolysaccharide (LPS) (Figure 1G) treated with 5 and 100 nm AgNPs, whereas treatment of HepG2 cells with AgNPs for 6 hours did affect glucose consumption (Figure S1). Notably, treatment with 5 nm AgNPs, but not 100 nm AgNPs, significantly reduced lactate production in HepG2, Huh7, and LPS-stimulated THP-1 cells in a concentration-dependent manner (P<0.005) (Figure 1B, E, and H). Cell viability of HepG2 cells treated with 5 μg/mL and 7.5 μg/mL 5 nm AgNPs was reduced to 90.2% and 61.1%, respectively, but the extent of the reduction in lactate release was similar at both concentrations of AgNP (Figure 1C). In addition, when HepG2 cell viability was 92.2% after 6 hours of treatment with 0.5 μg/mL 5 nm AgNPs, lactate release was not reduced (Figure S1). For Huh7 cells, cell viability was not significantly reduced by treatment with AgNPs for 3 hours (Figure 1F). The viability of LPS-stimulated THP-1 cells was reduced to 61.4% after treatment with 5 μg/mL 5 nm AgNPs and to approximately 20.8% after treatment with 7.5 μg/mL 5 nm AgNPs, but the extent of reduction in lactate release was similar at both concentrations of AgNPs (Figure 1I). Taken together, these results demonstrated that 5 nm AgNPs reduced lactate release in cells in a dose-dependent manner.
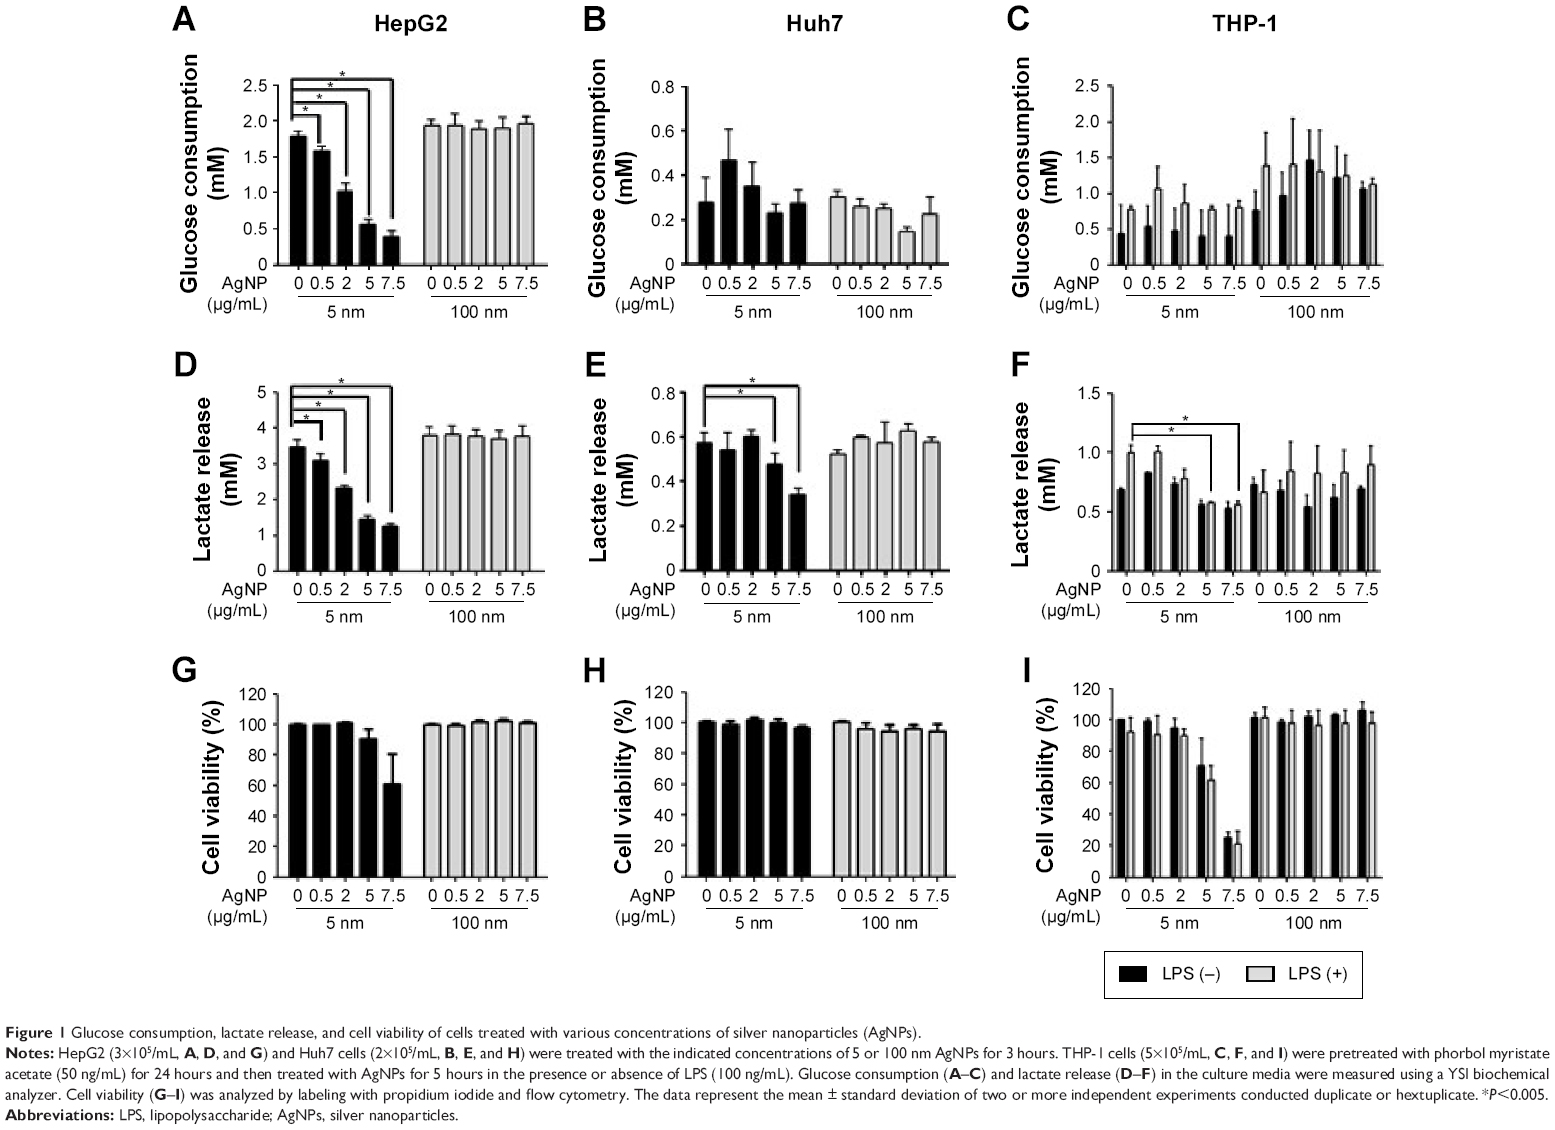 | Figure 1 Glucose consumption, lactate release, and cell viability of cells treated with various concentrations of silver nanoparticles (AgNPs). |
We next examined the kinetic effect of 5 μg/mL AgNPs (Figure 2). Glucose consumption was significantly decreased in HepG2 cells 2 hours after treatment with 5 nm AgNPs compared to untreated cells and cells treated with 100 nm AgNPs (Figure 2A). The decrease in lactate production was detected at 1 hour after 5 nm AgNP treatment, in both HepG2 and Huh7 cells (Figure 2B and E). Cell viability was reduced by 7.2% in HepG2 cells only 3 hours after treatment with 5 nm AgNPs. These results indicate that the decrease in lactate release caused by 5 nm AgNP treatment may occur earlier than the decrease in glucose consumption and cell viability.
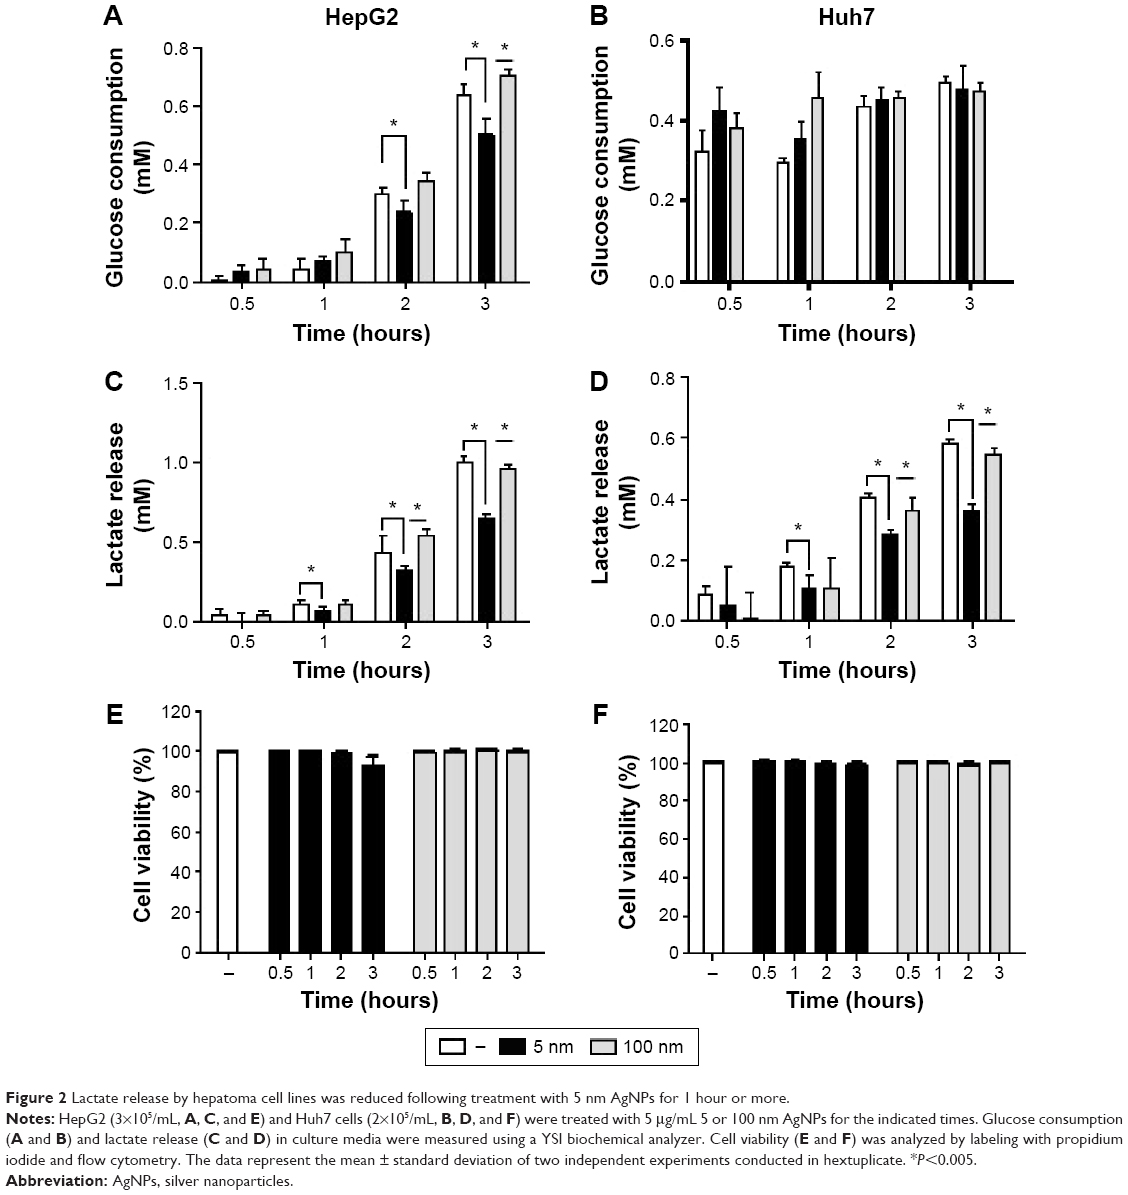 | Figure 2 Lactate release by hepatoma cell lines was reduced following treatment with 5 nm AgNPs for 1 hour or more. |
Decreased mRNA levels of Nrf2 in cells treated with 5 nm AgNPs
Glucose is metabolized into lactate through glycolysis or generated through gluconeogenesis using substrates such as lactate, amino acids, or glycerol in hepatocytes.22 Additionally, glucose is utilized in the pentose phosphate pathway (PPP), in which nicotinamide adenine dinucleotide phosphate hydrogen is synthesized.23 Thus, lactate production is reduced if the flux of glucose to glycolysis decreases and/or preferentially diverts to PPP or if gluconeogenesis is increased. To determine whether glucose metabolism is altered by treatment with 5 nm AgNPs, we examined the expression and activation of molecules regulating glycolysis, PPP, or gluconeogenesis. Hexokinase 2 is involved in the conversion of glucose to glucose-6-phosphate, a step shared by glycolysis and PPP. Hexokinase 2 messenger RNA (mRNA) levels in both HepG2 and Huh7 cells treated with AgNPs for 3 hours were not significantly different from those in negative controls (Figure 3). PFKFB3 catalyzes the conversion of fructose-6-phosphate to fructose-2,6-bisphosphate, which promotes glycolysis and suppresses gluconeogenesis, whereas PFKFB3 directs PPP when its arginine residues (R131/R134) are not methylated or its cysteine residue is glutathionylated.22,24,25 Although the mRNA levels of PFKFB3 were not significantly altered by treatment with 5 nm AgNPs for 3 hours, its protein levels were generally increased in HepG2 cells treated with 7.5 μg/mL 5 nm AgNPs (Figures 3 and 4). At early time points after treatment of hepatoma cells with 5 nm AgNPs, the mRNA levels of PFKFB3 were not significantly changed (Figure 5A and B). Cytoplasmic and mitochondrial PEPCK-C and PEPCK-M are involved in gluconeogenesis, using lactate as a substrate.22,26 Both PEPCK-C and PEPCK-M mRNA levels were not significantly altered in hepatoma cell lines treated with AgNPs for 3 hours compared to those in negative controls (Figure 3). Nrf2 participates in glucose metabolism by regulating the expression of enzymes involved in the PPP, such as G6PDH, 6PGD, TKT, and TALDO.27 We analyzed the effect of AgNPs on Nrf2 mRNA levels and found that 5 nm AgNPs significantly reduced Nrf2 mRNA levels in both HepG2 and Huh7 cells 2 and 3 hours after treatment with AgNPs, respectively (Figure 5). These results suggest that treatment with 5 nm AgNP affects glucose metabolism, since AgNPs altered the expression of Nrf2, a regulator of PPP.
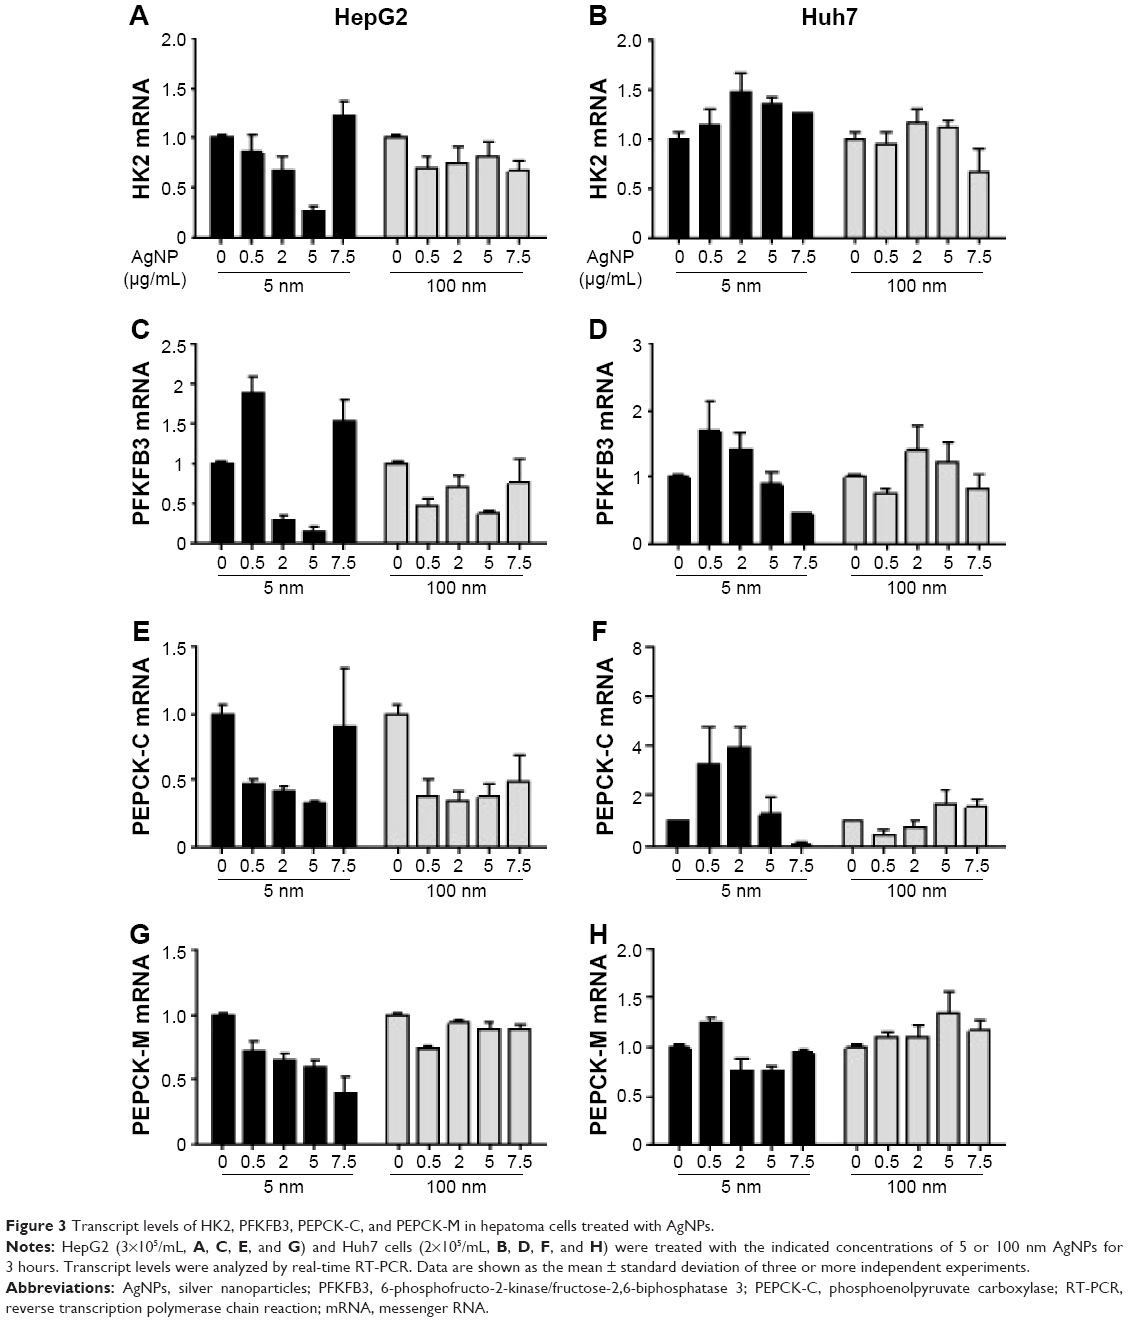 | Figure 3 Transcript levels of HK2, PFKFB3, PEPCK-C, and PEPCK-M in hepatoma cells treated with AgNPs. |
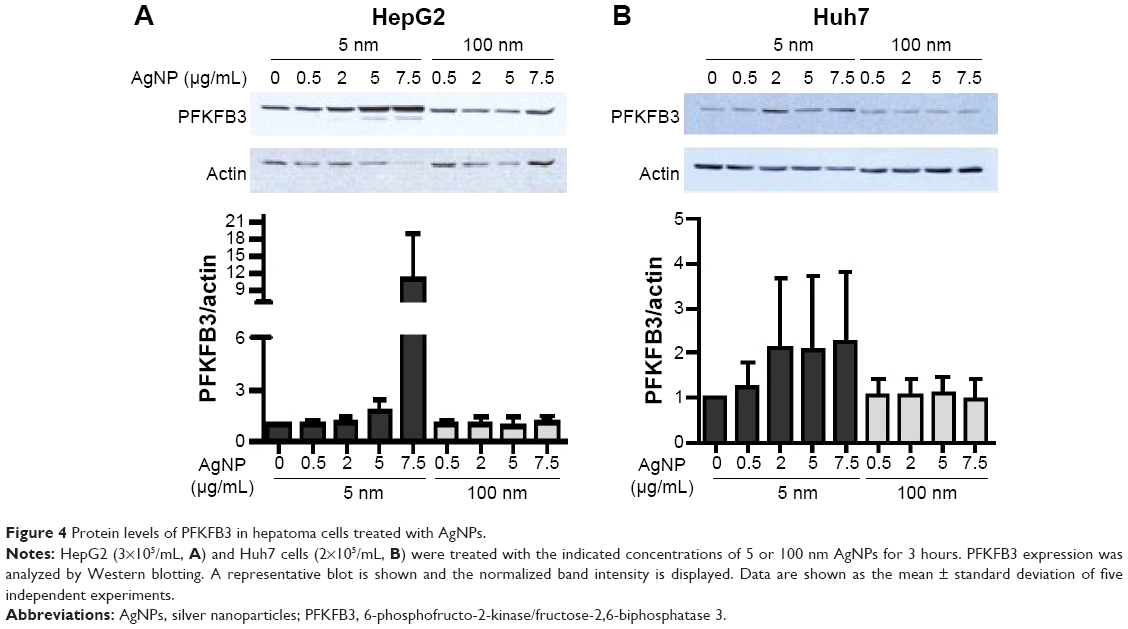 | Figure 4 Protein levels of PFKFB3 in hepatoma cells treated with AgNPs. |
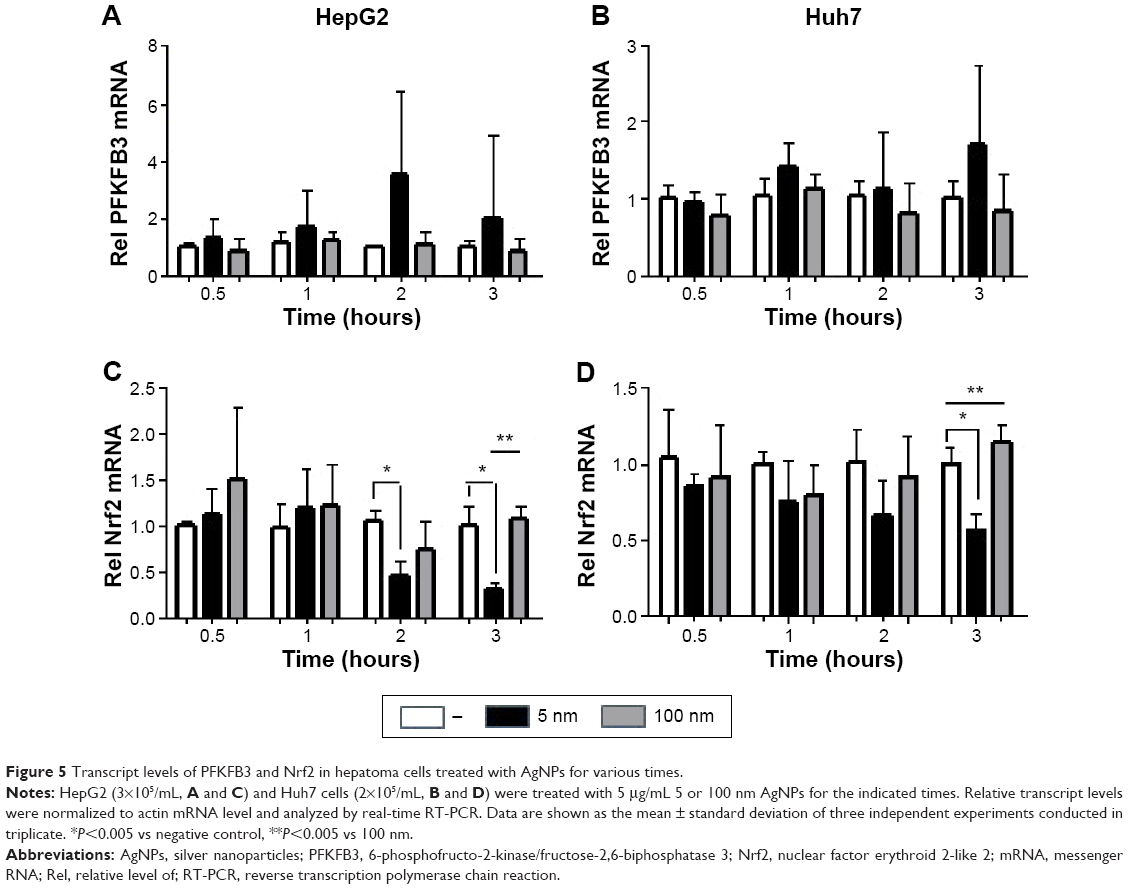 | Figure 5 Transcript levels of PFKFB3 and Nrf2 in hepatoma cells treated with AgNPs for various times. |
Increased production of ROS without concurrent Nrf2 activation in cells treated with 5 nm AgNPs
Increased ROS production was previously reported in cells treated with AgNPs, and elevated ROS levels were found to be associated with Nrf2 activation to protect cells via nicotinamide adenine dinucleotide phosphate hydrogen-mediated removal of ROS.1,28–31 Thus, we tested whether 5 nm AgNPs led to ROS production in hepatoma cells and activated Nrf2. Significantly more ROS were produced in HepG2 and Huh7 cells starting at 1 hour and 30 minutes after treatment with 5 nm AgNPs, respectively, compared with negative controls and cells treated with 100 nm AgNPs (Figure 6). Further, 5 nm AgNP-induced ROS levels were downregulated in the presence of an ROS scavenger. We then examined the translocation of Nrf2 to the nucleus after treatment with AgNPs. Nrf2, which is preferentially located in the cytoplasm, moved to the nucleus under elevated ROS levels and induced the transcription of genes harboring antioxidant response elements, including G6PDH, 6PGD, TKT, and TALDO, which are involved in the PPP.31 After treatment of HepG2 and Huh7 cells with AgNPs for 1 hour, increased ROS production and decreased lactate release were detected. We then analyzed Nrf2 levels at the indicated times in the cytosolic and nuclear fractions of the cell lysate using Western blotting (Figure 7). Because of the low Nrf2 levels in the nuclear fraction, the loading amount of the nuclear fraction was threefold higher than that of the cytosolic fraction. Nuclear Nrf2 density was normalized as follows, owing to contamination of nuclear compartment with cytosolic fraction: [nuclear Nrf2 intensity − cytosolic Nrf2 intensity × nuclear actin intensity/(cytosolic actin intensity ×3)]/nuclear lamin density. Unexpectedly, Nrf2 protein levels in the nucleus were not significantly increased in hepatoma cells treated with 5 nm AgNPs compared with negative controls (P>0.01). Additionally, there was no difference in the mRNA levels of genes induced by Nrf2, such as G6PDH, 6PGD, TKT, and TALDO, between cells treated with AgNPs and negative controls (Figure S2). Taken together, these results demonstrate that treatment of hepatoma cells with 5 nm AgNPs increased ROS production without activating Nrf2.
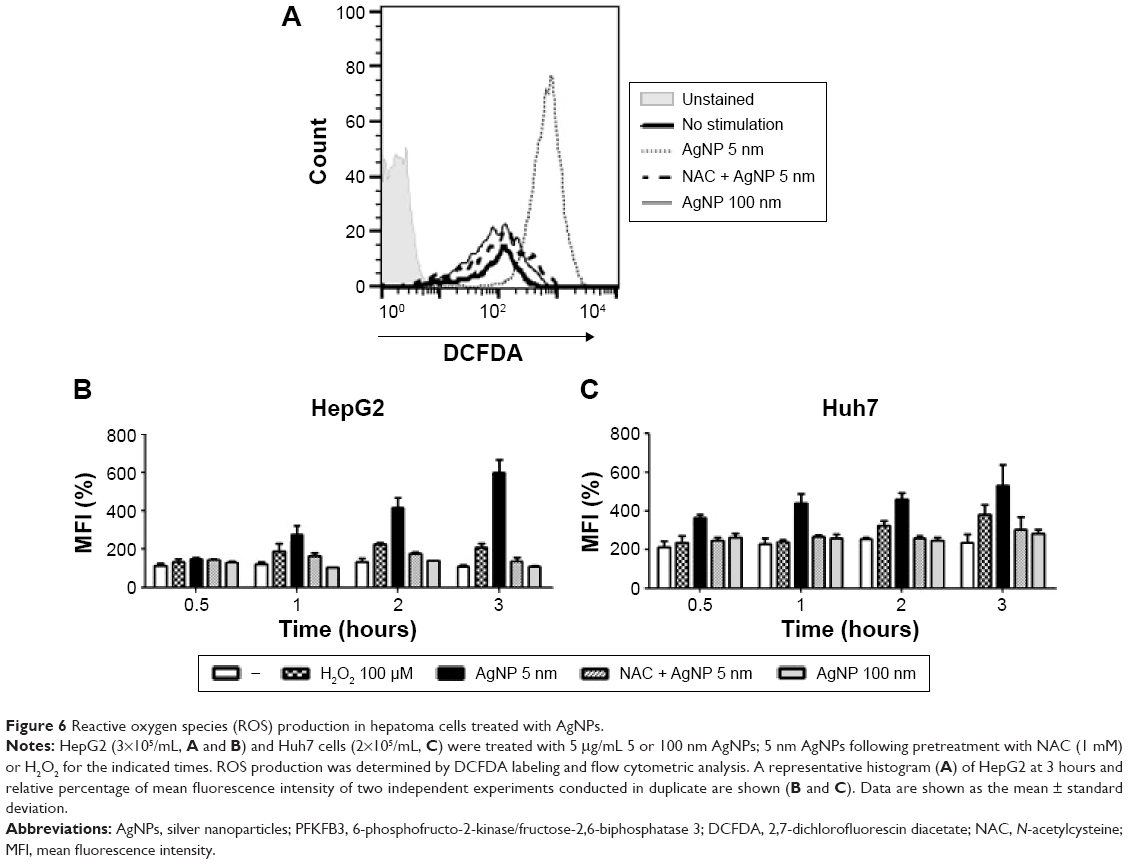 | Figure 6 Reactive oxygen species (ROS) production in hepatoma cells treated with AgNPs. |
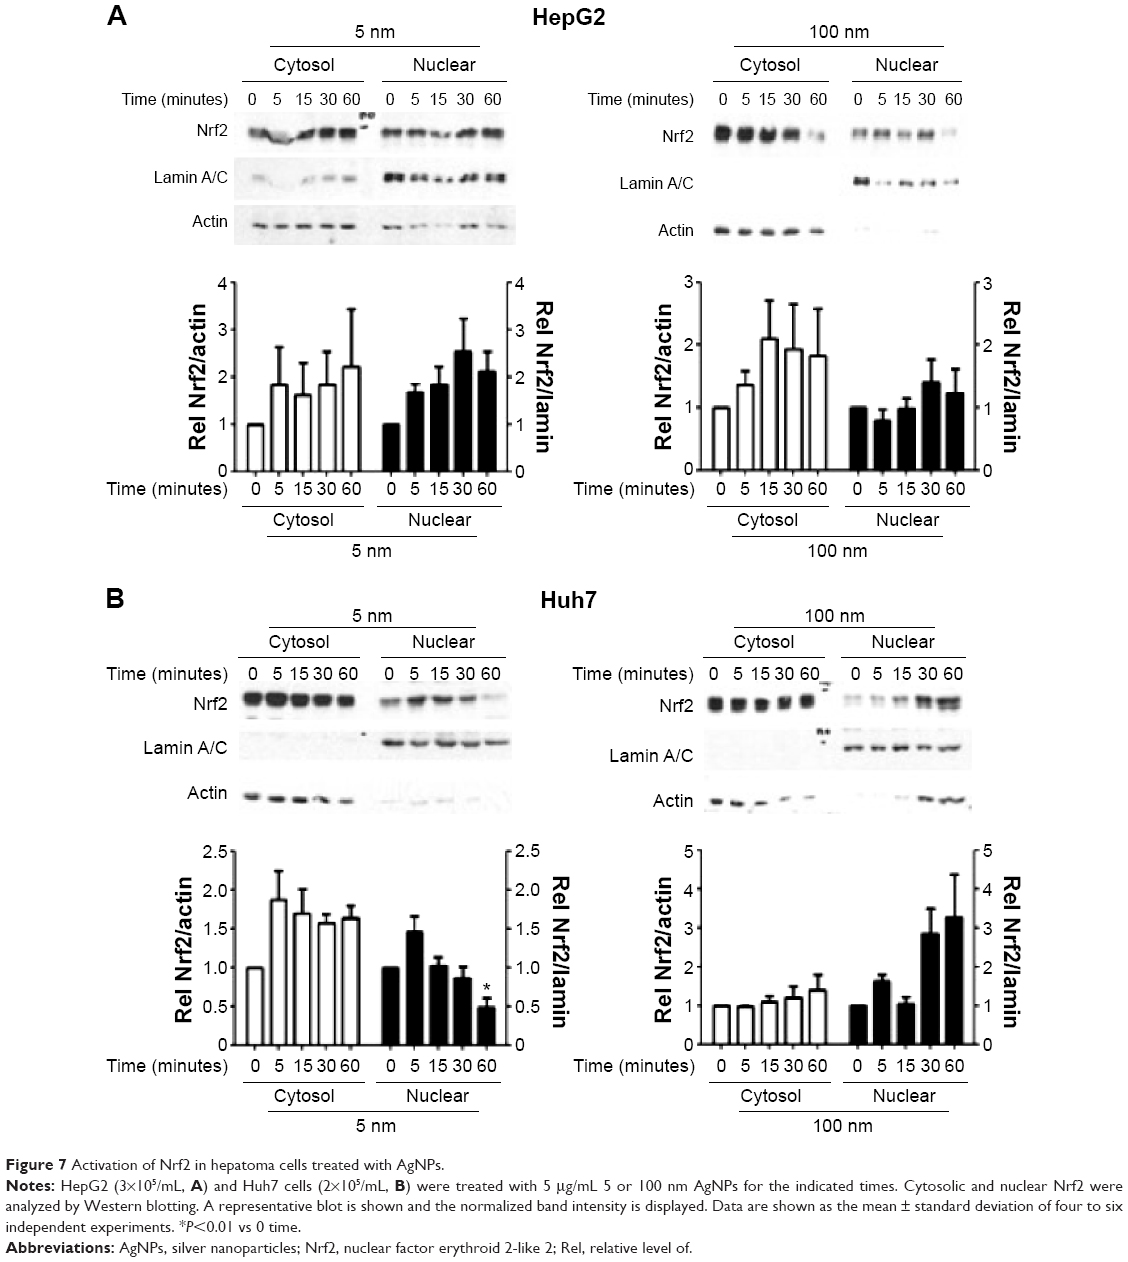 | Figure 7 Activation of Nrf2 in hepatoma cells treated with AgNPs. |
ROS scavenger-mediated restoration of lactate release in cells treated with 5 nm AgNPs
Finally, we investigated whether ROS production was responsible for the reduced release of lactate by hepatoma cells treated with 5 nm AgNPs. We added the ROS scavenger NAC to the hepatoma cell culture prior to treatment with AgNPs and then analyzed glucose consumption, lactate release, and cell viability (Figure 8). Reduced glucose consumption by HepG2 cells and lactate release by both hepatoma cell lines following treatment with 5 nm AgNPs were restored after the addition of NAC. These results showed that ROS production induced by 5 nm AgNPs reduced lactate release by the hepatoma cell lines.
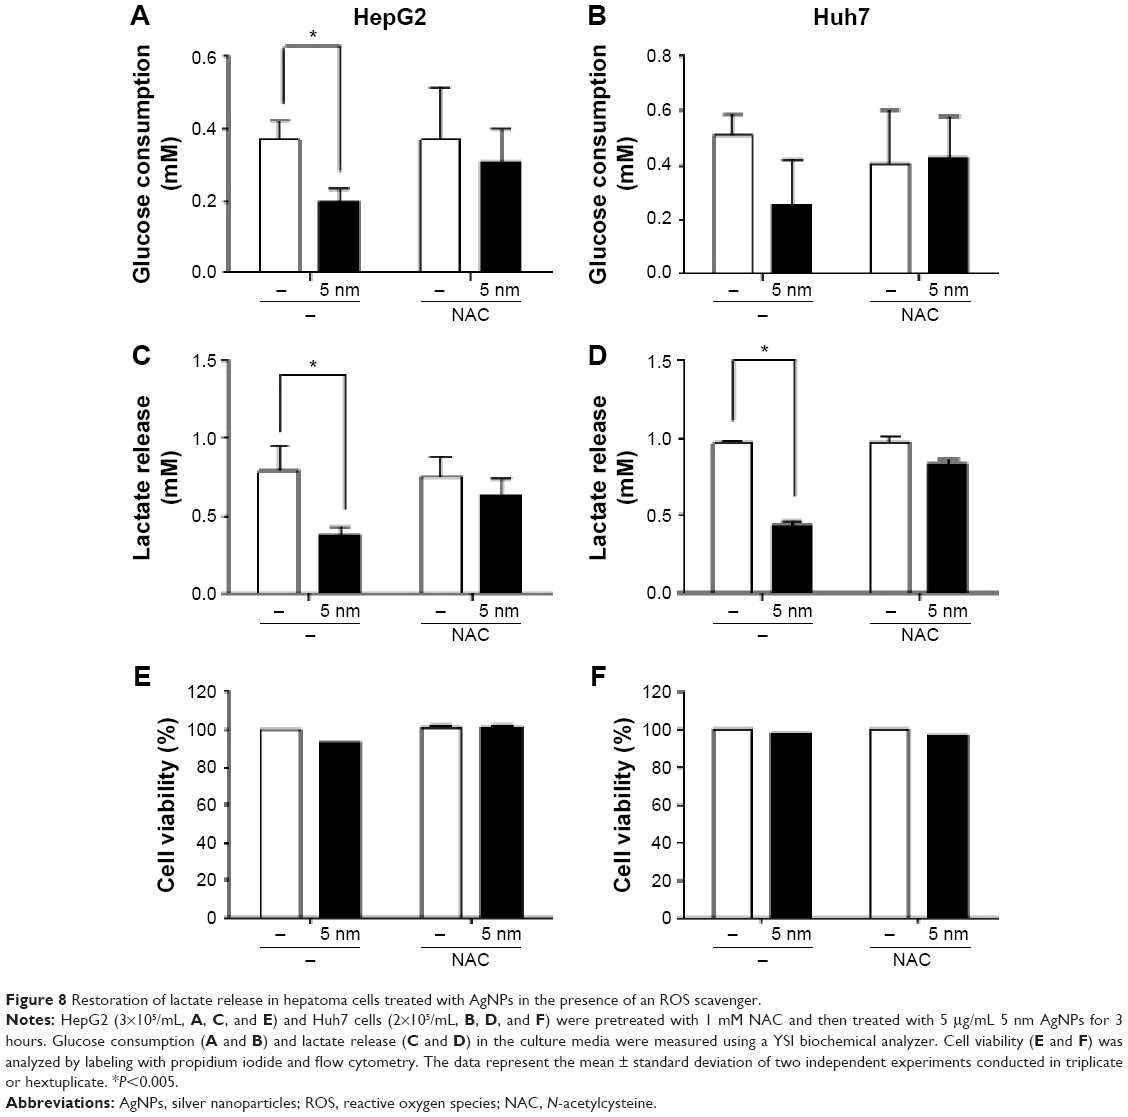 | Figure 8 Restoration of lactate release in hepatoma cells treated with AgNPs in the presence of an ROS scavenger. |
Discussion
We showed that 5 nm AgNPs altered glucose metabolism in two different hepatoma cell lines and in THP-1 cells. Reductions in lactate release and Nrf2 transcript levels were observed in both HepG2 and Huh7 cells treated with 5 nm AgNPs. Further, we found that increased ROS production by 5 nm AgNP treatment reduced lactate release.
Our results showed an early effect of AgNPs on glucose metabolism in cells. The reduced release of lactate by hepatoma cell lines was observed from 1 to 6 hours after treatment with 5 nm AgNPs (Figures 1, 2, and S1). A recent report by Chen et al demonstrated a late effect of AgNPs on energy metabolism in several cell lines, including HepG2 cells.32 In that report, the metabolic shift from oxidative phosphorylation to glycolysis (ie, increased lactate production) was observed 24 hours after treatment with AgNPs. In addition to this difference in time of analysis after AgNP treatment, there were several other differences between our study and Chen et al, including: 1) the size of AgNPs; we used 5 nm particles, while they used 20 nm or larger particles; 2) we analyzed lactate release into the media, while they measured intracellular lactate; 3) we observed increased ROS production, but they did not; 4) we observed a dose-dependent decrease in cell viability for 6 hours after treatment with AgNPs, but they did not, for 24 hours, using the same concentrations of AgNPs; 5) mRNA levels of PFKFB3 in our study did not significantly increase and its protein levels increased only at a high concentration of AgNP treatment at 3 hours in HepG2 cells, whereas they found an increase in PFKFB3 mRNA levels at 24 hours and no data regarding protein levels were included. Miethling-Graff et al observed size- and dose-dependent effects of AgNPs on ROS production: 1) 5 or 10 μg/mL 10 nm AgNPs increased ROS levels by more than 1.9- or 2.6-fold, respectively, compared to 20, 40, and 60 nm AgNPs; 2) the cytotoxicity of AgNPs showed an inverse relationship with particle size.30 Similar to Miethling-Graff’s report, we detected elevated ROS levels after 5 nm AgNP treatment, whereas Chen et al did not detect ROS production after 20 nm AgNP treatment. We observed that elevated ROS production played a major role in the reduced release of lactate following 5 nm AgNP treatment, suggesting that metabolic changes caused by AgNPs may depend on the their size. Regarding PFKFB3, the protein levels of PFKFB3 were measured by Western blot and not based only on mRNA levels, suggesting alterations in protein degradation.33 Since PFKFB3 can direct the glucose metabolic pathway to glycolysis or to PPP, based on its methylation status,25 additional studies are needed to clarify the effect of PFKFB3 on glucose metabolism with AgNP treatment.
Glucose consumption was significantly reduced in HepG2 cells but not in Huh7 and THP-1 cells. Although 5 nm AgNPs reduced lactate release in both HepG2 and Huh7 cells and in THP-1 cells stimulated with LPS, 5 nm AgNPs did not affect lactate release by THP-1 cells in the absence of LPS stimulation. The reasons for these differential responses to AgNP treatment are not well-understood, but several factors may be involved, including the relative contribution of metabolic pathways for energy metabolism or differences in the expression levels and activation status of metabolism regulatory molecules. In agreement with this, various respiration rates were observed in cells depending on the cell type.34 Overall, gene expression profiles were similar, but there were differences in the expression of several genes between HepG2 and Huh7 cells.35 Our findings suggest that the effect of AgNPs on metabolism may vary according to cell type, and thus further study is necessary to determine the effect of AgNPs on metabolism in the different types of cells.
In our study, PEPCK mRNA levels were not altered, but Nrf2 level was reduced in hepatoma cells 2 hours after AgNP treatment. Further, Nrf2 protein levels and nuclear localization were not significantly increased in hepatoma cells within 1 hour after treatment with AgNPs. In contrast to our results, AgNPs (15 μg/mL) elevated Nrf2 mRNA (approximately 1.8-fold) and protein levels in Caco-2 cells, a human colorectal adenocarcinoma cell line, 3 and 6 hours, respectively.36 The previous study found elevated Nrf2 protein levels in the nuclear fraction after normalization of nuclear Nrf2 with GAPDH protein levels.36 In another report of rainbow trout (Oncorhynchus mykiss) hepatocytes, 10 μg/mL AgNPs with an average size of 9 nm stimulated glycogenolysis and reduced PEPCK activity 48 hours after treatment.37 It was not clear whether the alterations in Nrf2 and PEPCK expression were direct effects or were secondary results due to compensation for metabolic changes caused by AgNPs.
Conclusion
We demonstrated ROS-dependent reduction of lactate release by hepatoma cell lines in response to 5 nm AgNPs. Our findings provide important insights into the cytotoxic mechanisms of AgNPs.
Acknowledgments
This research was supported by NanoMaterial Technology Development Program through the National Research Foundation of Korea (NRF) funded by the Ministry of Education, Science and Technology (2009-0082417) and NRF-2015M3A7B6027976.
Disclosure
The authors report no conflicts of interest in this work.
References
Guo D, Zhu L, Huang Z, et al. Anti-leukemia activity of PVP-coated silver nanoparticles via generation of reactive oxygen species and release of silver ions. Biomaterials. 2013;34(32):7884–7894. | ||
dos Santos CA, Seckler MM, Ingle AP, et al. Silver nanoparticles: therapeutical uses, toxicity, and safety issues. J Pharm Sci. 2014;103(7):1931–1944. | ||
Boca-Farcau S, Potara M, Simon T, Juhem A, Baldeck P, Astilean S. Folic acid-conjugated, SERS-labeled silver nanotriangles for multimodal detection and targeted photothermal treatment on human ovarian cancer cells. Mol Pharm. 2014;11(2):391–399. | ||
Gaikwad S, Ingle A, Gade A, et al. Antiviral activity of mycosynthesized silver nanoparticles against herpes simplex virus and human parainfluenza virus type 3. Int J Nanomed. 2013;8:4303–4314. | ||
Monteiro DR, Gorup LF, Silva S, et al. Silver colloidal nanoparticles: antifungal effect against adhered cells and biofilms of Candida albicans and Candida glabrata. Biofouling. 2011;27(7):711–719. | ||
Morones JR, Elechiguerra JL, Camacho A, et al. The bactericidal effect of silver nanoparticles. Nanotechnology. 2005;16(10):2346–2353. | ||
AshaRani PV, Low Kah Mun G, Hande MP, Valiyaveettil S. Cytotoxicity and genotoxicity of silver nanoparticles in human cells. ACS Nano. 2009;3(2):279–290. | ||
Greulich C, Diendorf J, Gessmann J, et al. Cell type-specific responses of peripheral blood mononuclear cells to silver nanoparticles. Acta Biomater. 2011;7(9):3505–3514. | ||
Gurunathan S, Park JH, Han JW, Kim JH. Comparative assessment of the apoptotic potential of silver nanoparticles synthesized by Bacillus tequilensis and Calocybe indica in MDA-MB-231 human breast cancer cells: targeting p53 for anticancer therapy. Int J Nanomed. 2015;10:4203–4222. | ||
Hussain SM, Hess KL, Gearhart JM, Geiss KT, Schlager JJ. In vitro toxicity of nanoparticles in BRL 3A rat liver cells. Toxicol In Vitro. 2005;19(7):975–983. | ||
Zhou YT, He W, Lo YM, Hu X, Wu X, Yin JJ. Effect of silver nanomaterials on the activity of thiol-containing antioxidants. J Agric Food Chem. 2013;61(32):7855–7862. | ||
Swanner J, Mims J, Carroll DL, et al. Differential cytotoxic and radiosensitizing effects of silver nanoparticles on triple-negative breast cancer and non-triple-negative breast cells. Int J Nanomed. 2015;10:3937–3953. | ||
Lin J, Huang Z, Wu H, Zhou W, Peipei J, Wei P. Inhibition of autophagy enhances the anticancer activity of silver nanoparticles. Autophagy. 2014;10(11):2006–2020. | ||
Hsu PP, Sabatini DM. Cancer cell metabolism: Warburg and beyond. Cell. 2008;134(5):703–707. | ||
Warburg O, Posener K. Negelein E. Ueber den Stoffwechsel der Tumoren. [The metabolism of tumors]. Biochem Z. 1924;152:319–344. German. | ||
Xie H, Hanai J, Ren JG, et al. Targeting lactate dehydrogenase – a inhibits tumorigenesis and tumor progression in mouse models of lung cancer and impacts tumor-initiating cells. Cell Metab. 2014;19(5):795–809. | ||
Jain M, Nilsson R, Sharma S, et al. Metabolite profiling identifies a key role for glycine in rapid cancer cell proliferation. Science. 2012;336(6084):1040–1044. | ||
Daemen A, Peterson D, Sahu N, et al. Metabolite profiling stratifies pancreatic ductal adenocarcinomas into subtypes with distinct sensitivities to metabolic inhibitors. Proc Natl Acad Sci U S Am. 2015;112(32):E4410–E4417. | ||
Sanchez-Sanchez AM, Antolin I, Puente-Moncada N, et al. Melatonin cytotoxicity is associated to warburg effect inhibition in ewing sarcoma cells. PloS One. 2015;10(8):e0135420. | ||
Filippi C, Pryde A, Cowan P, et al. Toxicology of ZnO and TiO nanoparticles on hepatocytes: impact on metabolism and bioenergetics. Nanotoxicology. 2015;9(1):126–134. | ||
Lim DH, Jang J, Kim S, Kang T, Lee K, Choi IH. The effects of sub-lethal concentrations of silver nanoparticles on inflammatory and stress genes in human macrophages using cDNA microarray analysis. Biomaterials. 2012;33(18):4690–4699. | ||
Rui L. Energy metabolism in the liver. Compr Physiol. 2014;4(1):177–197. | ||
Patra KC, Hay N. The pentose phosphate pathway and cancer. Trends Biochem Sci. 2014;39(8):347–354. | ||
Seo M, Lee YH. PFKFB3 regulates oxidative stress homeostasis via its S-glutathionylation in cancer. J Mol Biol. 2014;426(4):830–842. | ||
Yamamoto T, Takano N, Ishiwata K, et al. Reduced methylation of PFKFB3 in cancer cells shunts glucose towards the pentose phosphate pathway. Nature Commun. 2014;5:3480. | ||
Adeva M, Gonzalez-Lucan M, Seco M, Donapetry C. Enzymes involved in l-lactate metabolism in humans. Mitochondrion. 2013;13(6):615–629. | ||
Mitsuishi Y, Taguchi K, Kawatani Y, et al. Nrf2 redirects glucose and glutamine into anabolic pathways in metabolic reprogramming. Cancer Cell. 2012;22(1):66–79. | ||
Dayem AA, Kim B, Gurunathan S, et al. Biologically synthesized silver nanoparticles induce neuronal differentiation of SH-SY5Y cells via modulation of reactive oxygen species, phosphatases, and kinase signaling pathways. Biotechnol J. 2014;9(7):934–943. | ||
Foldbjerg R, Olesen P, Hougaard M, Dang DA, Hoffmann HJ, Autrup H. PVP-coated silver nanoparticles and silver ions induce reactive oxygen species, apoptosis and necrosis in THP-1 monocytes. Toxicol Lett. 2009;190(2):156–162. | ||
Miethling-Graff R, Rumpker R, Richter M, et al. Exposure to silver nanoparticles induces size- and dose-dependent oxidative stress and cytotoxicity in human colon carcinoma cells. Toxicol In Vitro. 2014;28(7):1280–1289. | ||
Taguchi K, Motohashi H, Yamamoto M. Molecular mechanisms of the Keap1-Nrf2 pathway in stress response and cancer evolution. Genes Cells. 2011;16(2):123–140. | ||
Chen Y, Wang Z, Xu M, et al. Nanosilver incurs an adaptive shunt of energy metabolism mode to glycolysis in tumor and nontumor cells. ACS Nano. 2014;8(6):5813–5825. | ||
Almeida A, Bolaños JP, Moncada S. E3 ubiquitin ligase APC/C-Cdh1 accounts for the Warburg effect by linking glycolysis to cell proliferation. Proc Natl Acad Sci. 2010;107(2):738–741. | ||
Moreno-Sanchez R, Marin-Hernandez A, Saavedra E, Pardo JP, Ralph SJ, Rodriguez-Enriquez S. Who controls the ATP supply in cancer cells? Biochemistry lessons to understand cancer energy metabolism. Int J Biochem Cell Biol. 2014;50:10–23. | ||
Arai M, Yokosuka O, Hirasawa Y, et al. Sequential gene expression changes in cancer cell lines after treatment with the demethylation agent 5-aza-2′-deoxycytidine. Cancer. 2006;106(11):2514–2525. | ||
Aueviriyavit S, Phummiratch D, Maniratanachote R. Mechanistic study on the biological effects of silver and gold nanoparticles in Caco-2 cells – induction of the Nrf2/HO-1 pathway by high concentrations of silver nanoparticles. Toxicol Lett. 2014;224(1):73–83. | ||
Massarsky A, Labarre J, Trudeau VL, Moon TW. Silver nanoparticles stimulate glycogenolysis in rainbow trout (Oncorhynchus mykiss) hepatocytes. Aqua Toxicol. 2014;147:68–75. |
Supplementary materials
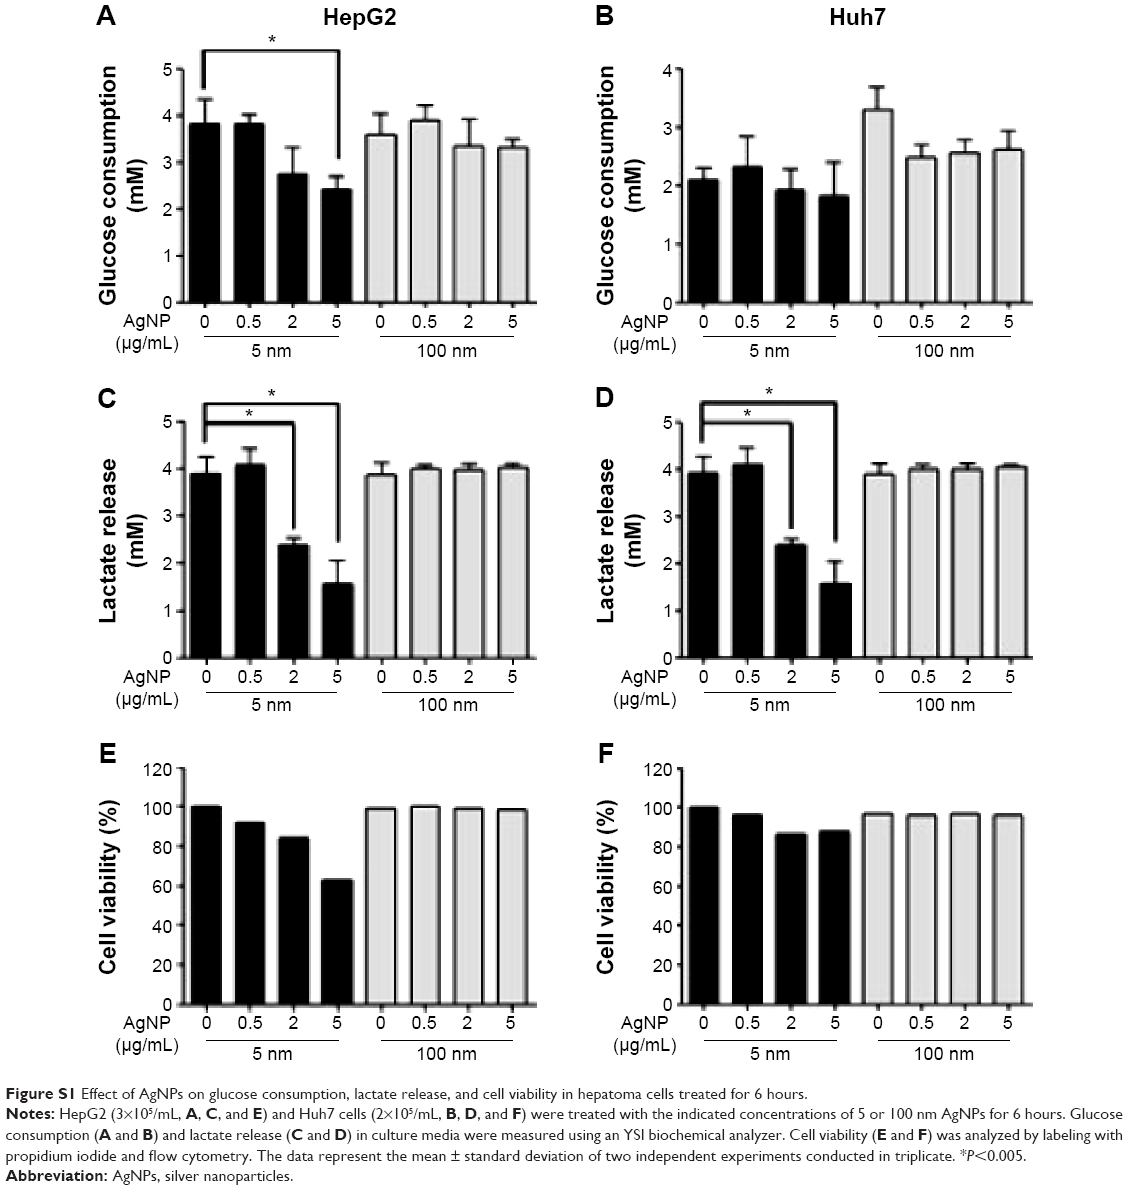 | Figure S1 Effect of AgNPs on glucose consumption, lactate release, and cell viability in hepatoma cells treated for 6 hours. |
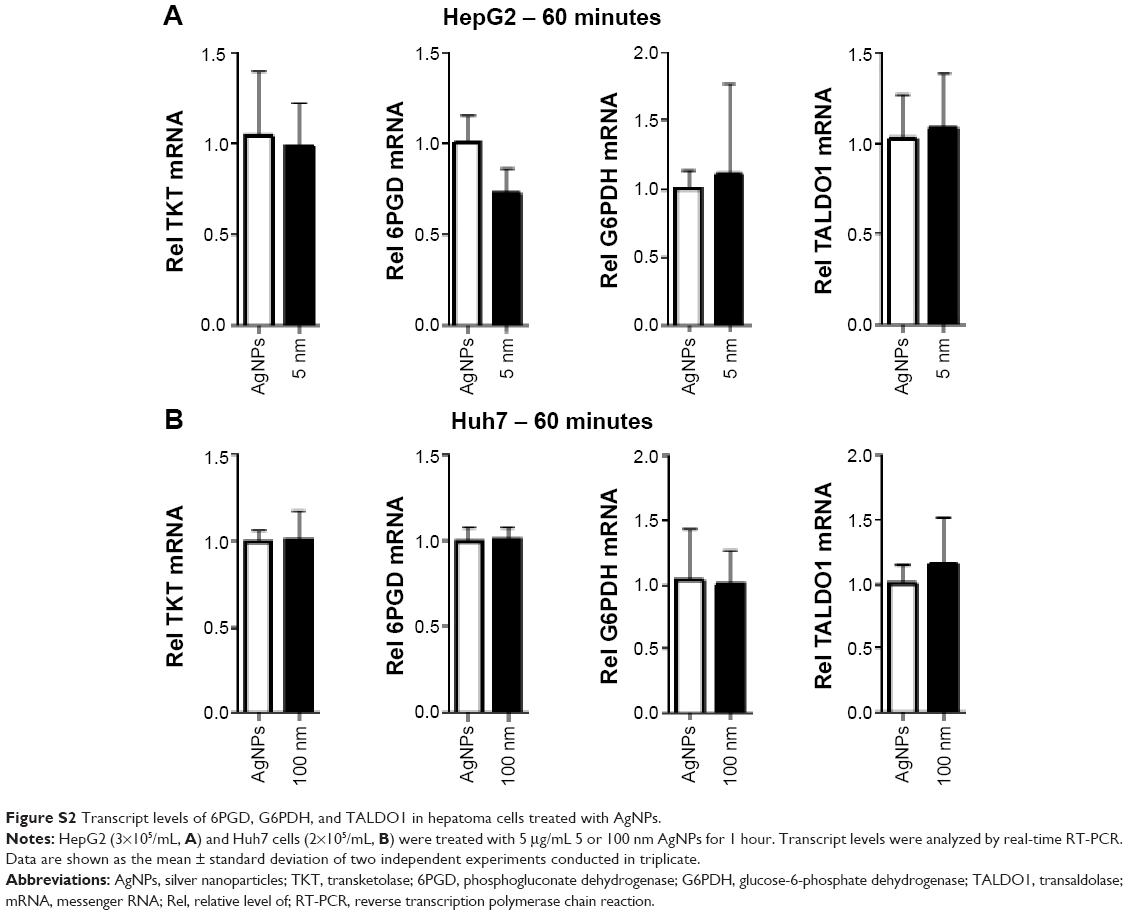 | Figure S2 Transcript levels of 6PGD, G6PDH, and TALDO1 in hepatoma cells treated with AgNPs. |
 © 2015 The Author(s). This work is published and licensed by Dove Medical Press Limited. The full terms of this license are available at https://www.dovepress.com/terms.php and incorporate the Creative Commons Attribution - Non Commercial (unported, v3.0) License.
By accessing the work you hereby accept the Terms. Non-commercial uses of the work are permitted without any further permission from Dove Medical Press Limited, provided the work is properly attributed. For permission for commercial use of this work, please see paragraphs 4.2 and 5 of our Terms.
© 2015 The Author(s). This work is published and licensed by Dove Medical Press Limited. The full terms of this license are available at https://www.dovepress.com/terms.php and incorporate the Creative Commons Attribution - Non Commercial (unported, v3.0) License.
By accessing the work you hereby accept the Terms. Non-commercial uses of the work are permitted without any further permission from Dove Medical Press Limited, provided the work is properly attributed. For permission for commercial use of this work, please see paragraphs 4.2 and 5 of our Terms.