")
Back to Journals » International Journal of Nanomedicine » Volume 17
Silica Nanoparticles Cause Activation of NLRP3 Inflammasome in-vitro Model-Using Microglia
Authors Hou S , Li C, Wang Y, Sun J, Guo Y, Ning X , Ma K, Li X, Shao H, Cui G, Jin M , Du Z
Received 7 May 2022
Accepted for publication 27 October 2022
Published 10 November 2022 Volume 2022:17 Pages 5247—5264
DOI https://doi.org/10.2147/IJN.S372485
Checked for plagiarism Yes
Review by Single anonymous peer review
Peer reviewer comments 2
Editor who approved publication: Dr Farooq A. Shiekh
Shanshan Hou,1 Chao Li,2 Yihua Wang,3 Jiayin Sun,2 Yutong Guo,4 Xiaofan Ning,1 Kai Ma,1 Xinyue Li,1 Hua Shao,2 Guanqun Cui,5 Minghua Jin,1 Zhongjun Du2
1School of Public Health Jilin University, Changchun, Jilin Province, 130021, the People’s Republic of China; 2Shandong Academy of Occupational Health and Occupational Medicine, Shandong First Medical University & Shandong Academy of Medical Sciences, Jinan, Shandong Province, 250062, the People’s Republic of China; 3Chemical Institute of Chemical Industry, Xinjiang University of Science and Technology, Korla, Bayinguoleng Mongolian Autonomous Prefecture, Xinjiang Uygur Autonomous Region, 841000, the People’s Republic of China; 4Navel Medical University, Shanghai, 200433, the People’s Republic of China; 5Department of Respiratory Medicine, Children’s Hospital Affiliated to Shandong University, Ji’nan, Shandong Province, 250022, the People’s Republic of China
Correspondence: Minghua Jin, School of Public Health, Jilin University, Changchun, Jilin Province, 130021, the People’s Republic of China, Email [email protected] Zhongjun Du, Shandong Academy of Occupational Health and Occupational Medicine, Shandong First Medical University & Shandong Academy of Medical Sciences, Jinan, Shandong Province, 250062, the People’s Republic of China, Email [email protected]
Introduction: Silica nanoparticles (SiNPs) have been widely used in food, cosmetics, medicine and other fields; however, there have been growing concerns regarding their potential adverse effects on health. A large number of studies have confirmed that SiNPs with small particle diameters can pass through the blood brain barrier, causing irreversible damage to the nervous system. This study aims to further explore the molecular mechanism of neurotoxicity of SiNPs and provide a toxicological basis for the medical application of SiNPs.
Methods: We conducted an in vitro study using neuroimmune cells (mouse microglial cells, BV2) of the central nervous system to study inflammation and ferroptosis after exposure to SiNPs. We detected cell viability, morphology and ultrastructure, antioxidant function, inflammation, and ferroptosis-related proteins to explore the role of pyroptosis and ferroptosis in the damage of BV2 cells induced by SiNPs. We further explored the relationship between the inflammatory response and ferroptosis induced by SiNPs by silencing the NOD-like receptor thermal protein domain associated protein 3 (NLRP3) gene and inhibiting ferroptosis.
Results: The results showed that SiNPs could invade the cytoplasm, change the ultrastructure, activate NLRP3 inflammasomes, release a large number of inflammatory factors, and trigger inflammatory reaction. We also found that SiNPs could disrupt cellular antioxidant function, increase intracellular ferrous ion level and induce ferroptosis. In addition, both inflammation and ferroptosis are alleviated in NLRP3 gene-silenced cells.
Conclusion: SiNPs could induce BV2 cytotoxicity through inflammatory response and ferroptosis, which may be mediated by the activation of the NLRP3 inflammasomes.
Keywords: SiNPs, microglia, inflammation, ferroptosis, molecular mechanism
Introduction
Silica nanoparticles (SiNPs) have become one of the most well-recognized nanomaterials in human life. A large number of commercial products containing SiNPs have entered the market, as food packaging, cosmetics and electronic products. SiNPs are also widely used in the biomedical field due to their large specific surface area, easy surface modification and superior biocompatibility for various applications, including medical imaging, cancer diagnosis and cell tracking.1 Especially in the treatment of central nervous system (CNS) diseases, the application of SiNPs has realized the targeted delivery of macromolecular drugs to the brain.2 The modified SiNPs form colloids to repair the damaged spinal cord and rebuild the CNS.3 Previous study has reported that the entry of SiNPs into the brain may be possible via several pathways, thus causing neurotoxicity.4 One of the well-studied modes of entry of SiNPs into the brain is through olfactory sensory neurons (OSNs) and their projections to the olfactory bulb.5 Another possible mode of entry is through neurons afferent from the trigeminal nerve directly pass through the nasal mucosa and enter the brain stem at the pons level.6 In addition, in vivo studies have found that small SiNPs can directly crossing the blood-brain barrier and entering the brain, causing irreversible damage to the CNS.7–9 However, the molecular mechanisms of SiNPs neurotoxicity are complex and largely unknown.
Microglia are innate immune cells of the CNS, which normally play the role of immune monitoring.10,11 Once microglia sense tissue injury or a foreign agent, they will be activated and initiate innate immune responses through a complex network of pathways, releasing immune-related molecules, including cytokines, chemokines and reactive oxygen species (ROS), which have been implicated in neuronal dysfunction and brain damage.12,13 Activated microglia are found surrounding lesions of various neurodegenerative diseases, such as Alzheimer’s disease (AD), Parkinson’s disease (PD), muscular amyotrophic lateral sclerosis, and multiple sclerosis.14 Thus, microglia are very likely to respond to the entry of SiNPs. Xue et al15 reported the toxic effects of four types of inorganic nanoparticles, including SiO2-NPs, TiO2-NPs, HAP-NPs and Fe3O4-NPs on murine BV2 cells. They found that TiO2-NPs and HAP-NPs caused neurotoxicity by affecting NO synthesis and promoting the expression of MCP-1/MIP-1α signaling molecules in BV2 cells. However, exposure to SiO2-NPs and Fe3O4-NPs did not activate macrophage chemotactic protein-1/macrophage inflammatory protein-1alfa (MCP-1/MIP-1α) signaling molecules, although low levels of the inflammatory factors tumor necrosis factor-alfa (TNF-α), interleukin-1β (IL-1β), and interleukin-6 (IL-6) were detected. These results indicate that SiO2-NPs and Fe3O4-NPs may induce an inflammatory response of BV2 cells through other molecular pathways. A recent study found that CdTe and CdTe-ZnS quantum dot exposure caused IL-1β-mediated inflammation and inflammatory cell death. Quantum dot-induced, excessive ROS formation triggers NLRP3 inflammasome activation, resulting in caspase-1 activity, processing of pro-IL-1β into mature IL-1β, and induction of BV2 cell pyroptosis.16 SiNPs may also induce BV2 cell inflammatory response by activating the NLRP3 inflammasome, although the molecular mechanism needs to be further explored.
The inflammasome is a caspase-1-activating multiprotein complex comprised sensor molecules such as NLRP3, apoptosis-associated speck-like protein containing a caspase recruitment domain (ASC), and pro-caspase-1.17 In microglia, the NLRP3 inflammasome can be assembled upon stimulation by accumulated endogenous metabolites. The assembly of an inflammasome promptly results in the activation of caspase-1 and the subsequent secretion of interleukin IL-1β, which might play a major role in the initiation of pro-inflammatory responses around microglia.18,19 Recent studies demonstrated a significant contribution of the NLRP3 inflammasome to the progression of PD and AD. Studies based on clinical data and animal experiments have shown that β-amyloid peptide deposits cause inflammasome activation, including the activation of NLRP3 and the release of IL-1β. IL-1β levels are considerably increased in the brain tissue, cerebrospinal fluid, and peripheral blood of AD patients.20,21 A recent study showed that the NLRP3 inflammasome inhibitor OLT1177 could rescue cognitive impairment in a mouse model of AD,22 which confirmed the important role of NLRP3 in neurodegenerative diseases and inflammatory response. Therefore, we hypothesize that the NLRP3 inflammasome plays an important role in inducing neuroinflammatory response involving the release of a large number of inflammatory factors.
Ferroptosis, a programmed cell death mode, discovered by Stockwell in 2008, is mainly regulated by three molecular mechanisms. Ferroptosis is mainly caused by the inactivation of the cellular antioxidant system, especially the abrogation of the glutathione (GSH) - glutathione peroxidase 4 (GPX4) antioxidant defense system, leading to the accumulation of lipid hydroperoxide because of the incomplete elimination of oxidative stress products.23 Antioxidants are compounds that can reduce or terminate the destructive chain reactions caused by ROS, and ferroptosis can be mitigated by lipophilic antioxidants such as vitamin E, ferrostatin-1 (Fer-1), liproxstatin-1 (Lip-1) and possibly potent bioactive polyphenols.24 An in vivo study confirmed that Fer-1 could rescue the ferroptosis state of renal tissue in mice with acute renal injury induced by GPX4 gene knockout.25 In addition, iron overload is a necessary condition for the process of ferroptosis. The increase in ferrous ion levels in cells will promote lipid peroxidation and the aggregation of ROS and induce ferroptosis.26 Acyl-CoA synthase long-chain family member 4 (ACSL4) could promote the occurrence of ferroptosis via the formation of cell lipid components.27 Therefore, the defense against ferroptosis could be achieved by inhibiting intracellular lipid peroxides, ferrous ions, or ACSL4.
Recent studies have found that ferroptosis is closely related to the development of nervous system diseases such as AD, PD, Huntington’s disease and periventricular leukomalacia.28,29 Hambright et al30 reported that the ablation of ferroptosis regulator GPX4 in forebrain neurons promoted cognitive impairment and neurodegeneration. In addition, the serological examination of patients with PD revealed increased levels of iron ions and lipid peroxidation products, but decreased glutathione peroxidase levels.31,32 Thus, ferroptosis could be another pathological player in the context of CNS diseases. In 2020, Wu et al33 found that graphene quantum dots induce ferroptosis in BV2 cells through lipid peroxidation, which provides new evidence in the study of the neurotoxic mechanism of nanoparticles. Another study found that pyrolysis and ferroptosis jointly regulate the progression of coronary atherosclerosis.34 Spearman correlation showed that atherosclerosis was positively associated with the expression of PTGS2, ACSL4, caspase-1, and NLRP3 and negatively associated with the expression of GPX4.
The above findings inspired our research to explore the interaction between ferroptosis and inflammatory response in CNS damage. Thus, the aim of this study was to further explore the molecular mechanism of the neurotoxicity of SiNPs and provide a toxicological basis for the medical application of SiNPs. We established an in vitro experimental model of BV2 cells exposed to SiNPs and studied the inflammation and ferroptosis occurring in the BV2 cells. In addition, the oxidative stress response and antioxidant function of the cells were evaluated. Finally, we explored the relationship between inflammation and ferroptosis by using small-interfering RNA (siRNA) technology and ferroptosis inhibitors and evaluated the role of the NLRP3 inflammasome in this process.
Materials and Methods
Characterization of Silica Nanoparticles
The SiNPs suspension (1.0 mg/mL) was dropped onto the copper mesh, and after drying at room temperature, the size and morphology of the particles were observed and photographed using a transmission electron microscope (TEM) (JEOL, Japan). The average particle size was calculated using ImageJ software. A zeta potential particle size analyzer (Malvern, UK) was used to detect the particle size and stability of SiNPs in pure water, 1640 medium, and 1640 medium containing 10% serum. One milliliter of the SiNPs suspension was taken in the cuvette and tested under the conditions of λmax 633 nm, temperature 20°C, and 90° scattering angle.
The Examination of Silica Nanoparticles Using Microglial Cell Line
BV2, a mouse microglia cell line, was chosen as the experimental model and obtained from the Kunming cell bank of the Chinese Academy of Sciences (Kunming, China). BV2 cells were maintained in 1640 medium (Gibco, USA) supplemented with 10% fetal bovine serum (FBS) (Gibco, USA), 100 U/mL penicillin, and 100 µg/mL streptomycin. The medium was changed every 2 days. Cultures were maintained at 37°C in a humidified atmosphere of 95% O2 and 5% CO2. The exposure concentrations of SiNPs were 0, 12.5, 25, 50, and 100 µg/mL. Lipopolysaccharide (LPS), the main component of the outer membrane of gram-negative bacteria, has an immune activation function as it interacts with host effector cells (eg, monocytes, macrophages, neutrophils) to secrete TNF-α, IL-1β, and other inflammatory factors. Therefore, we used LPS diluted to 1.0 µg/mL with 1640 medium as a positive control to activate the immune function in the BV2 cells after a 3 h exposure.
Detection of Cell Viability Using a Counting Kit-8
The effect of SiNPs on cell viability was determined using a cell counting kit-8 (Dojindo, Japan) according to the manufacturer’s instruction. The BV2 cells were preincubated in a 96-well plate at a density of 1×10⁴ cells/well in a total volume of 100 µL and allowed to attach and grow for 24 h in a 37°C incubator. The cells were washed once with phosphate-buffered saline (PBS) and incubated for 3, 6, 12, and 24 h with different concentrations of SiNPs diluted with serum-free medium. The experimental group consisted of BV2 cells incubated with different concentrations of SiNPs, the particles group consisted of different concentrations of SiNPs without cells, the control group comprised BV2 cells without any treatment, and the blank group consisted of empty wells. After the treatments, 10 µL of the cell counting kit-8 solution was added to each well, the cells were incubated at 37°C for 2 h, and the absorbance determined at 450 nm with a spectrophotometer. The absorbance values of the particles groups were subtracted from the absorbance of the corresponding experimental groups to eliminate the background effect of the particles, and % cell viability was calculated using equation (1):

Observation of Cell Morphology by Hematoxylin-Eosin Staining
The effect of SiNPs on cell morphology was observed by hematoxylin-eosin staining. BV2 cells in logarithmic growth phase were collected, seeded in 24-well plates at a density of 1×10⁵ cells/well, cultured for 24 h, and then incubated with different concentrations of SiNPs for 6 h. BV2 cells in the positive control group were incubated with 1.0 µg/mL LPS solution for 3 h. The cells were treated with 500 µL/well of 4% paraformaldehyde for 30 min for fixation, incubated with 300 µL of 0.1% Triton X-100 for 10 min for permeabilization, and then incubated with 300 µL of hematoxylin staining solution for 1 min. This was followed by differentiation with hydrochloric acid and alcohol, ammonia water inverted blue, eosin dye solution for 10 min, and washing with water until the cells were colorless. The cells were observed and imaged under an inverted microscope.
Observation of Cell Ultrastructure by Transmission Electron Microscope
A TEM was used to observe the uptake of nanoparticles by the cells and the changes in ultrastructure following uptake. The cells were exposed to different concentrations of SiNPs for 6 h and then, treated with 0.25% trypsin to collect the cells as a suspension. The cell suspension was centrifuged at 700 rpm for 5 min and then, at 1500 rpm for 10 min. The cell pellet was fixed with 1% osmium acid at 4°C for 2 h and washed three times with distilled water, followed by gradient dehydration with 50%, 70%, 80%, and 90% ethanol for 15 min each. This was followed by two changes with propylene oxide and incubation with a 1:1 mix of propylene oxide and resin at room temperature for 1 h. Propylene oxide and resin were mixed in a ratio of 1:4, and the cells were soaked in the mixture for 1 h at room temperature for replacement. This was followed by immersing the cells in the resin for 2 h and then, embedding and polymerizing with epoxy resin Epon812 at 40°C for 48 h and then, 60°C for 48 h. The sections were sliced with an ultrathin microtome, stained with uranium for 10 min, and photographed under a TEM.
Detection of Intracellular Reactive Oxygen Species by Flow Cytometry
The levels of intracellular ROS were determined using a reactive oxygen species assay kit (Beyotime, China) according to the manufacturer’s instructions. Cells were exposed to different concentrations of SiNPs for 6 h, while the positive control group was exposed to 1.0 µg/mL LPS solution for 3 h. The cells were collected and incubated with DCFH-DA (10 µM) for 30 min at 37°C. Intracellular ROS generation was measured using flow cytometry (Becton Dickinson, USA) at excitation and emission wavelengths of 488 nm and 525 nm, respectively. All the treatments were performed in triplicate in three independent experiments. In addition, the intensity and quantity of ROS production were observed in the cells through the live-cell workstation (Becton Dickinson, USA).
Detection of Antioxidant Indexes Using a Biochemical Method
The activity of GSH-Px and SOD were detected using a biochemical method. Cells were exposed to different concentrations of SiNPs for 6 h, collected the suspension centrifuged at 1300 rpm for 5 min, and the supernatant discarded. The cell pellet was mixed with 200 µL of RIPA lysis buffer using a pipette. Freeze-thaw was done three times at −80°C and 37°C to fully lyse the cells. The cell suspension was then centrifuged at 12,000 rpm for 20 min, and the supernatant was transferred to a new tube. The BCA protein quantification method was used to estimate the protein concentration of each group. The manufacturer’s instructions provided with the GSH-Px and SOD detection kit were used to determine the activity of GSH-Px and SOD in each sample group. All the treatments were performed in triplicate in three independent experiments.
Measurement of Inflammation Related Proteins by Immunofluorescence
The effect of SiNPs on inflammation-related proteins was observed using immunofluorescence. BV2 cells were incubated overnight in 24-well plates with 1.0 cm2 coverslips per well and then, treated with SiNPs and LPS. The cells were incubated in the fixative solution and the osmotic solution for 15 min and in the blocking solution for 1.5 h. The primary antibodies were diluted as follows: CD68 (CST, USA) 1:100, NLRP3 (CST, USA) 1:250, caspase-1 (CST, USA) 1:500, ASC (Santa Cruz, USA) 1:200; the cells were incubated overnight with these primary antibody dilutions at 4°C. This was followed by 1 h incubation at 37°C in the dark with a fluorescent secondary antibody and three washes with the washing solution. The coverslips were taken out from the wells, placed on glass slides, and covered with coverslips. After the addition of a capping agent containing 4’,6-diamidino-2-phenylindole (DAPI), the slides were stored in the dark and air-dried for fluorescence microscopy.
Detection of Inflammatory Factors by Quantitative Real-Time Polymerase Chain Reaction
Total RNA was extracted from BV2 cells and dissolved with RNase-free H2O. One microliter of this RNA solution from each group was used to detect the RNA concentration using a microdetector. An A260/A280 ratio of 1.8–2.0 was considered optimal. Quantitative real-time polymerase chain reaction (Q-PCR) analyses were performed in a Q-PCR instrument (Thermo Fisher Scientific, USA) with the SYBR Green PCR master mix reagent (Thermo Fisher Scientific, USA) in 40 cycles. The denaturing, annealing, and extension conditions of each PCR cycle were 94℃ for 5s, 94℃ for 30s, 56℃ for 30s, and 72℃ for 30s. The relative amount or fold change of the target gene expression was normalized relative to the level of GAPDH and relative to a control. The primer sequences for Q-PCR are shown in Table 1.
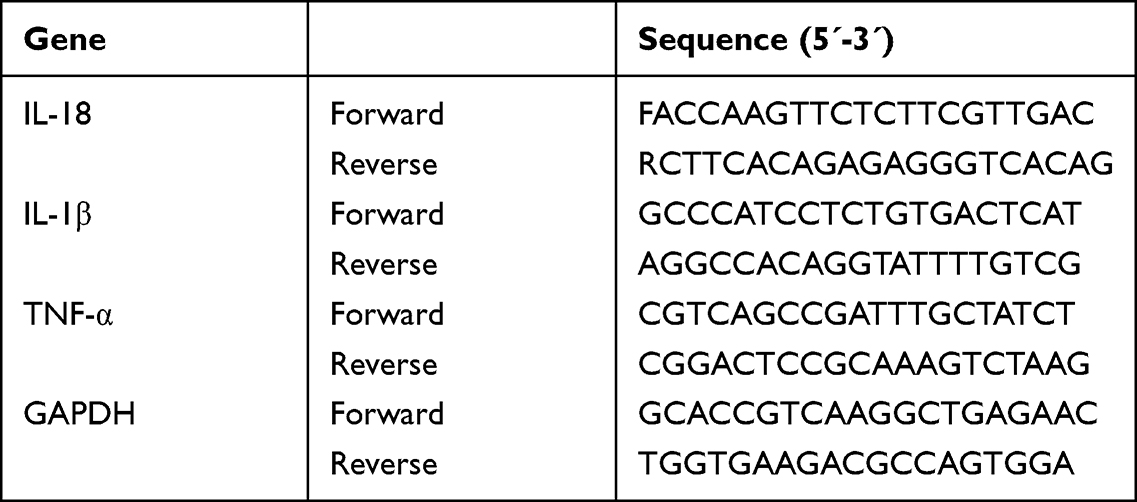 |
Table 1 Primer Sequence |
Silencing the NLRP3 Gene in Cells Using Small-Interfering RNA
Cells in their logarithmic growth phase were seeded in six-well plates at a density of 2×10⁵ cells/well and cultured for 24 h. The culture medium was changed to 2.0 mL Opti-MEM for 4 h, and the NLRP3 siRNA transfection system was prepared according to the RNA oligo synthesis instructions and left at room temperature for 20 min. Then, the supernatant medium was replaced with 500 µL of Opti-MEM, and 125 µL of the siRNA transfection system was added to the Opti-MEM culture medium for 36 h. The transfection efficiency was observed under a fluorescence microscope.
Detection of Ferrous Ions in Cells Using a Fluorescence Probe
The effect of SiNPs on intracellular ferrous ions was observed by labeling the cells with the FerroOrange probe (Dojindo, Japan). After the cells were treated with different concentrations of SiNPs and LPS, 200 µL of a 1.0 µM FerroOrange probe solution (in PBS) was added to each well and incubated for 10 min. The fluorescence of the cells was observed at Ex/Em = 561 nm/570–620 nm and images were taken under a fluorescence microscope.
Western Blot Analysis of Proteins Related to Inflammation and Ferroptosis
The total protein content of BV2 cells was extracted using RIPA with 1% PMSF (Beyotime, China). A BCA protein assay kit (Beyotime, China) was used to measure the protein concentrations of the extracts of each group. Equal amounts of protein from these samples were separated by 10% sodium dodecyl sulfate-polyacrylamide gel electrophoresis and electro-transferred to polyvinylidene difluoride membranes (300 mA, 1.5 h). The membranes were incubated with quick-block solution for at least 1 h at room temperature with gentle rocking. The membranes were then incubated overnight with the following primary antibodies at 4°C: NLRP3 (CST, USA) 1:1000, caspase-1 (CST, USA) 1:2000, ASC (Santa Cruz, USA) 1:200, ACSL4 (Santa Cruz, USA) 1:200, COX2 (CST, USA) 1:1000, HO-1 (Santa Cruz, USA) 1:200, GPX4 (Santa Cruz, USA) 1:200, and GAPDH (CST, USA) 1:10,000. After washing three times with TBST, the membranes were incubated with horseradish peroxidase-conjugated secondary antibody (CST, USA) 1:10,000 for 1 h at room temperature. The proteins were quantified through densitometric analysis. The experiments were performed in triplicate to ensure reproducibility.
Statistical Analysis
The analysis and processing of the data in this study were done using SPSS 24.0 statistical software, and the experimental data were represented as mean ± standard error of mean (SEM). One-way analysis of variance (one-way ANOVA) was used to compare samples between multiple groups, and the least significant difference (LSD) method was used for pairwise comparisons between groups. The significance level was set at α=0.05, and p < 0.05 indicated that the difference was statistically significant.
Results
Characterization, Stability, and Dispersion of Silica Nanoparticles
The morphology of SiNPs was observed by TEM. Under different magnifications, the particles appeared to have a regular spherical shape, with uniform size and good dispersibility (Figure 1). Analysis of the particle size of 200 particles by ImageJ software showed that the average particle size of SiNPs is 48.53±3.12 nm, which is close to the 50 nm particle size mentioned in the instructions provided by the reagent’s manufacturers. The larger the absolute value of zeta potential is, the more stable the dispersion system is. According to Table 2, SiNPs with the smallest particle size are the most stable in pure water. In 1640 medium, the particle size of the SiNPs increases from 56.74±3.27 nm to 236.62±6.35 nm with the addition of 10% FBS while the zeta potential changes from −21.13±0.97 mV to −10.12±0.62 mV. These changes indicate that the particles have aggregated or precipitated in 1640 medium containing serum. Therefore, in this study, as 1640 medium was used to dilute the SiNPs, the suspension was sonicated for 20 min before use.
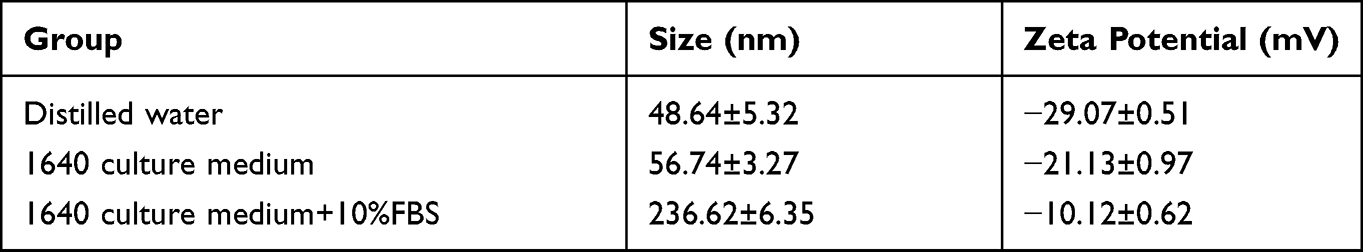 |
Table 2 Hydrodynamic Diameter and Zeta Potential of SiNPs in Different Media |
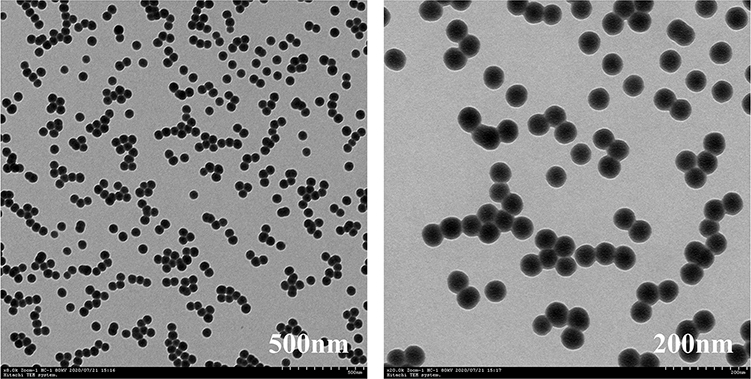 |
Figure 1 Morphology and dispersion of SiNPs observed using a transmission electron microscope. Scale bar: left 500 nm, right 200 nm. |
Cytotoxicity of Silica Nanoparticles to Microglia Cells
The cell counting kit-8 method was used to detect the effect of different concentrations of SiNPs on the cell viability of BV2 cells exposed for different periods. The results in Figure 2A show that the cell viability decreased gradually with the increase in the concentration of SiNPs and the exposure time. SiNPs treatment for 3 h had almost no effect on cell viability except at the highest dose level of SiNPs (100 µg/mL). When the cells were exposed to SiNPs for 6 h, the cell viability decreased significantly in cells treated with SiNPs at 50 µg/mL and 100 µg/mL compared with the control group. The cell viability of each concentration of SiNPs exposed for 12 h was significantly lower than that observed for 3 h. After 24 h of exposure to SiNPs, cell viability decreased even more significantly, and the viability of the 100 µg/mL group was lower than that of the 50 µg/mL group. Therefore, an exposure of 6 h to 50 µg/mL SiNPs, which was associated with 80% cell viability relative to untreated cells, was selected as the experimental condition for treatment with inhibitor and siRNA in experiments exploring the molecular mechanism of the toxic effects of SiNPs.
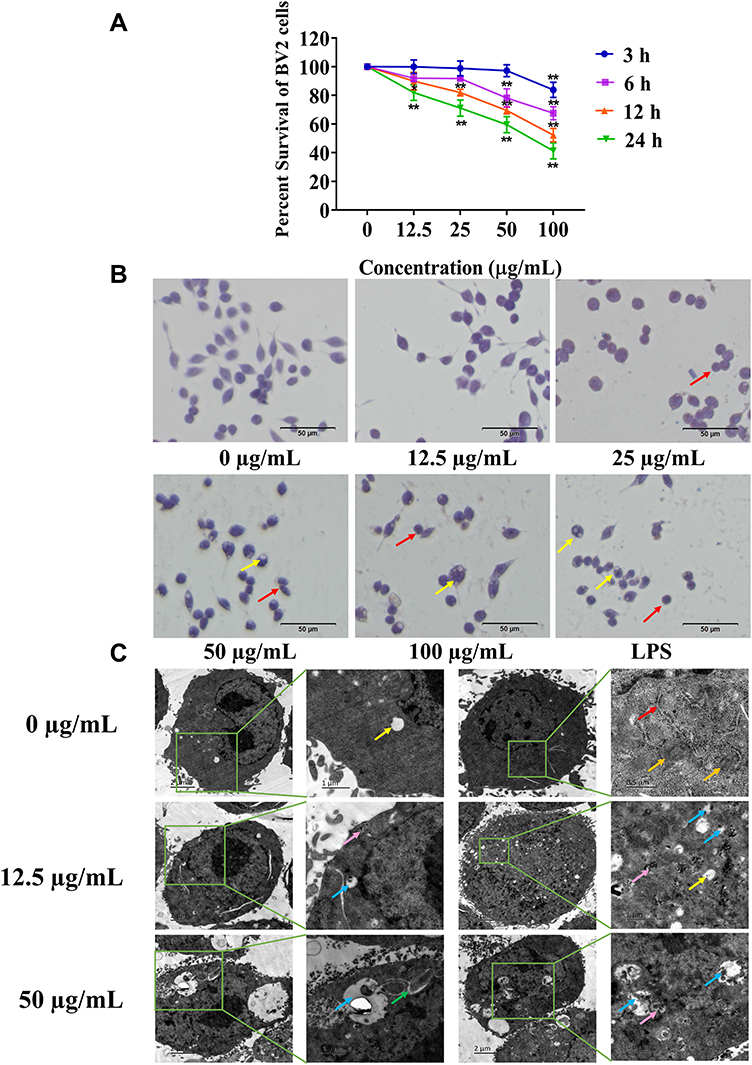 |
Figure 2 Cytotoxicity of the SiNPs. (A) Cell Counting Kit-8 assay shows that SiNPs induced a dose- and time-dependent decrease in cell viability (n = 5), Data are presented as mean ± SEM. *p<0.05, **p<0.01 when compared with the control group. (B) Hematoxylin-eosin staining was used to observe the effect of SiNPs on the morphology of BV2 cells. The red arrows point to contractile rounded cells, and the yellow arrows point to cell vacuoles. Scale bar: 50 µm. (C) The uptake of nanoparticles and the ultrastructure of cells were observed by TEM. Endoplasmic reticulum (red arrow), mitochondria (Orange arrow), particle clusters (pink arrow), cell vacuoles (yellow arrow), autophagy lysosome (blue arrow), swollen endoplasmic reticulum (green arrow). |
Silica Nanoparticles Destroyed Cell Morphology and Ultrastructure
The influence of SiNPs on cell morphology was observed by hematoxylin and eosin staining under a microscope. Figure 2B shows that the cells in the control group grew well, were distributed evenly, and had mostly regular spherical shapes or short protrusions, and the nucleus staining was shallow and uniform. No obvious changes in cell morphology were observed in the 12.5 µg/mL group. However, as the dose of the SiNPs increased, the protrusions of the cells in the 25 µg/mL group contracted and the cells became round. A few cell vacuoles were observed in the 50 µg/mL group, which increased in the 100 µg/mL group together with the appearance of cell debris near the cells. The cells in the positive control LPS group became round and shrank, and cell vacuoles were also clearly evident. TEM images showed that the nanoparticles had directly entered the cells treated with 12.5 µg/mL SiNPs. The particle clusters were evenly distributed in the cytoplasm but not in the nucleus, which was intact. Mitochondrial swelling and vacuoles containing impurities were observed, which may indicate the formation of autophagy lysosomes due to the phagocytic function of BV2 cells. Treatment of 50 µg/mL SiNPs led to drastic changes in cell morphology. The nanoparticles aggregated in the cells, leading to more and enlarged autophagy lysosomes, more phagosomes, and swelling of the endoplasmic reticulum (Figure 2C).
Silica Nanoparticles Induced Oxidative Stress in Cells
Higher ROS levels can lead to cell injury or death through oxidative stress. BV2 cells were exposed to SiNPs for 6 h. The green fluorescence of treated BV2 cells gradually increased with increasing concentrations of SiNPs, while untreated cells showed a basal level of fluorescence (Figure 3A and B). ROS levels quantified using flow cytometry were observed to increase significantly in the 50 µg/mL and 100 µg/mL groups (Figure 3C and D). Both GSH-Px and SOD are important indicators of cell antioxidant function. With the increase in SiNPs concentration, the intracellular GSH-Px level first increased, reached the highest level in the 25 µg/mL group, then decreased in the 50 µg/mL group, and reached the lowest level in the 100 µg/mL group (Figure 3E). The level of intracellular SOD in the control group was the highest and decreased gradually with increasing SiNPs concentration (Figure 3F). The difference between each dose group and the control group was statistically significant.
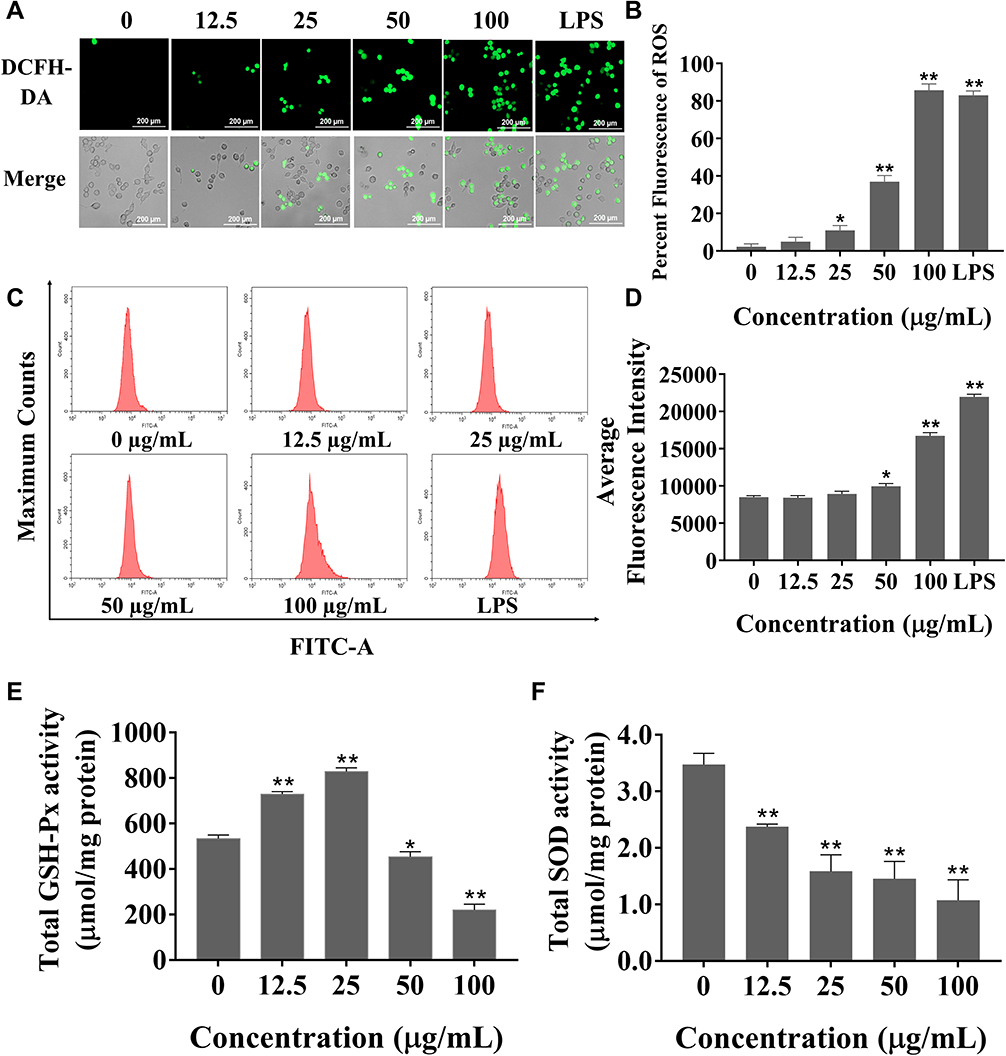 |
Figure 3 Effects of SiNPs on cell oxidation and antioxidation. (A) Observation of intracellular ROS labeled by DCFH-DA probe in living cell workstation. Scale bar: 200 µm. (B) Statistical analysis of ROS level observed by fluorescence microscope. (C) The level of ROS is evaluated by flow cytometry. (D) Statistical analysis chart of ROS level detected by flow cytometry. (E) The activity of GSH-Px first increased and then decreased with the increase of dose after SiNPs exposure for 6 h. (F) The activity of SOD decreased with dose after SiNPs exposure for 6 h. Data all from three separate experiments were expressed as mean ± SEM. *p < 0.05, **p < 0.01 versus control group. |
Silica Nanoparticles Induced a Cellular Inflammatory Response by Activating the NLRP3 Inflammasome
Immunofluorescence and Western blot methods were used to observe the effect of SiNPs on inflammation-related proteins in BV2 cells. Red fluorescently labeled CD68 was expressed in the cytoplasm and nucleus of BV2 cells in the 50 µg/mL SiNPs group and the LPS group. CD68 is a specific marker of microglia activation, indicating that SiNPs activated BV2 cells (Figure 4A). The levels of the inflammation-related proteins NLRP3, caspase-1, and ASC were also significantly increased after stimulation by SiNPs and LPS, compared with those in the control cells. Compared with the SiNPs group, the LPS group had more fluorescently labeled NLRP3 and ASC and higher overall fluorescence intensity. As shown in Figure 4B–D, in SiNPs treated cells, NLRP3 and ASC were mainly expressed in the cytoplasm, and caspase-1 was expressed in both the nucleus and the cytoplasm. To further determine the activity of NLRP3 inflammasomes, we double stained NLRP3 and ASC, as well as NLRP3 and caspase-1 to observe whether the two inflammatory proteins have co-expressed regions. Figure 4E shows that the red fluorescently labeled NLRP3 and green fluorescent labeled ASC partially coincided, merging into orange fluorescent spots in BV2 cells exposed to SiNPs and LPS. We speculated that these fluorescent spots correspond to activated NLRP3 inflammasomes. This coincidence phenomenon is more obvious in the LPS group than in the SiNPs group. NLRP3 and caspase-1 double staining also showed similar results. BV2 cells exposed to SiNPs and LPS showed orange fluorescent spots around the cells (Figure 4F). Western blot analysis confirmed that SiNPs induced inflammation, which was evidenced by significantly increased expression of NLRP3 and ASC proteins with the increase in SiNPs concentration (Figure 4G and H). The expression of activated caspase-1 protein was elevated with the increase in SiNPs concentration, with protein levels in the 25, 50, 100 µg/mL SiNPs, and LPS groups being significantly different from those in the control group (Figure 4I). To further explore the mechanisms of the effects of SiNPs, we performed Q-PCR to measure mRNA levels of inflammatory factors in BV2 cells. The results show that when BV2 cells were exposed to SiNPs for 6 h, the mRNA levels of inflammatory factors IL-18, IL-1β, and TNF-α increased significantly in a concentration-dependent manner compared with those of the control group. After LPS exposure for 3 h, the mRNA levels of IL-18, IL-1β, and TNF-α were significantly higher than those in the 12.5, 25, and 50 µg/mL SiNPs groups (Figure 4J).
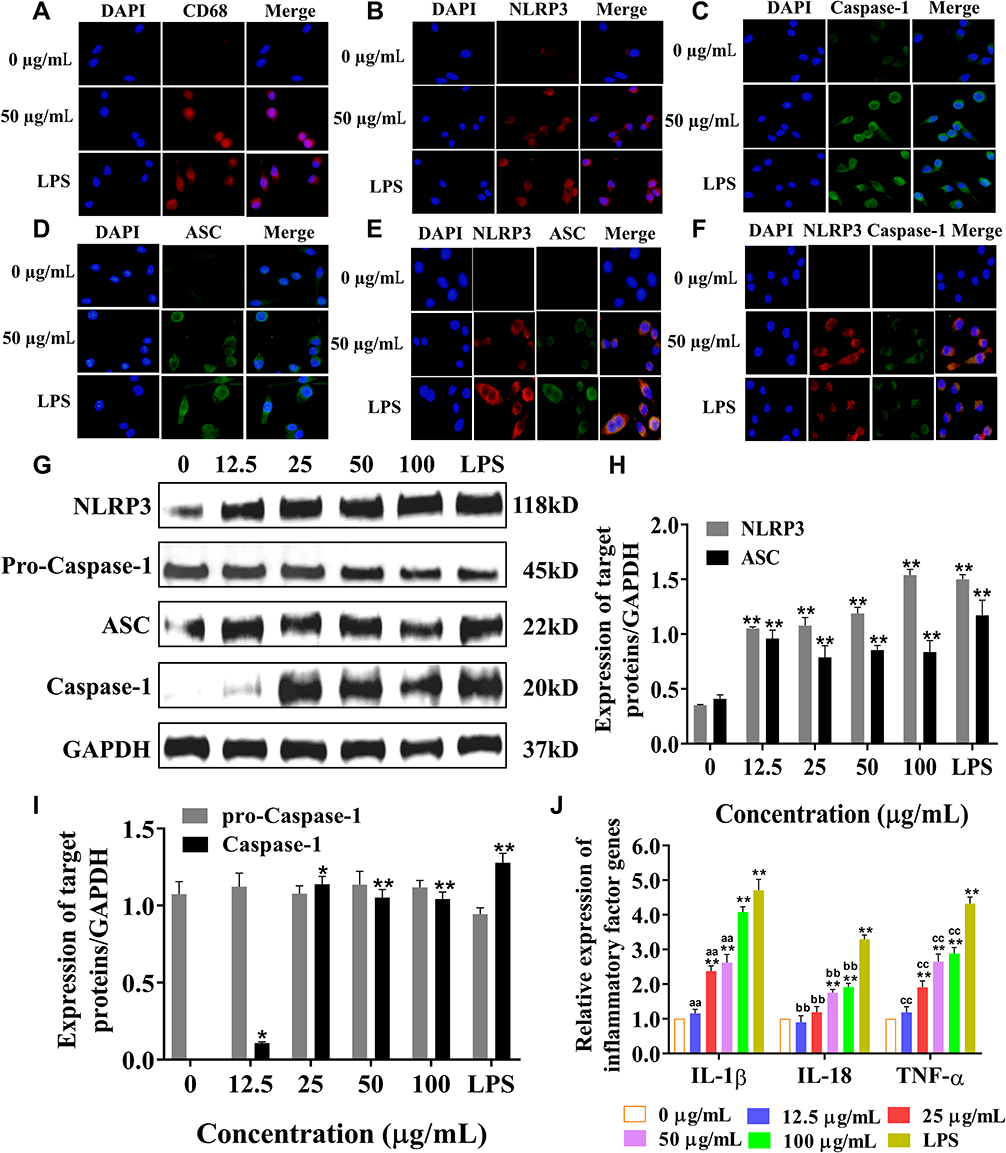 |
Figure 4 After exposure to SiNPs for 6 h, BV2 cells and NLRP3 inflammasome were activated and inflammatory factors were released. LPS is a positive control for inflammation. (A) Immunofluorescence observation of CD68 expression results. DAPI stains the nucleus, merge indicates merging of the fluorescence of the nucleus and the target proteins. Scale bar: 20 µm. (B) NLRP3 single staining results. Scale bar: 20 µm. (C) Caspase-1 single staining results. (D) ASC single staining results. Scale bar: 20 µm. (E) NLRP3 and ASC double staining results. Scale bar: 20 µm. (F) NLRP3 and Caspase-1 double staining results. Scale bar: 20 µm. (G) Western blot detection of inflammation-related protein bands. (H) NLRP3 and ASC band analysis. (I) Caspase-1 and pro-caspase-1 band analysis. (J) Q-PCR method to measure the mRNA levels of inflammatory factors IL-18, IL-1β and TNF-α. Data all from three separate experiments were expressed as mean ± SEM. *p < 0.05, **p < 0.01 versus control group. aap < 0.01 versus LPS group of IL-1β, bbp < 0.01 versus LPS group of IL-18, ccp < 0.01 versus LPS group of TNF-α. |
Silica Nanoparticles Caused Ferroptosis by Inducing Iron Metabolism Disorders
To explore the effect of SiNPs on cell ferroptosis, we labeled the cells with iron ion probes and examined the influence of SiNPs on intracellular ferrous ions under a fluorescence microscope. FerroOrange is an orange fluorescent probe that specifically detects labile ferrous ions. The results showed hardly any ferrous ions in the BV2 cells of the control and 12.5 µg/mL SiNPs groups but an increase in the orange red fluorescence with increasing SiNPs concentration (Figure 5A and B). Then, the expression of ferroptosis-related proteins was detected by Western blot to determine whether ferroptosis occurred during the SiNPs exposure. As shown in Figure 5C and D, the expression of positive regulators of ferroptosis ACSL4 and COX2 increased with the increase in SiNPs concentration. The slight decrease of these protein levels in the 100 μg/mL SiNPs group could be attributed to the serious damage caused by the high dose of SiNPs. Although the expression of HO-1 was very low, a significantly increasing trend was observed following SiNPs exposure. The expression of GPX4, a negative regulator of ferroptosis, decreased significantly with the increase in SiNPs concentration, indicating the disruption in cellular antioxidant function.
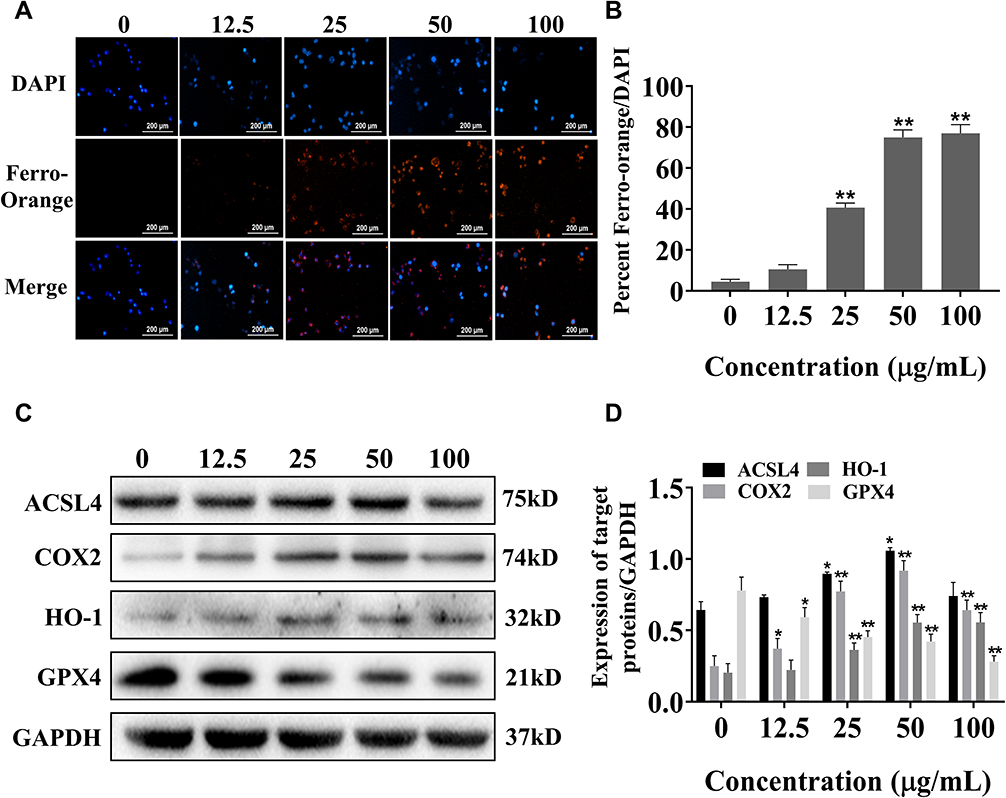 |
Figure 5 Exposure to SiNPs for 6 h induces ferroptosis of BV2 cells. (A) Live cell workstation detects the level of FerroOrange labeled ferrous ions in cells. Scale bar: 200 µm. (B) Ferrous ions levels observed by live cell workstation. (C) Western blot detection of ferroptosis-related protein bands. (D) Target protein band analysis results. Data from three separate experiments were expressed as mean ± SEM. *p < 0.05, **p < 0.01 versus control group. |
The Role of the NLRP3 Inflammasome in Silica Nanoparticles Induced Ferroptosis in Microglial Cells
To explore the role of the NLRP3 inflammasome in the ferroptosis of BV2 cells induced by SiNPs, the NLRP3 gene in BV2 cells was knocked down by small-interfering RNA technology. The cell viability test results showed that although there was no significant difference in the viability of NLRP3 gene-silenced cells compared with the control group, the viability of NLRP3 gene silenced cells treated with SiNPs was significantly higher than that of normal cells (Figure 6A). Western blot results showed that the expression of NLRP3 protein decreased in NLRP3-silenced cells, confirming the successful silencing by the NLRP3 siRNA. Then, the BV2 cells with the silenced NLRP3 gene were exposed to 50 µg/mL SiNPs for 6 h, and intracellular ferrous ions were examined using the FerroOrange probe. Figures 6B and D show a significant reduction in the number of ferrous ions following treatment with SiNPs in the NLRP3 gene-silenced cells compared with the unsilenced group. However, after preincubation of the cells with ferroptosis inhibitors, fewer ferrous ions were observed in the SiNPs-treated cells than in the NLRP3-silenced cells. Moreover, the SiNPs-induced expression of activated fragments of other inflammation-related proteins caspase-1 and ASC protein was also significantly decreased. Interestingly, after silencing the NLRP3 gene, compared with normal cells treated with the same concentration of SiNPs, the NLRP3-silenced cells showed decreased expression of ACSL4, COX2, and HO-1 and increased expression of GPX4 (Figure 6E and F), indicating that NLRP3 gene silencing could attenuate ferroptosis induced by SiNPs.
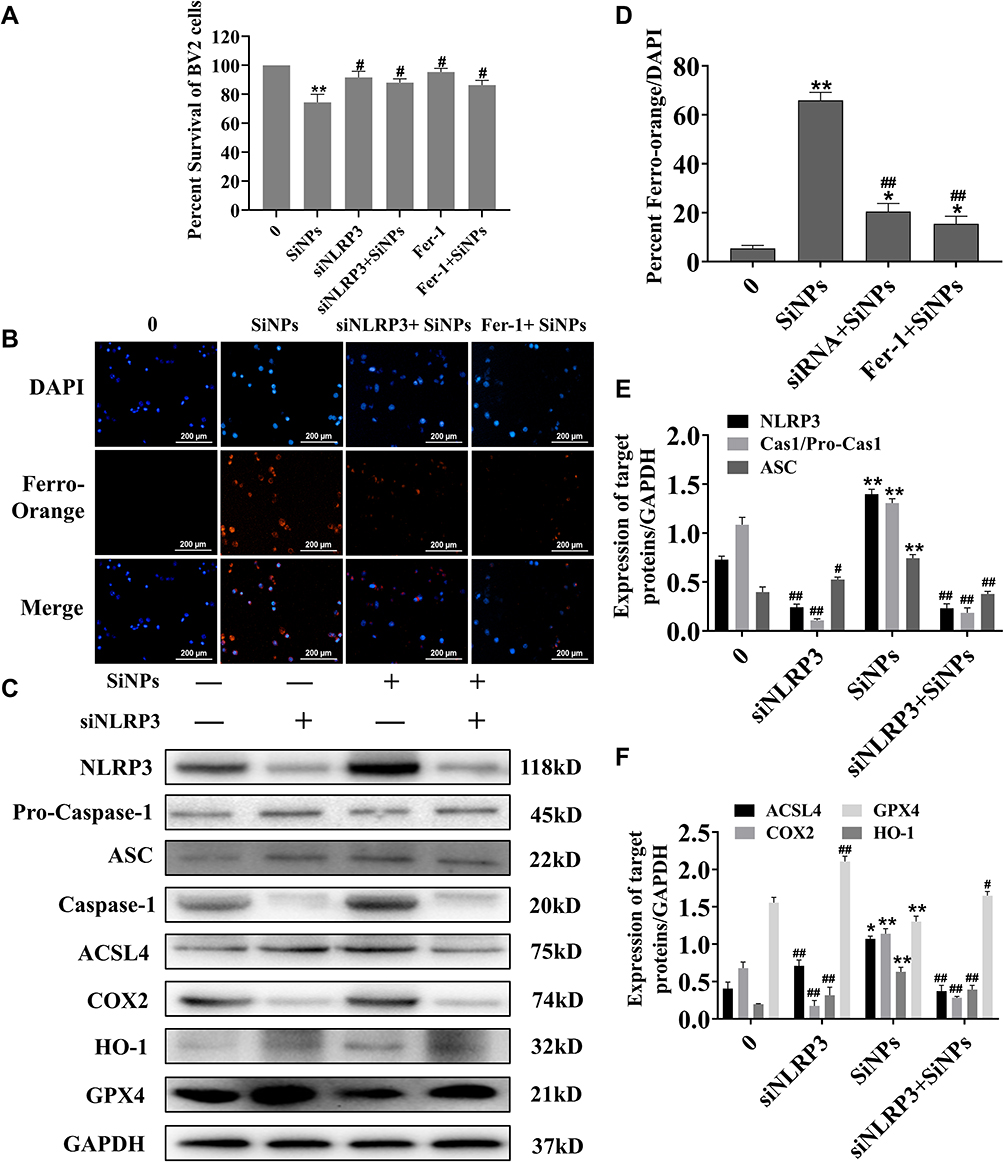 |
Figure 6 The role of NLRP3 gene in the effects of SiNPs on the inflammatory response and ferroptosis of BV2 cells. (A) Detection of cell viability after silencing NLRP3 gene and inhibiting ferroptosis. (B) The effect of SiNPs on intracellular iron levels was observed after silencing the NLRP3 gene and inhibiting ferroptosis in a live cell workstation. Preincubation of cells with Fer-1 (50µM) for 2 h followed by exposure to SiNPs for 6 h. Scale bar: 200 µm. (C) Western blotting was used to detect inflammatory reaction and ferroptosis related proteins. Groups from left to right are control group, siNLRP3 BV2 group, 50 μg/mL SiNPs group and siNLRP3+50 μg/mL SiNPs group. (D) Ferrous ions levels observed using a live cell workstation. (E) Band analysis of inflammatory response related proteins. (F) Band analysis of ferroptosis related proteins. Data from three separate experiments were expressed as mean ± SEM. *p < 0.05, **p < 0.01 versus control group, #p < 0.05, ##p < 0.01 versus 50 μg/mL SiNPs group. |
The Role of Ferroptosis in Silica Nanoparticles Induced Inflammatory Response in Microglial Cells
To further study the role of ferroptosis in the inflammatory response, we used Fer-1 to suppress cell ferroptosis and examined inflammatory factors in response to SiNPs. Western blot results show that SiNPs could induce ACSL4, COX2, and HO-1 proteins’ expression and inhibit GPX4 protein expression in BV2 cells. As expected, inhibiting cell ferroptosis reversed the expression trends, resulting in decreased levels of the ferroptosis proteins ACSL4, COX2, and HO-1 and increased GPX4 levels, indicating that the inhibitor restores the antioxidant function of BV2 cells. However, the results show that inhibition of ferroptosis led to a decrease in NLRP3 levels but no significant change in the expression of caspase-1 activated fragment and ASC (Figure 7A–C). The results in Figure 7D show that exposure to SiNPs induced the release of a large number of inflammatory factors such as IL-1β, IL-18, and TNF-α. However, after knocking down the NLRP3 gene, the levels of these inflammatory factors released by SiNPs-induced cells were significantly reduced. After inhibition of ferroptosis, SiNPs-induced IL-18 levels were significantly reduced compared with the SiNPs-treated cells without Fer-1 treatment, but IL-1β and TNF-α levels were not significantly changed.
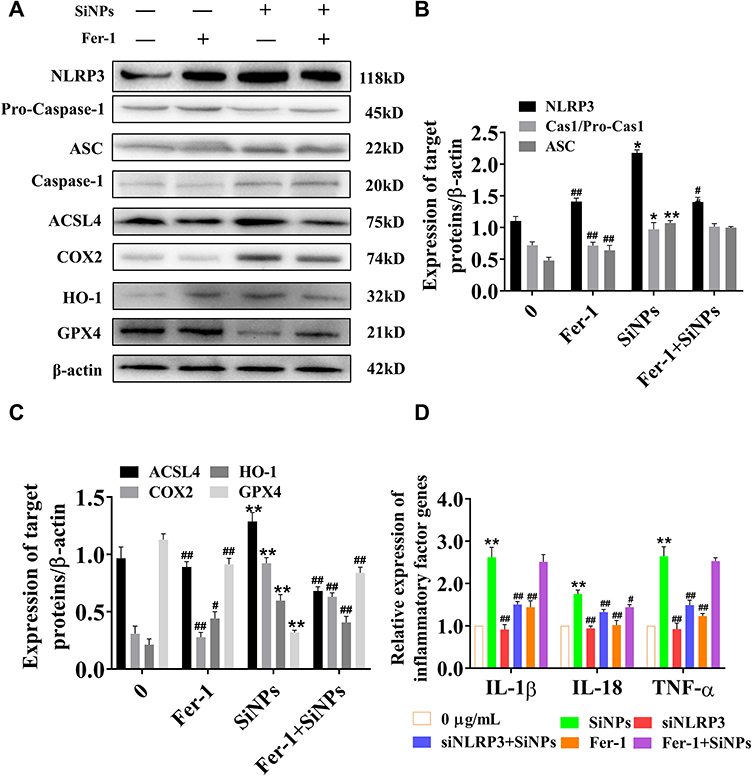 |
Figure 7 Inhibition of ferroptosis and effects of SiNPs on inflammatory response and ferroptosis of BV2 cells. (A) Western blotting was used to detect inflammatory reaction and ferroptosis related proteins. Groups from left to right are control group, 50 µM Fer-1 group, 50 µg/mL SiNPs group and Fer-1+50 µg/mL SiNPs group. (B) Band analysis of inflammatory response related proteins. Data from three separate experiments were expressed as mean ± SEM. *p < 0.05, **p < 0.01 versus control group, ##p < 0.01 versus 50 µg/mL SiNPs group. (C) Band analysis of ferroptosis related proteins. Data from three separate experiments were expressed as mean ± SEM. **p < 0.01 versus control group, #p < 0.05, ##p < 0.01 versus 50 µg/mL SiNPs group. (D) The effects of siNLRP3 and Fer-1 on inflammatory factors level were detected using Q-PCR. Data from three separate experiments were expressed as mean ± SEM. **p < 0.01 versus 0 µg/mL group, #p < 0.05, ##p < 0.01 versus 50 µg/mL SiNPs group. |
Discussion
In this article, we provide in vitro evidence for the effects of SiNPs on microglia from mouse brain. First, we confirmed the toxic effects of SiNPs on BV2 cells viability, and cell ultrastructure, which were similar to the characteristics of pyroptosis. We further explored the cellular inflammatory response and its molecular mechanism mediated by NLRP3 inflammasomes. Our results showed that SiNPs induced redox imbalance, which is one of the key mechanisms of ferroptosis. Next, we confirmed that SiNPs induced ferroptosis by detecting increased levels of ferrous ions and ferroptosis-related proteins. Finally, by silencing the NLRP3 gene and inhibiting ferroptosis, we found that SiNPs caused cytotoxicity through two interacting pathways of pyroptosis and ferroptosis, which may be mediated by the activation of NLRP3 inflammasomes.
As the sentinels of the CNS, microglia are the first cells to respond to disruption of brain homeostasis and entry of foreign particles or infectious agents. Once activated, the morphology of microglia changes and they release a large number of inflammatory mediators to mediate the occurrence of inflammation in the nervous system.4 Activated microglia will amplify the inflammatory state by activating other immune cells. Liddelow et al35 reported that inflammatory factors released by activated microglia act on astrocytes to promote glutamate release and neurotoxicity. Another study showed that the expression of fibronectin in activated microglia was increased, thus inhibiting the migration of macrophages and preventing the removal of inflammatory factors.36 Therefore, toxicological assessment of microglia exposed to SiNPs is necessary for understanding the neuronanotoxicity of SiNPs.
In this study, we found that SiNPs had significant toxic effects on BV2 cells, and the cell viability decreased in a time-dose dependent manner during the exposure to SiNPs (Figure 2A). Exposure to SiNPs made BV2 cells shrink and round, the protrusions retract, and increased the number of cell vacuoles in 50 µg/mL and 100 µg/mL SiNPs groups (Figure 2B). A large number of particles entered the cells and were distributed in the cytoplasm in the form of particle clusters, accompanied by some bubbles and swollen endoplasmic reticulum, which is consistent with the results of Choi et al.4 Interestingly, this phenomenon is similar to the characteristics of pyroptosis described by Shi et al.37 Since we failed to detect obvious apoptosis by flow cytometry, we hypothesized that SiNPs may cause BV2 cell damage in the form of pyroptosis rather than apoptosis.
Pyroptosis is an inflammatory form of cell death triggered by intracellular sensors such as NLRP3, which is mainly expressed in microglia in the CNS and can be activated by a variety of stimuli within the cell.38 After cells are stimulated by exogenous substances, the NLRP3 protein is activated and combined with the adaptor protein ASC and caspase-1 precursor to form an active inflammasome complex. Then, the NLRP3 inflammasomes activate caspase-1 to shear the resting inflammatory factors into active forms and release them.39 In this study, we found that SiNPs could increase the expression of NLRP3, ASC and caspase-1 proteins in BV2 cells as indicated in Figure 4B–D. Meanwhile, immunofluorescence double staining of NLRP3 and ASC, as well as of NLRP3 and caspase-1, showed a few activated NLRP3 inflammasomes (Figure 4E and F). To further confirm the speculation that SiNPs induced BV2 cell inflammatory response, the levels of inflammatory factors TNF-α, IL-1β and IL-18 were measured and found to increase significantly with the increase in SiNPs concentration (Figure 4J). These results indicate that an inflammatory response occurred during the exposure of BV2 cells to SiNPs.
Furthermore, we found that SiNPs exposure disrupted the antioxidant system of BV2 cells, which is consistent with our previous findings.40 SiNPs exposure caused a significant increase in intracellular ROS levels (Figure 3A–D). The levels of GSH-Px and SOD, both important antioxidant indexes in cells, were measured after exposure of BV2 cells to SiNPs. The level of GSH-Px gradually increased in the low-dose SiNPs group, indicating the presence of antioxidant function in BV2 cells during this period. However, the level of GSH-Px began to decline in the 50 µg/mL group (Figure 3E). The accumulation of ROS is reported to disrupt cellular antioxidant function. The level of SOD decreased gradually with increasing concentrations of SiNPs (Figure 3F), indicating that free radical scavenging activity had decreased. This disruption of cellular antioxidant function is related to a new form of cell death, we speculated that ferroptosis may also be involved in SiNPs-induced BV2 cell damage.
Ferroptosis is a recently identified type of cell death that is linked to neurodegeneration in experimental intracerebral hemorrhage41 AD, PD42–44 and periventricular leukomalacia.45 Ferroptosis is believed to be a form of iron-dependent cell death with lipid peroxidation, during which the lipid hydroperoxidase GPX4 converts lipid hydroperoxides to lipid alcohols, and this process prevents the iron-dependent formation of toxic lipid ROS.46 Inhibition of GPX4 function leads to lipid peroxidation and can result in the induction of ferroptosis, an iron-dependent, non-apoptotic form of cell death. This study confirmed the imbalance between oxidation and the GPX4 antioxidant system induced by SiNPs in BV2 cells. A recent study found that graphene quantum dot exposure could cause ferroptosis in BV2 cells followed by with cytosolic iron overload and redox imbalance, which could be suppressed by a ferroptosis-specific inhibitor and an iron chelator.33 Inspired by this study, we found that SiNPs could induce an imbalance in iron metabolism (Figure 5A and B) and increase the expression of ferroptosis-related proteins ACSL4, COX2 and HO-1 in BV2 cells. SiNPs also significantly reduced the expression of the antioxidant protein GPX4 (Figure 5C and D), which confirmed the occurrence of ferroptosis in BV2 cells. This is the first study to report the induction of BV2 cell injury through ferroptosis by SiNPs.
Previous studies have reported that ferroptosis plays an important role in inflammation, and several antioxidants functioning as ferroptosis inhibitors have been shown to exert anti-inflammatory effects in experimental models of some diseases.24,47 However, there is little evidence for the regulatory role of NLRP3 inflammasomes on ferroptosis. We investigated the association of two cellular outcomes by silencing the NLRP3 gene and inhibiting ferroptosis. The results showed that silencing the NLRP3 gene not only reduced the level of cell inflammation induced by SiNPs but also inhibited the expression of ferroptosis-related proteins. Consistent with the results reported by Song et al, the expression of NLRP3 and GPX4 proteins was negatively correlated in mice with acute renal injury after NLRP3 gene knockout. Another study reported that ferroptosis can induce an inflammatory response in the brain of a rat model of intracerebral hemorrhage (ICH), and Fer-1 treatment significantly reduced the levels of ROS and inflammatory factors, which indicated that inhibiting ferroptosis can alleviate inflammation and improve neuronal function in the rat model of ICH. However, our study showed that inhibition of ferroptosis had a weak effect on cellular inflammatory response. Inhibition of ferroptosis only attenuated the increase of IL-18 level induced by SiNPs, while no significant differences were noted in the lowered IL-1β and TNF-α levels. The differences in the levels of these inflammatory factors may depend on the disease model under investigation. Moreover, the results obtained from in vivo research are the aggregates of the actions of multiple immune cells. Since we only examined microglia, our results would be different from the results of other investigations. Our results suggest that inflammation plays a major role in the induction of BV2 cell damage by SiNPs. Silencing the NLRP3 gene inhibited ferroptosis induction by SiNPs, which weakened the inflammatory response to a certain extent.
Conclusion
The present study revealed that SiNPs may induce an inflammatory response and ferroptosis in microglia through the activation of NLRP3 inflammasomes. Moreover, there is an association between the inflammatory response and ferroptosis in BV2 cells induced by SiNPs. However, the specific mechanisms and targets need to be investigated further. This research provides new insights into the pathogenesis of CNS diseases induced by SiNPs, and also proposes a direction for the treatment of CNS diseases.
Data Sharing Statement
The datasets used and analyzed during the present study are available from the corresponding author on reasonable request.
Author Contributions
All authors made a significant contribution to the work reported, whether that is in the conception, study design, execution, acquisition of data, analysis and interpretation, or in all these areas; took part in drafting, revising or critically reviewing the article; gave final approval of the version to be published; have agreed on the journal to which the article has been submitted; and agree to be accountable for all aspects of the work and to ensure that questions related to the accuracy or integrity of any part of the work are appropriately investigated and resolved.
Funding
This work was supported by the National Natural Science Foundation of China [grant numbers 81602893, 81973089]. Natural Science Foundation of Shandong Province [grant numbers ZR2021MH218]. Innovation Project of Shandong Academy of Medical Science and Academic promotion programme of Shandong First Medical University [grant number 2019QL001].
Disclosure
The authors declare no conflicts of interest in this work.
References
1. Li Z, Mu Y, Peng C, Lavin MF, Shao H, Du Z. Understanding the mechanisms of silica nanoparticles for nanomedicine. Wiley Interdiscip Rev Nanomed Nanobiotechnol. 2021;13(1):e1658. doi:10.1002/wnan.1658
2. Turan O, Bielecki P, Perera V, et al. Delivery of drugs into brain tumors using multicomponent silica nanoparticles. Nanoscale. 2019;11(24):11910–11921. doi:10.1039/c9nr02876e
3. Cho Y, Borgens RB. Polymer and nano-technology applications for repair and reconstruction of the central nervous system. Exp Neurol. 2012;233(1):126–144. doi:10.1016/j.expneurol.2011.09.028
4. Choi J, Zheng Q, Katz HE, Guilarte TR. Silica-based nanoparticle uptake and cellular response by primary microglia. Environ Health Perspect. 2010;118(5):589–595. doi:10.1289/ehp.0901534
5. Oberdörster G, Sharp Z, Atudorei V, et al. Translocation of inhaled ultrafine particles to the brain. Inhal Toxicol. 2004;16(6–7):437–445. doi:10.1080/08958370490439597
6. Mistry A, Stolnik S, Illum L. Nanoparticles for direct nose-to-brain delivery of drugs. Int J Pharm. 2009;379(1):146–157. doi:10.1016/j.ijpharm.2009.06.019
7. Liu X, Sui B, Sun J. Blood-brain barrier dysfunction induced by silica NPs in vitro and in vivo: involvement of oxidative stress and Rho-kinase/JNK signaling pathways. Biomaterials. 2017;121:64–82. doi:10.1016/j.biomaterials.2017.01.006
8. Du Z, Zhao D, Jing L, et al. Cardiovascular toxicity of different sizes amorphous silica nanoparticles in rats after intratracheal instillation. Cardiovasc Toxicol. 2013;13(3):194–207. doi:10.1007/s12012-013-9198-y
9. Yu Y, Li Y, Wang W, et al. Acute toxicity of amorphous silica nanoparticles in intravenously exposed ICR mice. PLoS One. 2013;8(4):e61346. doi:10.1371/journal.pone.0061346
10. Wolf SA, Boddeke HW, Kettenmann H. Microglia in Physiology and Disease. Annu Rev Physiol. 2017;79:619–643. doi:10.1146/annurev-physiol-022516-034406
11. Schafer DP, Stevens B. Microglia function in central nervous system development and plasticity. Cold Spring Harb Perspect Biol. 2015;7(10):a020545. doi:10.1101/cshperspect.a020545
12. Subhramanyam CS, Wang C, Hu Q, Dheen ST. Microglia-mediated neuroinflammation in neurodegenerative diseases. Semin Cell Dev Biol. 2019;94:112–120. doi:10.1016/j.semcdb.2019.05.004
13. Orihuela R, McPherson CA, Harry GJ. Microglial M1/M2 polarization and metabolic states. Br J Pharmacol. 2016;173(4):649–665. doi:10.1111/bph.13139
14. Xu L, He D, Bai Y. Microglia-mediated inflammation and neurodegenerative disease. Mol Neurobiol. 2016;53(10):6709–6715. doi:10.1007/s12035-015-9593-4
15. Xue Y, Wu J, Sun J. Four types of inorganic nanoparticles stimulate the inflammatory reaction in brain microglia and damage neurons in vitro. Toxicol Lett. 2012;214(2):91–98. doi:10.1016/j.toxlet.2012.08.009
16. Liang X, Wu T, Wang Y, et al. CdTe and CdTe@ZnS quantum dots induce IL-1ss-mediated inflammation and pyroptosis in microglia. Toxicol In Vitro. 2020;65:104827. doi:10.1016/j.tiv.2020.104827
17. Eren E, Ozoren N. The NLRP3 inflammasome: a new player in neurological diseases. Turk J Biol. 2019;43(6):349–359. doi:10.3906/biy-1909-31
18. Li X, Zhang Y, Li B, et al. Activation of NLRP3 in microglia exacerbates diesel exhaust particles-induced impairment in learning and memory in mice. Environ Int. 2020;136:105487. doi:10.1016/j.envint.2020.105487
19. Scheiblich H, Schlutter A, Golenbock DT, Latz E, Martinez-Martinez P, Heneka MT. Activation of the NLRP3 inflammasome in microglia: the role of ceramide. J Neurochem. 2017;143(5):534–550. doi:10.1111/jnc.14225
20. Guan Y, Han F. Key mechanisms and potential targets of the NLRP3 inflammasome in neurodegenerative diseases. Front Integr Neurosci. 2020;14:37. doi:10.3389/fnint.2020.00037
21. Tschopp J, Schroder K. NLRP3 inflammasome activation: the convergence of multiple signalling pathways on ROS production?. Nat Rev Immunol Mar. 2010;10(3):210–215. doi:10.1038/nri2725
22. Lonnemann N, Hosseini S, Marchetti C, et al. The NLRP3 inflammasome inhibitor OLT1177 rescues cognitive impairment in a mouse model of Alzheimer’s disease. Proc Natl Acad Sci U S A. 2020;117(50):32145–32154. doi:10.1073/pnas.2009680117
23. Forcina GC, Dixon SJ. GPX4 at the crossroads of lipid homeostasis and ferroptosis. Proteomics. 2019;19(18):e1800311. doi:10.1002/pmic.201800311
24. Sun Y, Chen P, Zhai B, et al. The emerging role of ferroptosis in inflammation. Biomed Pharmacother. 2020;127:110108. doi:10.1016/j.biopha.2020.110108
25. Friedmann Angeli JP, Schneider M, Proneth B, et al. Inactivation of the ferroptosis regulator Gpx4 triggers acute renal failure in mice. Nat Cell Biol. 2014;16(12):1180–1191. doi:10.1038/ncb3064
26. Feng Z, Min L, Chen H, et al. Iron overload in the motor cortex induces neuronal ferroptosis following spinal cord injury. Redox Biol. 2021;43:101984. doi:10.1016/j.redox.2021.101984
27. Doll S, Proneth B, Tyurina YY, et al. ACSL4 dictates ferroptosis sensitivity by shaping cellular lipid composition. Nat Chem Biol. 2017;13(1):91–98. doi:10.1038/nchembio.2239
28. Bao W-D, Pang P, Zhou X-T, et al. Loss of ferroportin induces memory impairment by promoting ferroptosis in Alzheimer’s disease. Cell Death Differ. 2021;28(5):1548–1562. doi:10.1038/s41418-020-00685-9
29. Ratan RR. The chemical biology of ferroptosis in the central nervous system. Cell Chem Biol. 2020;27(5):479–498. doi:10.1016/j.chembiol.2020.03.007
30. Hambright WS, Fonseca RS, Chen L, Na R, Ran Q. Ablation of ferroptosis regulator glutathione peroxidase 4 in forebrain neurons promotes cognitive impairment and neurodegeneration. Redox Biol. 2017;12:8–17. doi:10.1016/j.redox.2017.01.021
31. Mahoney-Sanchez L, Bouchaoui H, Ayton S, Devos D, Duce JA, Devedjian JC. Ferroptosis and its potential role in the physiopathology of Parkinson’s disease. Prog Neurobiol. 2021;196:101890. doi:10.1016/j.pneurobio.2020.101890
32. Zhang P, Chen L, Zhao Q, et al. Ferroptosis was more initial in cell death caused by iron overload and its underlying mechanism in Parkinson’s disease. Free Radic Biol Med. 2020;152:227–234. doi:10.1016/j.freeradbiomed.2020.03.015
33. Wu T, Liang X, Liu X, et al. Induction of ferroptosis in response to graphene quantum dots through mitochondrial oxidative stress in microglia. Part Fibre Toxicol. 2020;17(1):30. doi:10.1186/s12989-020-00363-1
34. Zhou Y, Zhou H, Hua L, et al. Verification of ferroptosis and pyroptosis and identification of PTGS2 as the hub gene in human coronary artery atherosclerosis. Free Radic Biol Med. 2021;171:55–68. doi:10.1016/j.freeradbiomed.2021.05.009
35. Liddelow SA, Guttenplan KA, Clarke LE, et al. Neurotoxic reactive astrocytes are induced by activated microglia. Nature. 2017;541(7638):481–487. doi:10.1038/nature21029
36. Plemel JR, Stratton JA, Michaels NJ, et al. Microglia response following acute demyelination is heterogeneous and limits infiltrating macrophage dispersion. Sci Adv. 2020;6(3):eaay6324. doi:10.1126/sciadv.aay6324
37. Shi J, Gao W, Shao F. Pyroptosis: gasdermin-mediated programmed necrotic cell death. Trends Biochem Sci. 2017;42(4):245–254. doi:10.1016/j.tibs.2016.10.004
38. Zahid A, Li B, Kombe AJK, Jin T, Tao J. Pharmacological Inhibitors of the NLRP3 Inflammasome. Front Immunol. 2019;10:2538. doi:10.3389/fimmu.2019.02538
39. Kelley N, Jeltema D, Duan Y, He Y. The NLRP3 inflammasome: an overview of mechanisms of activation and regulation. Int J Mol Sci. 2019;20(13):3328. doi:10.3390/ijms20133328
40. Hou S, Zhang X, Du H, et al. Silica nanoparticles induce mitochondrial pathway-dependent apoptosis by activating unfolded protein response in human neuroblastoma cells. Environ Toxicol. 2021;36(4):675–685. doi:10.1002/tox.23071
41. Li Q, Han X, Lan X, et al. Inhibition of neuronal ferroptosis protects hemorrhagic brain. JCI Insight. 2017;2(7):e90777. doi:10.1172/jci.insight.90777
42. Do Van B, Gouel F, Jonneaux A, et al. Ferroptosis, a newly characterized form of cell death in Parkinson’s disease that is regulated by PKC. Neurobiol Dis. 2016;94:169–178. doi:10.1016/j.nbd.2016.05.011
43. Chen J, Marks E, Lai B, et al. Iron accumulates in Huntington’s disease neurons: protection by deferoxamine. PLoS One. 2013;8(10):e77023. doi:10.1371/journal.pone.0077023
44. Pratico D, Sung S, Polidori MC. Lipid peroxidation and oxidative imbalance: early functional events in Alzheimer’s disease. J Alzheimers Dis. 2004;6(2):171–175. doi:10.3233/jad-2004-6209
45. Skouta R, Dixon SJ, Wang J, et al. Ferrostatins inhibit oxidative lipid damage and cell death in diverse disease models. J Am Chem Soc. 2014;136(12):4551–4556. doi:10.1021/ja411006a
46. Gao M, Monian P, Quadri N, Ramasamy R, Jiang X. Glutaminolysis and transferrin regulate ferroptosis. Mol Cell. 2015;59(2):298–308. doi:10.1016/j.molcel.2015.06.011
47. Linkermann A, Skouta R, Himmerkus N, et al. Synchronized renal tubular cell death involves ferroptosis. Proc Natl Acad Sci U S A. 2014;111(47):16836–16841. doi:10.1073/pnas.1415518111
 © 2022 The Author(s). This work is published and licensed by Dove Medical Press Limited. The full terms of this license are available at https://www.dovepress.com/terms.php and incorporate the Creative Commons Attribution - Non Commercial (unported, v3.0) License.
By accessing the work you hereby accept the Terms. Non-commercial uses of the work are permitted without any further permission from Dove Medical Press Limited, provided the work is properly attributed. For permission for commercial use of this work, please see paragraphs 4.2 and 5 of our Terms.
© 2022 The Author(s). This work is published and licensed by Dove Medical Press Limited. The full terms of this license are available at https://www.dovepress.com/terms.php and incorporate the Creative Commons Attribution - Non Commercial (unported, v3.0) License.
By accessing the work you hereby accept the Terms. Non-commercial uses of the work are permitted without any further permission from Dove Medical Press Limited, provided the work is properly attributed. For permission for commercial use of this work, please see paragraphs 4.2 and 5 of our Terms.