")
Back to Journals » OncoTargets and Therapy » Volume 12
Silencing stomatin-like protein 2 attenuates tumor progression and inflammatory response through repressing CD14 in liver cancer
Authors Pu X, Dong C, Zhu W, Li W, Jiang H
Received 9 May 2019
Accepted for publication 2 August 2019
Published 9 September 2019 Volume 2019:12 Pages 7361—7373
DOI https://doi.org/10.2147/OTT.S215131
Checked for plagiarism Yes
Review by Single anonymous peer review
Peer reviewer comments 3
Editor who approved publication: Dr Federico Perche
Xiaolin Pu,1,* Changqing Dong,2,* Wenyu Zhu1, Wei Li3, Hua Jiang1
1Department of Oncology, Changzhou Second People’s Hospital, Changzhou, Jiangsu Province, People’s Republic of China; 2Department of Thoracic Surgery, Nanjing Chest Hospital, Nanjing City, Jiangsu Province, People’s Republic of China; 3Department of Oncology, Jiangsu Province People’s Hospital, Nanjing, Jiangsu Province, People’s Republic of China
*These authors contributed equally to this work
Correspondence: Hua Jiang
Department of Oncology, Changzhou Second People’s Hospital, No. 29 Xinglong Lane, Tianning District, Changzhou, Jiangsu Province 213004, People’s Republic of China
Tel +86 5 198 810 4931
Email [email protected]
Purpose: Toll-like receptor 4 (TLR4) is involved in the inflammation in liver cancer. High-expressed stomatin-like protein 2 (SLP-2) is commonly reported in many cancer types. This study aims to investigate the functions of SLP-2 in TLR4-mediated inflammatory responses and tumor progression of liver cancer.
Patients and methods: Plasmid transfection technique was applied to silence and overexpress genes. Changes in cell viability and apoptosis were determined by performing cell counting kit-8 assay and flow cytometry. The levels of pro-inflammatory cytokines were determined by ELISA. We further measured the several types of the malignant transformation of SK-Hep1 cells to assess the effects of SLP-2 silencing on the cell migration and invasion, proliferation and angiogenesis of liver cancer in vitro. Western blot and RT-qPCR were performed for expression analysis.
Results: Lipopolysaccharide (LPS) promoted the cell proliferation of SK-Hep1 and production of tumor necrosis factor-α (TNF-α) and IL-6. SLP-2 silencing could inhibit the protein and mRNA levels of CD14 and Cdc42 and subsequently inhibited the levels of TNF-α and IL-6. Overexpressed CD14 not only remarkably reversed the proapoptotic ability of SLP-2 silencing and promoted the expression of Cdc42 and production of TNF-α and IL-6, but also notably reversed the inhibitory effects on the malignant abilities of SK-Hep1 cells by SLP-2 silencing.
Conclusion: SLP-2 silencing could significantly attenuate the inflammatory responses and tumor progression of liver cancer via inhibiting LPS/TLR4 signal transduction through the repression of CD14.
Keywords: liver cancer, stomatin-like protein 2, Toll-like receptor 4, apoptosis, inflammatory response
Introduction
The occurrence and metastasis of certain types of tumors are related to inflammatory reactions.1 Studies have shown that the incidence of liver cancer is positively correlated with the incidence of chronic hepatitis.2,3 Toll-like receptors (TLRs), a type I transmembrane protein, are key factors in the innate immune system. In tumor cells, chronic inflammation mediated by TLRs promotes the survival and metastasis of tumor cells and participates in tumor immune escape mechanism.4,5
Toll-like receptor 4 (TLR4) can recognize lipopolysaccharide (LPS) and produce an inflammatory response.6,7 LPS is the outermost layer of the gram-negative bacterial cell wall. Study suggests that LPS secreted by intestinal microorganisms can arrive at liver tissue through the portal vein,8 causing inflammation and activation of hepatic stellate cells and hepatocytes and contributing to the occurrence of liver cancer.8 Inflammatory response mediated by LPS through TLR4 needs to be through the role of LPS receptor CD14.9
Stomatin-like protein 2 (SLP-2) is a newly discovered member of the stomatin gene superfamily; however, its biological function has not been fully discovered.10 Zhang et al’s identified SLP-2 as an oncogene for the first time.11 In addition, our previous study also found that the downregulation of SLP-2 expression can inhibit cell migration and invasion of human liver cancer by repressing the activation of nuclear factor kappa B (NF-kB) signaling,12 suggesting that SLP-2 plays a potential role in the metastasis of liver cancer. A recent study found that SLP-2 has a regulatory effect on TLR4;13 however, data on whether SLP-2 was involved in liver cancer progression through regulating TLR4 expression are still limited. Previous studies have reported the function of SLP-2 in several cancers;14–16 however, different cancer cells have different tumor heterogeneities,17 and the relations among SLP-2, TLR signaling and liver cancer were still unknown. Therefore, this study aims to investigate the functions of SLP-2 in TLR4-mediated inflammatory responses and tumor progression of liver cancer.
Materials and methods
Cell culture and transfection
The human normal liver cell THLE-2 and human liver cancer cell lines SK-Hep1, PLC/PRF/5, Hep3B, SUN-182 were purchased from American Type Culture Collection (Manassas, VA). The cells were cultured in DMEM containing 10% fetal bovine serum (FBS) and 1% penicillin-streptomycin in an incubator at 37°C in 5% CO2. SiSLP-2 was purchased from GenePharma (China) and the cell transfection was performed by LipofectamineTM 2000 (Invitrogen, Carlsbad, CA). The wild-type CD14 coding sequence was subcloned into pcDNA3.1 (Sangon Biotech, China) to construct a pcDNA-CD14 expression vector. CD14 transfections were performed using LipofectamineTM 2000. The empty plasmid served as a control.
Cell counting kit-8 (CCK-8) assay
CCK-8 assay (Tongren, Japan) was performed to determine cell viability. The cells were seeded into 24-well plates (1×10⁴ cells/well) at 37°C in 5% CO2, and CCK-8 reagent was then added into each well and incubated with the cells for 4 hrs. OD was determined by a microplate reader (ELX 800, Bio-Teck, USA) at 450 nm.
Flow cytometry
Cell apoptosis was detected using FITC Annexin V/propidium iodide (PI) apoptosis detection kit (Invitrogen) on a flow cytometer (Becton Dickerson, CA, USA). The cells were resuspended in 1X annexin-binding buffer at a final concentration of 4×10⁵ cells/mL and then incubated with FITC-conjugated Annexin V and PI (5 mg/mL) on ice for 30 mins. The data were analyzed using a flow cytometer.
ELISA
Cell supernatant from each group was used for the measurement of the concentrations of tumor necrosis factor-α (TNF-α) and IL-6 by using commercially available assay kits (Kaiji Biotechnology Co., Ltd., Nanjing, China). The reaction was carried out using enzyme labeling reagent and developers and then terminated by stop solution. OD value of each well was determined by a microplate reader.
Scratch test
The transfected SK-Hep1 cells from different groups were seeded into 6-well plates. A sterile 200-μL pipette tip was used for creating linear scratches on cell monolayers. Images of wounded areas were photographed at 0 and 24 hrs after the scratch and analyzed by Image analysis software (Media Cybernetics, MD, USA).
Transwell assay
A 24-well Transwell chamber (8-µm pore size, Corning Inc., Corning, NY, USA) coated with Matrigel (BD Biosciences, CA, USA) was used for cell invasion detection. Transfected cells were plated on the Transwell chamber (4×10⁵ cells/well) supplemented with 200 μL serum-free medium, and the medium containing 10% FBS was added into the lower chamber as a chemoattractant. After incubation for 24 hrs, the cells invaded into the bottom were then fixed and stained with 0.5% crystal violet and counted under a microscope (magnification 200×; Canon, Inc., Tokyo, Japan).
Gelatin zymography assay
The activities of matrix metalloproteinases (MMPs) were determined using Zymography Gel Kit (Invitrogen) as previously described.18 In brief, the extracted protein was separated on 10% SDS polyacrylamide gels containing 1% gelatin at 4°C. Residual SDS was removed using 2% Triton X-100, and the gels were then cultured with zymogram developing at room temperature for 4 hrs. The protein bands were visualized by 0.5% Coomassie staining and destained by destaining buffer (10% acetic acid and 20% methanol).
Tube-forming assay
Ninety-six-well plate was coated by 50% Matrigel (50 μl/well, BD Biosciences) and maintained at 37°C for 30 mins for solidification. SK-Hep1, 5×10⁴, cells were seeded into the matrix and incubated at 37°C for 6 hrs. The tube structures were visualized under an inverted light microscope (magnification 100×; Olympus Optical Co., Ltd., Tokyo, Japan), and the tube length was calculated using Image J (Media Cybernetics).
Colony-forming unit assay
Colony formation assays were performed using 6-well plates coated with 0.5 mL bottom soft agar mixture (DMEM, 10% FBS, 0.6% soft agar). The cells (1 ×10³) from each group were plated into the 6-well plates containing complete DMEM and 0.3% soft agar. The cells were allowed to grow for 2 weeks. Finally, colonies were stained with 0.5% crystal violet staining solution and counted.
RT-qPCR analysis
The RNAs from each group cell were extracted by CHCl3 (Aladdin, China). cDNA was synthesized by the reverse transcription kit (Takara, Japan), and the reaction parameters were set at 37°C for 15 mins and at 85°C for 15 s. The relative mRNA levels were quantified by the RT-qPCR kit (Takara, Japan). The reaction parameters of RT-qPCR were set at 95°C for 5 mins, followed by 40 cycles of 95°C for 10 s and at 60°C for 30 s. GAPDH served as the internal control. All primers are listed in Table 1. Relative mRNA levels were calculated by the 2−ΔΔCT methods.
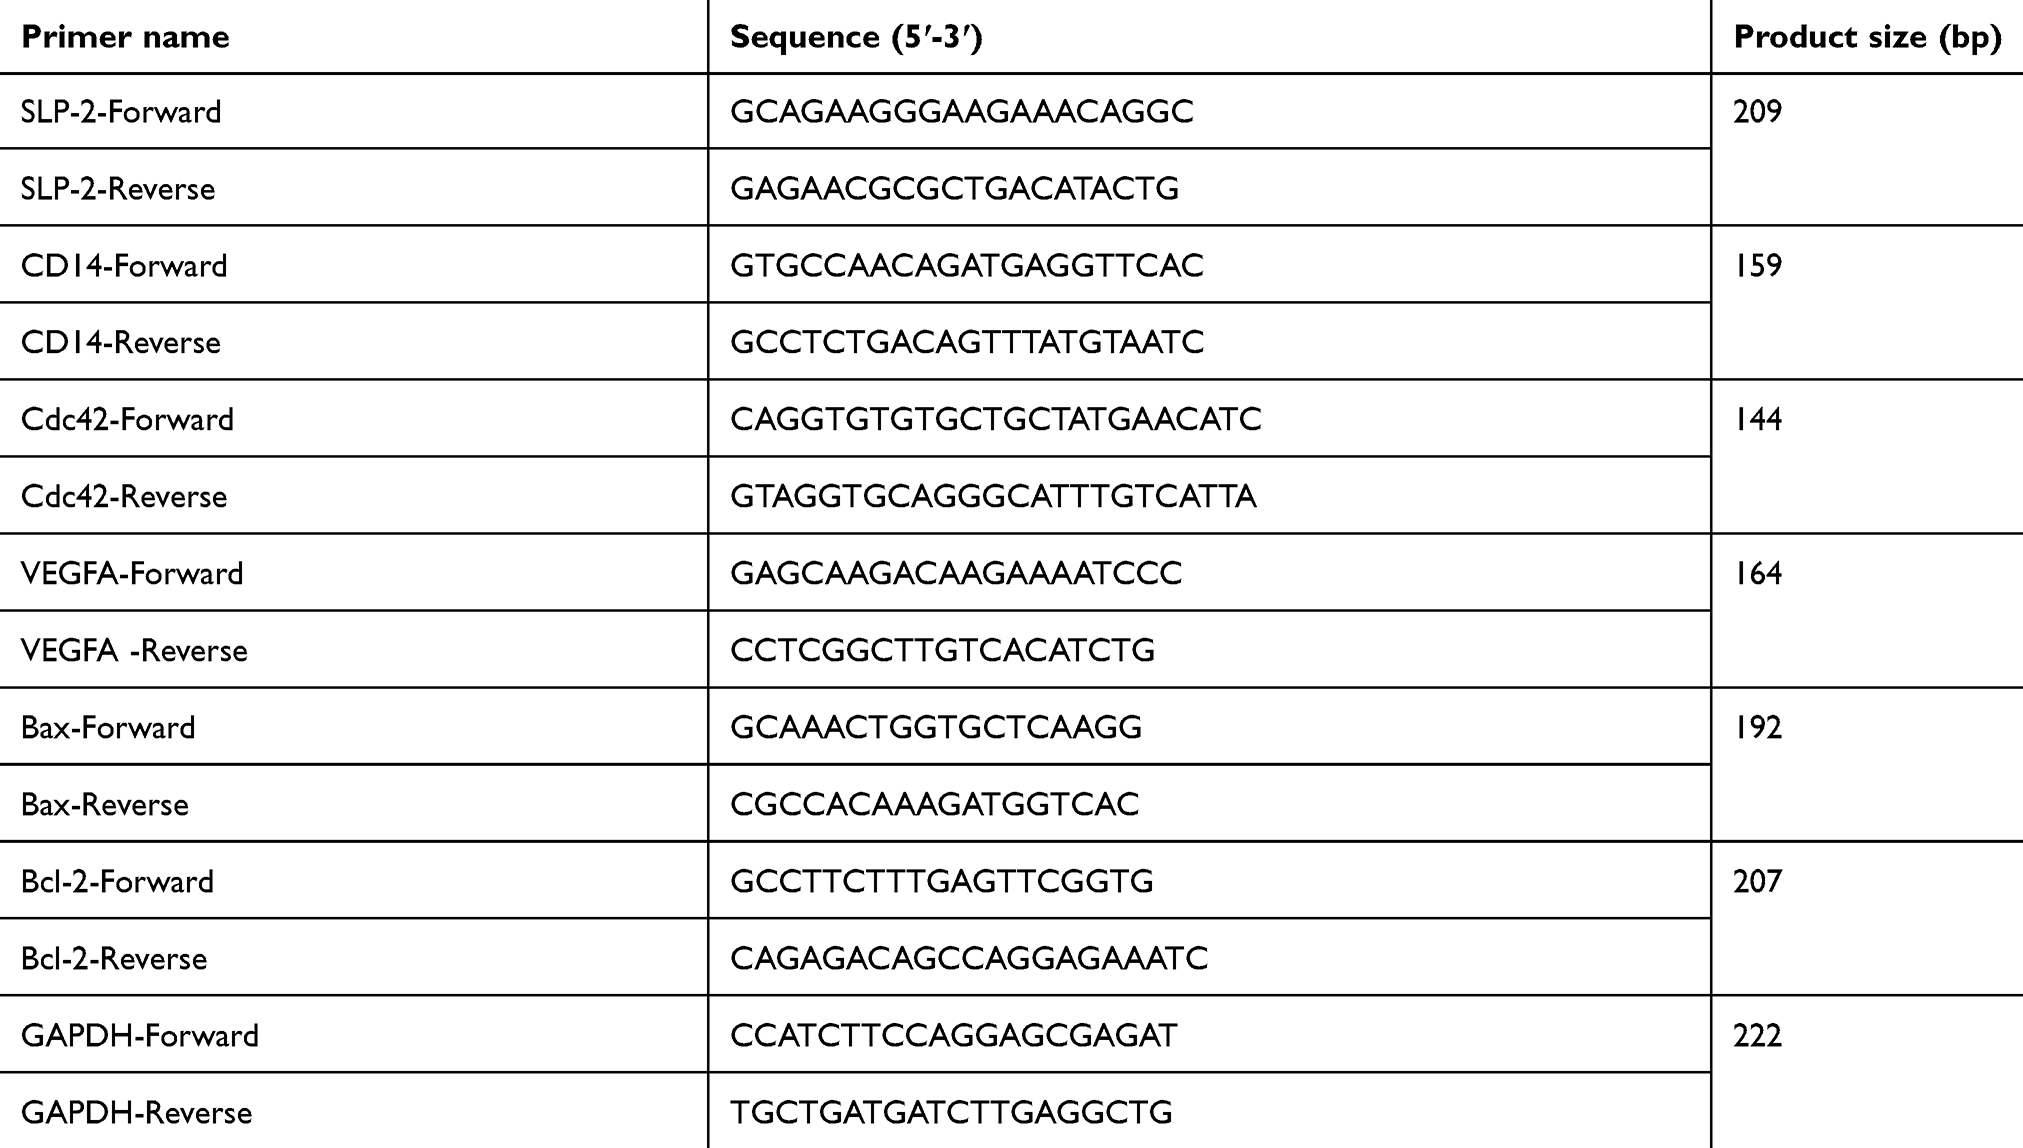 |
Table 1 The sequences of primers |
Western blot
Total protein of cells was lysed with RIPA lysis buffer (Abmole, USA) and then centrifuged at 12,000 rpm at 4°C for 15 mins. SDS-PAGE, 10%, gel was used to separate the protein samples, and the proteins were transferred to the PVDF membrane (Bio-Rad, USA), which was blocked by 5% fat-free milk for 2 hrs at room temperature. The primary antibody was added according to the kit instruction, shaken at room temperature for 2 hrs and then incubated at 4°C for 12 hrs. The secondary antibody (goat anti-mouse IgG, Abcam, ab205719, dilution: 1:2000; goat anti-rabbit IgG, Abcam, ab6721, dilution: 1:8000) was added to the proteins and incubated together at room temperature for 1 hr. Chemiluminescence detection was carried out using ECL reagent (Huiying, Shanghai, China). All primary antibodies (anti-SLP-2 (ab191884, 1:2000), anti-CD14 (ab183322, 1:800), anti-Cdc42 (ab64533, 1:800), anti-vascular endothelial growth factor A (VEGFA, ab1316, 1:1000), anti-Bax (ab32503, 1:1000), anti-B-cell lymphoma 2 (Bcl-2, ab59348, 1:1000), and anti-GAPDH (ab8245, 1:1000)) used in this study were purchased from Abcam.
Statistical analysis
Data were shown as mean ± SD. One-way ANOVA following Turkey’s multiple comparisons was carried out to compare the differences among the experimental groups. Kaplan–Meier survival analysis was used to compare differences in survival rates between the two groups. The statistical significance was expressed as P<0.05.
Results
The high expression of SLP-2 in human liver cancer cells
The expressions of SLP-2 in different human liver cell lines were detected, and the results showed that in human liver cancer cell lines SK-Hep1, PLC/PRF/5, Hep3B, and SUN-182, the levels of SLP-2 mRNA and protein were higher than that in human normal liver cell THLE-2, and SLP-2 has the highest expression level in SK-Hep1 cell line (Figure 1A and B). This suggests that SLP-2 was overexpressed in human liver cells, and thus, SK-Hep1 cell line was selected for subsequent experiments.
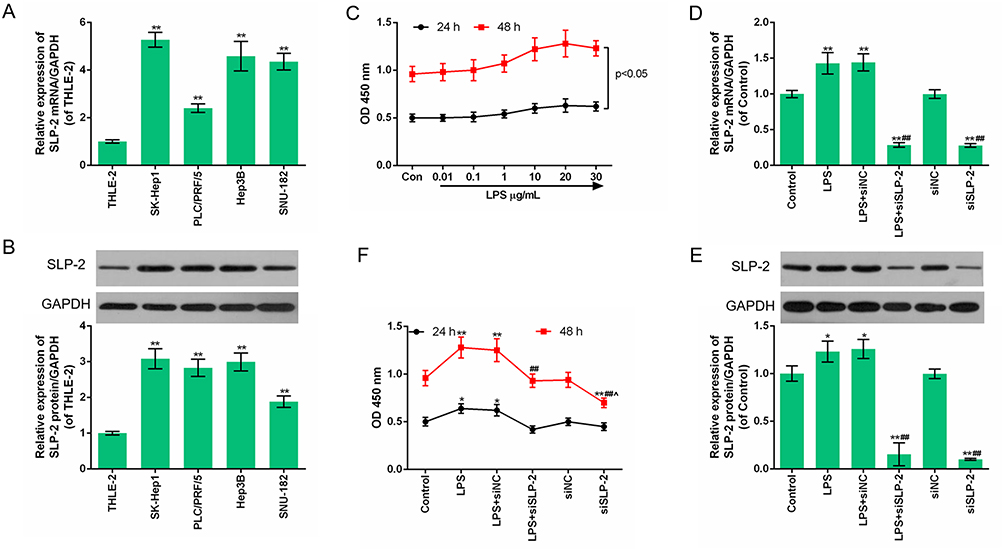 |
Figure 1 High expression of SLP-2 in human liver cancer cells and downregulation of SLP-2 inhibits the increase cell viability of LPS-treated SK-Hep1 cell. (A and B) The SLP-2 protein and mRNA levels in liver cancer cell lines were higher than those in normal human liver cells. **P<0.01, versus THLE-2. (C) LPS promoted the growth of SK-Hep1 cells. (D-F) SLP-2 silencing could inhibit the SLP-2 expression with or without LPS treatment. *P<0.05, **P<0.01, versus control group; ##P<0.01, versus LPS group; ^P<0.05, versus LPS+siSLP-2 group. |
The downregulation of SLP-2 inhibits the increased cell viability of LPS-treated SK-Hep1 cell
The results showed that with the passage of time and cell proliferation, the OD value increased with the increase of LPS concentration, and the OD value was the highest 48 hrs after exposure to 20 μg/mL LPS (Figure 1C), suggesting that LPS could promote SK-Hep1 cell growth. The following experimental groups were constructed in order to study the effect of LPS on SLP-2 gene expression in SK-Hep1 cell: control group, LPS group (cells cultured for 48 hrs under 20 μg/mL LPS), siNC group (cells transfected with siRNA), LPS+siNC group (cells transfected with empty plasmids followed by LPS treatment), and LPS+siSLP-2 group (cells transfected with siSLP-2 plasmids followed by LPS treatment). The results showed that LPS promoted the mRNA (Figure 1D) and protein expressions (Figure 1E) of SLP-2 and increased cell viability (Figure 1F); however, siSLP-2 inhibited SLP-2 expression and reduced cell viability. When cells were transfected with siSLP-2 plasmids after LPS treatment, the expression of SLP-2 and the cell viability decreased significantly compared with LPS treatment alone.
The downregulation of SLP-2 accelerates the reduction of LPS-treated SK-Hep1 cell apoptosis
To investigate the effects of LPS and SLP-2 on apoptosis in SK-Hep1 cells, the apoptosis rates in the 6 groups were determined by flow cytometry. The results showed that the apoptosis rate of siSLP-2 group was higher than that in other groups, while LPS did not significantly affect cell apoptosis. The apoptosis rate of siSLP-2 group was higher than that in LPS+iSLP-2 group (Figure 2A and B). This suggested that the downregulation of SLP-2 could increase SK-Hep1 cell apoptosis by LPS treatment.
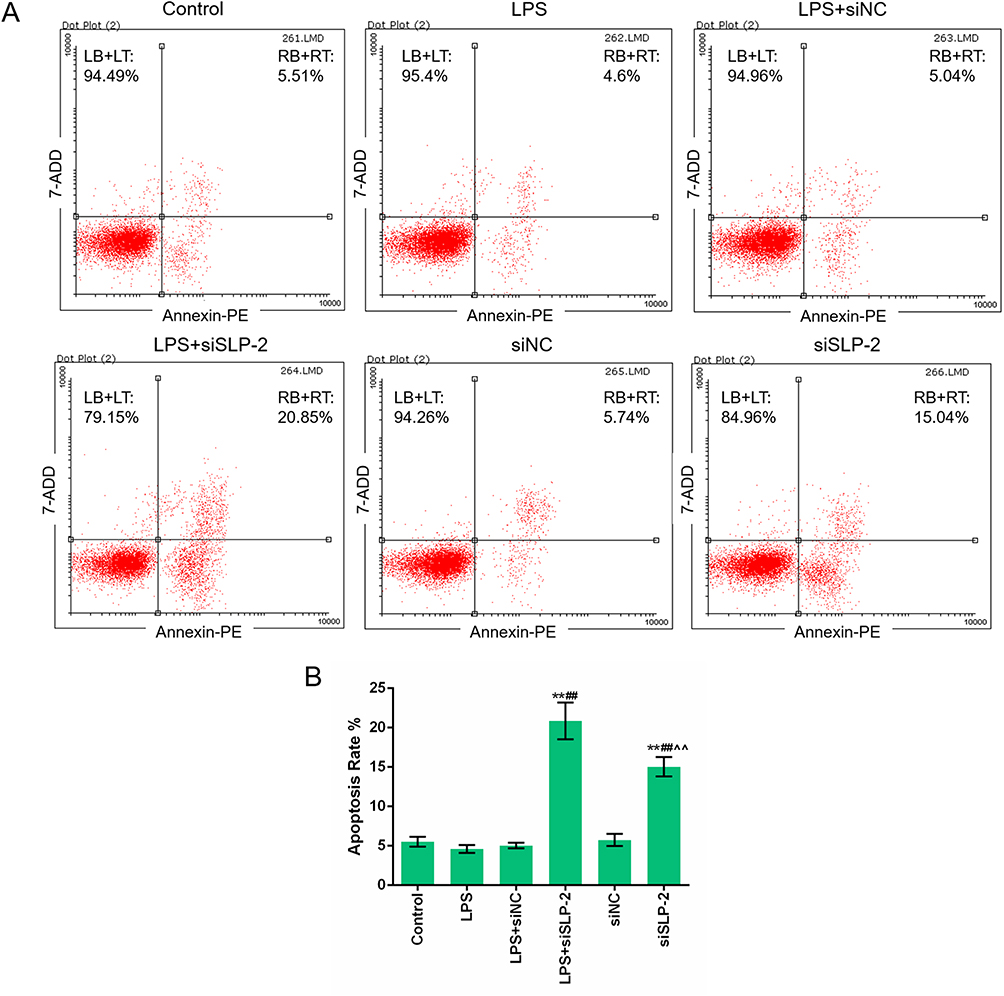 |
Figure 2 The downregulation of SLP-2 partially reverses the suppression effect of LPS on cell apoptosis in SK-Hep1 cell. (A and B) Silencing SLP-2 gene promoted apoptosis of SK-Hep1 cells. The presence of LPS inhibited the proapoptotic effects of SLP-2 gene silencing. **P<0.01, versus control group; ##P<0.01, versus LPS group; ^^P<0.01, versus LPS+siSLP-2 group. |
The regulatory effect of SLP-2 inhibition on the expressions of CD14, Cdc42, TNF-α, and IL-6 in LPS-treated SK-Hep1 cell
To further investigate the regulatory function of SK-Hep1 cell through SLP-2 gene, the mRNA and protein expression levels of CD14 and Cdc42 were determined by Western blot and RT-qPCR, respectively. TNF-α and IL-6 were detected using ELISA. The results showed that LPS did not affect the levels of CD14 protein and mRNA, while the downregulation of SLP-2 inhibited the expression of CD14. LPS promoted Cdc42 expression and SLP-2 inhibition inhibited Cdc42 expression under the condition of both siSLP-2 treatment alone and LPS + siSLP-2 (Figure 3A–D). LPS could promote the secretion of TNF-α and IL-6 in SK-Hep1 cells, while the downregulation of SLP-2 could decrease the levels of TNF-α and IL-6 both in siSLP-2 treatment alone and in LPS + siSLP-2 (Figure 3E and F). This suggested that the proapoptotic effect of silencing SLP-2 is possibly achieved by downregulating the levels of TNF-α and IL-6, which might be related to an inflammatory response.
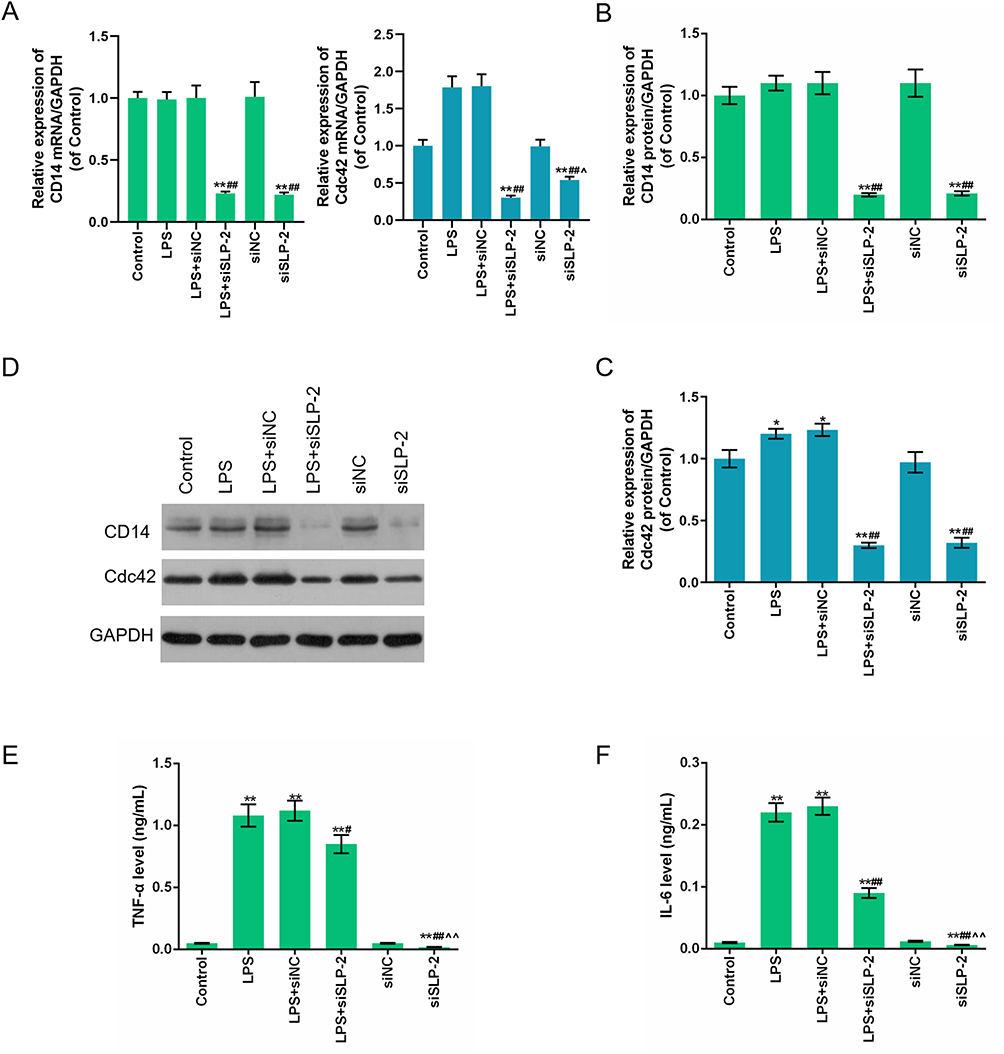 |
Figure 3 The regulatory effect of SLP-2 inhibition on the expressions of CD14, Cdc42, TNF-α, and IL-6 in LPS-treated SK-Hep1 cell. (A – D) LPS had no significant effects on the expression of the CD14 gene. Silencing SLP-2 gene downregulated the protein and mRNA levels of CD14. LPS promoted the expression of Cdc42 protein and mRNA, while SLP-2 silencing suppressed its expression. (E and F) LPS promoted the expressions of TNF-α and IL-6, while SLP-2 gene silencing inhibited its expression. *P<0.05, **P<0.01, versus control group; #P<0.05, ##P<0.01, versus LPS group; ^P<0.05, ^^P<0.01, versus LPS+siSLP-2 group. |
CD14 overexpression partially reverses the effects of SLP-2 inhibition on cell viability and apoptosis in LPS-treated SK-Hep1 cell
CD14 cooperates with other proteins to mediate the innate immune response to lipopolysaccharide. Above experiments demonstrated that the cellular function of siSLP-2 in SK-Hep1 cell might be associated to an inflammatory response. Therefore, the regulatory effects of CD14 overexpression in combination with siSLP-2 in LPS-treated SK-Hep1 cell on cell viability and apoptosis were investigated and the following experimental groups were separately constructed: control group, NC group, CD14 group (cells transfected with the CD14 overexpression plasmid), LPS+siNC group, LPS+siSLP-2 group, LPS+CD14 group (cells transfected with CD14 overexpression plasmid and cultured with 20 μg/mL LPS), and LPS+siSLP-2+CD14 group (cells transfected with siSLP-2 plasmids and CD14 overexpression plasmid and cultured with LPS). The results showed that the OD value in CD14 group was higher than that in control group and NC group, while OD value in LPS+CD14 group was higher than that in LPS+siNC group, and OD value in LPS+siSLP-2+CD14 group was higher than that in LPS+siSLP-2 group (Figure 4A). This suggested that the promotive effect of CD14 overexpression on the growth of SK-Hep1 cells was more significant in the presence of LPS treatment than without. Moreover, CD14 overexpression partially reverses the decreased viability of SLP-2 inhibition in LPS-treated SK-Hep1 cell. The results also showed that the apoptosis rate in LPS+siSLP-2+CD14 group was lower than that in LPS+siSLP-2 group but higher than that in LPS+CD14 group (Figure 4B and C), suggesting that overexpression of CD14 had the effect of inhibiting apoptosis and reversing the proapoptotic effects of causing low-expressed SLP-2 in LPS-treated SK-Hep1 cell. Then, the mRNA and protein expressions of SLP-2, CD14, and Cdc42 and TNF-α and IL-6 levels were detected by RT-qPCR, Western blot, and ELISA, and the results showed that CD14 overexpression did not affect the SLP-2 levels in SK-Hep1 cell but significantly increased the expression of SLP-2 with LPS treatment. Meanwhile, CD14 overexpression also did not affect the expression level of SLP-2 compared with LPS + siSLP-2 group (Figure 5A, D and E). For CD14, LPS did not affect the mRNA and protein levels of CD14, while silencing SLP-2 gene downregulated the expression of CD14 in LPS-treated cell. Additionally, CD14 overexpression partially reversed the regulatory effect of SLP-2 inhibition on decreasing the expression of CD14 in LPS-treated SK-Hep1 cell (Figure 5B, D and F). Above results indicated that CD14 level could be regulated by SLP-2. For Cdc42, TNF-α, and IL-6, we found that CD14 overexpression treatment alone could increase the expressions of Cdc42, TNF-α, and IL-6 and slightly increase the expressions of Cdc42 and TNF-α. However, the levels of the three factors were upregulated when CD14 overexpression was in combination with LPS. Moreover, CD14 overexpression partially reversed the regulatory effect of SLP-2 inhibition on decreased expressions of Cdc42, TNF-α, and IL-6 in LPS-treated SK-Hep1 cell (Figure 5C–I). Above results suggest that silencing SLP-2 could inhibit the inflammatory response in LPS-treated SK-Hep1 cell through regulating CD14 expression.
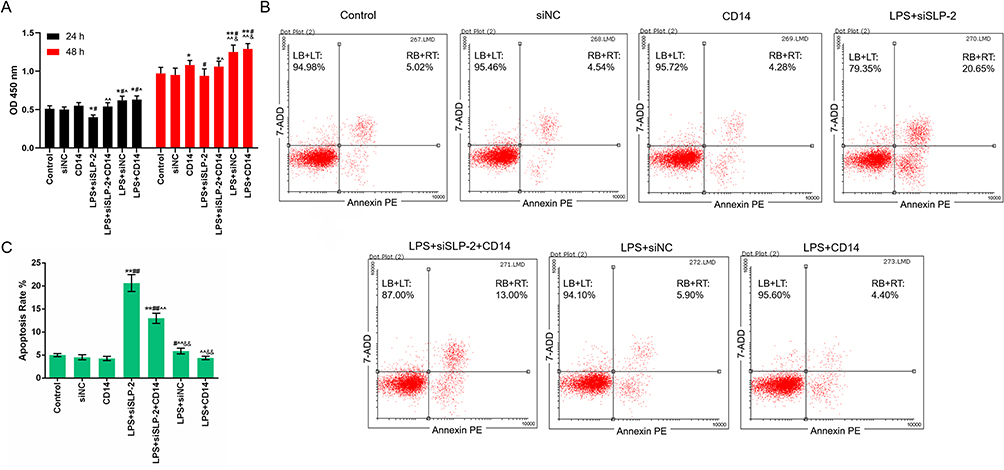 |
Figure 4 CD14 overexpression partially reverses the effects of SLP-2 inhibition on cell apoptosis and viability in LPS-treated SK-Hep1 cell. (A) Overexpression of CD14 gene promoted the growth of SK-Hep1 cells and reduced the inhibitory effect of SLP-2 gene silencing on SK-Hep1 cells. (B and C) CD14 gene overexpression had no significant effect on the apoptosis rate of SK-Hep1 cells. However, the CD14 gene overexpression inhibited the pro apoptotic effects of SLP-2 gene silencing on cells. *P<0.05, **P<0.01, versus control group or siNC group; #P<0.05, ##P<0.01, versus CD14 group; ^P<0.05, ^^P<0.01, versus LPS+siSLP-2 group; &P<0.05, &&P<0.01, versus LPS+siSLP-2+CD14 group. |
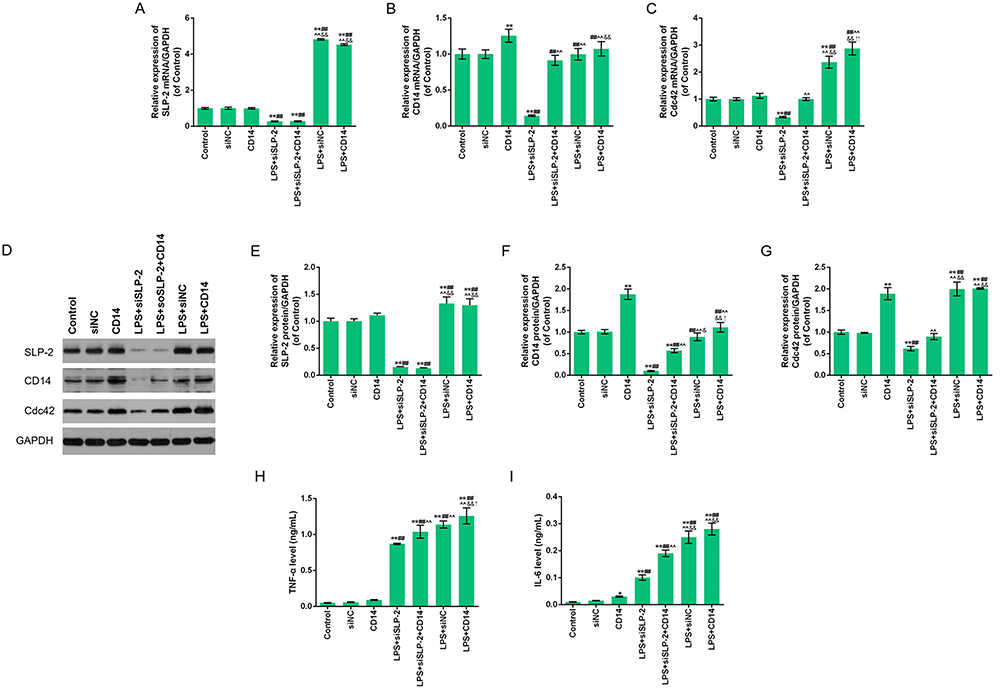 |
Figure 5 Expression levels of SLP-2, CD14, and Cdc42 genes and TNF-α and IL-6 in different groups CD14 overexpression partially reverse the effects of SLP-2 inhibition on the expressions of SLP-2, CD14, Cdc42, TNF-α, and IL-6 in LPS-treated SK-Hep1 cell. (A – C) mRNA levels of SLP-2, CD14, and Cdc42 were determined using RT-qPCR. (D–G) Protein levels of SLP-2, CD14 and Cdc42 were determined using Western blot. GAPDH was used as an internal control. (H and I) TNF-α and IL-6 levels were detected by enzyme-linked immunosorbent assay. *P<0.05, **P<0.01, versus control group or siNC group; ##P<0.01, versus CD14 group; ^^P<0.01, versus LPS+siSLP-2 group; &P<0.05, &&P<0.01, versus LPS+siSLP-2+CD14 group; !P<0.05, !!P<0.01, versus LPS+siNC group. |
CD14 overexpression partially reverses the inhibitory effects of SLP-2 inhibition on migration and invasion in LPS-treated SK-Hep1 cell
To further verify the role of CD14 overexpression in SLP-2 inhibition on suppressing the liver cancer, the migration and invasion of the cells were determined, and we found that CD14 overexpression could significantly promote the migration (Figure 6A and B) and invasion (Figure 6C and D) with or without LPS treatment. SLP-2 silencing could effectively inhibit the promoting effects on cell migration and invasion in LPS-treated SK-Hep1 cell. CD14 overexpression could significantly reverse the inhibitory effects of SLP-2 on migration and invasion abilities of LPS-treated SK-Hep1 cells. Furthermore, we measured the changes in the activities of MMP-2 and MMP-9 under the combined effects of SLP-2 silencing, LPS treatment, and CD14 overexpression; our data observed that LPS treatment and CD14 overexpression treatment alone as well as the two in combination could notably promote the activities of MMP-2 and MMP-9 in SK-Hep1 cells. However, the transfection of siSLP-2 greatly inhibited the activities of MMP-2 and MMP-9 in LPS-treated cell; however, CD14 overexpression partially reversed the inhibitory effects of SLP-2 silencing on the MMP-2 and MMP-9 activities in LPS-treated SK-Hep1 cell (Figure 7A and B)
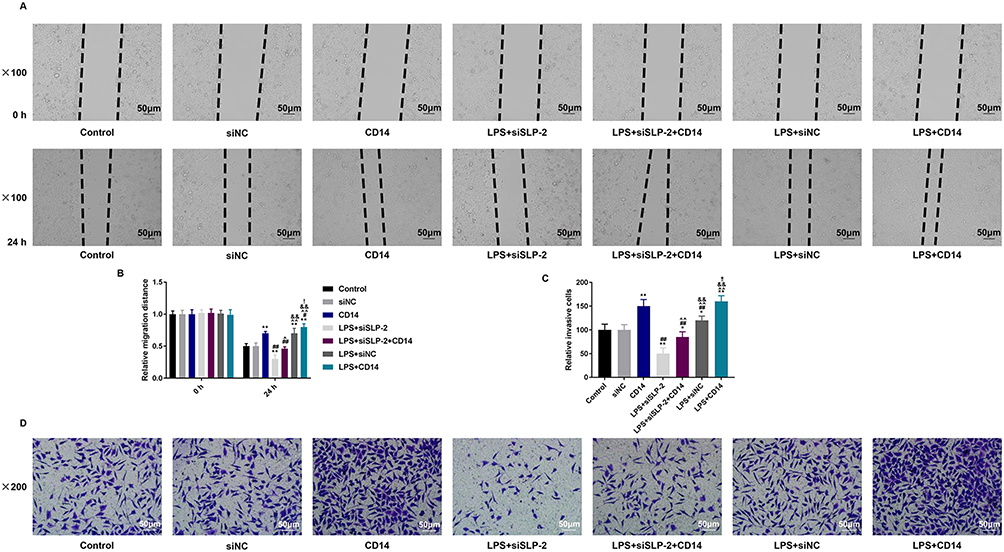 |
Figure 6 CD14 overexpression partially reverses the inhibitory effects of SLP-2 inhibition on migration and invasion in LPS-treated SK-Hep1 cell. The migration and invasion of SK-Hep1 cells under the effects of SLP-2 silencing, LPS treatment, and CD14 overexpression by scratch test and Transwell assay. (A and B) SLP-2 silencing could notably inhibit the promoting effects on cell migration of SK-Hep1 cells by LPS treatment and CD14 overexpression (magnification 100×). (C and D) Silencing SLP-2 could notably inhibit the promoting effects on cell invasion of SK-Hep1 cells by LPS treatment and CD14 overexpression (magnification 200×). *P<0.05, **P<0.01, versus control group or siNC group; #P<0.05, ##P<0.01, versus CD14 group; ^P<0.05, ^^P<0.01, versus LPS+siSLP-2 group; &&P<0.01, versus LPS+siSLP-2+CD14 group; !P<0.05, !!P<0.01, versus LPS+siNC group. |
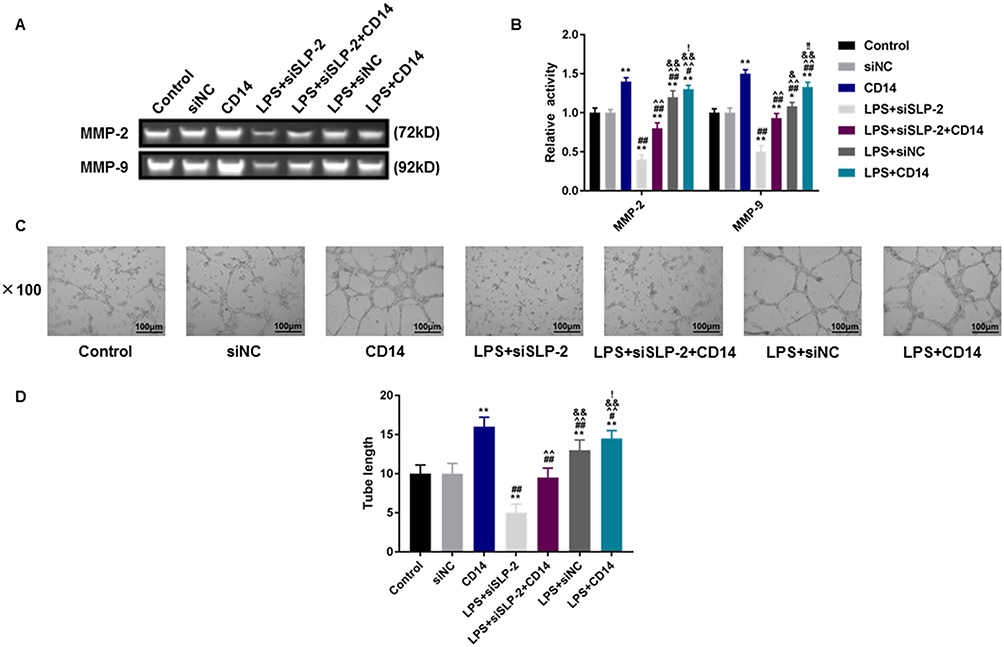 |
Figure 7 The effects of SLP-2 and CD14 on the MMP-2 and MMP-9 enzyme activities and angiogenesis in SK-Hep1 cells. We measured the changes in MMP activity and angiogenesis capacity of SK-Hep1 cells. (A and B) SLP-2 inhibition could significantly inhibit the positive effects on MMP-2 and MMP-9 enzyme activities in SK-Hep1 cells by LPS treatment and CD14 overexpression. (C and D) SLP-2 inhibition could notably reduce the positive effects on the number of tubes formed in SK-Hep1 cells by LPS treatment and CD14 overexpression (magnification 100×). *P<0.05, **P<0.01, versus control group or siNC group; #P<0.05, ##P<0.01, versus CD14 group; ^^P<0.01, versus LPS+siSLP-2 group; &P<0.05, &&P<0.01, versus LPS+siSLP-2+CD14 group; !P<0.05, !!P<0.01, versus LPS+siNC group. |
CD14 overexpression partially reverses the inhibitory effects of SLP-2 silencing on angiogenesis and proliferation in LPS-treated SK-Hep1 cell
Angiogenesis in vitro is also a key indicator for tumor cell development. The tube-forming test demonstrated that inhibiting SLP-2 could also significantly reduce the tube number and even under the combined effects of LPS treatment and CD14 overexpression (P<0.01, Figure 7C and D). Therefore, CD14 overexpression could notably abolish decreased angiogenesis ability induced by SLP-2 silencing in LPS-treated SK-Hep1 cell. We additionally examined the effects of SLP-2 silencing on the cell proliferation of SK-Hep1 cells by colony-forming unit assay. Our data showed that the number of cell units increased notably in the CD14 and was the most abundant in LPS + CD14 groups, compared with that in control group (P<0.01). However, the inhibition of SLP-2 could markedly suppress the colony formation of SK-Hep1 and even under the combined effects of LPS treatment and CD14 overexpression (P<0.01, Figure 8A and B).
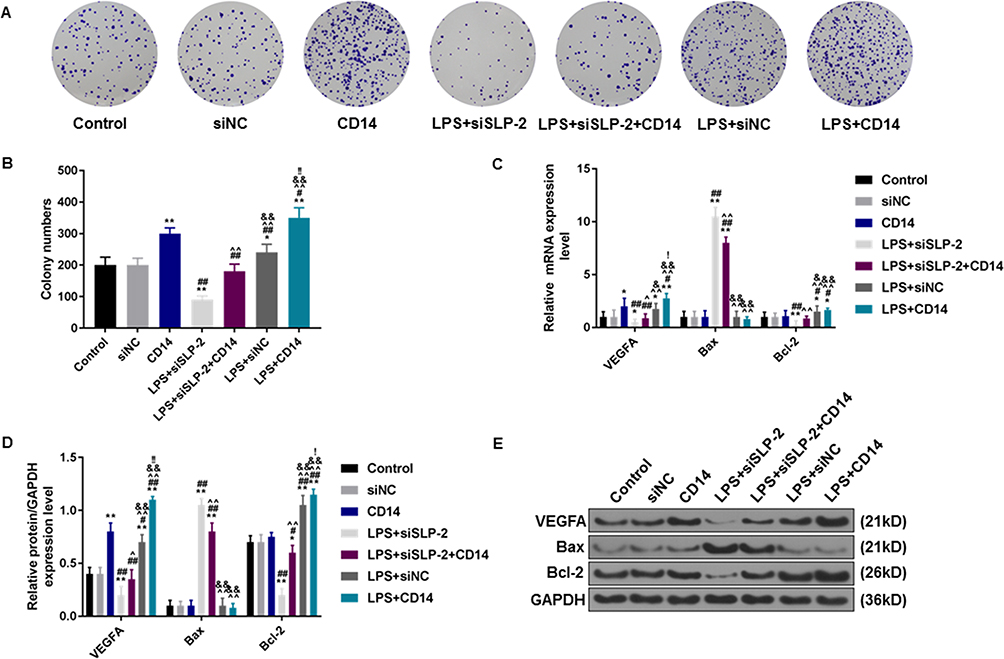 |
Figure 8 The effects of SLP-2 and CD14 on the cell proliferation and the expressions of angiogenesis-related and apoptotic factors in SK-Hep1 cells. (A and B) The transfection of siSLP-2 could notably inhibit the promoting effects on cell proliferation by LPS treatment and CD14 overexpression. (C – E) SLP-2 inhibition could effectively abolish the effects of LPC and CD14 overexpression on the expressions of VEGFA, Bax, and Bcl-2 in SK-Hep1 cells. *P<0.05, **P<0.01, versus control group or siNC group; #P<0.05, ##P<0.01, versus CD14 group; ^P<0.05, ^^P<0.01, versus LPS+siSLP-2 group; &P<0.05, &&P<0.01, versus LPS+siSLP-2+CD14 group; !P<0.05, !!P<0.01, versus LPS+siNC group. |
CD14 overexpression partially reverses the effects of SLP-2 silencing on the expressions of angiogenesis-related and apoptotic factors in LPS-treated SK-Hep1 cell
We further measured the changes in the expressions of angiogenesis-related and apoptotic factors in the SK-Hep1 cells in each group. The mRNA and protein levels of VEGFA increased significantly in the CD14 and LPS + siNC groups and were the highest in the LPS + CD14 group. The transfection of siSLP-2 could significantly downregulate the increased mRNA and protein levels of VEGFA in LPS + siNC and LPS + CD14 groups, while the overexpressed CD14 effectively reversed the effects of silencing SLP-2 on the VEGFA expression in LPS-treated SK-Hep1 cell (Figure 8C–E). SLP-2 silencing had a potent inhibition on the effects on Bax expression under LPS treatment; however, CD14 overexpression could remarkably reverse the promoting effects of SLP-2 silencing on the expression of Bax in LPS-treated SK-Hep1 cells. Bcl-2 mRNA and protein levels showed opposite results to that of Bax expression.
Discussion
Located in HSA chromosome 9p13.1, SLP-2 gene belongs to the superfamily of stomatin genes and consists of 10 exons and 9 introns.19 Studies found that stomatin and its family members participate in the occurrence of malignant tumors, and that SLP-2 is overexpressed in choriocarcinoma placental cells, ovarian cancer, and cervical cancer; however, research on SLP-2 in liver cancer is rarely conducted.20–22 We found for the first time that inhibiting the expression of SLP-2 gene in liver cancer cells could inhibit NF-kB, reduce the inflammatory response, and downregulate the expression levels of MMP-2 and MMP-9 and therefore inhibit the migration and invasion of liver cancer cells.23 The purpose of this study was to investigate the effect of SLP-2 on liver cancer cells, and the data showed that the expression level of SLP-2 gene in liver cancer cells was higher than that in human normal liver cells, suggesting that SLP-2 is possibly involved in the growth of hepatoma cells.
Studies have confirmed that the proliferation, apoptosis, migration, and invasion of liver cancer cells are related to TLR4.24,25 TLR4 can mediate inflammatory reactions through binding to LPS.26,27 The results of this study showed that LPS promotes the malignant ability of SK-Hep1 cells, and the inhibition of SLP-2 notably suppresses the malignant ability of SK-Hep1 cells and even under the combined effects of LPS treatment and CD14 overexpression. To further explore the role of SLP-2 gene in liver cancer cells, we investigated the effects of LPS and SLP-2 genes on apoptosis, CD14, cell division cycle 42 (Cdc42) mRNA and protein levels, as well as the expressions of TNF-α and IL-6. The results showed that LPS did not affect the apoptosis of SK-Hep1 cells, while silencing of SLP-2 gene promoted apoptosis. Moreover, the downregulation of SLP-2 gene expression inhibited the expression of CD14 and Cdc42 protein and mRNA and limit the release of TNF-α and IL-6. Cdc42 is a family member of the Rho GTP enzyme,28 and overexpressed Cdc42 promotes the malignant transformation of cells by altering the metabolization of cells and may participate in the development of tumors by regulating downstream factors.29,30 TLR4 not only promotes the development of the tumor but also causes chronic inflammation,31–33 and this suggests that silencing SLP-2 could not only induce cell apoptosis of liver cancer cells, inhibit the expression of Cdc42 gene and cell proliferation and growth, but also could inhibit the expression of inflammatory mediators, indicating that the inhibition of SLP-2 gene had an inhibitory effect on liver cancer cells, and that SLP-2 was involved in the development of liver cancer cells viaTLR4-related pathway.
To further study the mechanism of SLP-2 gene affecting liver cancer cells, we investigated the effects of CD14 on liver cancer cells. The CD14 gene is located on the long arm of human chromosome 5 and has approximately 1338 nucleotide residues.34 CD14 is the most important and most affinity receptors binding to LPS, and it is also an important mediator in controlling endotoxins on non-myeloid cells.35 The combination of CD14 and LPS forms a triple complex of CD14-LPS-LPS-binding protein, which in turn activates TLR4 signaling.36,37 CD14 is highly important for the conduction of this signal, and previous studies found that anti-CD14 antibody can block the effect of LPS.38 The results of this study showed that the upregulation of CD14 expression had no significant effect on the apoptosis of SK-Hep1 cells or the expression level of Cdc42 gene. However, in the liver cancer cells transfected with siSLP-2, the overexpression of CD14 could decrease the apoptosis rate of liver cancer cells and upregulate the expression of Cdc42. In addition, the detection of cell migratory and invasive, proliferative and angiogenic abilities of SK-Hep1 cells demonstrated that overexpression of CD14 could significantly reverse the suppressive effects of siSLP-2 on the malignant abilities of liver cancer cells, suggesting that the suppressive effects of SLP-2 silencing on the development of liver cancer were highly associated with the suppression of CD14.
To further investigate the relationship between SLP-2 gene and CD14 gene, we determined the effects of SLP-2 gene on the expressions of inflammatory-related factors. The results showed that overexpressed CD14 had no significant effect on the expressions of TNF-α and IL-6; however, it upregulated the levels of TNF-α and IL-6 in SK-Hep1 cells in the presence of LPS. This showed that the expression of the CD14 gene does not affect TLR4 and its pathway; however, it enhances the effect of LPS on liver cancer cells by the inflammatory response. After silencing the SLP-2 gene, we found that silencing of SLP-2 inhibited the expression of CD14 and the transduction of LPS/TLR4 signaling and inflammatory response by downregulating the expression of CD14.
The current study is the first to investigate SLP-2 on the progression regulation of liver cancer by inflammatory response via LPS/TLR4 signaling. However, there are still some limitations, for example, we focus on the regulation of CD14 but neglected the function of Cdc42, and a series of experiments on CD14 overexpression were conducted, while CD14 knockdown was not included. Therefore, an in-depth investigation involved in above mentioned limitations experiments should be carried out in future study.
Conclusion
In conclusion, our study indicated that SLP-2 could regulate the LPS/TLR4 signal transduction via CD14. Importantly, silencing SLP-2 gene could significantly suppress malignant abilities of liver cancer cells, and the suppressive effects might be attributed to the repression of CD14 gene, which could inhibit LPS/TLR4 signaling and reduce the inflammatory response.
Acknowledgment
This work was supported by the Changzhou Science and Technology Bureau Social Development Project [CE20175025].
Disclosure
The authors report no conflicts of interest in this work.
References
1. Wang D, DuBois RN. Immunosuppression associated with chronic inflammation in the tumor microenvironment. Carcinogenesis. 2015;36(10):1085–1093. doi:10.1093/carcin/bgv123
2. Alzahrani B, Iseli TJ, Hebbard LW. Non-viral causes of liver cancer: does obesity led inflammation play a role? Cancer Lett. 2014;345(2):223–229. doi:10.1016/j.canlet.2013.08.036
3. Shalapour S, Lin XJ, Bastian IN, et al. Inflammation-induced IgA+ cells dismantle anti-liver cancer immunity. Nature. 2017;551(7680):340–345. doi:10.1038/nature24302
4. Zhang X, Xu J, Ke X, et al. Expression and function of Toll-like receptors in peripheral blood mononuclear cells from patients with ovarian cancer. Cancer Immunol Immunother. 2015;64(3):275–286. doi:10.1007/s00262-014-1632-x
5. Tan Y, Zanoni I, Cullen TW, Goodman AL, Kagan JC. Mechanisms of Toll-like receptor 4 endocytosis reveal a common immune-evasion strategy used by pathogenic and commensal bacteria. Immunity. 2015;43(5):909–922. doi:10.1016/j.immuni.2015.10.008
6. Peri F, Piazza M. Therapeutic targeting of innate immunity with Toll-like receptor 4 (TLR4) antagonists. Biotechnol Adv. 2012;30(1):251–260. doi:10.1016/j.biotechadv.2011.05.014
7. Hoshino K, Takeuchi O, Kawai T, et al. Pillars article: cutting edge: Toll-like receptor 4 (TLR4)-deficient mice are hyporesponsive to lipopolysaccharide: evidence for TLR4 as the Lps gene product. J Immunol. 1999;162:3749–3752. Journal of immunology (Baltimore, Md: 1950). 2016;197(7):2563–2566.
8. Guo J, Zheng L, Chen L, et al. Lipopolysaccharide activated TLR4/NF-kappaB signaling pathway of fibroblasts from uterine fibroids. Int J Clin Exp Pathol. 2015;8(9):10014–10025.
9. Berbee JF, Coomans CP, Westerterp M, Romijn JA, Havekes LM, Rensen PC. Apolipoprotein CI enhances the biological response to LPS via the CD14/TLR4 pathway by LPS-binding elements in both its N- and C-terminal helix. J Lipid Res. 2010;51(7):1943–1952. doi:10.1194/jlr.M006809
10. Seidel G, Prohaska R. Molecular cloning of hSLP-1, a novel human brain-specific member of the band 7/MEC-2 family similar to Caenorhabditis elegans UNC-24. Gene. 1998;225(1–2):23–29. doi:10.1016/s0378-1119(98)00532-0
11. Zhang L, Ding F, Cao W, et al. Stomatin-like protein 2 is overexpressed in cancer and involved in regulating cell growth and cell adhesion in human esophageal squamous cell carcinoma. Clin Cancer Res. 2006;12(5):1639–1646.
12. Zhang Z, Qin H, Jiang B, et al. miR-30e-5p suppresses cell proliferation and migration in bladder cancer through regulating metadherin. J Cell Biochem. 2019;120:15924–15932.
13. Chowdhury SM, Zhu X, Aloor JJ, et al. Proteomic analysis of ABCA1-null macrophages reveals a role for stomatin-like protein-2 in raft composition and toll-like receptor signaling. Mol Cell Proteomics. 2015;14(7):1859–1870. doi:10.1074/mcp.M114.045179
14. Zhang J, Song X, Li C, Tian Y. Expression and clinical significance of SLP-2 in ovarian tumors. Oncol Lett. 2019;17(5):4626–4632. doi:10.3892/ol.2019.10116
15. Zhou C, Li Y, Wang G, et al. Enhanced SLP-2 promotes invasion and metastasis by regulating Wnt/beta-catenin signal pathway in colorectal cancer and predicts poor prognosis. Pathol Res Pract. 2019;215(1):57–67. doi:10.1016/j.prp.2018.10.018
16. Yang CT, Li JM, Li LF, Ko YS, Chen JT. Stomatin-like protein 2 regulates survivin expression in non-small cell lung cancer cells through beta-catenin signaling pathway. Cell Death Dis. 2018;9(4):425. doi:10.1038/s41419-018-0461-9
17. Prasetyanti PR, Medema JP. Intra-tumor heterogeneity from a cancer stem cell perspective. Mol Cancer. 2017;16(1):41. doi:10.1186/s12943-017-0600-4
18. Long M, Zhan M, Xu S, et al. miR-92b-3p acts as a tumor suppressor by targeting Gabra3 in pancreatic cancer. Mol Cancer. 2017;16(1):167. doi:10.1186/s12943-017-0723-7
19. Wang Y, Morrow JS. Identification and characterization of human SLP-2, a novel homologue of stomatin (band 7.2b) present in erythrocytes and other tissues. J Biol Chem. 2000;275(11):8062–8071. doi:10.1074/jbc.275.11.8062
20. Chen TW, Liu HW, Liou YJ, Lee JH, Lin CH. Over-expression of stomatin causes syncytium formation in nonfusogenic JEG-3 choriocarcinoma placental cells. Cell Biol Int. 2016;40(8):926–933. doi:10.1002/cbin.10636
21. Sun F, Ding W, He JH, Wang XJ, Ma ZB, Li YF. Stomatin-like protein 2 is overexpressed in epithelial ovarian cancer and predicts poor patient survival. BMC Cancer. 2015;15:746. doi:10.1186/s12885-015-1584-3
22. Deng H, Deng Y, Liu F, et al. Stomatin-like protein 2 is overexpressed in cervical cancer and involved in tumor cell apoptosis. Oncol Lett. 2017;14(6):6355–6364. doi:10.3892/ol.2017.7054
23. Zhu W, Li W, Geng Q, et al. Silence of stomatin-like protein 2 represses migration and invasion ability of human liver cancer cells via inhibiting the nuclear factor kappa B (NF-kappaB) pathway. Med Sci Monitor. 2018;24:7625–7632. doi:10.12659/MSM.909156
24. Liu Y, Li T, Xu Y, et al. Effects of TLR4 gene silencing on the proliferation and apotosis of hepatocarcinoma HEPG2 cells. Oncol Lett. 2016;11(5):3054–3060. doi:10.3892/ol.2016.4338
25. Lin A, Wang G, Zhao H, et al. TLR4 signaling promotes a COX-2/PGE2/STAT3 positive feedback loop in hepatocellular carcinoma (HCC) cells. Oncoimmunology. 2016;5(2):e1074376. doi:10.1080/2162402X.2015.1074376
26. Hoshino K, Takeuchi O, Kawai T, et al. Cutting edge: Toll-like receptor 4 (TLR4)-deficient mice are hyporesponsive to lipopolysaccharide: evidence for TLR4 as the Lps gene product. J Immunol. 1999;162(7):3749–3752.
27. Guijarro-Munoz I, Compte M, Alvarez-Cienfuegos A, Alvarez-Vallina L, Sanz L. Lipopolysaccharide activates Toll-like receptor 4 (TLR4)-mediated NF-kappaB signaling pathway and proinflammatory response in human pericytes. J Biol Chem. 2014;289(4):2457–2468. doi:10.1074/jbc.M113.521161
28. Lim GE, Xu M, Sun J, Jin T, Brubaker PL. The rho guanosine 5ʹ-triphosphatase, cell division cycle 42, is required for insulin-induced actin remodeling and glucagon-like peptide-1 secretion in the intestinal endocrine L cell. Endocrinology. 2009;150(12):5249–5261. doi:10.1210/en.2009-0508
29. Wang JB, Erickson JW, Fuji R, et al. Targeting mitochondrial glutaminase activity inhibits oncogenic transformation. Cancer Cell. 2010;18(3):207–219. doi:10.1016/j.ccr.2010.08.009
30. Du DS, Yang XZ, Wang Q, et al. Effects of CDC42 on the proliferation and invasion of gastric cancer cells. Mol Med Rep. 2016;13(1):550–554. doi:10.3892/mmr.2015.4523
31. Li D, Jin Y, Sun Y, Lei J, Liu C. Knockdown of Toll-like receptor 4 inhibits human NSCLC cancer cell growth and inflammatory cytokine secretion in vitro and in vivo. Int J Oncol. 2014;45(2):813–821. doi:10.3892/ijo.2014.2479
32. Roy A, Srivastava M, Saqib U, et al. Potential therapeutic targets for inflammation in Toll-like receptor 4 (TLR4)-mediated signaling pathways. Int Immunopharmacol. 2016;40:79–89. doi:10.1016/j.intimp.2016.08.026
33. Jia L, Vianna CR, Fukuda M, et al. Hepatocyte Toll-like receptor 4 regulates obesity-induced inflammation and insulin resistance. Nat Commun. 2014;5:3878. doi:10.1038/ncomms5972
34. Wright SD, Ramos RA, Tobias PS, Ulevitch RJ, Mathison JC. CD14, a receptor for complexes of lipopolysaccharide (LPS) and LPS binding protein. Science. 1990;249(4975):1431–1433. doi:10.1126/science.1698311
35. Tarassishin L, Suh HS, Lee SC. LPS and IL-1 differentially activate mouse and human astrocytes: role of CD14. Glia. 2014;62(6):999–1013. doi:10.1002/glia.22657
36. Vilades C, Escote X, Lopez-Dupla M, et al. Involvement of the LPS-LPB-CD14-MD2-TLR4 inflammation pathway in HIV-1/HAART-associated lipodystrophy syndrome (HALS). J Antimicrob Chemother. 2014;69(6):1653–1659. doi:10.1093/jac/dku032
37. Klein DC, Skjesol A, Kers-Rebel ED, et al. CD14, TLR4 and TRAM show different trafficking dynamics during LPS stimulation. Traffic. 2015;16(7):677–690. doi:10.1111/tra.12274
38. Kim D, Kim JY. Anti-CD14 antibody reduces LPS responsiveness via TLR4 internalization in human monocytes. Mol Immunol. 2014;57(2):210–215. doi:10.1016/j.molimm.2013.09.009
 © 2019 The Author(s). This work is published and licensed by Dove Medical Press Limited. The full terms of this license are available at https://www.dovepress.com/terms.php and incorporate the Creative Commons Attribution - Non Commercial (unported, v3.0) License.
By accessing the work you hereby accept the Terms. Non-commercial uses of the work are permitted without any further permission from Dove Medical Press Limited, provided the work is properly attributed. For permission for commercial use of this work, please see paragraphs 4.2 and 5 of our Terms.
© 2019 The Author(s). This work is published and licensed by Dove Medical Press Limited. The full terms of this license are available at https://www.dovepress.com/terms.php and incorporate the Creative Commons Attribution - Non Commercial (unported, v3.0) License.
By accessing the work you hereby accept the Terms. Non-commercial uses of the work are permitted without any further permission from Dove Medical Press Limited, provided the work is properly attributed. For permission for commercial use of this work, please see paragraphs 4.2 and 5 of our Terms.