")
Back to Journals » Infection and Drug Resistance » Volume 12
Silencing of OCH1 unveils the role of Sporothrix schenckii N-linked glycans during the host–fungus interaction
Authors Lozoya-Pérez NE, Casas-Flores S, de Almeida JR, Martínez-Álvarez JA , López-Ramírez LA, Jannuzzi GP , Trujillo-Esquivel E, Estrada-Mata E , Almeida SR, Franco B , Lopes-Bezerra LM , Mora-Montes HM
Received 23 August 2018
Accepted for publication 26 November 2018
Published 28 December 2018 Volume 2019:12 Pages 67—85
DOI https://doi.org/10.2147/IDR.S185037
Checked for plagiarism Yes
Review by Single anonymous peer review
Peer reviewer comments 2
Editor who approved publication: Professor Suresh Antony
Nancy E Lozoya-Pérez,1 Sergio Casas-Flores,2 José Roberto Fogaça de Almeida,3 José A Martínez-Álvarez,1 Luz A López-Ramírez,1 Grasielle Pereira Jannuzzi,3 Elías Trujillo-Esquivel,1 Eine Estrada-Mata,1 Sandro R Almeida,3 Bernardo Franco,1 Leila M Lopes-Bezerra,3,4 Héctor M Mora-Montes1
1Department of Biology, Division of Exact and Natural Sciences, Universidad de Guanajuato, Guanajuato, Mexico; 2Division of Molecular Biology, IPICYT, San Luis Potosí, Mexico; 3Laboratory of Clinical Mycology, Faculty of Pharmacy, Universidade de São Paulo, São Paulo, Brazil; 4Laboratory of Cellular Mycology and Proteomics, Universidade do Estado do Rio de Janeiro, Rio de Janeiro, Brazil
Background: Sporothrix schenckii is a neglected fungal pathogen for the human being and other mammals. In several fungal systems, Och1 is a Golgi α1,6-mannosyltransferase with a key function in the synthesis of N-linked glycans; which are important elements during the host-fungus interplay. The role of OCH1 in fungal virulence seems to be species-specific, being an essential component for Candida albicans virulence and dispensable during the interaction of Aspergillus fumigatus with the host.
Methods: Here, we silenced S. schenckii OCH1 and characterized the phenotype of the mutant strains.
Results: The mutant strains did not show defects in the cell or colony morphology, the growth rate or the ability to undergo dimorphism; but the cell wall changed in both composition and exposure of inner components at the surface. When interacting with human monocytes, the silenced strains had a reduced ability to stimulate TNFα and IL-6 but stimulated higher levels of IL-10. The interaction with human macrophages was also altered, with reduced numbers of silenced cells phagocytosed. These strains showed virulence attenuation in both Galleria mellonella and in the mouse model of sporotrichosis. Nonetheless, the cytokine levels in infected organs did not vary significantly when compared with the wild-type strain.
Conclusion: Our data demonstrate that OCH1 silencing affects different aspects of the S. schenckii-host interaction.
Keywords: cell wall, protein glycosylation, sporotrichosis, gene silencing, host–fungus interplay, mannosyltransferase
Introduction
Sporotrichosis is a deep-seated fungal disease caused by the members of the pathogenic clade of the Sporothrix genus.1 Among them, Sporothrix schenckii is the species most often associated with the disease, which was first described as the causative agent of the infection.2,3 S. schenckii is a dimorphic organism that can grow as a conidium-producing mold in the environment or as a yeast-like cell when infecting host tissues or grown at 37°C and in neutral pH.4,5
Thus far, the ability to generate melanin, the adhesive properties, the sensitivity to antifungal drugs, and the cell wall composition and organization are among the most studied fungal traits that affect the S. schenckii–host interaction.3–7 Since the capsule and cell wall are the outer most external fungal structures and therefore are in close contact with the environment, it is expected that these are key determinants in the interaction of the fungal cell with the host components.8,9 The fungal cell wall contains most of the pathogen-associated molecular patterns recognized by pattern recognition receptors expressed by innate immune cells and also works as a molecular scaffold to display various adhesins, hydrolytic enzymes, and other molecules with the ability to affect host cells.9
The S. schenckii cell wall is a bilayered structure that has an external microfibrillar layer and an inner electron-dense layer.10 Chitin and β-1,3-glucan are mostly found in the inner part of the wall,11 whereas data suggest that the fibrillar layer is mainly composed of proteins heavily modified with N-linked and O-linked glycans.10 Even though the precise localization within the cell wall is unknown, structural data indicate that the S. schenckii cell wall also contains β-1,4- and β-1,6-glucans.12
We recently reported that recognition of the three S. schenckii morphologies by human peripheral blood mononuclear cells (PBMCs) critically depends on the interaction of β-1,3-glucan and O-linked glycans with dectin-1 and TLR4, respectively, with a minor contribution for the mannose receptor during cytokine stimulation by yeast-like cells and germlings.11 However, cytokine stimulation by conidia depended on the proper engagement of the mannose receptor with its ligand, most likely N-linked glycans.11 Since both N-linked and O-linked glycans from S. schenckii are thus far identified as mannose- and rhamnose-rich oligosaccharides, they have been commonly named rhamnomannans.3,13 As in other fungal species, N-linked glycans contain an oligosaccharide core that is assembled, transferred to proteins, and trimmed in the lumen of the endoplasmic reticulum,14,15 before trafficking to the Golgi complex where this core is further modified by glycosyltransferases. In organisms in which N-linked glycans are rich in mannose residues, an outer chain of poly-α-1,6-mannose is synthesized and works as a backbone for the further elaboration of lateral glycosidic chains.16–18 In Saccharomyces cerevisiae, Candida albicans, and Aspergillus fumigatus, Och1 is an α-1,6-mannosyltransferase in charge of adding the first α-1,6-mannose unit of the backbone of the N-linked glycan outer chain, and loss of this enzyme blocks the elongation of N-linked glycan.19–21 In C. albicans, loss of this protein has a significant effect on the cell wall structure, the ability to interact with immune cells, and led to virulence attenuation,19,22–24 but interestingly an A. fumigatus och1Δ mutant showed normal ability to stimulate cytokine production in infected murine macrophages, and no virulence attenuation was observed in a murine model of aspergillosis.20 Therefore, it seems that the impact of Och1 on the interaction with the host could be species specific.
In this study, to get insights into the role of N-linked glycans during the S. schenckii-host interaction we silenced OCH1 and characterized the phenotype of mutant cells, with an emphasis in the interaction with human PBMCs and human monocyte-derived macrophages. Moreover, fungal virulence was analyzed in both mice and the alternative model Galleria mellonella.
Materials and methods
Strains and culture media
Fungal strains used in this study are listed in Table 1. Both S. cerevisiae and S. schenckii cells were maintained at 28°C in YPD medium (1% [w/v] yeast extract, 2% [w/v] gelatin peptone, and 3% [w/v] dextrose). S. cerevisiae transformants were selected in SD medium (0.67% [w/v] yeast nitrogen base with ammonium sulfate without amino acids, 2% [w/v] glucose, and 0.077% [w/v] complete supplement mixture minus uracil). For induction of the open reading frames (ORFs) under the control of GAL1 promoter, cells were grown in SD-Gal medium (0.67% [w/v] yeast nitrogen base with ammonium sulfate without amino acids, 2% [w/v] galactose, 3% [w/v] raffinose, and 0.077% [w/v] complete supplement mixture minus uracil).
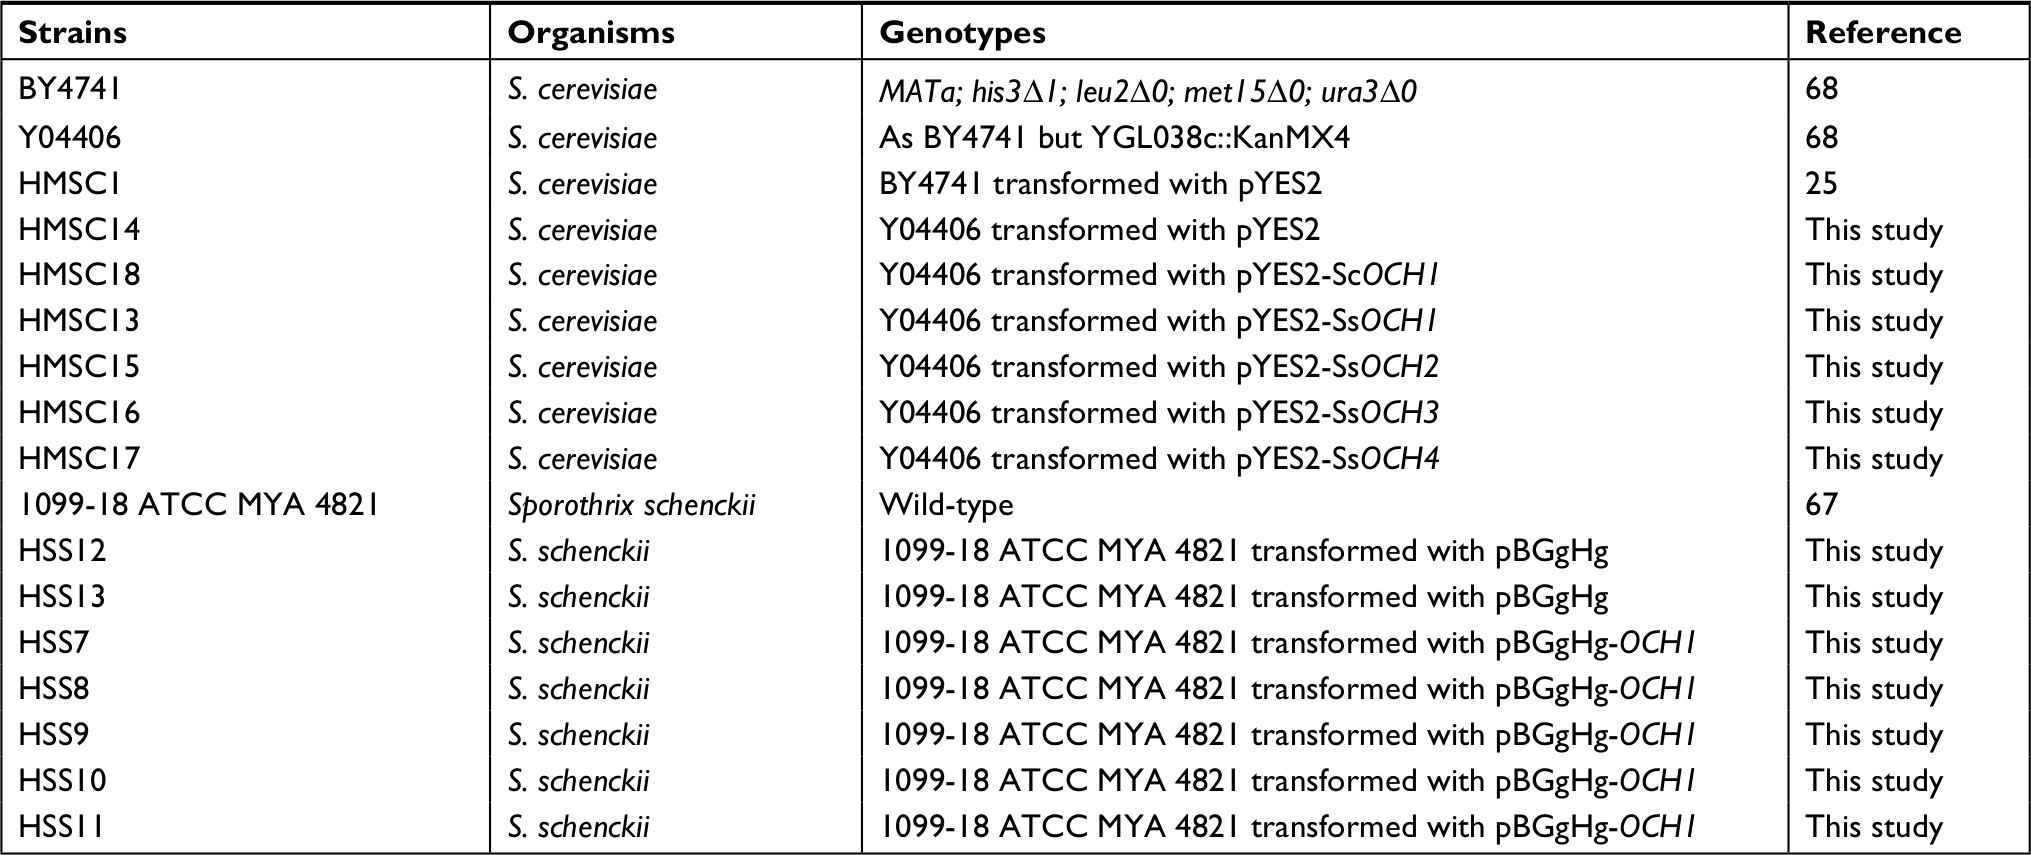 | Table 1 Strains used in this study Abbreviations: S. cerevisiae, Saccharomyces cerevisiae; S. schencki, Sporothrix schenckii. |
Agrobacterium tumefaciens AGL-1 was grown overnight at 28°C in Luria-Bertani broth (0.5 [w/v] yeast extract, 1% [w/v] gelatin peptone, and 1% [w/v] NaCl) and selected in medium supplemented with 100 µg/mL ampicillin and 100 µg/mL kanamycin.
S. schenckii conidia were obtained in solid YPD medium, pH 4.5, at 28°C for 7 days, and harvested by surface scratching, as described previously.11 Hyphae were obtained by incubating conidia in YPD broth, pH 4.5, at 28°C for 48 hours and orbital shaking (120 rpm), and then harvested by filtering using a vacuum system and a 5 µm nylon membrane (Monodur®). Cells were washed six times with sterile cold water and kept at –20°C until used. Yeast-like cells were obtained in YPD broth, pH 7.8. Cultures were incubated for 7 days at 37°C, and reciprocal shaking was done at 120 rpm,11 and then the cells were harvested by centrifuging at 5,000 × g for 5 minutes at 4°C, washed three times with deionized water, and kept at –20°C until used. Cell inactivation by heat was performed at 60°C for 2 hours,11 and the loss of cell viability was confirmed on YPD plates, pH 4.5, incubated at 28°C for 5 days. S. schenckii transformants were selected on YPD plates, pH 4.5 added with 400 mg/mL hygromycin B, incubated at 28°C for 5 days.
Complementation of an S. cerevisiae och1Δ null mutant
For expression of the S. schenckii OCH1 family members in an S. cerevisiae och1Δ mutant, total RNA was isolated as described previously,25 the cDNA was synthesized and purified by adsorption chromatography as reported previously,26 and then amplified by PCR using the following primer pairs: 5′-AAGCTTATGCTCACCTTCAAGCGG-3′ and 5′-GCTAGCTTACTCCTGCTGCTCGCC-3′ for SsOCH1; 5′-AAGCTTATGTCCCAGCATTCATCACG-3′ and 5′-CGATCGTTAGTTCCGCTTGTCGCC-3′ for SsOCH2 (in both sequences, underlined bases indicate HindIII and NheI sites included to direct cloning); 5′-CTGCAGATGTTGTACCCCACGTCT-3′ and 5′-CGATCGTCATAACGGTATGGACTCTG-3′ for SsOCH3 (underlined bases indicate PstI and PvuI sites included to direct cloning); and 5′-AAGCTTATGACGGTGTCACCACAGGA-3′ and 5′- CGATCGCTAACCCCTGTCATCTCGCC-3′ (underlined bases indicate HindIII and PvuI sites included to direct cloning). The amplicons were cloned in pCR2.1-TOPO® (Thermo Fisher Scientific, Waltham, MA, USA) and then subcloned into the corresponding sites of pYES2 (Thermo Fisher Scientific), generating pYES2-ScOCH1, pYES2-ScOCH2, pYES2-ScOCH3, and pYES2-ScOCH4. These constructions were used to transform an S. cerevisiae och1Δ null mutant from EUROSCARF. As controls, the WT strain and the null mutant were transformed with the empty pYES2 vector. In addition, a complementing strain with the native ScOCH1 was generated as follows: the ORF of ScOCH1 was amplified from strain BY4741 genomic DNA by PCR and using the primer pair 5′-AAGCTTATGTCTAGGAAGTTGTCCC-3′ and 5′-GCTAGCTTATTTATGACCTGCATTTTT’3′ (underlined bases indicate HindIII and NheI sites included to direct cloning) before cloning in pCR2.1-TOPO® and subcloning in pYES2 vector.
Alcian blue binding assays
S. schenckii yeast-like cells or S. cerevisiae cells were grown until they reach exponential phase and were pelleted, washed twice with deionized water, and cell concentration adjusted at an OD600 of 0.2 in deionized water. Aliquots of 1 mL were pelleted and cells suspended in 1 mL of Alcian blue (Sigma-Aldrich Co., St Louis, MO, USA; 30 µg/mL, in 0.02 M HCl) and assayed as described previously.27
Cell wall porosity assay
The relative porosity to polycations was used to calculate the wall porosity, as described previously.28 S. cerevisiae cells were grown in SD-Gal broth until they reach the mid-log phase, washed twice with PBS, and cell concentration adjusted at 1×10⁸ cells/mL. Aliquots containing 1 mL were centrifuged, the supernatant discarded, and cell pellets were suspended in either 10 mM Tris-HCl, pH 7.4 (buffer A), buffer A plus 30 µg/mL poly-l-lysine (MW 30–70 kDa; Sigma-Aldrich Co.) or buffer A plus 30 µg/mL diethylaminoethyl (DEAE)–dextran (MW 500 kDa; Sigma-Aldrich Co.). Cells were incubated for 30 minutes at 28°C with shaking at 200 rpm, centrifuged, and the supernatants were saved, centrifuged again, and the absorbance at 260 nm was measured. The relative cell wall porosity to DEAE–dextran was calculated as reported previously.28
Cell growth in the presence of cell wall perturbing agents
The assays were conducted essentially as reported previously.29 Cells in the mid-log phase were harvested by centrifugation, washed twice with deionized water, and adjusted at OD600nm= 0.05. Then, the cells were incubated at 28°C for 40 hours in a 96-well plate containing SD-Gal broth plus doubling dilutions of calcofluor white, Congo red, or hygromycin B, before measuring the OD600nm per well. The readings were used to generate growth curves in the presence of different concentrations of the agents and calculate the concentration at which 50% of growth was inhibited (IC50). The stock solutions to prepare doubling dilutions were 300 µg/mL calcofluor white, 500 µg/mL Congo red, and 300 µg/mL hygromycin B.
Silencing of S. schenckii OCH1
S. schenckii genomic DNA was isolated as reported previously25 and used to amplify 444 bp fragment closer to the 5′-region of the OCH1 ORF. The primer pair used was 5′-CTCGAGTTACATCACCACCCGCTCACATA-3′ and 5′-CTCGAGTTACATCACCACCCGCTCACATA-3′ (underlined sequences correspond to adaptors for XhoI and HindIII, respectively). This DNA fragment was cloned into the XhoI and HindIII sites of pSilent-1,30 generating the construction pSilent-1-OCH1-sense. To clone the antisense fragment into this vector, the same region of OCH1 ORF was amplified with the primer pairs 5′-AGATCTTCGGTAATGACCTCGTGGATGA-3′ and 5′-AGGCCTTTACATCACCACCCGCTCACATA-3′ (underlined sequences correspond to adaptors for BglII and StuI, respectively) and ligated to the corresponding sites of pSilent-1-OCH1-sense, generating pSilent-1-OCH1-sense–antisense. This construction was used to amplify a 3,084 bp fragment that spans from the Aspergillus nidulans TrpC promoter to the A. nidulans trpC terminator, including the sense–intron–antisense region for OCH1 silencing. The primer pair used for this reaction was 5′-CTGCAGATGCCAGTTGTTCCCAGTGATC-3′ and 5′-GAGCTCCCTCTAAACAAGTGTACCTGTGCATT-3′ (underlined sequences correspond to adaptors for SacI and PstI, respectively). This amplicon was cloned into the SacI and PstI sites of the binary vector pBGgHg,31 generating pBGgHg-OCH1. This construction was used to transform A. tumefaciens AGL-1, and bacterial cells were induced by incubating in minimal medium (0.34 M K2HPO4, 0.16 M NaH2PO4, 0.37 M NH4Cl, 0.24 MgSO4 M, 0.04 M KCl, 1.8 mM CaCl2, 0.18 mM FeSO4, pH 7.0 adjusted with 1 N HCl) supplemented with 200 µM acetosyringone (Sigma-Aldrich Co.) for 4.5 hours at 28°C and reciprocal shaking (250 rpm). Aliquots containing 100 µL of induced cells and 100 µL of freshly harvested conidia at 1×10⁶ conidia/mL were coincubated for 3 days at 28°C on a cellophane disk on top of YPD agar, as recently reported.32 Then, to select transformant fungal cells and to kill bacteria, the cellophane was placed on YPD, pH 4.5, added with 400 mg/mL hygromycin B and 200 µM cefotaxime, and incubated for 3 days at 28°C. At least four monoconidial passages in medium with 400 mg/mL hygromycin B were included in the process of mutant selection. In addition, since yeast-like cells are regarded as mononuclear cells,33 at least three rounds of induction of dimorphism in YPD, pH 7.8, were included.
Molecular characterization of mutant strains
Insertion of pBGgHg-OCH1 was confirmed by PCR, using the primer pair 5′- GGCGACCTCGTATTGGGAATC-3′ and 5′-CTATTCCTTTGCCCTCGGACGAG-3′, which aligns in the pdg promoter and inside the hph marker, respectively. Upon total RNA extraction, cDNA synthesis, and cleaning, as described earlier, the material was quantified in a NanoDrop 2000 (Thermo Fisher Scientific), before amplification in a thermocycler StepOne Plus (Thermo Fisher Scientific), using the SYBR Green PCR Master Mix (Thermo Fisher Scientific) and the primer pair 5′-CAGATTGTCACGCACATCAC-3′ and 5′-CGTCGTTGAAGTAGCCAAAG-3′ that amplifies a 131 bp fragment of the OCH1 ORF. To quantify the number of insertional events of pBGgHg-OCH1 within the genome of the selected strains, a similar approach was used but with genomic DNA and the primer pair 5′-CCGTCAATAGCATCACAAG-3′ and 5′-CAGCTTGTCGTAGAGGGTCA-3′ was utilized. These primers amplify a 171 bp fragment of the OCH1 ORF, which is included within the 444 bp region used to generate the silencing construction. Both the OCH1 expression level and the copy number of insertional events of pBGgHg-OCH1 were estimated with the StepOne software V 2.2 (Thermo Fisher Scientific) by calculating 2−∆∆Ct. 34 The encoding gene for the ribosomal protein L6 was used as an endogenous control, whereas the WT strain was defined as the reference condition.35 The primer pair 5′-ATTGCGACATCAGAGAAGG-3′ and 5′-TCGACCTTCTTGATGTTGG-3′ was used for amplification of the endogenous control.
Analysis of cell wall composition
Yeast-like cells were mechanically broken in a Braun homogenizer as described previously,36 and cell walls were washed by centrifuging six times with deionized water. Then, elimination of intracellular components was carried out by serial incubations with hot SDS, β-mercaptoethanol, and NaCl before the samples were hydrolyzed with 2 M trifluoroacetic acid, as described previously.37 Acid-hydrolyzed samples were analyzed by high-performance anion-exchange chromatography with pulsed amperometric detection (HPAEC-PAD) with a Dionex system (Thermo Fisher Scientific) using similar separation conditions to those described earlier.38
Analysis of chitin and β-1,3-glucan exposure at the fungal wall surface
Yeast-like cells were incubated with 1 mg/mL wheat germ agglutinin-fluorescein isotiocyanate (Sigma-Aldrich Co.) for 60 minutes at room temperature to label chitin, as reported previously.39 The β-1,3-glucan staining was performed by incubating yeast-like cells with 5 µg/mL IgG Fc-Dectin-1 chimera40 for 40 minutes at room temperature. The lectin–polysaccharide interaction was revealed by incubating cells with 1 µg/mL donkey anti-Fc IgG-fluorescein isotiocyanate (Sigma-Aldrich Co.) for 40 minutes at room temperature.41 Samples were examined by fluorescence microscopy using a Zeiss Axioscope-40 microscope and an Axiocam MRc camera. From the pictures acquired, the fluorescence quantification of 300 cells was collected using the software Adobe Photoshop™ CS6 with the formula: ([total green pixels – background green pixels] × 100)/total pixels.
Quantification of N-linked and O-linked glycans
The procedure was performed as described previously.42 Briefly, to remove N-linked glycans from the cell wall, yeast-like cells were incubated for 20 hours at 37°C with 25 U endoglycosidase H (New England Biolabs; Ipswich, MA, USA), whereas removal of O-linked glycans was carried out by resuspending cells in 1 N NaOH and gently shaking for 18 hours at room temperature. Glycan release was confirmed by HPAEC-PAD as described previously.43 In both cases, the cells were pelleted by centrifuging, and the supernatants collected, lyophilized, and used to determine the sugar content with the phenol-sulfuric acid method.44
Ethics statement
The use of human cells in this study was approved by the ethics committee of Universidad de Guanajuato (permission code 17082011). Healthy adult volunteers were enrolled in the study, and blood samples were withdrawn after information about the study was disclosed and written informed consent obtained. The work with mice was approved by The Care and Research at the Faculty of Pharmaceutical Sciences, University of Sao Paulo (Ref. CEUA/FCF Protocol 513/16). This study was carried out in accordance with the recommendations of the Guide for the Care and Use of Laboratory Animals of the National Institutes of Health. The protocol was approved by the Conselho Nacional de Controle da Experimentação Animal (CONCEA) of Brazil. The mice were maintained in a specific pathogen-free environment and housed in temperature-controlled rooms at 23°C-25°C with free access to food and water throughout the experiments according to the ethics committee of Animal Use at the Faculty of Pharmaceutical Sciences, University of Sao Paulo.
Isolation of human PBMCs and cytokine stimulation
Human PBMCs were isolated from venous blood that was mixed with Histopaque-1077 (Sigma-Aldrich Co.), and the cell suspension was used to perform a density centrifugation, as described previously.45 The PBMC–Sporothrix interaction was carried out as reported earlier.11 Briefly, aliquots of 100 µL that contained 5×10⁵ PBMCs in RPMI 1640 Dutch modification (added with 2 mM glutamine, 0.1 mM pyruvate, and 0.05 mg/mL gentamycin; all reagents from Sigma-Aldrich Co.) were placed in round-bottom 96-well microplates, and 100 µL with 1×10⁵ yeast-like cells freshly harvested or HK cells were included in each well. The interactions were incubated for 24 hours at 37°C with 5% (v/v) CO2, and plates were centrifuged for 10 minutes at 3,000 × g at 4°C before the supernatants were saved and kept at –20°C until used. The concentration of TNFα, IL-6, and IL-10 was quantified by ELISA using the kit ABTS ELISA Development from Peprotech (Rocky Hill, NJ, USA), whereas the IL-1β levels were measured using a DuoSet ELISA Development kit (R&D Systems, Inc., Minneapolis, MN, USA). In all plates, wells containing only PBMCs suspended in RPMI 1640 Dutch modification were included as controls, and produced threshold levels of the four cytokines were analyzed.
Phagocytosis assays
The human PMBCs were differentiated to macrophages using recombinant human granulocyte–macrophage colony-stimulating factor (GM-CSF; Sigma-Aldrich Co.) as previously reported.46 Freshly grown yeast-like cells were washed twice with PBS and labeled with 1 mg/mL Acridine orange (Sigma-Aldrich Co.) as described previously.47 The excess of dye was removed by washing cells twice with PBS and resuspended at a cell concentration of 3×10⁷ yeast cells/mL. Interactions were performed in aliquots of 800 µL of DMEM (Sigma-Aldrich Co.), in six-well plates with a macrophage–yeast ratio of 1:6. Plates were incubated for 2 hours at 37°C and 5% (v/v) CO2. Then, the macrophages were washed twice with cold PBS and suspended in 1.25 mg/mL Trypan blue as an external fluorescence quencher, as described previously.48,49 Samples were analyzed by flow cytometry in a MoFlo XDP system (Beckman Coulter; Brea, CA, USA) collecting 50,000 events gated for macrophage cells. Fluorescent signals were obtained using the FL1 (green) and FL3 (red) channels previously compensated with macrophage cells without any labeling. Phagocytosis of yeast-like cells was analyzed from counted events in the green (early stage of the phagocytosis process), in both green and red (intermediate stage of the phagocytosis process), and red (cells within acidified phagolysosomes, regarded as late stage of the phagocytosis process) fluorescence channels.50
Analysis of fungal virulence in G. mellonella
The assays were performed as previously described.51 Briefly, the last left pro-leg of larvae was disinfected with 70% (v/v) ethanol, and 1×10⁵ yeast-like cells contained in 10 µL of PBS were injected with a Hamilton syringe and a 26-G needle. Animals were kept at 37°C and survival monitored daily for 2 weeks. Loss of irritability and body melanization were taken as signs of insect death. Then, the animals were decapitated, the hemolymph saved and used to calculate the colony-forming units (CFUs) of the fungal strain, by serial dilutions of the hemolymph and incubating on YPD plates, pH 4.5, at 28°C for 72 hours. Each experimental group contained 30 larvae, including a control group injected only with PBS.
Analysis of fungal virulence in mice
Female BALB/c mice at 10 weeks of age (weighing ~24 g) were obtained from the Animal House Production and Experimentation Facility of the Faculty of Pharmaceutical Sciences and Institute of Chemistry of the University of Sao Paulo (Brazil). The mice were maintained in a specific pathogen-free environment and housed in temperature-controlled rooms at 23°C-25°C with free access to food and water throughout the experiments. Since these experiments were designed to confirm data obtained with larvae of G. mellonella, we only tested two silenced mutants, to include a minimal number of mice in this study. Three groups of seven mice each were infected intraperitoneally with 5×10⁶ yeast-like cells in a 100 µL of PBS inoculum. On day 14 post-infection, the mice from each group were euthanized. The spleen and liver of these animals were removed to assess infection by counting CFUs. The liver and spleen from each animal were placed in sterile Petri dishes and immediately weighed. Each organ was homogenized mechanically in 2 mL of sterile PBS; dilutions were prepared from this solution and subsequently plated on brain heart infusion agar plates. The plates were maintained at 30°C for 7 days, and then colony counts were taken to assess the CFU values to use in the calculations of the average CFU per gram of organ.
The supernatants of the liver and spleen suspension of infected mice were collected after centrifugation of the organ homogenate to remove intact cells and cell debris. The supernatants were assayed by ELISA to determine the levels of IFN-γ, IL-1β, and IL-10, using commercial kits from R&D Systems, Inc.
Statistical analysis
Statistical analysis was performed using GraphPad Prism 6 software. Results obtained upon incubation with the cell wall-perturbing agents were analyzed by two-way ANOVA. Stimulation of cytokines and phagocytosis by human cells were carried out in duplicate with samples from six healthy donors. Survival experiments using larvae from G. mellonella were performed with a total of 30 larvae per strain tested. Data were analyzed using the log-rank test and are reported in Kaplan–Meier survival curves. The CFUs and cytokine profiles from infected mice were compared using either a two-way ANOVA followed by Bonferroni’s multiple comparison tests or an ANOVA followed by the Tukey–Kramer test. All data are represented as mean and SD.
Other experiments were performed at least three times in duplicate. Data represent cumulative results of all experiments performed. The Mann–Whitney U test was used to analyze data from the host–fungus interaction, whereas the unpaired t-test was used to establish statistical significance in the rest of the experiments. In all cases, the significance level was set at P<0.05.
Results
Identification of the S. schenckii OCH1 gene family and functional complementation in S. cerevisiae OCH1
Molds, at the difference of yeast-like organisms such as C. albicans and S. cerevisiae, contain three additional OCH1-like genes within the genome, and collectively they are named the OCH1 gene family. Thus far, the best-characterized gene family is that from A. fumigatus that is composed of four members: Och1, Och2, Och3, and Och4.52 The S. schenckii OCH1 gene family was identified within its genome sequence53 by homology to the S. cerevisiae, C. albicans, and A. fumigatus OCH1. This family is predicted to be composed of four members and the encoded products showed significant similarity values to Och1 characterized from other organisms (Table S1). The sequence under the GenBank accession code ERS99987 showed to be the best hit for the putative orthologs of Och1 in S. schenckii (SsOch1), with the similarity of 64.5%, 64.1%, and 49.0% to A. fumigatus, C. albicans, and S. cerevisiae Och1, respectively (Table S1). When the family members were compared among them, they showed a relatively low similarity in protein sequence with values ranging from 26% to 35% similarity (Table S2), but share signature sequences of the family 32 of glycosyltransferases, mainly closer to the C-terminus (Figure S1). Despite the relative low similarity among family members, these sequences were grouped into two clades: one grouping SsOch2, SsOch3, and SsOch4 and a second with SsOch1 as the sole member (Figure S1). To demonstrate these genes encoding for members of the OCH1 gene family in S. schenckii, we cloned the encoding regions of SsOCH1, SsOCH2, SsOCH3, or SsOCH4 into the pYES2 vector, and the constructions were used to transform an S. cerevisiae och1Δ null mutant, generating a collection of strains heterologously expressing the members of the S. schenckii OCH1 gene family (Table 1). As a control, the null mutant was complemented with the native OCH1 ORF (ScOCH1) cloned into the pYES2 vector (Table 1). In this vector, the cloned ORF is under the control of the regulatable GAL1 promoter, which actively transcribes when cells are grown in galactose. When the wild-type (WT) control cells were grown in galactose-containing media, they displayed the typical yeast morphology, but the och1Δ null mutant growing under the same conditions showed cell aggregation and presence of swollen cells21 (Figure 1A). As expected, the complementation with the native ScOCH1 restored the cell morphology, observing round, separated, budding yeast cells, like the WT strain (Figure 1A). When similar experiments were conducted with the strains complemented with members of the S. schenckii OCH1 family, only the expression of SsOCH1 restored the cell phenotype, with the absence of cell aggregates (Figure 1A). The ability to bind Alcian blue has been related to defects in the status of the protein glycosylation pathways, and most of the mutations impacting on them reduce the ability to bind this dye.14,16,17,19,27,37,54,55 Moreover, defects in these biosynthetic pathways increase the cell wall porosity and sensitivity to cell wall-perturbing agents, such as Congo red, hygromycin B, and calcofluor white.29,42,46,50,56 As anticipated, the null mutant cells reduced the content of Alcian blue bound and increased cell wall porosity and sensitivity to the tested perturbing agents (Figure 1B–D). Complementation with the native ScOCH1 or SsOCH1, but not SsOCH2, SsOCH3, or SsOCH4, restored the phenotype to levels similar to those displayed by the WT control cells (Figure 1B–D). Expression of SsOCH2, SsOCH3, and SsOCH4 was confirmed by reverse transcription PCR (RT-PCR; not shown). Similar experiments with cells grown in glucose-containing medium failed to show complementation by ScOCH1 or SsOCH1 (data not shown), indicating that the complementing phenotype is associated with the ORF under the control of the GAL1 promoter. Collectively, these data indicate that SsOCH1 is the only member of the S. schenckii OCH1 family capable of complementing an S. cerevisiae och1Δ null mutant and, therefore, is the functional ortholog of S. cerevisiae OCH1. Since similar results have been reported in A. fumigatus, where AfOCH1 is the only family member capable of complementing an S. cerevisiae och1Δ null mutant,52 we focused our interest in SsOCH1, whose ORF spans 1,333 bp, contains a 136 bp intron closer to the 5′-end, and is predicted to encode a type-II transmembrane protein of 398 amino acids belonging to family 32 of glycosyltransferases.
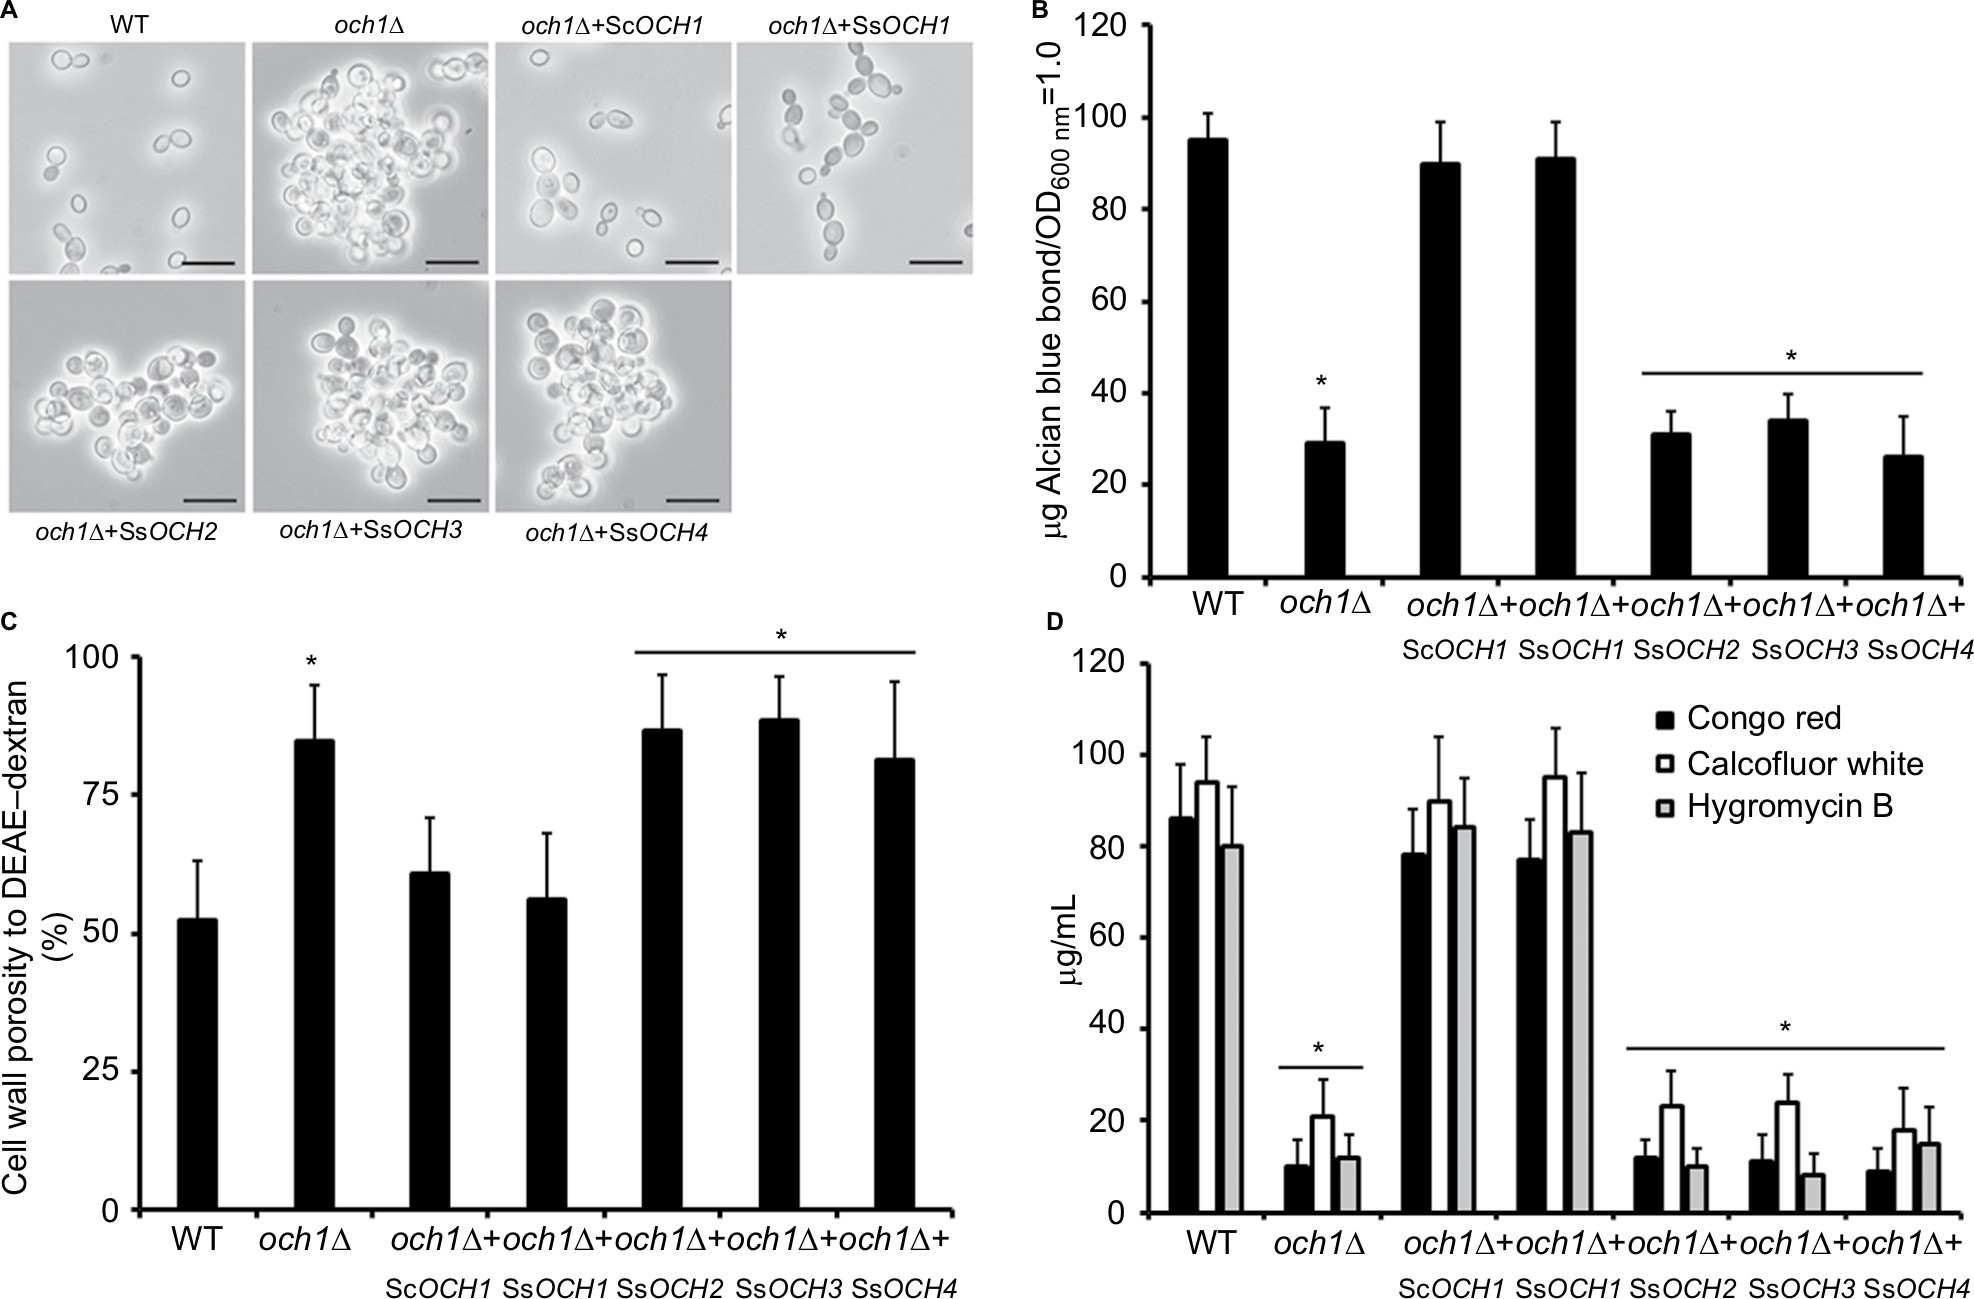 | Figure 1 SsOCH1 is the functional orthologous of ScOCH1. Notes: The open reading frame of the four members of the Sporothrix schenckii OCH1 gene family was expressed in a S. cerevisiae och1Δ null mutant, as described in the “Materials and methods” section, and the gene expression was induced by growing cells in the Sc-Gal medium. (A) Cell morphology in liquid medium, inspected under bright-filed microscopy. Scale bar=10 µm. (B) The ability of cells to bind Alcian blue, an indirect measurement of the cell wall phosphomannan content, and therefore of mannan length was analyzed. (C) Cell wall porosity analyzed by the ability of polycations to leak 260 nm absorbing material. (D) The effect of some cell wall perturbing agents was evaluated by calculating the concentration at which 50% of growth was inhibited. The agents tested were Congo red, calcofluor white, and hygromycin B. Data are represented as mean ± SD of three independent experiments performed in duplicates. *P<0.05 when compared to the WT strain. Strains used are as follows: HMSC1 (WT), HMSC14 (och1Δ), HMSC18 (och1Δ+ ScOCH1), HMSC13 (och1Δ+ SsOCH1), HMSC15 (och1Δ+ SsOCH2), HMSC16 (och1Δ+ SsOCH3), and HMSC17 (och1Δ+ SsOCH4). Abbreviations: DEAE, diethylaminoethyl; WT, wild type. |
Silencing of S. schenckii OCH1
Next, to get insights on the contribution of OCH1 to the S. schenckii cell fitness, wall composition, and interaction with the host, we silenced the gene using the A. tumefaciens-mediated transformation and the binary vector pBGgHg-OCH1, which contains 444 bp of the OCH1 ORF (from position +54 to +497), cloned in sense and antisense, and the vector pBGgHg as backbone.31 After several monoconidial passages, five hygromycin B-resistant colonies were selected, and the presence of pBGgHg-OCH1 within the genome was confirmed by PCR (data not shown). Next, quantitative PCR (reverse transcription quantitative PCR) assays were set to assess the silencing of OCH1 (see “Materials and methods” for details). Strain HSS7 showed an intermediate silencing, with 57%±0.92% of the expression observed in the WT control cells, whereas HSS8 strain showed only 14%±1.12% of expression when compared with the parental strain (Figure 2). Strains HSS9, HSS10, and HSS11 had trace levels of the OCH1 transcript (1.6±0.61, 0.25±1.12, and 3.9±1.18, respectively) and were regarded as fully silenced strains (Figure 2). To assess the number of insertion events of the pBGgHg-OCH1 in these strains, we performed qPCR reactions using genomic DNA and primers to amplify a 171 bp fragment contained in the region used in the construction for silencing of OCH1. Since this region is cloned in sense and anti-sense in pBGgHg-OCH1, it is expected that qPCR detects both copies. In addition, if the construction was not integrated into the OCH1 locus, the native OCH1 will also be detected by this strategy. As expected, qPCR allowed the detection of one copy of this OCH1 region in the WT control strain, but about three copies in the silenced strains, suggesting one single insertional event of pBGgHg-OCH1 and that this did not occur in the native OCH1 allele (Figure 2). As an additional control, we transformed S. schenckii cells with the empty pBGgHg and selected two random mutant strains (HSS12 and HSS13). These strains did not show changes in the OCH1 expression and had one insertional event (Figure 2) and, therefore, were used as additional controls in this study.
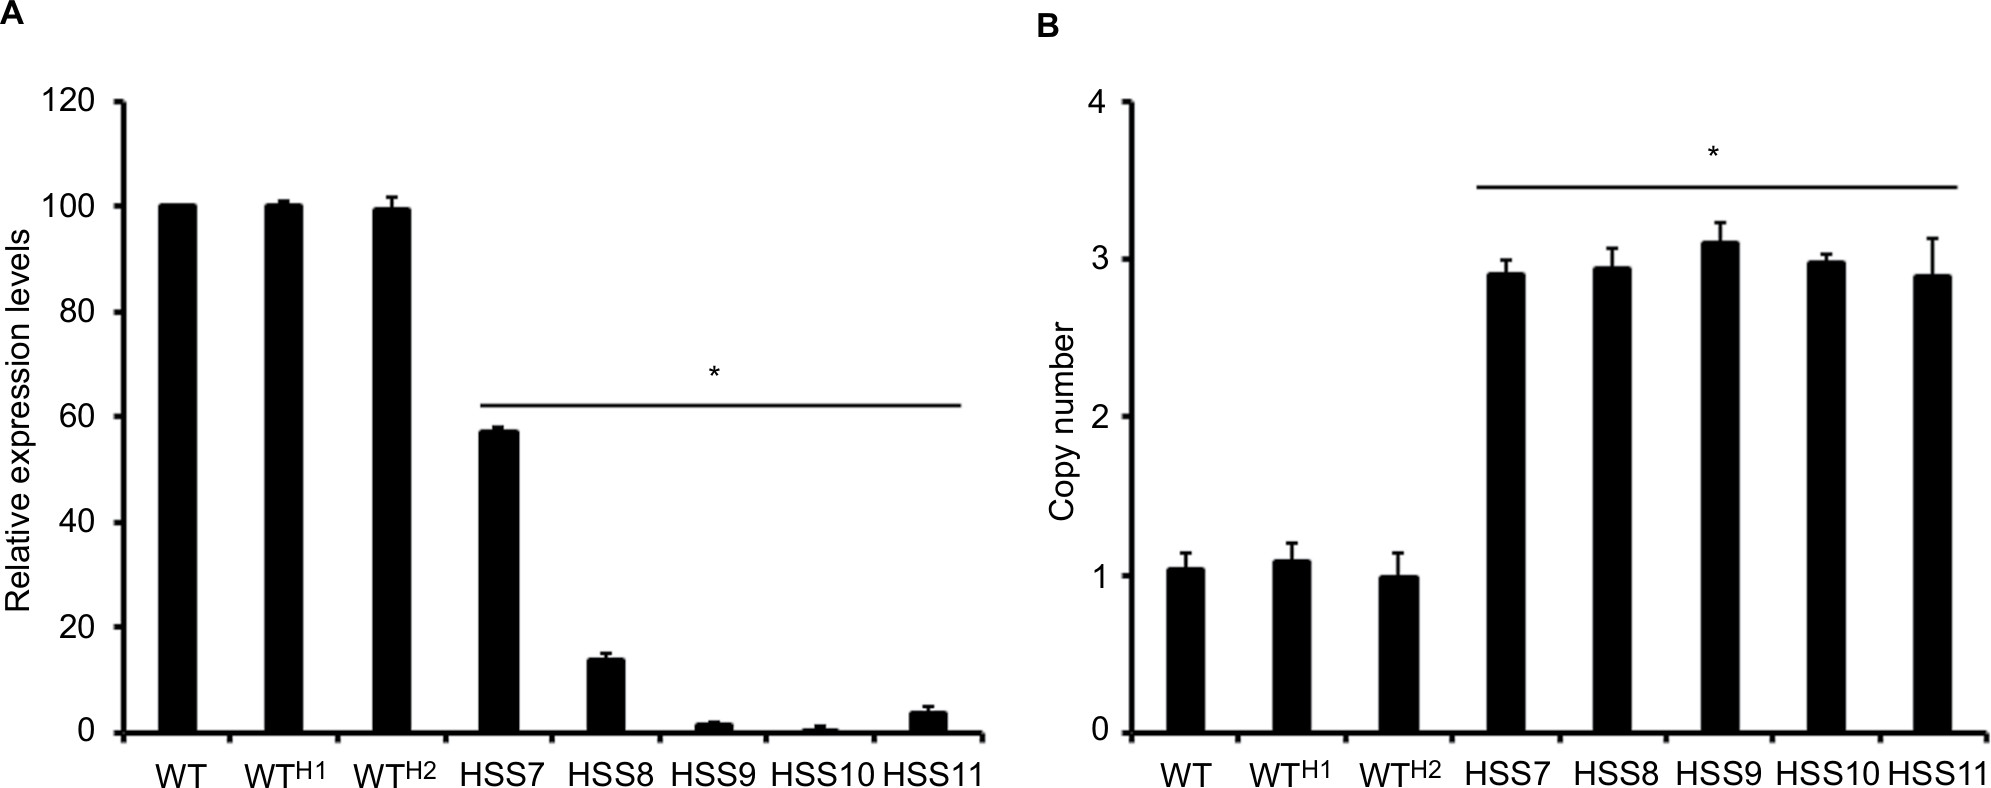 | Figure 2 Molecular characterization of mutant strains transformed with pBGgHg-OCH1. Notes: (A) The OCH1 expression determined by RT-qPCR. (B) Estimation of the copy number of an OCH1 fragment used to generate the silencing construction of pBGgHg-OCH1. In both cases, data were normalized using the amplification of the gene encoding for the ribosomal protein L6 as a control. Data are expressed as mean ± SD of three independent experiments performed in duplicates. *P<0.05 when compared to the WT strain. The strains used are 1099-18 ATCC MYA 4821 (WT), HSS12 (WTH1), and HSS13 (WTH2). Abbreviations: RT-qPCR, quantitative reverse transcription PCR; WT, wild type. |
The cell morphology and colony, along with the ability to undergo dimorphism, did not show significant changes in the selected mutants, even in those in which OCH1 was fully silenced (Figure S2 and data not shown). In addition, the duplication time of the selected mutants was not significantly different from that observed in the WT control strain for both mycelia and yeast-like cells (Figure S3). Therefore, S. schenckii mutants with different degrees of OCH1 silencing were generated but did not show defects in cell morphology or growth.
Silencing of OCH1 affected S. schenckii cell wall composition, organization, and protein glycosylation pathways
The walls from yeast-like cells were isolated, purified, acid hydrolyzed, and analyzed by HPAEC-PAD to assess the effect of the OCH1 silencing on the S. schenckii cell wall composition. We selected yeast-like cells for the phenotypical characterization of the mutants because this cell morphology is frequently found in the infected tissues and has an obvious role during the host–Sporothrix interaction.3–5 Results showed that the WT and the WTH1 and WTH2 (HSS12 and HSS13) control strains have similar content of chitin (GlcNAc-based polysaccharide), glucans (Glc-based polysaccharide), and rhamnose and mannose that are found as part of rhamnomannans.11,13 Strain HSS7, which has intermediate silencing of OCH1, displayed a similar cell wall composition to the control strains, but strains HSS8–HSS11 showed a significant reduction in the rhamnose content (Figure 3A). Although these strains showed a trend to have more chitin and glucan in the cell wall, these data were not significantly different from those shown by the WT strain (P>0.05). These strains also showed decreased ability to bind the cationic dye Alcian blue, but not the partially silenced strain HSS7 (Figure 3B). Next, we assessed whether the OCH1 silencing affected the organization of cell wall components using lectin-based labeling. We have previously demonstrated that a significant proportion of both chitin and β-1,3-glucan are closer to the plasma membrane and therefore poorly accessible to the wall surface, but they are exposed on the wall surface upon cell inactivation by heat.10,11 Results shown in Figure 3C and D indicate that WT, control strains, and the mutant HSS7 had similar exposure of both polysaccharides on the cell surface of live yeast-like cells, but strains HSS8–HSS11 showed increased labeling of both chitin and β-1,3-glucan at the cell wall surface. When heat-killed (HK) cells were used in similar assays, the general trend was a higher labeling of both polysaccharides when compared to live cells, but again, strains HSS8–HSS11 showed increased labeling by lectins that recognize chitin and β-1,3-glucan, when compared to the WT strain (Figure 3C and D). Control strains and the HSS7 strain had the ability to be labeled by lectins similar to the WT strain (Figure 3C and D). Collectively, these results indicate that silencing of OCH1 affected the S. schenckii cell wall composition and organization.
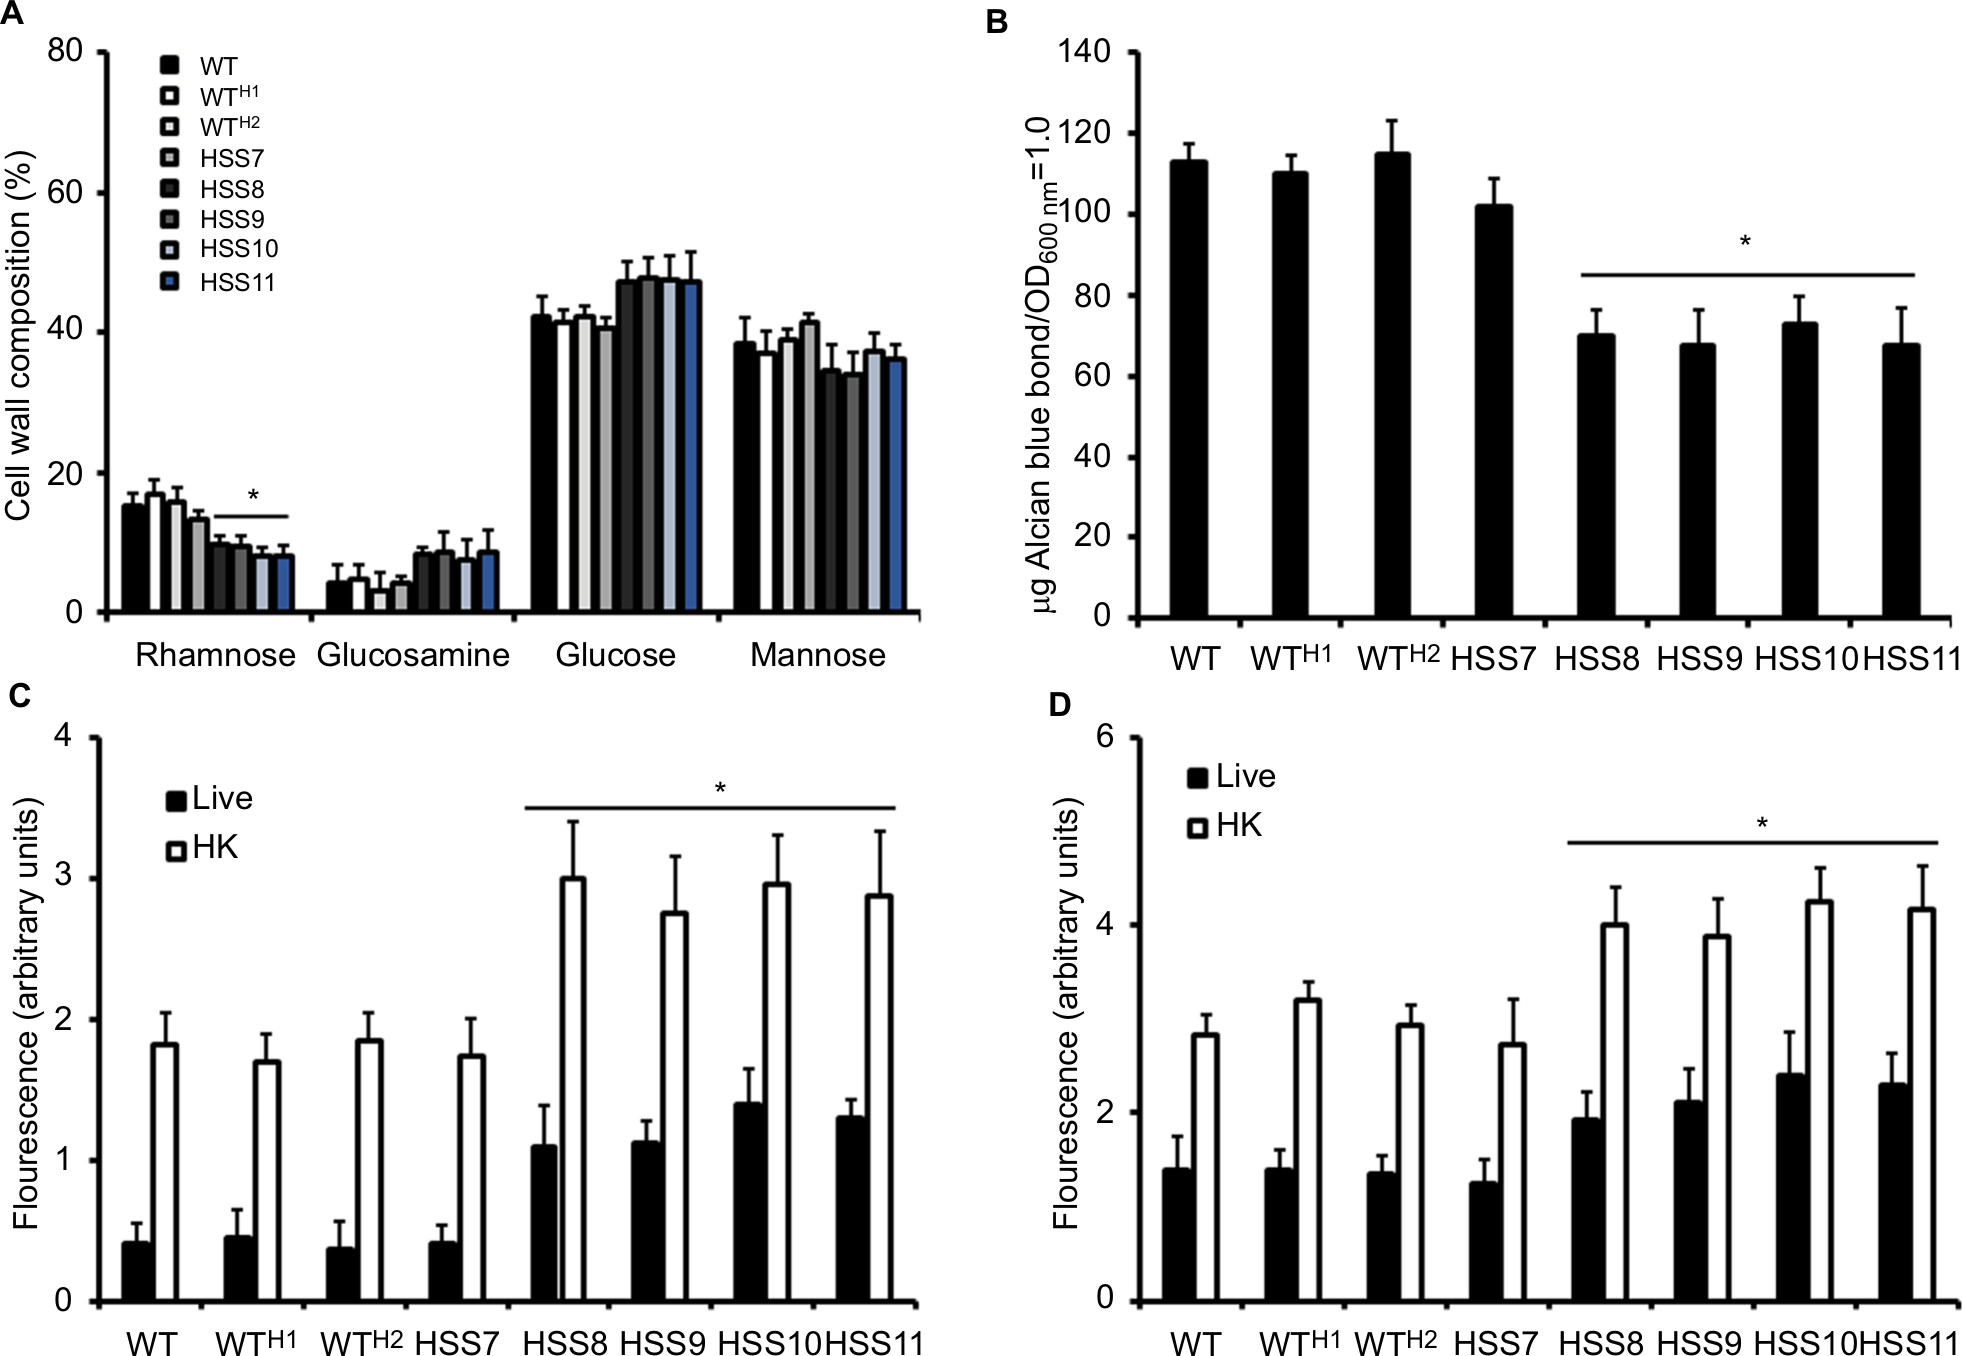 | Figure 3 The OCH1 silencing affects the cell wall composition and organization of Sporothrix schenckii. Notes: (A) Yeast-like cells were grown to the exponential phase in YPD, pH 7.8, and cell walls were isolated, cleaned, and acid hydrolyzed before quantification of the content of sugars by high-performance anion-exchange chromatography with pulsed amperometric detection. (B) Cells grown under similar conditions to that in (A) were used to assess the ability to bind Alcian blue dye. Live (closed bars) or HK (open bars) yeast-like cells were incubated with either fluorescein isothiocyanate–wheat germ agglutinin conjugate (C) or IgG Fc-Dectin-1 chimera (D) as described in the “Materials and methods” section, inspected under fluorescence microscopy, and the fluorescence associated with 300 cells was calculated. Data are represented as mean ± SD of the three independent experiments performed in duplicates. *P<0.05 when compared to the WT strain. The strains used are 1099-18 ATCC MYA 4821 (WT), HSS12 (WTH1), and HSS13 (WTH2). Abbreviations: HK, heat-killed; WT, wild type. |
The reduction in rhamnose content in the strains HSS8–HSS11 suggests a defect in the glycosylation pathways, and to get more insights into the composition of the cell wall of these mutant strains, we trimmed the N-linked and O-linked glycans using endoglycosidase H and β-elimination, respectively, and quantified the sugar content in both fractions. Results shown in Figure 4 indicate that the WT, control strains, and the mutant HSS7 have similar proportions of both glycans, with more O-linked glycans released from the cell wall than N-linked glycans. In contrast, the fully silenced mutants HSS8–HSS11 showed a significant reduction in the content of N-linked glycans and increased levels of O-linked glycans. These data indicate changes in the protein glycosylation pathways upon OCH1 silencing.
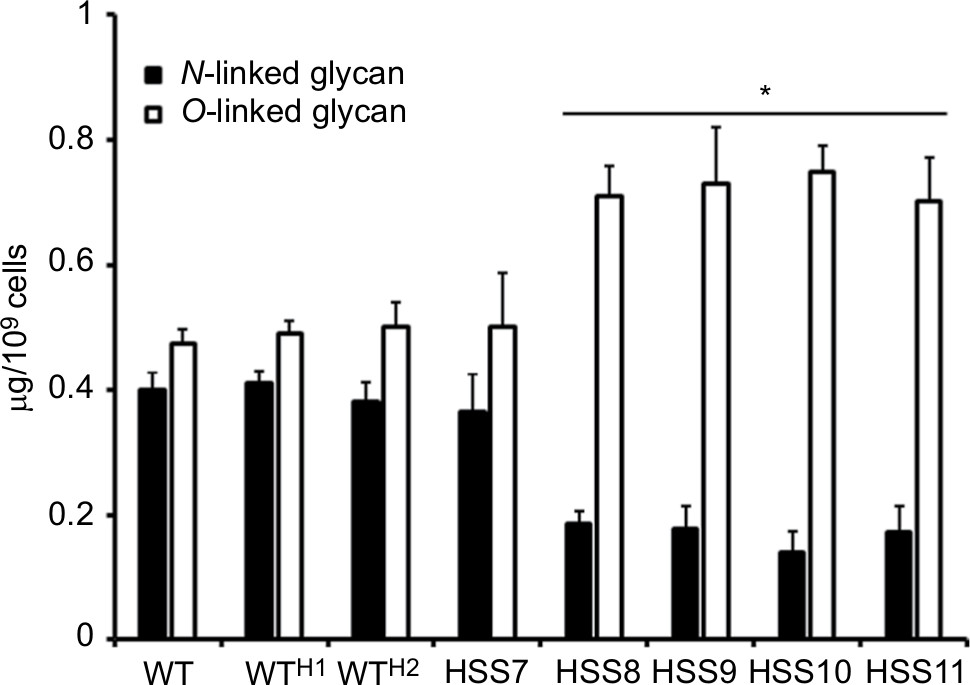 | Figure 4 The OCH1 silencing affects the content in N-linked and O-linked glycans at the cell wall of Sporothrix schenckii. Notes: Yeast-like cells were incubated with either endoglycosidase H or β-eliminated, to trim N-linked or O-linked glycans, respectively, and the sugar content was quantified as described in the “Materials and methods” section. Data are represented as mean ± SD of three independent experiments performed in duplicates. *P<0.05 when compared to WT cells. The strains used are 1099-18 ATCC MYA 4821 (WT), HSS12 (WTH1), and HSS13 (WTH2). Abbreviation: WT, wild type. |
Silencing of OCH1 affected the ability of S. schenckii to stimulate cytokine production by human PBMCs
Next, we aimed to assess whether the OCH1 silencing affected the ability of S. schenckii yeast-like cells to stimulate cytokine production by human PBMCs. We compared the ability of both live and HK cells to stimulate cytokine production, as the later expose inner wall components at the wall surface, with a consequent differential cytokine profile.11,57 Live S. schenckii yeast-like cells from the WT, control strains, and the mutant HSS7 stimulated similar levels of the four cytokines analyzed, ie, TNFα, IL-1β, IL-6, and IL-10; however, strains HSS8–HSS11 induced the production of lower levels of TNFα and IL-6 and increased the levels of IL-10 (Figure 5). No changes in the stimulation of IL-1β were observed across the tested strains (Figure 5). When HK cells were used in the interactions, all strains induced significantly higher TNFα and IL-6 levels than live cells (P<0.05), but no changes were observed for the production of IL-1β and IL-10 (Figure 5). When compared with the WT strain, the control and HSS7 strains stimulated similar cytokine levels, but a reduction in the production of TNFα and IL-6 was observed when strains HSS8–HSS11 were used in the stimulation assays (Figure 5). As in the case of live cells, the HK cells from strains HSS8, HSS9, HSS10, and HSS11 stimulated higher levels of IL-10 than the WT strain (Figure 5). Collectively, these data suggest that proper S. schenckii protein glycosylation is required for the stimulation of cytokines by human PBMCs.
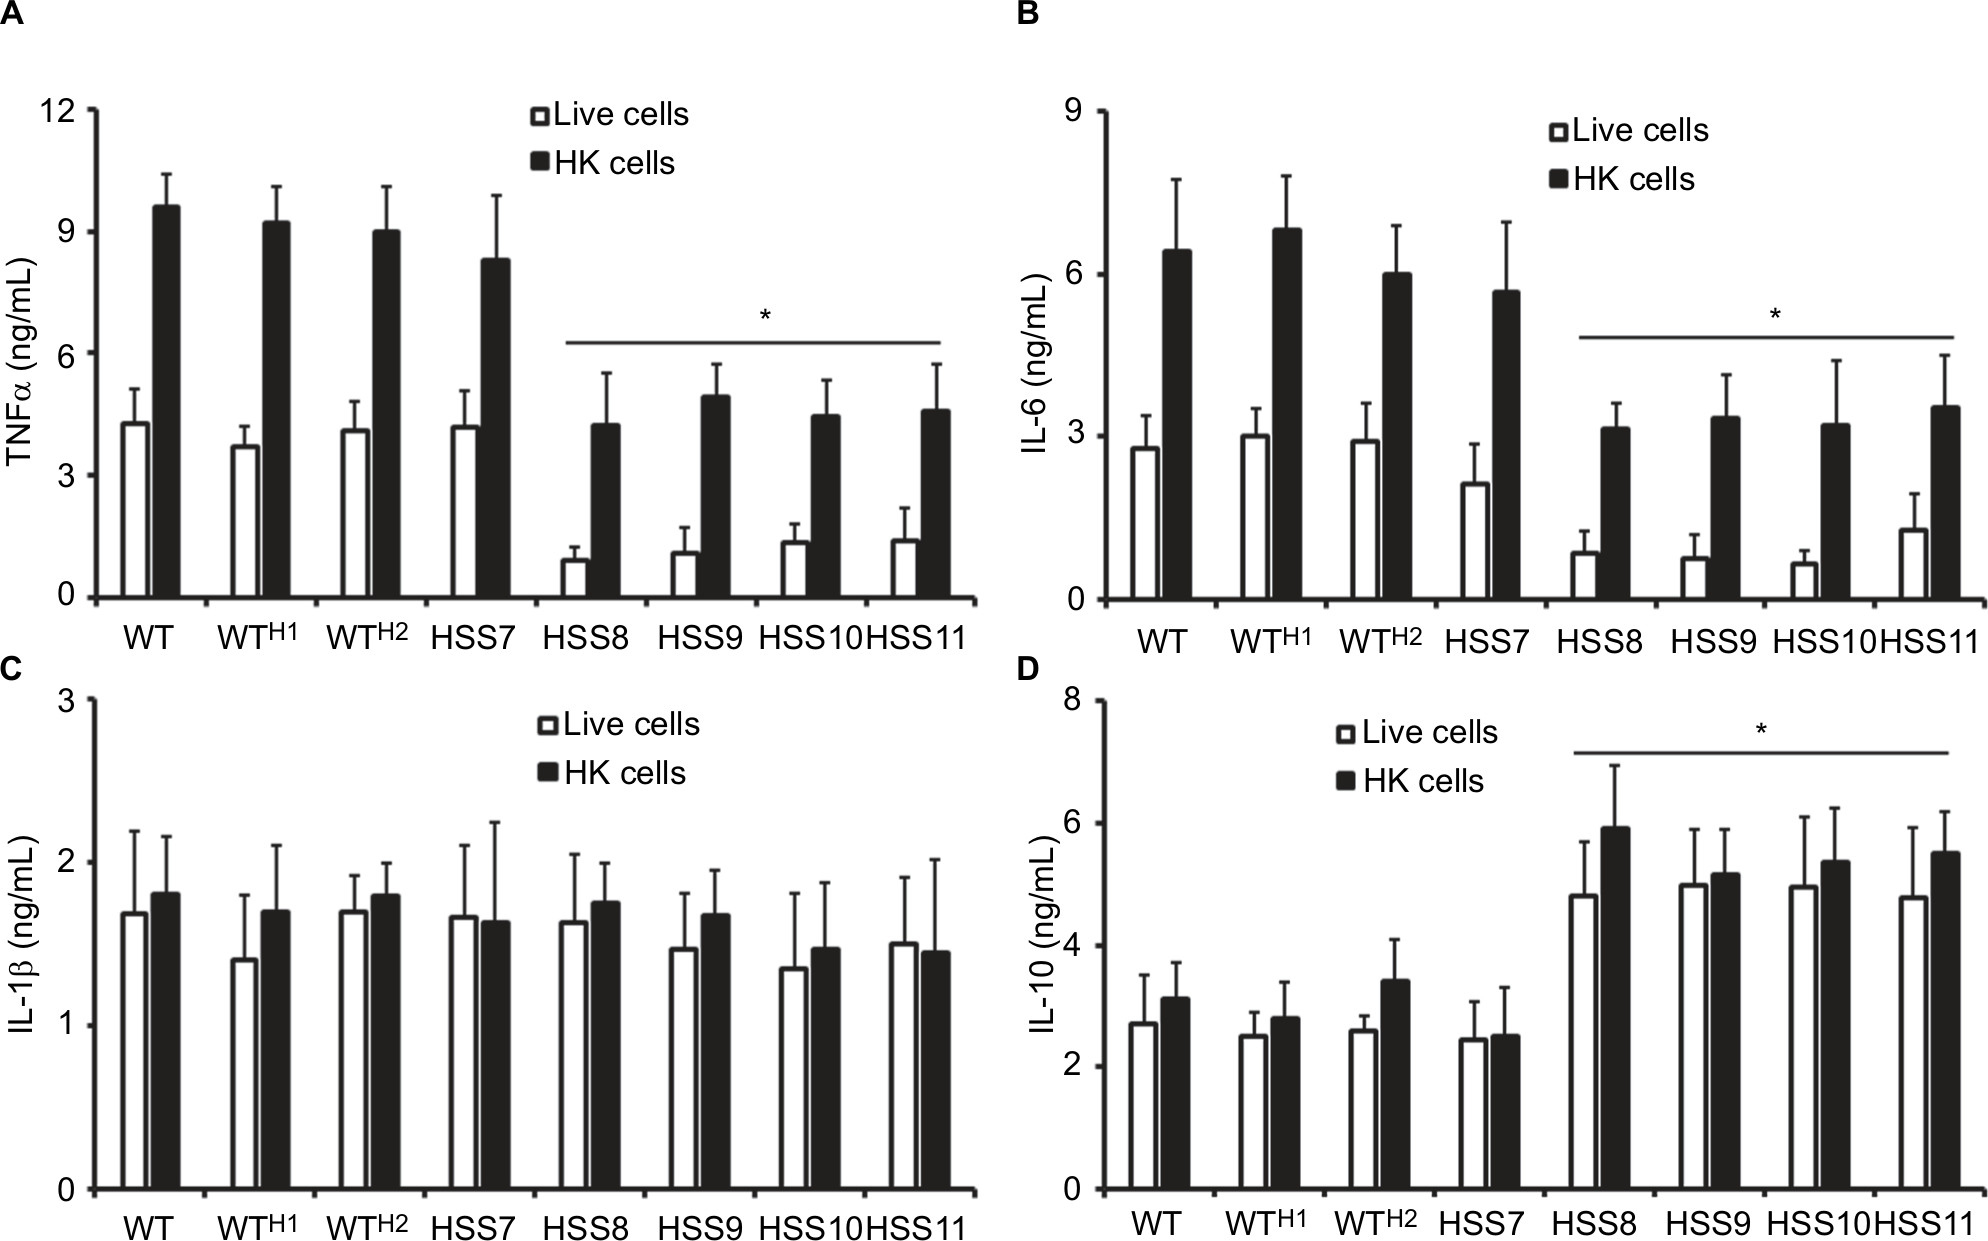 | Figure 5 The OCH1 silencing affects the human PBMC–Sporothrix interaction. Notes: Yeast-like cells were coincubated with human PBMCs, the supernatant saved, and used to quantify the level of TNFα (A), IL-6 (B), IL-1β (C), and IL-10 (D) by ELISA. Data are represented as mean ± SD obtained with samples from six donors, each assayed in duplicate wells. *P<0.05 when compared to WT cells. The strains used are follows: 1099-18 ATCC MYA 4821 (WT), HSS12 (WTH1), and HSS13 (WTH2). Abbreviations: HK, heat-killed cells; PBMC, peripheral blood mononuclear cell; WT, wild type. |
Silencing of OCH1 affected the phagocytosis of S. schenckii by human monocyte-derived macrophages
Since the OCH1 silencing affected the ability of S. schenckii to stimulate cytokine production by human PBMCs, we next assessed the phagocytosis of these mutant strains by human macrophages. The human PBMCs were differentiated to macrophages as described in the “Materials and methods” section and used to interact with yeast-like cells previously labeled with Acridine orange, and the ratio of phagocytosing macrophages was determined by flow cytometry. Since the Acridine orange emits green fluorescence at neutral pH, but a reddish emission in acid environments,47 we could identify three different stages of the phagocytic event: an early stage, where human cells were interacting with predominantly green fungal cells; an intermediate stage, where macrophages were interacting with yeast-like cells emitting green and red fluorescence; and a late stage of interaction, where mainly yeast-like cells emitting in the red channel were interacting with macrophages.50 In the early stage, we could not observe any significant difference in the number of yeast-like cells from strains HSS8 to HSS11 interacting with the human monocyte-derived macrophages when compared with the WT, control, or HSS7 strains (Figure 6A). However, a reduced number of cells from strains HSS8, HSS9, HSS10, and HSS11 were associated with macrophages in the intermediate and late stages of the phagocytic process, and similar high interacting cell numbers from the WT, control, and HSS7 strains were associated with macrophages (Figure 6B and C). When HK yeast-like cells were used in this fungus–macrophage interaction, we observed increased fungal cell numbers associated with the human cells, when compared to the experimental setting using live yeast-like cells, but the reduced number of phagocytosed HK cells from strains HSS8 to HSS11 was also observed in the intermediate and late stages of the interaction (Figure 6). It is noteworthy to mention that most of the phagocytosed cells from all tested strains were found in the late stage, and minimal cell numbers were found to be in the early stage of phagocytosis (Figure 6). Collectively, these data indicate that OCH1 silencing negatively affected the phagocytosis of S. schenckii by human monocyte-derived macrophages.
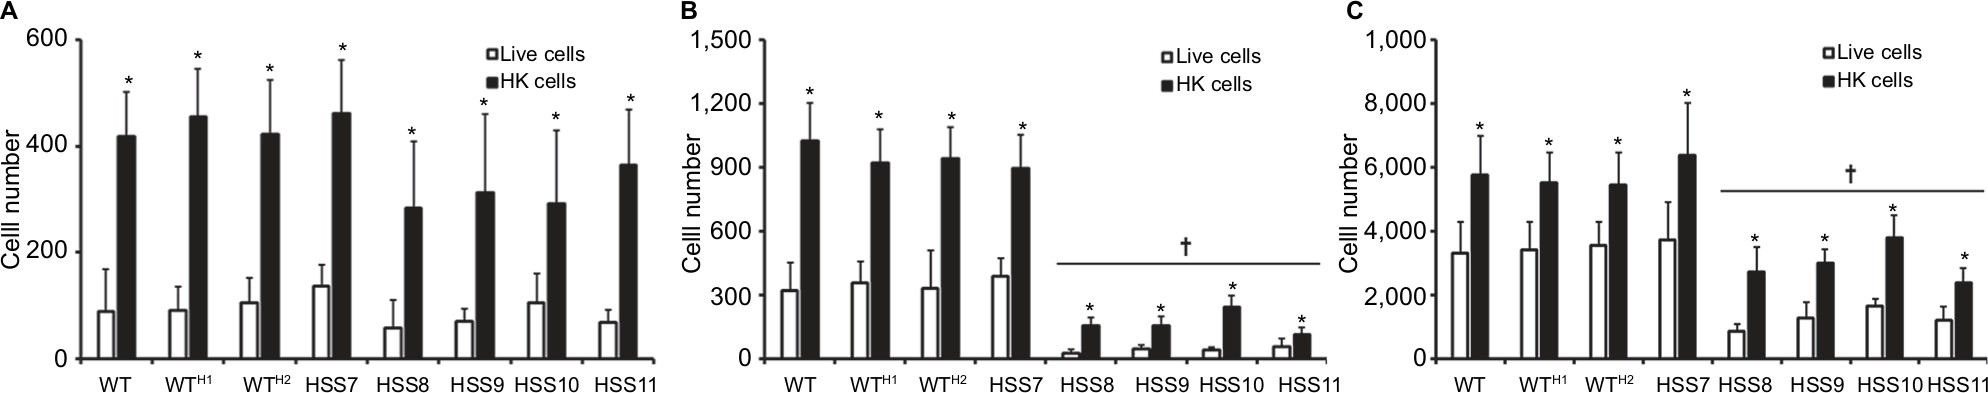 | Figure 6 The OCH1 silencing affects the phagocytosis of Sporothrix schenckii by human monocyte-derived macrophages. Notes: Yeast-like cells were stained with Acridine orange and incubated with human monocyte-derived macrophages at a macrophage–yeast ratio of 1:6, for 2 hours at 37°C and 5% (v/v) CO2. The human cells were gated by FACS and 50,000 cells were counted per sample. Results represent macrophages interacting with at least one fluorescent yeast cell. Open and closed bars indicate data obtained with live and HK yeast-like cells. (A) Macrophages interacting with green yeast cells, which were regarded as cells in the early stages of the phagocytosis. (B) Macrophages interacting with green and red yeast-like cells, which were considered in an intermediate stage of the phagocytic process. (C) Macrophages interacting with red yeast-like cells that are in the late stage of the phagocytosis process. Data represent mean ± SD from six donors assayed by duplicate. *P<0.05 when compared to live cells of the same strain. †P<0.05 when compared to WT cells under the same conditions, ie, live or HK cells. The strains used are 1099-18 ATCC MYA 4821 (WT), HSS12 (WTH1), and HSS13 (WTH2). Abbreviations: FACS, fluorescence-activated cell sorting; HK, heat-killed; WT, wild type. |
Silencing of OCH1 affected the S. schenckii virulence
We compared the susceptibility of larvae from G. mellonella to WT, control, and silenced strains in an experimental model of disseminated sporotrichosis to determine whether the OCH1 silencing affected the in vivo virulence of S. schenckii, as previously reported.51 We found that larvae infected with WT and control strains WTH1 and WTH2 were capable of killing about half of the animal population after 15 days of observation (Figure 7), which are in agreement with our previous reports.51 No significant differences were observed among the WT and the control strains (P=0.804). The strains HSS8–HSS11 showed virulence attenuation, and no differences were observed among them (P=0.157). Interestingly, the strain with partial gene silencing, HSS7, also showed virulence attenuation and generated a mortality curve intermediate between the control and the silenced strains (Figure 7). The CFUs recovered from dead animals did not show significant differences across the tested strains (Figure 7).
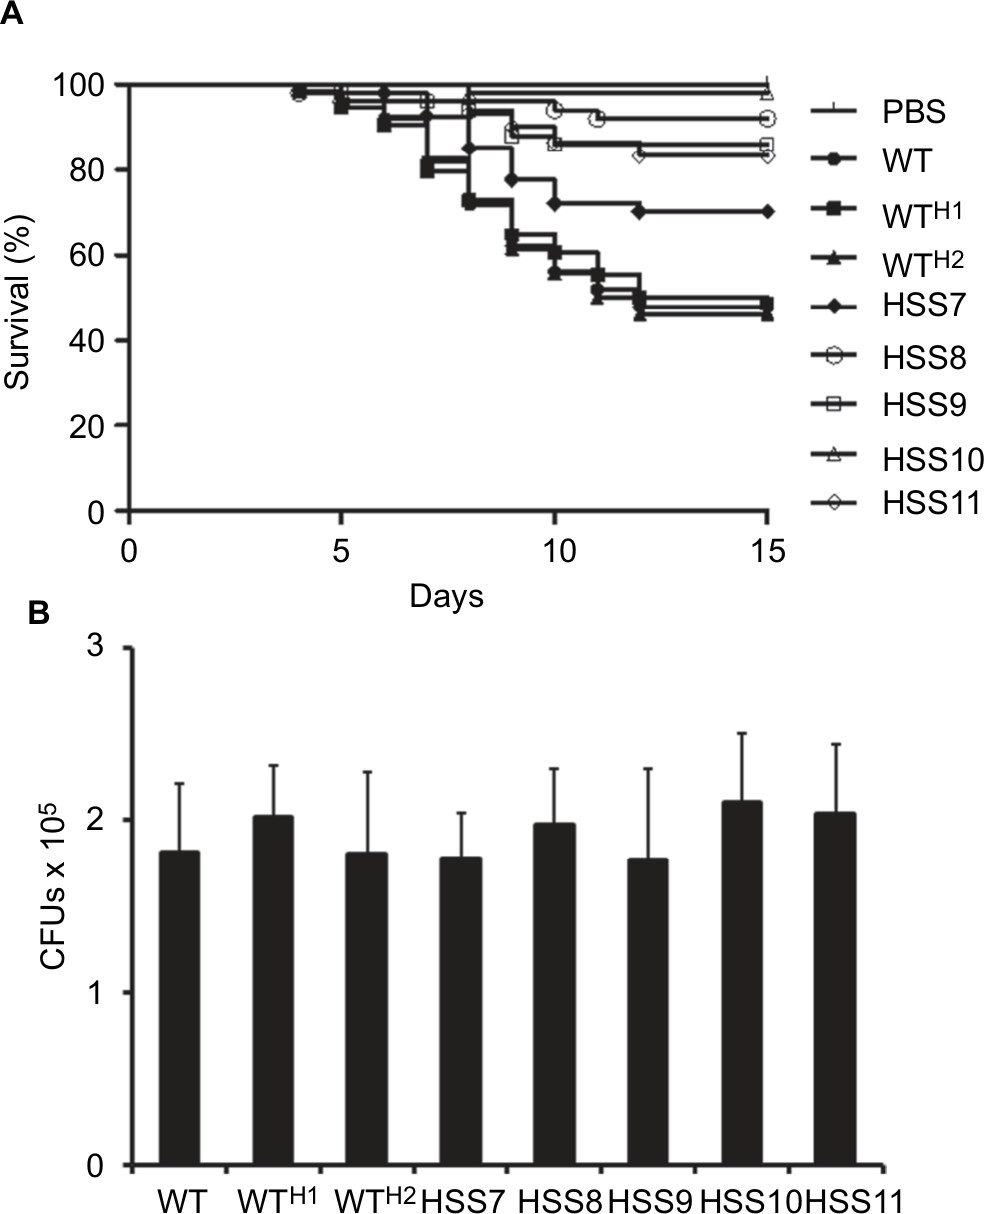 | Figure 7 Effect of the OCH1 silencing on the Sporothrix schenckii virulence in Galleria mellonella. Notes: (A) Groups containing 10 larvae were injected with 1×10⁵ yeast-like cells, and mortality was recorded daily for 15 days. PBS refers to an animal group injected with 10 µL of PBS, included as a control. The Kaplan–Meier plots were generated with the cumulative data of three independent experiments; therefore, each survival curve contains data from 30 animals. The statistical analysis showed no differences across the WT, WTH1, and WTH2 strains (P=0.804), but the survival curves generated with the silenced strains were significantly different to that associated with WT strain (P<0.05). (B) CFUs isolated from larvae infected with the tested fungal strains. Upon the animal death was registered, CFUs present in the hemolymph were quantified by serial dilutions in plates containing YPD, pH 7.8, and incubated at 37°C. No significant differences were observed (P=0.566). Abbreviations: CFU, colony-forming unit; WT, wild type. |
We selected two mutant strains, HSS9 and HSS10, to ascertain the virulence of the fully silenced mutants and the WT strain to compare the fungal load and the cytokine levels in organs of infected mice using a systemic infection model, as detailed in the “Materials and methods” section. A significant reduction in the liver CFU of mice infected by both mutant strains was observed in comparison to the WT (Figure 8). Interestingly, similar to the results observed in G. mellonella, the fungal load was similar for either the WT or the mutant strains recovered from the spleen of infected mice (Figure 8). The levels of pro-inflammatory and anti-inflammatory cytokines, IFN-γ, IL-1β, and IL-10, respectively, showed no significant differences in both infected organs (Figure 9). Although not statistically significant differences were obtained, a reduction in the IFN-γ levels in the spleen of mice infected with the silenced strains could be observed (Figure 9). Altogether, these results show that the absence of N-linked glycans had a negative effect on the virulence of S. schenckii.
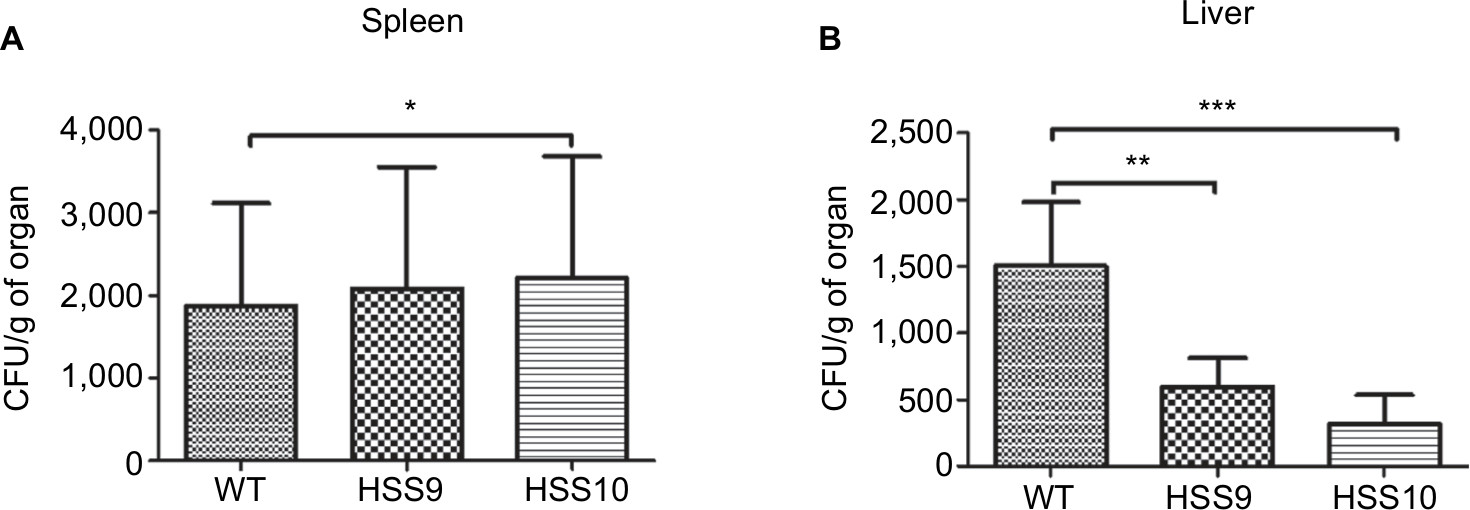 | Figure 8 Fungal burned in the liver and spleen of BALB/C female mice infected with the Sporothrix schenckii WT and mutant strains. Notes: Mice were infected intraperitoneally with 5×10⁶ yeast cells and after 15 days the liver (A) and spleen (B) were removed and homogenized to determine the CFUs. *P<0.05, **P<0.01, and ***P<0.001 when compared with the WT (1099-18 ATCC MYA 4821) strain. Abbreviations: CFU, colony-forming unit; WT, wild type. |
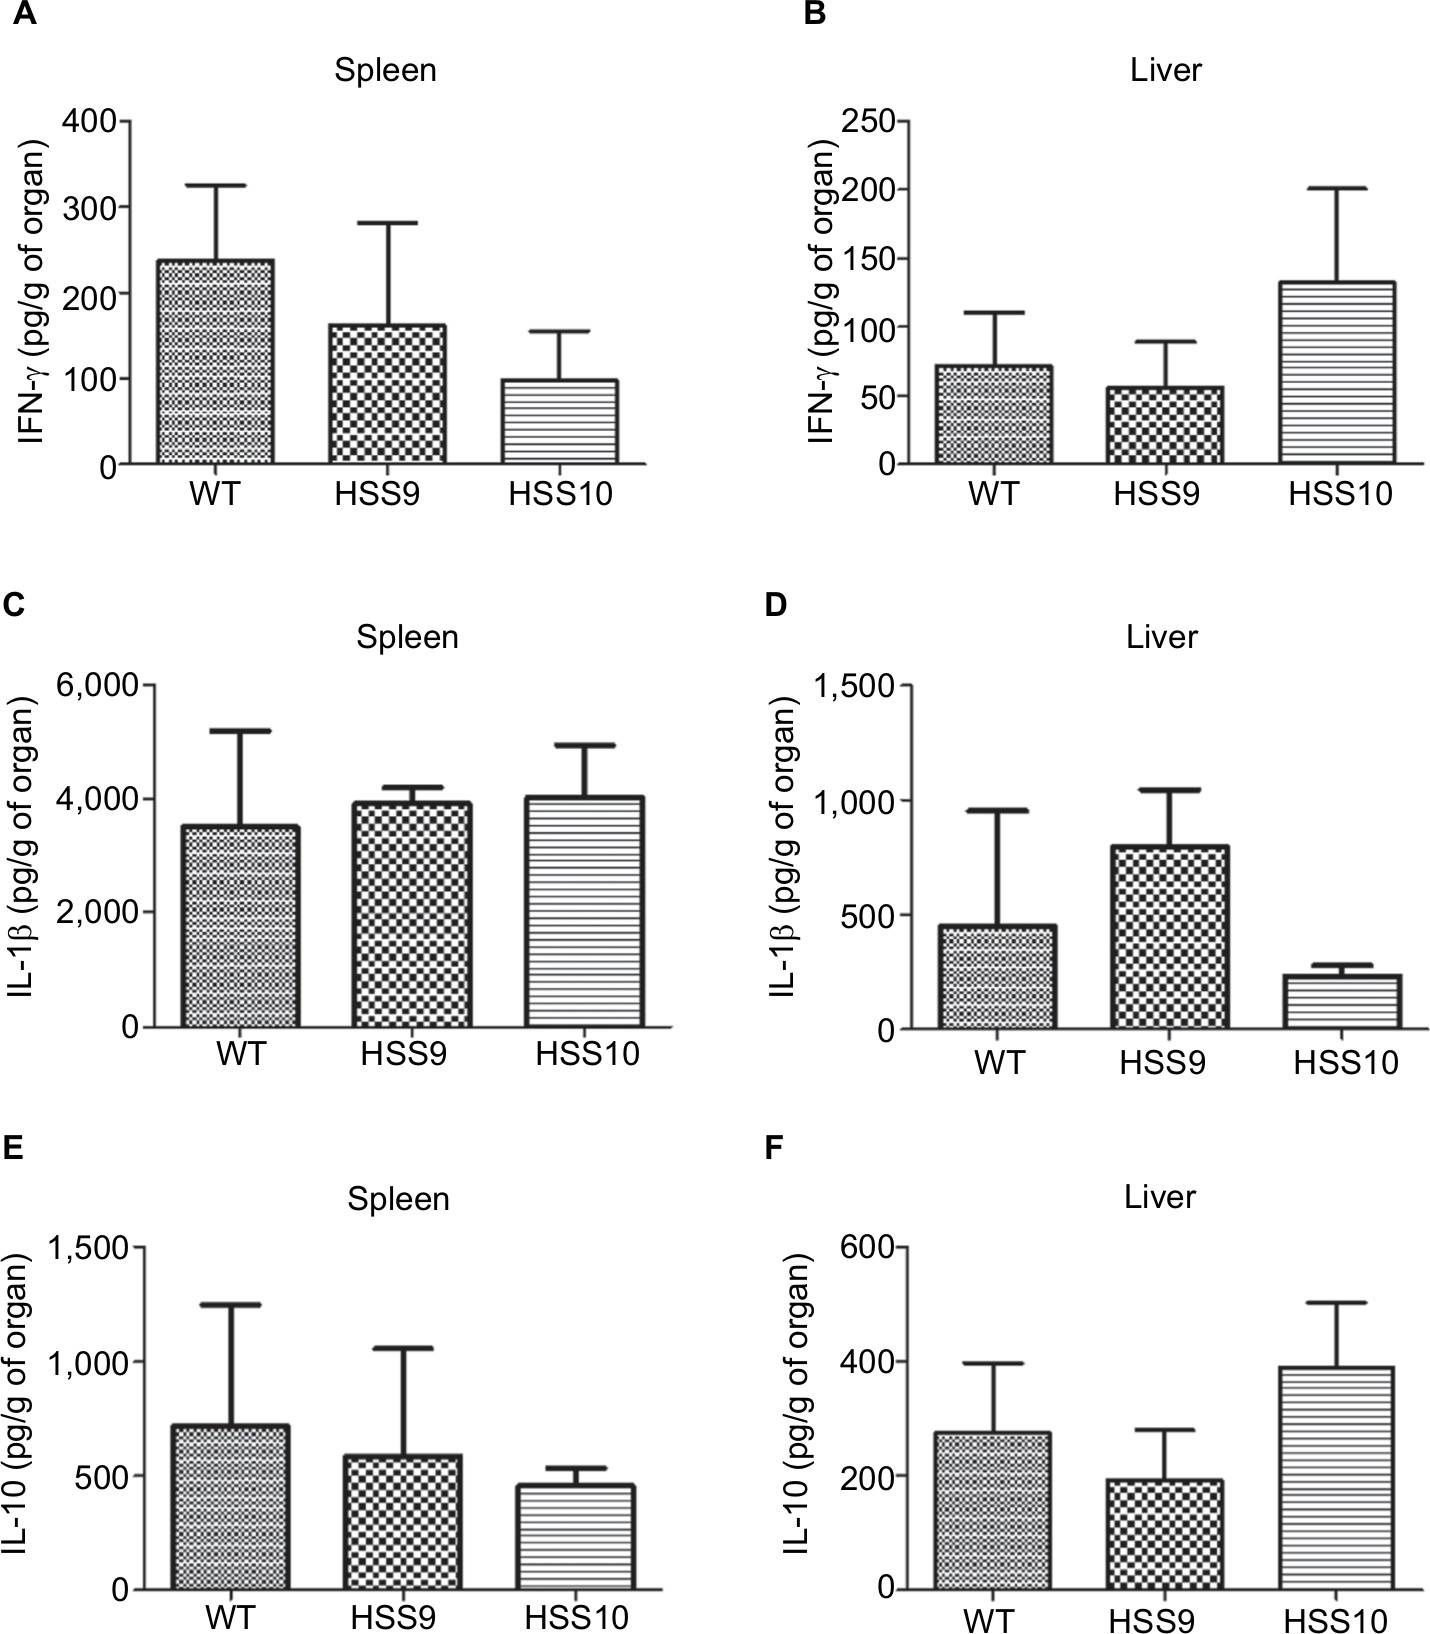 | Figure 9 Cytokine levels in supernatants of infected organs, liver, and spleen of BALB/C mice infected with the WT and the mutant strains. Notes: Homogenates of infected organs (liver and spleen) were centrifuged to remove intact cells and cell debris. The supernatants were collected and assayed by ELISA to determine the levels of IFN-γ (A and B), IL-1β (C and D), and IL-10 (E and F), respectively. No significant differences were observed. WT, strain 1099-18 ATCC MYA 4821. Abbreviation: WT, wild type. |
Discussion
Thus far, there is a limited progress in genetic studies in S. schenckii, probably due to the lack of a reproducible transformation system to overexpress or disrupt genes.5 Currently, the gene silencing technology is available for the study of this organism and only two reports dealing with the silencing of a calcium/calmodulin kinase and a histidine kinase involved in dimorphisms are available in the literature.58,59 In this study, we report the first silencing of a gene involved in S. schenckii N-linked glycosylation and assess the contribution of this metabolic pathway in the fitness of this organism and its role in the interaction with the host. Our results indicated that, as in A. fumigatus, the genome of S. schenckii contains a gene family that encodes for proteins with a significant degree of similarity to other Och1 proteins, which is named the OCH1 family. From this, OCH2, OCH3, and OCH4 failed to rescue the phenotype of an S. cerevisiae och1Δ null mutant, as reported in A. fumigatus.52 We currently do not have a proper explanation for this observation, but it is possible to suggest that at least one of these proteins could be the functional orthologous of S. cerevisiae HOC1, a protein involved in the elongation of the α-1,6-polymannose backbone of the N-linked glycans.18 In addition, as previously proposed,52 it is possible these proteins could participate in a mannosylation process bound to the plasma membrane to export glycoproteins to the cell wall. Further experiments are required to elucidate the function of all members of the OCH1 family. Even though we did not explore the insertion site of the binary plasmid in the selected strains, the similarity of the phenotype showed by strains HSS8–HSS11 makes unlikely any of the observed phenotypes could be associated with the insertion of the plasmid into the genome, supporting the idea that OCH1 silencing is behind the phenotypical changes. The growth, morphology, and dimorphism of these strains resembled the characteristics of the WT strain, suggesting that proper N-linked glycosylation is dispensable for cellular fitness and growth, as reported in A. fumigatus.20,52 However, this observation contrast with the phenotype reported for OCH1 mutants in S. cerevisiae, C. albicans, and Fusarium oxysporum f. sp. Cubense, where the cell fitness was strongly compromised.19,21,60 These data suggest that in S. schenckii and A. fumigatus the step controlled for Och1 during the N-linked glycosylation process may have alternative bypassing steps to overcome the loss of this protein. Alternatively, glycoproteins with a high content of mannose, ie, mannans, may not be the most abundant element in the cell wall of these organisms, and therefore, loss of Och1 has a minimal impact on the phenotype. Supporting this hypothesis, in A. fumigatus, glycans with an average of 50 mannose residues have been described and also contain a significant amount of galactose, which contrasts with the mannose-based glycans found in C. albicans and S. cerevisiae that can contain up to 200 sugar residues.18,61 Although in S. schenckii the common glycans found in the cell wall are composed of mannose and rhamnose,4,13 this explanation does not fit with our results, as significant levels of mannose are present in the S. schenckii cell wall and are about twice the content of rhamnose. One possible explanation for this is the presence of cell wall glycolipids with a glycan core composed only of mannose residues.62 Additional experiments are required to get more insights on this.
Our approach to analyzing the cell wall composition by HPAEC-PAD could not detect statistically significant changes in the content of glucan and chitin, although samples tended to have increased content of both polysaccharides, but the labeling with lectins indicated increased levels of glucan and chitin in the walls of strains HSS8–HSS11. The explanation to this discrepancy is that this was a subtle change in the wall composition that could only be detected by fluorescent microscopy because of its increased sensitivity when compared to HPAEC-PAD. Nonetheless, the silenced strains clearly showed changes in the wall composition and organization. The decreased content in rhamnose at the cell wall of strains HSS8–HSS11 can be explained by the fact that addition of rhamnose to glycans is a terminal event that requires a mannose-based glycan previously assembled.4,13 Interestingly, the defect in the N-linked elaboration positively affected the content of O-linked glycans at the cell wall of strains HSS8–HSS11. Thus far, this compensatory effect has not been reported in other mutants lacking Och1, and our explanation to this observation is that, since the N-linked glycans are shorter, it is possible that O-linked glycosylation sites that usually are covered by the structure of N-linked glycans are now accessible for protein mannosyltransferases to initiate the elaboration of these wall structures.
The OCH1 silencing led to a decreased ability to stimulate TNFα and IL-6 when the fungal cells were coincubated with human PBMCs, but they induced higher IL-10 levels compared to the WT control strain. These results provide, for the first time, an insight into the contribution of N-linked glycans during the Sporothrix–PMBCs interaction. We previously demonstrated that the removal of O-linked glycans from the cell wall did not affect the ability of yeast-like cells to stimulate cytokine production;11 therefore, it is unlikely the increased content of O-linked glycans in the cell wall of the silenced strains could have a role in the observed cytokine profile. Results here resembled our previous observation when anti-TLR2 antibodies were used to block this receptor during the yeast–human cell interaction, where reduced levels of TNFα and IL-6 were reported.11 Therefore, two hypotheses could be drawn to offer an explanation: both the TLR2 ligand and N-linked glycans collaborate in a costimulation pathway to induce the production of these cytokines, as reported in other systems;63,64 or the S. schenckii N-linked glycans are the ligand of TLR2 during the interaction. The latter is supported by the nature of the ligands that could trigger immune activation via TLR2 when mice are infected with surface antigens from S. schenckii.65 The increased production of IL-10 stimulated by the silenced strains could be associated with the increased exposure of β-1,3-glucan at the cell surface, as this wall component can directly signal the production of IL-10 when interacting with dectin-1.66 As in C. albicans and other Candida species, we found here that phagocytosis of yeast-like cells was dependent on proper N-linked glycosylation.22,23,42,46,49
The virulence attenuation observed in G. mellonella is unlikely to be related to the inability to adapt to the host milieu, as similar animal burdens were obtained from all the tested strains. Interestingly, the strain showing intermediate silencing of OCH1, HSS7, did not show any defect in the phenotypical characterization, but virulence attenuation in the Galleria model. Since only one strain with this degree of silencing was included in the study, we cannot discard the possibility that the virulence defect could be due to the insertional site of the binary vector.
According to the data generated in the invertebrate model of sporotrichosis, in the mouse model we also found attenuation in the virulence, as fungal burdens in the liver were reduced. However, this was not the case for the fungal cells infecting the spleen. One possible explanation is that the mutant cells are more susceptible to metabolites generated by hepatocytes, as part of the normal detoxification process performed in the liver. Alternatively, it could be possible the liver-resident immune cells are more efficient in controlling the mutant cells than those found in the spleen. Nonetheless, our data confirmed alterations in the host–S. schenckii interaction upon OCH1 silencing. Due to the heterogeneous nature of cell populations found in the murine spleen and liver, it is difficult to correlate the cytokine profile obtained from them with that using human PBMCs, and more studies using other types of immune cells are required to properly understand the immune response in these organs.
Conclusion
We report that OCH1 participates in the N-linked glycan elaboration in S. schenckii and its silencing impacts biological interactions with host effector cells and virulence.
Acknowledgments
We thank Prof Gordon Brown from the University of Aberdeen for the donation of the IgG Fc-Dectin-1 chimera. This work was supported by Consejo Nacional de Ciencia y Tecnología (ref. PDCPN2014-247109 and FC 2015-02-834), Universidad de Guanajuato (ref. 1025/2016; CIIC 95/2018), and Red Temática Glicociencia en Salud (CONACYT-México). LML-B is a research fellow of Conselho Nacional de Desenvolvimento Científico e Tecnológico (CNPq 307169/2015-4) and Fundação de Amparo a Pesquisa do Estado de São Paulo (FAPESP 2017/13722-5).
Disclosure
The authors report no conflicts of interest in this work.
References
de Beer ZW, Duong TA, Wingfield MJ. The divorce of Sporothrix and Ophiostoma: solution to a problematic relationship. Stud Mycol. 2016;83:165–191. | ||
Chakrabarti A, Bonifaz A, Gutierrez-Galhardo MC, Mochizuki T, Li S. Global epidemiology of sporotrichosis. Med Mycol. 2015;53(1):3–14. | ||
López-Romero E, Reyes-Montes MR, Pérez-Torres A, et al. Sporothrix schenckii complex and sporotrichosis, an emerging health problem. Future Microbiol. 2011;6(1):85–102. | ||
Lopes-Bezerra LM, Mora-Montes HM, Zhang Y, et al. Sporotrichosis between 1898 and 2017: the evolution of knowledge on a changeable disease and on emerging etiological agents. Med Mycol. 2018;56(Suppl 1):S126–S143. | ||
Mora-Montes HM, Dantas AS, Trujillo-Esquivel E, de Souza Baptista AR, Lopes-Bezerra LM. Current progress in the biology of members of the Sporothrix schenckii complex following the genomic era. FEMS Yeast Res. 2015;15(6):fov065. | ||
Madrid IM, Xavier MO, Mattei AS, et al. Role of melanin in the pathogenesis of cutaneous sporotrichosis. Microbes Infect. 2010;12(2):162–165. | ||
Teixeira PA, de Castro RA, Nascimento RC, et al. Cell surface expression of adhesins for fibronectin correlates with virulence in Sporothrix schenckii. Microbiology. 2009;155(Pt 11):3730–3738. | ||
Díaz-Jiménez DF, Pérez-García LA, Martínez-Álvarez JA, Mora-Montes HM. Role of the fungal cell wall in pathogenesis and antifungal resistance. Curr Fungal Infect Rep. 2012;6(4):275–282. | ||
Hernández-Chávez MJ, Pérez-García LA, Niño-Vega GA, Mora-Montes HM. Fungal strategies to evade the host immune recognition. J Fungi. 2017;3(4):E51:51. | ||
Lopes-Bezerra LM, Walker LA, Niño-Vega G, et al. Cell walls of the dimorphic fungal pathogens Sporothrix schenckii and Sporothrix brasiliensis exhibit bilaminate structures and sloughing of extensive and intact layers. PLoS Negl Trop Dis. 2018;12(3):e0006169. | ||
Martínez-Álvarez JA, Pérez-García LA, Mellado-Mojica E, et al. Sporothrix schenckii sensu stricto and Sporothrix brasiliensis are differentially recognized by human peripheral blood mononuclear cells. Front Microbiol. 2017;8:843. | ||
Previato JO, Gorin PAJ, Haskins RH, Travassos LR. Soluble and insoluble glucans from different cell types of the human pathogen Sporothrix schenckii. Exp Mycol. 1979;3(1):92–105. | ||
Lopes-Bezerra LM. Sporothrix schenckii cell wall peptidorhamnomannans. Front Microbiol. 2011;2:243. | ||
Lopes-Bezerra LM, Lozoya-Pérez NE, López-Ramírez LA, et al. Functional characterization of Sporothrix schenckii glycosidases involved in the N-linked glycosylation pathway. Med Mycol. 2015;53(1):60–68. | ||
Mora-Montes HM, Ponce-Noyola P, Villagómez-Castro JC, Gow NA, Flores-Carreón A, López-Romero E. Protein glycosylation in Candida. Future Microbiol. 2009;4(9):1167–1183. | ||
Hall RA, Bates S, Lenardon MD, et al. The Mnn2 mannosyltransferase family modulates mannoprotein fibril length, immune recognition and virulence of Candida albicans. PLoS Pathog. 2013;9(4):e1003276. | ||
Mora-Montes HM, Bates S, Netea MG, et al. A multifunctional mannosyltransferase family in Candida albicans determines cell wall mannan structure and host-fungus interactions. J Biol Chem. 2010;285(16):12087–12095. | ||
Martínez-Duncker I, Díaz-Jímenez DF, Mora-Montes HM. Comparative analysis of protein glycosylation pathways in humans and the fungal pathogen Candida albicans. Int J Microbiol. 2014;2014:1–16. | ||
Bates S, Hughes HB, Munro CA, et al. Outer chain N-glycans are required for cell wall integrity and virulence of Candida albicans. J Biol Chem. 2006;281(1):90–98. | ||
Kotz A, Wagener J, Engel J, et al. Approaching the secrets of N-glycosylation in Aspergillus fumigatus: characterization of the AfOch1 protein. PLoS One. 2010;5(12):e15729. | ||
Nakayama K, Nagasu T, Shimma Y, Kuromitsu J, Jigami Y. OCH1 encodes a novel membrane bound mannosyltransferase: outer chain elongation of asparagine-linked oligosaccharides. EMBO J. 1992;11(7):2511–2519. | ||
Cambi A, Netea MG, Mora-Montes HM, et al. Dendritic cell interaction with Candida albicans critically depends on N-linked mannan. J Biol Chem. 2008;283(29):20590–20599. | ||
Mckenzie CG, Koser U, Lewis LE, et al. Contribution of Candida albicans cell wall components to recognition by and escape from murine macrophages. Infect Immun. 2010;78(4):1650–1658. | ||
Netea MG, Gow NA, Munro CA, et al. Immune sensing of Candida albicans requires cooperative recognition of mannans and glucans by lectin and Toll-like receptors. J Clin Invest. 2006;116(6):1642–1650. | ||
Robledo-Ortiz CI, Flores-Carreón A, Hernández-Cervantes A, et al. Isolation and functional characterization of Sporothrix schenckii ROT2, the encoding gene for the endoplasmic reticulum glucosidase II. Fungal Biol. 2012;116(8):910–918. | ||
Trujillo-Esquivel E, Franco B, Flores-Martínez A, Ponce-Noyola P, Mora-Montes HM. Purification of single-stranded cDNA based on RNA degradation treatment and adsorption chromatography. Nucleosides Nucleotides Nucleic Acids. 2016;35(8):404–409. | ||
Hobson RP, Munro CA, Bates S, et al. Loss of cell wall mannosylphosphate in Candida albicans does not influence macrophage recognition. J Biol Chem. 2004;279(38):39628–39635. | ||
De Nobel JG, Klis FM, Munnik T, Priem J, Van den Ende H. An assay of relative cell wall porosity in Saccharomyces cerevisiae, Kluyveromyces lactis and Schizosaccharomyces pombe. Yeast. 1990;6(6):483–490. | ||
Hernández NV, López-Ramírez LA, Díaz-Jiménez DF, et al. Saccharomyces cerevisiae KTR4, KTR5 and KTR7 encode mannosyltransferases differentially involved in the N- and O-linked glycosylation pathways. Res Microbiol. 2017;168(8):740–750. | ||
Nakayashiki H, Hanada S, Nguyen BQ, Kadotani N, Tosa Y, Mayama S. RNA silencing as a tool for exploring gene function in ascomycete fungi. Fungal Genet Biol. 2005;42(4):275–283. | ||
Chen X, Stone M, Schlagnhaufer C, Romaine CP. A fruiting body tissue method for efficient Agrobacterium-mediated transformation of Agaricus bisporus. Appl Environ Microbiol. 2000;66(10):4510–4513. | ||
Lozoya-Pérez NE, Casas-Flores S, Martínez-Álvarez JA, et al. Generation of Sporothrix schenckii mutants expressing the green fluorescent protein suitable for the study of host-fungus interactions. Fungal Biol. 2018;122(10):1023–1030. | ||
Torres-Guerrero H. Ploidy study in sporothrix schenkii. Fungal Genet Biol. 1999;27(1):49–54. | ||
Livak KJ, Schmittgen TD. Analysis of relative gene expression data using real-time quantitative PCR and the 2(-Delta Delta C(T)) Method. Methods. 2001;25(4):402–408. | ||
Trujillo-Esquivel E, Martínez-Álvarez JA, Clavijo-Giraldo DM, et al. The Sporothrix schenckii gene encoding for the ribosomal protein L6 has constitutive and stable expression and works as an endogenous control in gene expression analysis. Front Microbiol. 2017;8:1676. | ||
Mora-Montes HM, Robledo-Ortiz CI, González-Sánchez LC, López-Esparza A, López-Romero E, Flores-Carreón A. Purification and biochemical characterisation of endoplasmic reticulum alpha1,2-mannosidase from Sporothrix schenckiil. Mem Inst Oswaldo Cruz. 2010;105(1):79–85. | ||
Mora-Montes HM, Bates S, Netea MG, et al. Endoplasmic reticulum alpha-glycosidases of Candida albicans are required for N glycosylation, cell wall integrity, and normal host-fungus interaction. Eukaryot Cell. 2007;6(12):2184–2193. | ||
Estrada-Mata E, Navarro-Arias MJ, Pérez-García LA, et al. Members of the Candida parapsilosis complex and Candida albicans are differentially recognized by human peripheral blood mononuclear cells. Front Microbiol. 2015;6:1527. | ||
Mora-Montes HM, Netea MG, Ferwerda G, et al. Recognition and blocking of innate immunity cells by Candida albicans chitin. Infect Immun. 2011;79(5):1961–1970. | ||
Graham LM, Tsoni SV, Willment JA, et al. Soluble Dectin-1 as a tool to detect beta-glucans. J Immunol Methods. 2006;314(1–2):164–169. | ||
Marakalala MJ, Vautier S, Potrykus J, et al. Differential adaptation of Candida albicans in vivo modulates immune recognition by dectin-1. PLoS Pathog. 2013;9(4):e1003315. | ||
Navarro-Arias MJ, Defosse TA, Dementhon K, et al. Disruption of protein mannosylation affects Candida guilliermondii cell wall, immune sensing, and virulence. Front Microbiol. 2016;7:7. | ||
Mora-Montes HM, Mckenzie C, Bain JM, Lewis LE, Erwig LP, Gow NA. Interactions between macrophages and cell wall oligosaccharides of Candida albicans. Methods Mol Biol. 2012;845:247–260. | ||
Dubois M, Gilles KA, Hamilton JK, Rebers PA, Smith F. Colorimetric method for determination of sugars and related substances. Anal Chem. 1956;28(3):350–356. | ||
Endres S, Ghorbani R, Lonnemann G, van der Meer JW, Dinarello CA. Measurement of immunoreactive interleukin-1 beta from human mononuclear cells: optimization of recovery, intrasubject consistency, and comparison with interleukin-1 alpha and tumor necrosis factor. Clin Immunol Immunopathol. 1988;49(3):424–438. | ||
Pérez-García LA, Csonka K, Flores-Carreón A, et al. Role of protein glycosylation in Candida parapsilosis cell wall integrity and host interaction. Front Microbiol. 2016;7:306. | ||
Abrams WR, Diamond LW, Kane AB. A flow cytometric assay of neutrophil degranulation. J Histochem Cytochem. 1983;31(6):737–744. | ||
Santos EO, Azzolini AE, Lucisano-Valim YM. Optimization of a flow cytometric assay to evaluate the human neutrophil ability to phagocytose immune complexes via Fcγ and complement receptors. J Pharmacol Toxicol Methods. 2015;72:67–71. | ||
González-Hernández RJ, Jin K, Hernández-Chávez MJ, et al. Phosphomannosylation and the Functional Analysis of the Extended Candida albicans MNN4-Like Gene Family. Front Microbiol. 2017;8:2156. | ||
Hernández-Chávez MJ, Franco B, Clavijo-Giraldo DM, Hernández NV, Estrada-Mata E, Mora-Montes HM. Role of protein phosphomannosylation in the Candida tropicalis-macrophage interaction. FEMS Yeast Res. 2018;18(5). | ||
Clavijo-Giraldo DM, Matínez-Alvarez JA, Lopes-Bezerra LM, et al. Analysis of Sporothrix schenckii sensu stricto and Sporothrix brasiliensis virulence in Galleria mellonella. J Microbiol Methods. 2016;122:73–77. | ||
Lambou K, Perkhofer S, Fontaine T, Latge JP. Comparative functional analysis of the OCH1 mannosyltransferase families in Aspergillus fumigatus and Saccharomyces cerevisiae. Yeast. 2010;27(8):625–636. | ||
Teixeira MM, de Almeida LG, Kubitschek-Barreira P, et al. Comparative genomics of the major fungal agents of human and animal Sporotrichosis: Sporothrix schenckii and Sporothrix brasiliensis. BMC Genomics. 2014;15:943. | ||
Bates S, Hall RA, Cheetham J, et al. Role of the Candida albicans MNN1 gene family in cell wall structure and virulence. BMC Res Notes. 2013;6:294. | ||
Bates S, Maccallum DM, Bertram G, et al. Candida albicans Pmr1p, a secretory pathway P-type Ca2+/Mn2+-ATPase, is required for glycosylation and virulence. J Biol Chem. 2005;280(24):23408–23415. | ||
López-Ramírez LA, Hernández NV, Lozoya-Pérez NE, Lopes-Bezerra LM, Mora-Montes HM. Functional characterization of the Sporothrix schenckii Ktr4 and Ktr5, mannosyltransferases involved in the N-linked glycosylation pathway. Res Microbiol. 2018;169(3):188–197. | ||
Gow NA, Netea MG, Munro CA, et al. Immune recognition of Candida albicans beta-glucan by dectin-1. J Infect Dis. 2007;196(10):1565–1571. | ||
Rodriguez-Caban J, Gonzalez-Velazquez W, Perez-Sanchez L, Gonzalez-Mendez R, Rodriguez-del Valle N. Calcium/calmodulin kinase1 and its relation to thermotolerance and HSP90 in Sporothrix schenckii: an RNAi and yeast two-hybrid study. BMC Microbiol. 2011;11:162–162. | ||
Zhang Z, Hou B, Wu YZ, Wang Y, Liu X, Han S. Two-component histidine kinase DRK1 is required for pathogenesis in Sporothrix schenckii. Mol Med Rep. 2018;17(1):721–728. | ||
Li MH, Xie XL, Lin XF, et al. Functional characterization of the gene FoOCH1 encoding a putative α-1,6-mannosyltransferase in Fusarium oxysporum f. sp. cubense. Fungal Genet Biol. 2014;65:1–13. | ||
Latgé JP, Beauvais A, Chamilos G. The cell wall of the human fungal pathogen Aspergillus fumigatus: biosynthesis, organization, immune response, and virulence. Annu Rev Microbiol. 2017;71(1):99–116. | ||
Loureiro Y Penha CV, Todeschini AR, Lopes-Bezerra LM, et al. Characterization of novel structures of mannosylinositolphosphorylceramides from the yeast forms of Sporothrix schenckii. Eur J Biochem. 2001;268(15):4243–4250. | ||
Dennehy KM, Ferwerda G, Faro-Trindade I, et al. Syk kinase is required for collaborative cytokine production induced through Dectin-1 and Toll-like receptors. Eur J Immunol. 2008;38(2):500–506. | ||
Netea MG, Brown GD, Kullberg BJ, Gow NA. An integrated model of the recognition of Candida albicans by the innate immune system. Nat Rev Microbiol. 2008;6(1):67–78. | ||
Tdc N, Ferreira LS, Alegranci P, et al. Role of TLR-2 and fungal durface antigens on innate immune response against Sporothrix schenckii. Immunol Investigat. 2013;42(1):36–48. | ||
Reid DM, Gow NA, Brown GD. Pattern recognition: recent insights from Dectin-1. Curr Opin Immunol. 2009;21(1):30–37. | ||
Castro RA, Kubitschek-Barreira PH, Teixeira PA, et al. Differences in cell morphometry, cell wall topography and gp70 expression correlate with the virulence of Sporothrix brasiliensis clinical isolates. PLoS One. 2013;8(10):e75656. | ||
EUROPEAN SACCHAROMYCES CEREVISIAE ARCHIVE FOR FUNCTIONAL ANALYSIS [homepage on the Internet]. Available from: http://www.euroscarf.de/index.php?name=News. Accessed December 17, 2018. |
Supplementary materials
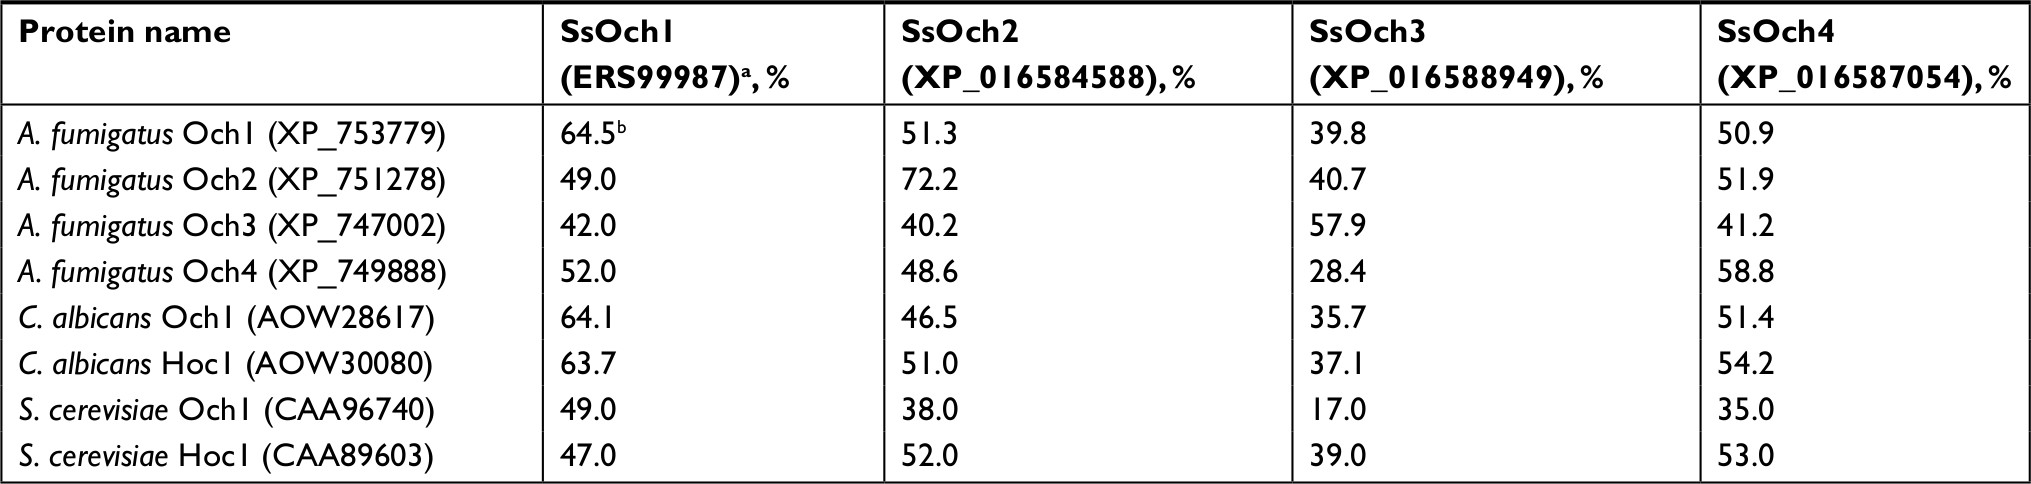 | Table S1 Comparison of members of the Sporothrix schenckii OCH1 family to α-1,6-mannosyltransferases belonging to family 32 found in Aspergillus fumigatus, Candida albicans, and Saccharomyces cerevisiae Notes: aGenBank accession codes are provided between brackets. bSimilarity when both amino acid sequences are compared. |
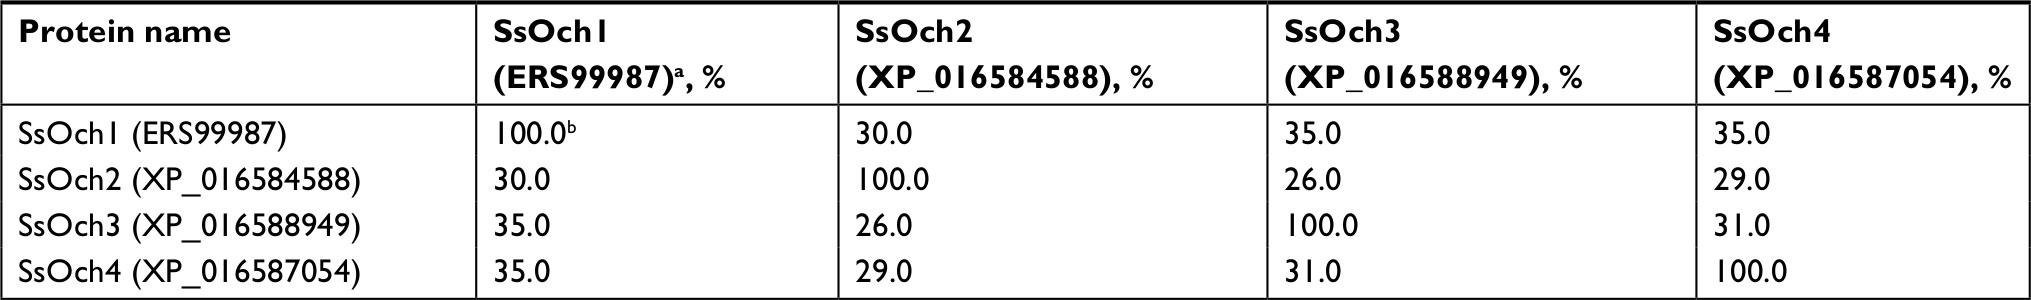 | Table S2 Comparison among members of the Sporothrix schenckii OCH1 family Notes: aGenBank accession codes are provided between brackets. bSimilarity when both putative amino acid sequences are compared. |
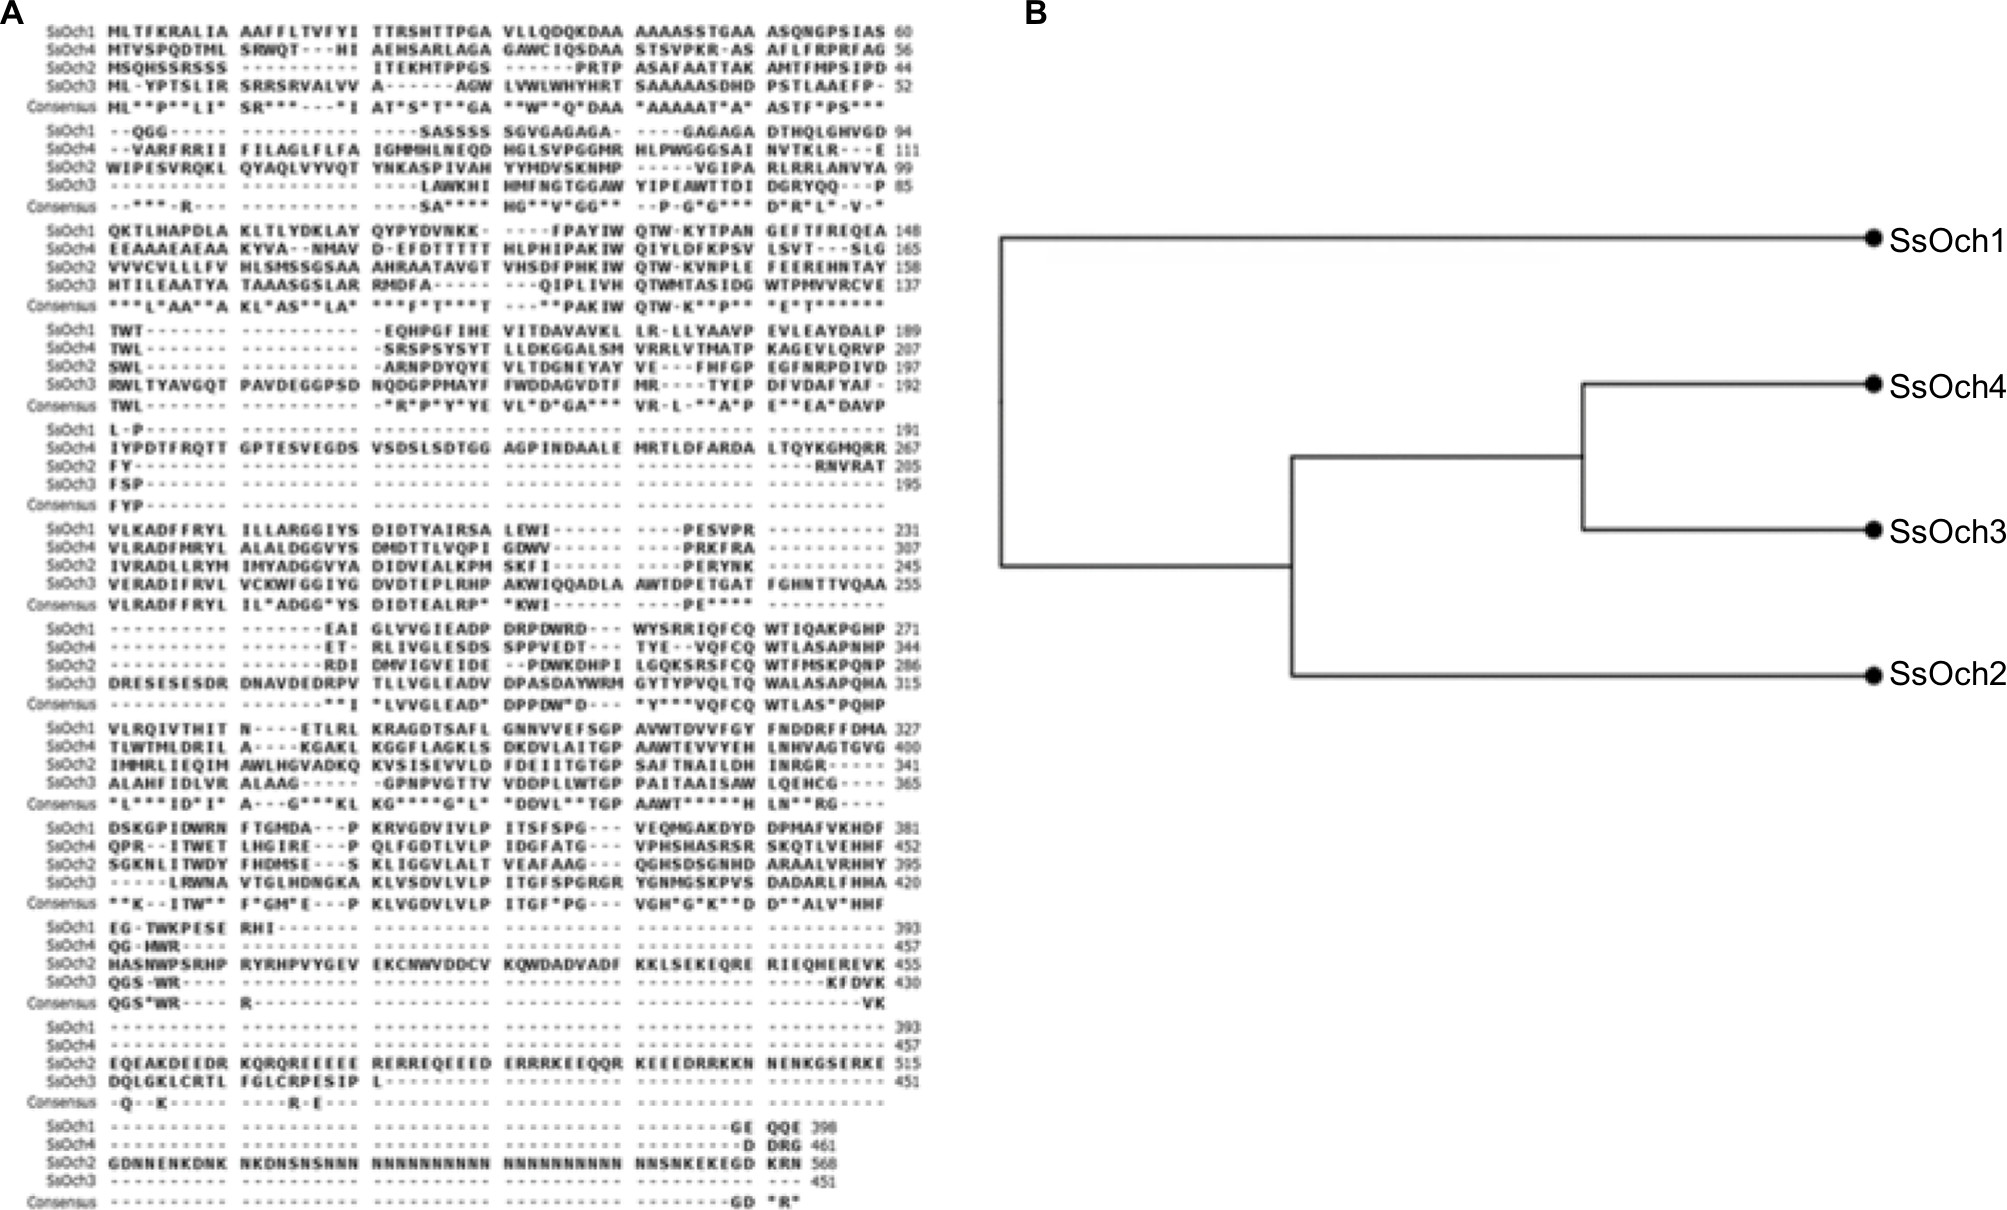 | Figure S1 Comparison of the proteins encoded by members of the Sporothrix schenckii OCH1 gene family. Notes: (A) Multiple sequence alignment generated with the CLC Sequence Viewer 7.8 using the following protein sequences retrieved from www.ncbi.nlm.nih.gov: ERS99987 (SsOch1), XP_016584588 (SsOch2), XP_016588949 (SsOch3), and XP_016587054 (SsOch4). The predicted consensus sequence is provided below each alignment. (B) Unrooted cladogram generated using the Neighbor-joining tree without distance correction algorithm. The same software and sequences defined in (A) were used to generate the tree. The SsOch1 is the most distant protein among the proteins encoded by members of the OCH1 gene family. |
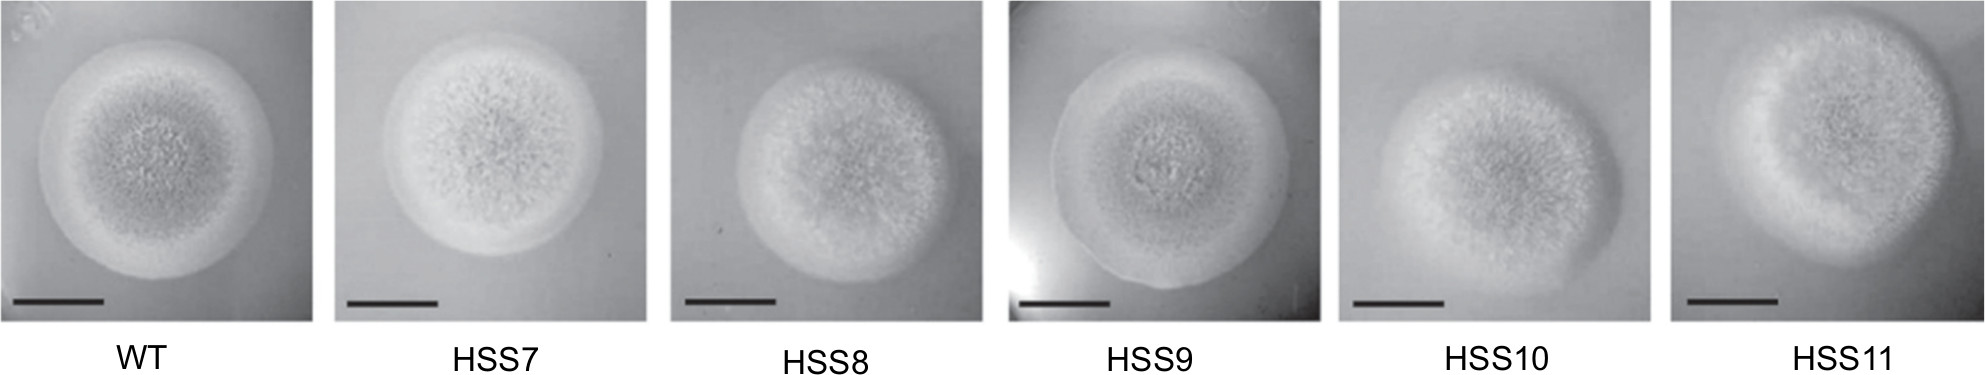 | Figure S2 Colony morphology of OCH1-silenced and WT strains. Notes: Cells were grown on plates containing YPD, pH 4.5, for 6 days at 28°C before the images were obtained. WT, strain 1099-18 ATCC MYA 4821. Scale bars=1 cm. Abbreviation: WT, wild type. |
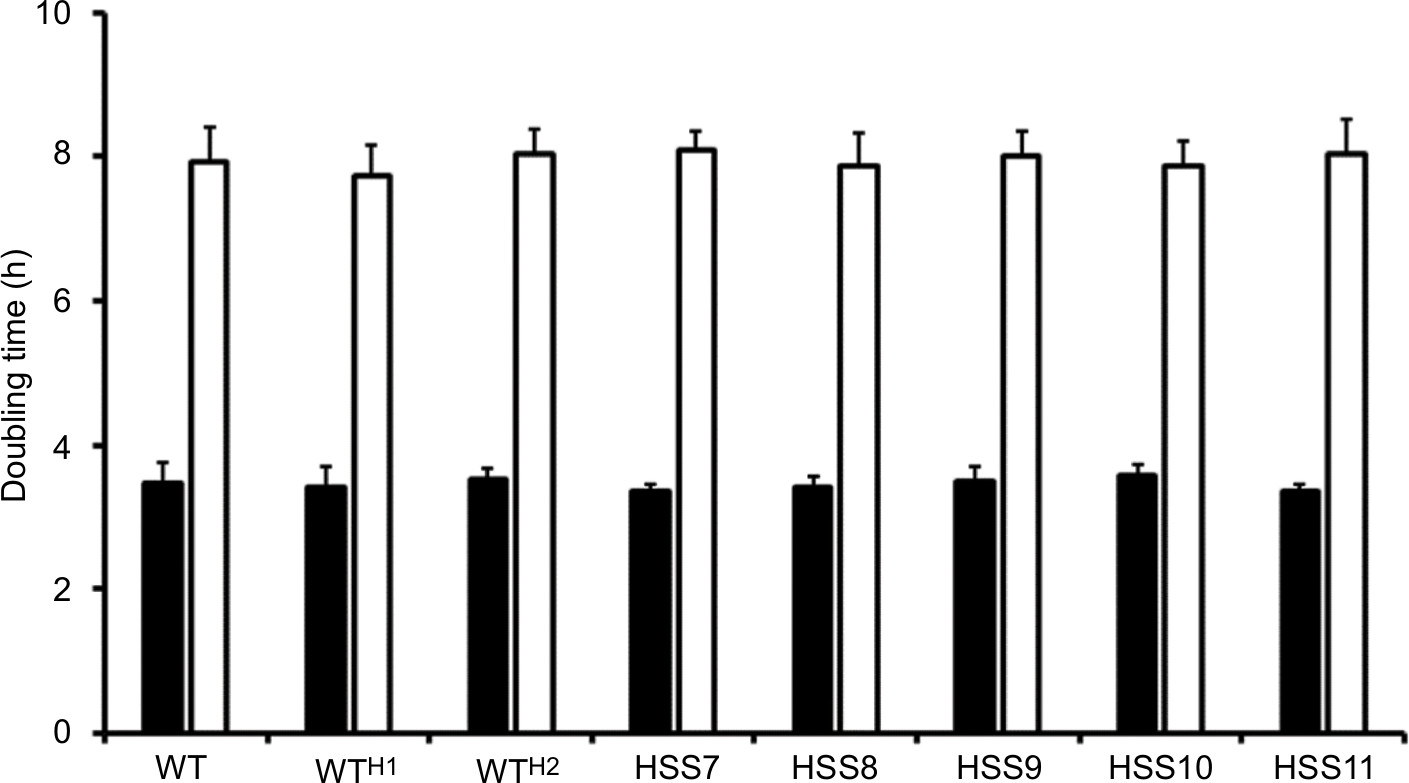 | Figure S3 Doubling time of OCH1-silenced and control strains. Notes: Growth curves of mycelia in YPD, pH 4.5, were generated by determining the culture dry weight every 120 minutes, and from this, the doubling time was calculated (closed bars). Yeast-like cells were propagated in YPD, pH 7.8, and cell density was estimated by counting in a Neubauer hemocytometer. From the generated growth curve, the doubling time was estimated (open bars). The strains used are 1099-18 ATCC MYA 4821 (WT), HSS12 (WTH1), and HSS13 (WTH2). Abbreviations: h, hours; WT, wild type. |
 © 2018 The Author(s). This work is published and licensed by Dove Medical Press Limited. The full terms of this license are available at https://www.dovepress.com/terms.php and incorporate the Creative Commons Attribution - Non Commercial (unported, v3.0) License.
By accessing the work you hereby accept the Terms. Non-commercial uses of the work are permitted without any further permission from Dove Medical Press Limited, provided the work is properly attributed. For permission for commercial use of this work, please see paragraphs 4.2 and 5 of our Terms.
© 2018 The Author(s). This work is published and licensed by Dove Medical Press Limited. The full terms of this license are available at https://www.dovepress.com/terms.php and incorporate the Creative Commons Attribution - Non Commercial (unported, v3.0) License.
By accessing the work you hereby accept the Terms. Non-commercial uses of the work are permitted without any further permission from Dove Medical Press Limited, provided the work is properly attributed. For permission for commercial use of this work, please see paragraphs 4.2 and 5 of our Terms.