")
Back to Journals » OncoTargets and Therapy » Volume 14
Silencing of MicroRNA-503 in Rat Mesenchymal Stem Cells Exerts Potent Antitumorigenic Effects in Lung Cancer Cells
Authors Huang B, Feng Z, Zhu L, Zhang S, Duan J, Zhao C, Zhang X
Received 17 September 2020
Accepted for publication 16 December 2020
Published 6 January 2021 Volume 2021:14 Pages 67—81
DOI https://doi.org/10.2147/OTT.S282322
Checked for plagiarism Yes
Review by Single anonymous peer review
Peer reviewer comments 3
Editor who approved publication: Dr Sanjay Singh
Bo Huang,1,* Zhichun Feng,2,3,* Lina Zhu,2 Sheng Zhang,2,3 Jun Duan,4 Chaochao Zhao,1 Xiaoying Zhang1,2
1Public Health, Guilin Medical University, Guilin 541100, People’s Republic of China; 2Affiliated BaYi Children’s Hospital, Seventh Medical Center of PLA General Hospital, Beijing 100700, People’s Republic of China; 3Beijing Key Laboratory of Pediatric Organ Failure, Beijing 100700, People’s Republic of China; 4Department of Pediatrics, The First Affiliated Hospital of Anhui Medical University, Hefei 230022, People’s Republic of China
*These authors contributed equally to this work
Correspondence: Xiaoying Zhang
Public Health, Guilin Medical University, 1 Zhiyuan Road, Lingui District, Guilin 541100, People’s Republic of China
Tel/Fax +86773-3680605
Email [email protected]
Purpose: Mesenchymal stem cells (MSCs) are largely studied for their potential clinical use. Recently, there has been gained further interest in the relationship between MSCs and tumorigenesis. MSCs are reported to both promote and abrogate tumor growth. The present study was designed to investigate whether miRNAs are involved in the interactions between MSCs and tumor cells in the tumor microenvironment.
Materials and Methods: Rat bone marrow-derived MSCs (rMSCs) were cultured with or without tumor-conditioned medium (TCM) to observe the effect upon MSCs by TCM. Microarrays and real-time PCR were performed between the two groups. A series of experiments were used to reveal the functional significance of microRNA-503 (miR-503) in rMSCs. Furthermore, the antitumorigenic effect of silencing of miR-503 in rMSCs (miR-503-i-rMSCs) in vivo was measured.
Results: We found that rMSCs in vitro exhibited tumor-promoting properties in TCM, and the microRNA profiles of rMSCs were significantly altered in TCM. However, miR-503-i-rMSCs can decrease the angiogenesis and growth of A549 cells. We also demonstrated in an in vivo tumor model that miR-503-i-rMSCs inhibited A549 tumor angiogenesis and significantly abrogated tumor initiation and growth. CD133 assays in peripheral blood and A549 xenografts further validated that miR-503-i-rMSCs, rather than rMSCs, exerted an antitumorigenic action in the A549 tumor model.
Conclusion: Our results suggest that miR-503-i-rMSCs are capable of tumor suppression. Further studies are required to develop clinical therapies based on the inhibition of the tumor-promoting properties and potentiation of the anti-tumor properties of MSCs.
Keywords: mesenchymal stem cells, microRNA-503, tumor-conditioned medium, tumor angiogenesis
Introduction
Mesenchymal stem cells (MSCs) have been found in a variety of adult tissues in our body, such as the bone marrow, adipose tissue, lung, peripheral blood, umbilical cord blood, placenta, and fetal tissues, which are capable of differentiating into multiple lineages that are easily isolated and propagated, this makes MSCs an attractive choice for use as cellular therapeutic agents.1,2 The MSC research field has expanded rapidly, and more and more attention is being paid to the relationship between stem cells and tumor cells. Experimental evidence indicates that MSCs can home to sites of tumorigenesis and inhibit tumor cell function.3,4 On the other hand, there is growing evidence that MSCs can support tumor growth and the development of metastasis in vitro and in vivo,5 and can also act as a target for neoplastic transformation.6 These conflicting data suggest that MSC function can vary in the tumor microenvironment, depending on genetic, epigenetic, and/or environmental effects.7 Thus, it will be important to elucidate details of the interactions between tumor cells and MSCs in the tumor microenvironment, and determine how MSCs might act as an anti-tumor agent to suppress tumors growth.
MicroRNAs (miRNAs) are evolutionarily conserved, endogenous noncoding RNAs that play critical roles in gene regulation.8,9 Recent studies have implicated a role for miRNAs in stem cells, and alterations in miRNA levels have been shown to influence stem cell fate, including self-renewal and differentiation.10,11 The present study was designed to investigate whether miRNAs are involved in the interactions between MSCs and tumor cells in the tumor microenvironment. Specifically, our aims were to determine whether tumor cells and the tumor microenvironment were capable of decreasing the intrinsic antitumor properties and/or increasing the intrinsic tumor-promoting properties of MSCs, and to establish the true role of MSCs in tumorigenesis. Surprisingly, we found that although rat MSCs (rMSCs) could promote tumor growth, silencing of miR-503 in rMSCs could instead exert a profound antitumorigenic effect on a lung tumor cell line (A549), and mediated through inhibition of tumor angiogenesis and tumor growth.
Materials and Methods
Cells
MSCs were obtained from femoral bone marrow from Wistar rat (3–4 weeks old males, purchased from the Chinese Academy of Sciences). These rMSCs were isolated, cultured and identified as we previously described.12,13 The protocol was approved by the Seventh Medical Center of PLA General Hospital Ethics Committee. These rMSCs were proven to be positive for CD73, CD44, CD90, CD166, and CD29, and negative for CD14, CD34, CD45, and also can differentiate into fat, bone, and cartilage in conditional medium (Figure S1). And these rMSCs were cultured in F12 medium with 10% fetal bovine serum (FBS, Gibco-BRL, NY, USA) as we previously reported. A549 (Human lung adenocarcinoma epithelial cell line, purchased from Institute of Basic Medical Sciences Chinese Academy of Medical Sciences) cells were cultured in 1640 (Gibco-BRL, NY, USA), with 10% FBS at 37°C in 5% CO2.
Exposure of MSCs to TCM
A549 cells were cultured in 1640 with 10% FBS culture medium and the tumor-conditioned medium (TCM) from A549 cells was harvested after 16 h and centrifuged at 3000 rpm for 5 min and supernatant was passed through 0.22 μm membrane (Millipore). MSCs were exposed to fresh TCM repeatedly and the TCM was changed every twice day.
Antibodies
Antibodies to Ki67 (Bioworld), MMP-3 (Bioworld), IGF-1 (Bioworld), SDF-1 (Bioworld), and VEGF (Bioworld) and CD133 (Boster) were used for immunohistochemistry or immunofluorescence. PE-conjugated anti-mouse CD133 antibody (eBioscience), PE-conjugated isotypic-matched antibody (Biolegend) were used for flow cytometric analysis.
miRNAs Mimics and miRNA Inhibitors
RNA strands: miRNA mimics (miR-503, miR-nc) and miRNA inhibitors, including antisense strands (AS) for miR-503 (miR-503 AS), AS for miR-nc (miR-nc AS), were purchased from GenePharma. Sequences were listed in Table S1.
Vectors
PGCMV-EGFP-rno-miR-503 (p-miR-503), and pGCMV-EGFP-rno-miR-nc (p-miR-nc) were miRNA expressing vectors, whereas, pGPU6-rno-miR-503 (pGPU6-miR-503) and pGPU6-miR-nc were miRNA blocking vector, these vectors were purchased from GenePharma.
Reverse Transcription Reaction and Quantitative Real-time PCR
Total RNAs were purified with the Absolutely RNA Nanoprep kit (Stratagene, Amsterdam, The Netherlands). Reverse transcription (RT) reactions and quantitative real-time PCR were carried out as we previously described.8,14 The 2−ΔΔCT method was used to calculate gene expression. The relative levels of miRNA and mRNA were normalized to U6 and β-actin (rat) or GAPDH (human), respectively. Primers were listed in Table S1.
Transient Transfection
Transfections were performed using a Lipofectamine 2000 kit (Invitrogen, CA, USA) according to the manufacturer’s instructions and our previous report.8,14
Microarray Experiments and Data Analysis
miRNA expression analyses were performed using an Affymetrix Gene-Chip miRNA Array (Affymetrix, Santa Clara, California) according to the manufacturer’s instructions and our previous report.15 Transcripts expression analysis was performed using an Agilent Expression Array (Agilent Technologies, USA, V2, G2519F/28,282) according to the manufacturer’s instructions. The data images processed with GenePix pro 6.1 software (Molecular Devices, USA), and the data normalized using Agilent_Analyze_V1.0 software (Agilent Technologies, USA). Only genes exhibiting expression level changes of 1.5-fold or more in treated cells, as compared with the respective control cell population, were considered as showing altered expression levels.
Capillary Growth
Capillary-like structures were generated by using matrigel (BD Bioscience) as described previously.16 In brief, matrigel was added to 96-well culture plates (50 μL/well), then 100 mL cells (rMSCs, or A549 cells, 3 ×10⁴ cells per well) in different supernatant were seeded on the matrigel coated wells. Capillary-like tube formation was observed after 6-h incubation and was quantified by counting the number of cell junctions and tubes in 10 randomly chosen fields using Metamorph software (Microvision Instruments, Evry, France).
Measurement of Cell Proliferation
Cells with or without miRNA transfection were seeded in 96-well plates. Assessment of cell proliferation was measured with a proliferation kit (XTT, Boehringer Mannheim, Germany) as we previously described.8 Optical density was read with a microplate reader (BIO-RAD) 4 hours later.
Measurement of Cell Apoptosis by Flow Cytometry
Cells transiently transfected with miRNA were plated in 6-well plates with or without TCM medium, then the cells’ apoptosis was measured by ApopNexinTM FITC Apoptosis Detection Kit (APT750, Millipore, Temecula, CA) as we previously described.8 Briefly, cells were harvested, washed and resuspended in 1× bind buffer. Then, cell samples added annexin conjugate ApopNexin TM FITC and PI solution, mixed and incubated for 15 mins. Fluorescence due to FITC and PI staining was measured in a flow cytometer (Cytomics FC 500, Beckman Coulter, Brea, CA).
Immunofluorescence
Cells were incubated with antibodies against CD133, matrix metalloproteinase (MMP)-3, insulin-like growth factor (IGF)-1, stromal cell-derived factor (SDF)-1, or vascular endothelial growth factor (VEGF) (1:50) as the primary antibody. A goat anti-rabbit IgG conjugated with FITC (Jackson ImmunoResearch) was used as the secondary antibody at a dilution of 1:200. Samples were counterstained with Hoechst 33,258 and photographed using a confocal microscope (Nikon, C1 Si, Japan).
Immunohistochemistry
Immunohistochemistry was performed according to the standard procedure. Briefly, mouse xenografts samples were washed, fixed, embedded in paraffins and sectioned into 4-μm thick. After deparaffinization and rehydration, sections were blocked and then incubated with antibodies against Ki67, MMP-3, IGF-1, SDF-1, VEGF or CD133 (1:100) as the primary antibody, and then with biotinylated secondary antibody (1:200).
Animal Model
Male athymic nude mice were purchased from the Chinese Military Medicine Academy (Beijing, China). Mice aged 3–4 weeks (mean weight, 20 g) were maintained in a pathogen-free facility and used in accordance with the recommendations outlined in the Guide for the Care and Use of Laboratory Animals of the National Institutes of Health. The protocol was approved by the Seventh Medical Center of PLA General Hospital Ethics Committee. The animals were divided randomly into 6 groups, to receive subcutaneous injections into the dorsal surface of differing cells mixtures into the nape region: (I) phosphate-buffered saline (PBS) without any cells; (II) rMSCs cells (3×10⁶) alone; (III) A549 cells (3×10⁶) alone; (IV) rMSCs (3×10⁵ cells) plus A549 cells (3×10⁶); (V) rMSCs transfected with p-miR-503 (miR-503-rMSCs, 3×10⁵) plus A549 cells (3×10⁶); (VI) rMSCs transfected with pPGU6-miR-503 (miR-503-i-rMSCs,3×105) plus A549 cells (3×10⁶). For groups II–VI, the cells were suspended in 100 µL of 50% Matrigel. At two weeks post-injection, the animals were euthanized with intraperitoneal sodium pentobarbital, and the tumor xenografts excised for measurement, fixation and experimental analysis.
Measurement of CD133 by Flow Cytometry
Peripheral blood of athymic nude mice was collected in a tube containing EDTA by orbital sinus under anesthesia. Before flow cytometric analysis, red blood cells (RBCs) were removed from the peripheral blood with an RBC lysis buffer (Sigma). Cells were resuspended in PBS containing 2% FBS and stained for 30 minutes on ice with either phycoerythrin (PE)-conjugated anti-mouse CD133 antibody or PE-conjugated isotypic-matched antibody. Fluorescence due to staining with PE was measured using a flow cytometer (Cytomics FC 500, Beckman Coulter).
Statistical Analysis
All the data were expressed as the mean ± standard deviation. Student’s t-test was used for comparisons between two groups. Analysis of variance (ANOVA), with either the least significant difference (LSD; homogeneity of variance) or Tamhane’s T2 (unequal variance) post hoc test, was employed for multiple comparisons. The statistical significance level was set at p < 0.05.
Results
Effect of Tumor-Conditioned Medium on rMSCs in vitro
Recent studies have demonstrated that when exposed to tumor-conditioned medium (TCM) from breast cancer cells, MSCs assume a carcinoma-associated fibroblasts (CAF)-like myofibroblastic phenotype, and exhibit functional properties of CAFs.17,18 Furthermore, CAFs have been reported to contribute to the progression of tumors toward malignant phenotypes.17,18 Consistent with these data, we found significantly increased expression levels of genes for various CAF markers,18 including α-SMA, FAP, FSP and TNC in rMSCs exposed for 7 days to TCM from A549 cells, as compared with control rMSCs (Figure 1A). There were no significant differences in the expression of CAF markers between rMSCs with and without exposure to TCM for 24 hours (Figure 1A).
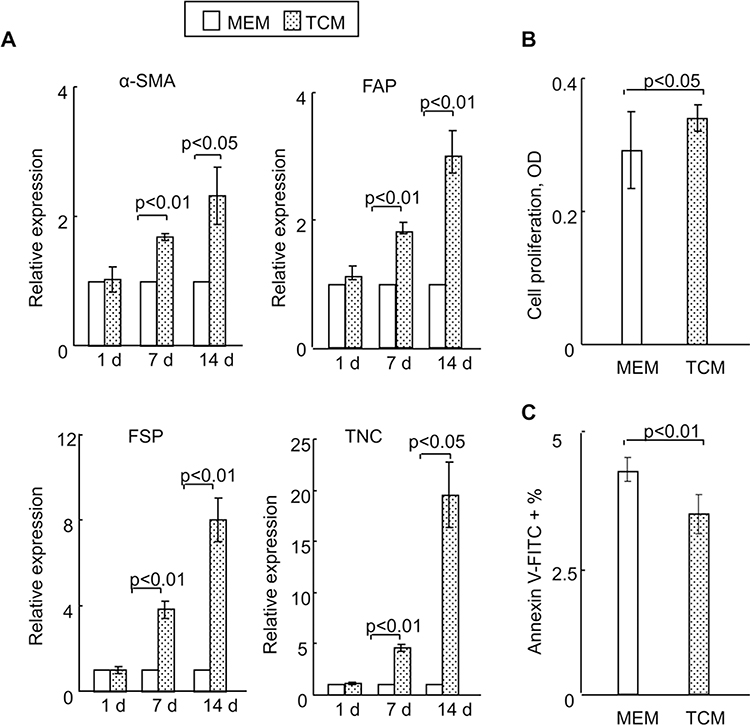 |
Figure 1 Effect of TCM on rMSCs in vitro. (A) Relative mRNA expressions of carcinoma-associated fibroblast (CAF)-related genes in MSCs, with or without exposure to TCM for 24 hours, were detected using real-time PCR. (B) The TCM had a significant effect on cell proliferation as assessed by XTT (2–3-bis(2-methoxy-4-nitro-5-sulfophenyl)-5-[(phenylamino)carbonyl]-2H-tetrazolium hydroxide), 24 hours after exposure. (C) The TCM also affected cell apoptosis, as analyzed using flow cytometry. Exposure time: 24 hours. All data are shown as the mean ± standard deviation based on three independent experiments. |
To determine the gene expression profile associated with the initiation of rMSCs transformation in a tumor microenvironment, microarray studies were used to compare gene expression levels between rMSCs with or without exposure to TCM for 24 hours. There were 555 up-regulated and 510 down-regulated genes in rMSCs exposed to TCM for 24 hours (Table S2), the top 15 up-regulated genes were OLR1142, CCL20, HTR3B, IL1B, LOC683206, CXCL2, CXCL3, LOC100910497, CXCL1, ASS1, CCL7, CCL2, PLA2G2A, DRD1, and MMP-3. Thus, despite there being no significant changes in the expressions of CAF markers after 24 hours of exposure to TCM, the levels of tumor-promoting factors (such as CCL20, IL1β, CXCL2, CXCL3, CXCL1, CCL7, CCL2, MMP-3) were greatly elevated. Three pathways were identified that were enriched in genes induced by exposure of rMSCs to TCM for 24 hours, namely NOD-like receptor signaling pathway, p53 signaling pathway, and Neurotrophin signaling pathway (Table 1).
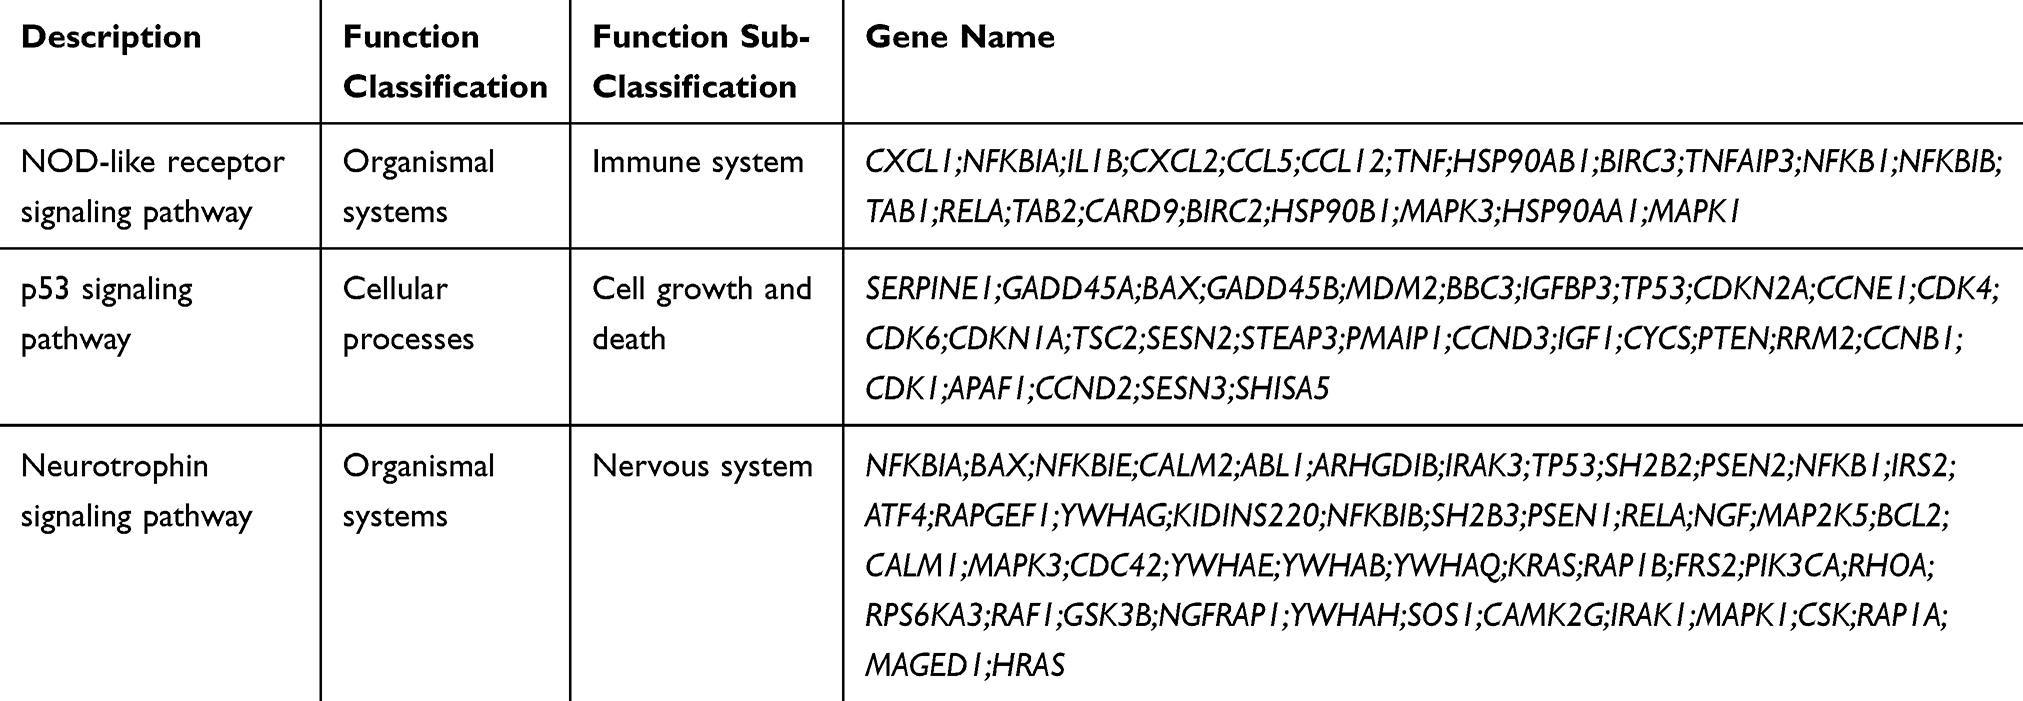 |
Table 1 Induced KEGG Pathways in rMSCs Exposed to TCM |
Next, we investigated the proliferative and apoptotic potential of rMSCs to examine whether the biology of these cells was affected by exposure to TCM for only 24 hours. Figure 1B and C revealed that there were small but significant differences between rMSCs cultured in TCM for 24 hours and those cultured in control medium. As expected, a capillary growth assay demonstrated no significant differences in tube formation between rMSCs exposed to TCM for 24 hours and control rMSCs (data not shown). Together, these data indicate that rMSCs exposed to a tumor microenvironment become transformed and initiate multiple cellular responses, including an immune response and cell growth, at an earlier stage than was previously thought. In turn, this would imply that a better understanding of the early phase of rMSCs transformation in a tumor microenvironment and of the tumor-promoting potential of these cells would facilitate the development of strategies for improving MSC-based clinical therapies.
miR-503 is Significantly Up-Regulated in TCM Exposed rMSCs
As miRNAs have been reported to play key roles in the regulation of stem cell fate and behavior through the fine-tuning of proteins,10,11 we were interested in determining whether miRNAs might be involved in the transformation of rMSCs in a tumor microenvironment. Therefore, we conducted a microarray analysis to identify miRNAs that were associated with the induction of rMSCs by TCM. A total of 12 miRNAs were significantly up-regulated in TCM-induced MSCs, as compared with control MSCs, of these, miR-503 was found to exhibit the biggest increase (Figure S3). These observations were confirmed by quantitative real-time PCR: the expression levels of miR-503 in rMSCs exposed to TCM were significantly up-regulated 2.7-fold at 12 hours, 3.3-fold at 24 hours, 9.7-fold at 7 days and 14.3-fold at 14 days, compared with control rMSCs (Figure 2). These observations indicate that miR-503 may have an important role in regulating rMSCs behavior in a tumor microenvironment.
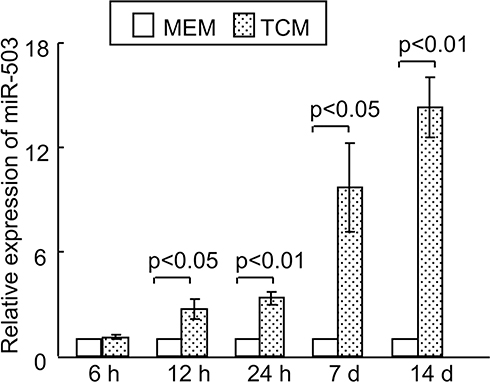 |
Figure 2 Relative rno-miR-503 expression in rMSCs with or without TCM exposure was detected using real-time PCR. All data are shown as the mean ± standard deviation based on three independent experiments. |
Silencing of miR-503 Blocks the Transformation of rMSCs in a Tumor Microenvironment
Analysis with real-time PCR revealed that rMSCs transfected with p-miR-503 showed a ~5-fold increase in miR-503 levels compared with p-miR-nc transfection (Figure 3A), while rMSCs transfected with pGPU6-miR-503 exhibited a 8-fold decrease in miR-503 levels compared with pGPU6-miR-nc transfection (Figure 3A). Furthermore, these changes in rMSCs miR-503 levels were associated with corresponding changes in the mRNA levels of various CAF markers (α-SMA, FAP, FSP, TNC) and tumor-promoting factors (CCL20,19 IL1β,9,20,21 CXCL2,20,22 CXCL322) (Figure 3A).
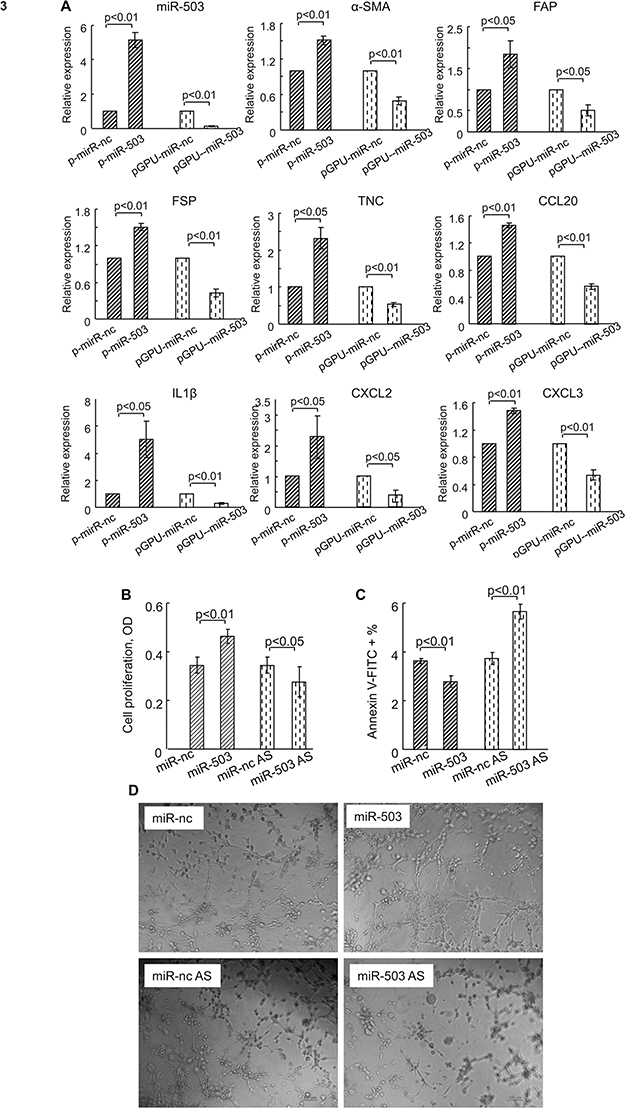 |
Figure 3 Effect of miR-503 on rMSCs in the tumor microenvironment in vitro. (A) Relative expressions of genes in rMSCs transfected with p-miR-503 or pGPU6-miR-503, or their respective controls, after exposure to TCM for 24 hours. (B) XTT assay was used to detect cell proliferation in rMSCs transfected with miR-503 mimics or miR-503 AS, or their respective controls after exposure to TCM for 24 hours. (C) Flow cytometry assay was used to detect cell apoptosis levels in rMSCs transfected with miR-503 mimics or miR-503 AS, or their respective controls after exposure to TCM for 24 hours. (D) Matrigel assay was used to detect the formation of capillary-like tubes in rMSCs transfected with miR-503 mimics or miR-503 AS, or their respective controls after exposure to TCM for 24 hours. Bar: 100 μm. All data are shown as the mean ± standard deviation based on three independent experiments. Vectors transfection in A, and RNA strands transfection in B–D. Abbreviations: miR-nc AS, antisense strands for miR-nc; miR-503 AS, antisense strands for miR-503. |
Next, we used a series of experiments to determine the functional significance of miR-503 in rMSCs. To avoid the influence of fluorescence of vectors on results, herein, we transfected miR-503 RNA strands (miR-503 mimics or inhibitors/AS) into rMSCs. We found that overexpression or silence of miR-503 did not influence the ability of rMSCs to differentiate into mesenchymal lineages such as fat and bone (data not shown). Having identified a proliferative action of TCM on rMSCs (Figure 1B), we examined the effects of miR-503 overexpression or silence on rMSCs proliferation in a tumor microenvironment. Silencing of miR-503 expression in rMSCs abolished the TCM-induced enhancement of rMSCs proliferation, whereas augmentation of endogenous miRNA function through ectopic expression of miR-503 led to an enhancement of TCM-induced rMSCs proliferation (Figure 3B). Exposure to TCM significantly down-regulated rMSCs apoptosis levels, and this down-regulation was significantly inhibited by miR-503 AS transfection and significantly exaggerated by miR-503 mimics transfection (Figure 3C). Interestingly, we found that miR-503 could affect rMSCs angiogenesis. Although the tube formation capacity of rMSCs was not affected by exposure to TCM for 24 hours, overexpression of miR-503 induced the formation of capillary-like structures in TCM-exposed MSCs. Conversely, rMSCs with miR-503 AS transfection were unable to form capillary tubes (Figure 3D). These data suggest that miR-503 is associated with cell growth, apoptosis and angiogenesis of rMSCs in a tumor microenvironment.
Effect of miR-503-i-rMSCs on A549 Cells in vitro
MSCs have been reported to both promote and abrogate tumor growth.3,5 Having observed that TCM could influence the biological behavior of rMSCs, we next sought to determine the effects of rMSCs on A549 tumor cells. A549 cells were co-cultured with either control rMSCs or rMSCs with various vectors transfection types or cultured in basal medium (Figure 4A). Co-culture with the various rMSCs types had no effect on the proliferation of A549 cells at 24 hours or 48 hours. However, at 72 hours, co-culture with rMSCs or miR-503-rMSCs resulted in a significant elevation of A549 cell proliferation, whereas co-culture with miR-503-i-rMSCs caused a significant decrease in proliferation, as compared with control A549 cells cultured in basal medium (Figure 4B). Similarly, A549 cell apoptosis was decreased at 72 hours when these cells were co-cultured with rMSCs or miR-503-rMSCs but increased when the cells were co-cultured with miR-503-i-rMSCs (Figure 4C).
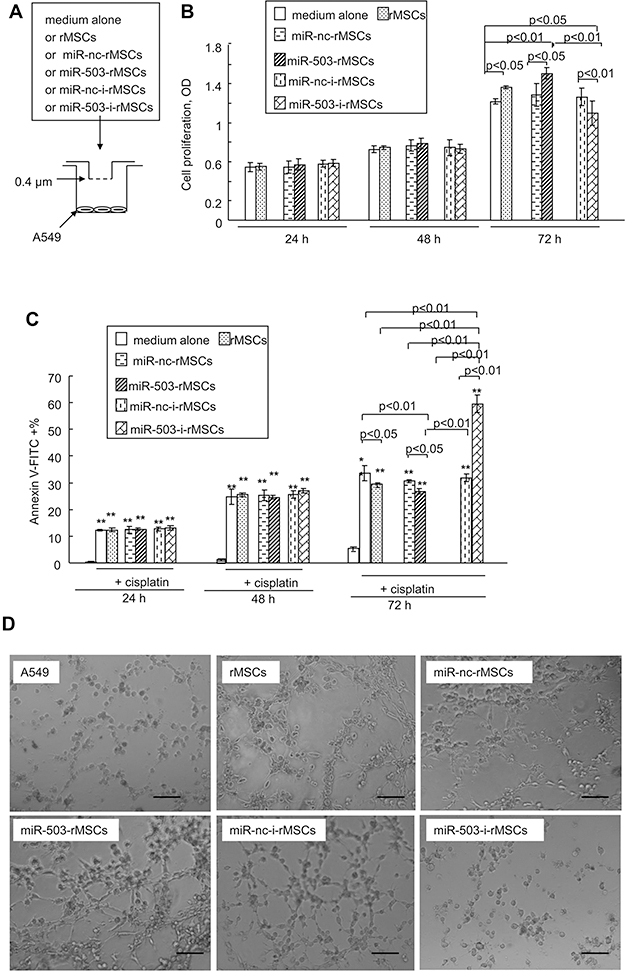 |
Figure 4 Effect of different MSC types on A549 cells in vitro. (A) Co-culture model. A549 cells seeded in the bottom chamber of a Transwell Permeable Supports chamber (Corning) were exposed to different MSC types (control MSCs, miR-nc-rMSCs, miR-503-rMSCs, miR-nc-i-rMSCs, or miR-503-i-rMSCs) or to medium only, placed in the upper chamber. A 0.4 μm mesh separated the upper and lower chambers. (B) XTT assay was used to detect cell proliferation levels in a549 cells co-cultured with different MSC types (control MSCs, miR-nc-rMSCs, miR-503-rMSCs, miR-nc-i-rMSCs, or miR-503-i-rMSCs) or to medium only. (C) Flow cytometry assay was used to detect cell apoptosis levels in a549 cells co-cultured with different MSC types (control MSCs, miR-nc-rMSCs, miR-503-rMSCs, miR-nc-i-rMSCs, or miR-503-i-rMSCs) or to medium only. Before co-culture, apoptosis inducer (Cisplatin, 1 μM, Beyotime) were added to the culture. All data are shown as the mean ± standard deviation based on three independent experiments. **p<0.01, compared with A549 without cisplatin inducing. (D) Matrigel assay was used to detect the formation of capillary-like tubes in A549 cells co-cultured with different MSC types (control MSCs, or rMSCs transfected with either p-miR-nc, p-miR-503, pGPU6-miR-nc, or pGPU6-miR-503) or to medium only. Co-culture time: 24 hours. Bar: 100 μm. Abbreviations: miR-nc-rMSCs, rMSCs transfected with p-miR-nc; miR-503-rMSCs, rMSCs transfected with p-miR-503; miR-nc-i-rMSCs, rMSCs transfected with pGPU6-miR-nc; miR-503-i-rMSCs, rMSCs transfected with pGPU6-miR-503. |
We hypothesized that these various co-culture models would also differ with regard to the angiogenesis of A549 cells. As shown in Figure 4D, A549 cells were able to generate a capillary tube on matrigel when cultured for 24 hours in basal medium, or when co-cultured for 24 hours with rMSCs or miR-503-rMSCs. However, tube formation was significantly inhibited by co-culture with miR-503-i-rMSCs. Collectively, these data indicated that the three types of rMSCs can affect cancer cells biology, with A549 growth and angiogenesis enhanced by control rMSCs or miR-503-rMSCs, but inhibited by miR-503-i-rMSCs. Interestingly, we found that overexpression of miR-503 in A549 cells suppressed the proliferation of A549 cells and tube formation, and enhanced their apoptosis (Figure S2). This would indicate that the presence of miR-503-i-rMSCs, and not miR-503 overexpression in itself, exerts a tumor-suppressive action on A549 cells in vitro.
To identify whether angiogenic factors were involved in tumor suppression regulated by miR-503-i-rMSCs, real-time PCR and immunofluorescence experiments were performed to determine the expression levels of genes associated with tumor angiogenesis. The results showed that angiogenic factors, including VEGF, SDF-1, IGF-1, and MMP-3, were significantly inhibited in A549 cells co-cultured with miR-503-i-rMSCs, as compared with A549 cells co-cultured with miR-503-rMSCs or cultured alone in basal medium (Figure 5A, B). Interestingly, we found that CD133, a tumor marker in a variety of cancer types, including human non-small cell lung carcinoma (NSCLC),23 was significantly inhibited in A549 cells co-cultured with miR-503-i-rMSCs, as compared with A549 cells co-cultured with miR-503-rMSCs or cultured alone in basal medium (Figure 5C). To verify the effect of CD133 on capillary tube formation, an anti-CD133 antibody was added to a suspension of A549 cells just before they were plated onto Matrigel. We found that tube formation was greatly inhibited by the anti-CD133 antibody (Figure 5D), indicating that CD133, in addition to other angiogenic factors (VEGF,24,25 SDF-1,25,26 IGF-1,27 MMP-328) is involved in A549 cell vasculogenesis.
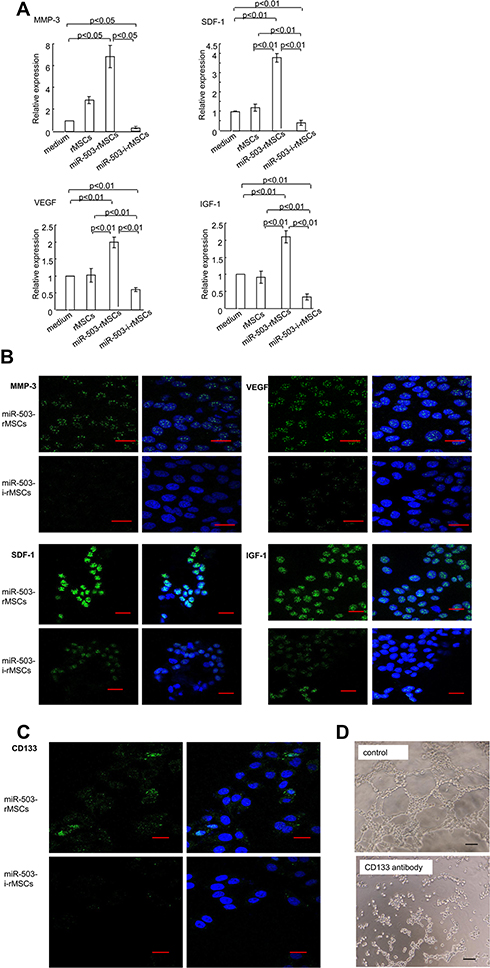 |
Figure 5 Effect of miR-503-i-rMSCs on A549 cells by regulating angiogenic genes in vitro. (A) Relative mRNA expressions of angiogenic genes in A549 cells after 24 h co-culture, was detected using real-time PCR. All data are shown as the mean ± standard deviation based on three independent experiments. (B) Confocal imaging of A549 cells, left panel: angiogenic proteins (green), right panel: merge image for nuclei (blue, stained with Hochest 33,258) and angiogenic proteins (green). MMP-3, IGF-1, SDF-1, and VEGF were expressed at high level in A549 cells co-cultured with miR-503-i-rMSCs. Co-culture time: 24 h. Bar: 20 μm. (C) Confocal imaging of A549 cells, left panel: CD133 expression (green), right panel: merge image for nuclei (blue, stained with Hochest 33,258) and CD133 (green) expression. CD133 was expressed at lower levels in cells co-cultured with miR-503-i-rMSCs compared with miR-503-rMSCs co-culture. Co-culture time: 24 h. Bar: 20 μm. (D) Matrigel assay was used to detect the formation of capillary-like tubes in A549 cells treated with or without an antibody anti-CD133 (a rabbit neutralizing antibody, 1:100 dilution). Bar: 100 μm. |
miR-503-i-rMSCs Abolished the Tumor-Promoting Effects of rMSCs in vivo
To test the effects of rMSCs on tumor formation in vivo, nude mice were injected with A549 cells in the absence or presence of various rMSCs types, as described in the Methods. As expected, control mice (injected with PBS; n = 5) did not form tumors, whereas those transfected with A549 cells only (n = 5) did form tumors (Figure 6A). Moreover, mice co-injected with either rMSCs plus A549 cells, or miR-503-rMSCs plus A549 cells, exhibited larger tumor volumes than pure A549 xenografts (Figure 6A). In contrast, heterogeneous xenografts were detected in 4 of 5 mice transplanted with rMSCs only, while xenografts were only detected in 2 of 5 mice co-transplanted with miR-503-i-rMSCs plus A549 cells (Figure 6A). Surprisingly, when sections were examined after hematoxylin and eosin staining, no tumor cells were observed in one of two xenografts in the miR-503-i-rMSCs plus A549 cell co-injection group (Figure 6B, lower-middle panel), while the other xenograft showed only sporadic occurrences of small, encapsulated, nodular tumors (Figure 6B, lower-right panel); moreover, the tumor xenograft volumes were significantly smaller than those observed in the other 3 groups (Figure 6A). As expected, the tumors of mice injected with A549 cells presented as large, spherical tumor nests, with invasive growth into skeletal muscle observed in some cases (Figure 6B, upper-left panel). Furthermore, tumors in the rMSCs plus A549 cells group or the miR-503-rMSCs plus A549 cells group showed invasive patterns of growth into the surrounding skeletal muscle, with coarse tumor margins and an enriched peri-tumoral vascularity; the tumor area also showed evidence of fibrous tissue and spotty necrosis (Figure 6B, upper-right and lower-left panels). Masson’s trichrome staining was much more pronounced (Figure 6C).
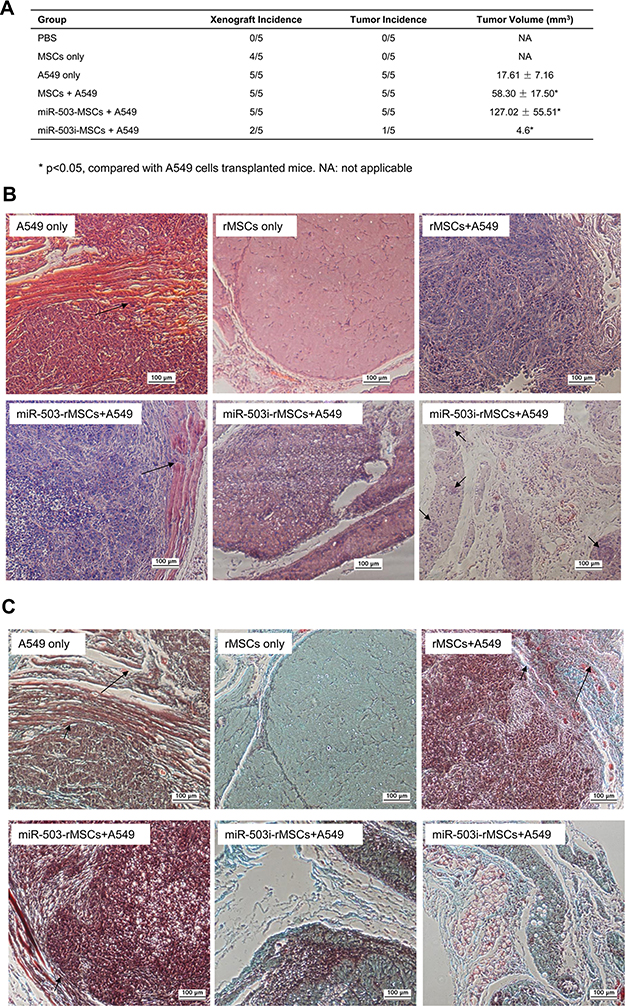 |
Figure 6 miR-503-i-rMSCs inhibited tumor growth in vivo. (A) Summary of the xenograft and tumor frequencies and tumor volumes. All data are shown as the mean ± standard deviation based on three independent experiments. (B) Representative images of xenografts at 2 weeks stained with hematoxylin and eosin. Upper-left: pure A549 xenograft; large in size with a spherical tumor nodule; the arrow indicates invasive growth into the muscle. Upper-middle: Pure rMSCs xenograft; no tumor cells were present. Upper-right: rMSC plus A549 cells mixed xenograft; the tumor nodule was divided by fibrous tissue, and there were multiple areas of spotty necrosis and inflammatory cell infiltration. Lower-left: miR-503-rMSCs plus A549 cells mixed xenograft; there was invasive growth of the primary tumor with infiltration of surrounding skeletal muscles (arrow). Lower -middle and right: miR-503-i-rMSCs plus A549 cells mixed xenograft; tumor tissue was replaced by granulation tissue, and was either acellular (middle) or evident as a small encapsulated tumor without invasive growth (arrow, right). Bar: 100 μm. (C) Representative images of xenografts at 2 weeks stained with Masson's trichrome stain. Tumor tissue has been replaced with granulation tissue in miR-503-i-rMSCs plus A549 cells mixed xenograft. However, fibrous tissue also could be observed in the pure A549 cells xenograft, the MSCs plus A549 cells mixed xenograft or the miR-503-rMSCs plus A549 cells mixed xenograft (small arrows); these xenografts also showed enriched vascularity and vascular engorgement in these xenografts (large arrows). Arrow: small tumor nodule; Bar: 100 μm. |
Immunohistochemistry experiments revealed that ki67-positive cells were rare and sporadically distributed within the xenografts of mice injected with miR-503-i-rMSCs plus A549 cells, with most ki67-positive cells present in small nodular tumors (Figure 7A). In contrast, there were significantly more ki67-positive cells in xenografts of pure A549 cells or A549 cells mixed with the other rMSCs types (Figure 7A).
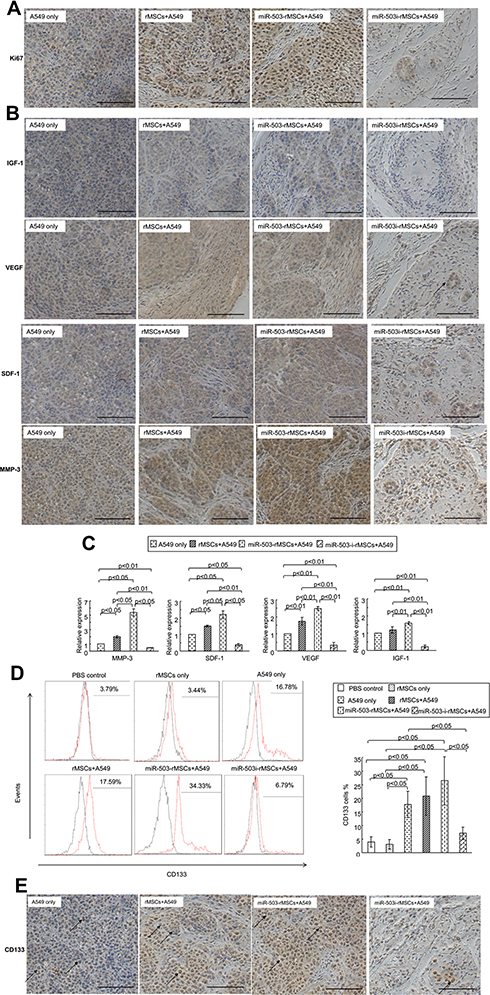 |
Figure 7 Antitumorigenic effect of miR-503-i-rMSCs was through regulating tumor growth and angiogenesis in vivo. (A) Ki67 expression in xenograft tissues was detected by immunohistochemistry assay. Bar: 100 μm. (B) Angiogenic proteins levels in xenograft tissues were detected by immunohistochemistry assay. Bar: 100 μm. (C) Relative mRNA expressions of angiogenic genes in xenograft tissues was detected using real-time PCR. (D) CD133 expression in peripheral blood was detected by flow cytometry. CD133 positive cells (%) are represented by the red peaks merged with the isotype control each (black peaks), the value obtained is its “ CD133 cells %” positive value, statistical analysis is shown on the right. All data are shown as the mean ± standard deviation based on three independent experiments. (E) CD133 expression in xenograft tissues was detected by immunohistochemistry assay. CD133 was mostly expressed in tumor cells in the four groups. CD133 expression was much lower in miR-503-i-rMSC plus A549 cells mixed xenografts than in pure A549 cells xenografts, miR-503-rMSC plus A549 cells mixed xenografts, or rMSC plus A549 cells mixed xenografts. Arrow: typical CD133 expression patterns, mostly distributed on the tumor cell surface, bar: 100 μm. |
Next, we detected the expressions of angiogenic factors (VEGF, SDF-1, IGF-1, MMP-3) in tumor xenografts in vivo. Xenografts in mice injected miR-503-i-rMSCs plus A549 cells secreted lower levels of these proteins compared with xenografts of pure A549 cells or A549 cells mixed with the other rMSCs types (Figure 7B). These data were further confirmed by real-time PCR analysis (Figure 7C).
CD133 expression in peripheral blood was approximately 4.5-fold higher in mice transplanted with A549 cells than in control mice injected with PBS. A similar phenomenon has been observed in patients with lung cancer.29 CD133 has been reported to be associated with tumor vasculogenesis and tumor growth,30,31 and high CD133 levels are associated with poor survival in a variety of solid tumors, including lung, colon and prostate cancer.23,32 Remarkably, our study demonstrated that CD133 expression in peripheral blood was significantly lower in mice co-transplanted with miR-503-i-rMSCs plus A549 cells than in mice co-transplanted with pure A549 cells or A549 cells mixed with the other rMSCs types (Figure 7D). Moreover, immunohistochemistry also confirmed the results (Figure 7E). These results suggest an important role for CD133 in tumor initiation and tumor growth, thus, CD133 may serve as a biomarker of tumor progression, further helping to define the indications for the potential use of miR-503-i-rMSCs in tumor therapy.
Taken together, our results indicate that the tumor-promoting effects of rMSCs can be abolished by miR-503 silence in these cells, and that miR-503-i-rMSCs inhibit tumor growth in vivo.
Discussion
Our carefully designed experiments support the concept that rMSCs can be induced to transformed into CAF-like phenotype in the tumor microenvironment, and that these alterations in rMSCs in turn can affect on tumor cells. Furthermore, miR-503-i-rMSCs but not rMSCs can effectively suppress the formation and progression of A549 cell lung tumors by regulating tumor angiogenesis and growth.
Recently, MSCs have been shown to display pro-tumorigenic properties.33–35 Galie et al demonstrated a phenotypical similarity between MSC and mesenchymal tumor cells (MTC), which have a dramatically enhanced capacity to promote angiogenesis and play a decisive role in supporting tumor growth through the supply of blood.34 Numerous studies have found that MSCs can differentiate into CAFs, that promote tumor growth through multiple mechanisms, including the secretion of tumor-promoting factors.18,35 Thus, MSCs are potential candidates for the tumor-promoting or tumorigenic phenotypical changes induced by neoplastic microenvironment.34 Consistent with this, our results revealed that gene expression in rMSCs exposed to TCM was altered as early as at 24 hours; the genes involved included tumor-promoting factors such as CCL20, IL1β, CXCL2, CXCL3, CXCL1, CCL7, CCL2, MMP-3. Thus, the blocking of neoplastic differentiation at an early phase will likely be very important for further improving both the safety and efficiency of anti-cancer therapy. Interestingly, we found that miR-503-i-rMSCs had tumor-inhibiting effects: 1) miR-503-i-rMSCs significantly increased the apoptosis and reduced the proliferation of A549 cells, and inhibited tube formation by A549 cells in vitro, possibly through the regulation of angiogenesis-related genes including VEGF, SDF-1, IGF-1, MMP-3 and CD133; and 2) miR-503-i-rMSCs significantly inhibited A549 tumor initiation (from 5/5 to 1/5 mice) and tumor volumes (from 17.61±7.16 to 4.6 mm3) in an in vivo animal transplantation model, likely by modulating angiogenesis and tumor proliferation. Similarly, Shangguan et al have observed that blocking the differentiation of MSCs into CAFs, through inhibition of transforming growth factor beta (TGFβ)/SMAD signaling, resulted in reduced breast tumor volumes and decreased tumor initiation (from 5/5 to 3/5).18
MSCs also have been reported to display anti-tumorigenic properties.4 Otsu et al found direct inoculation of MSCs into subcutaneous melanomas caused apoptosis and abrogated tumor growth. Khakoo et al found that MSCs inhibited Kaposi’s sarcoma by exerting an anti-angiogenic effect through direct cell-cell contact.3 Furthermore, tumors from animals treated with MSCs contained a greater stromal portion.3 The increased fibrous tissue seen within the tumors of MSC-treated animals may represent a host response to enhanced tumor necrosis mediated by MSCs.3 On the other hand, MSCs have been reported to be precursors of stromal cells.36 Therefore, it is possible that within the tumor microenvironment, stromal components derived from MSCs may play a role in inhibiting tumor growth.3 In our study, however, we found that all rMSCs types, including those showing overexpression or silence of miR-503 could affect A549 cell behavior. Although tumors from mice treated with rMSCs had increased fibrous tissue accompanied by spotty necrosis within A549 tumor (as compared with mice injected with A549 cells only), these changes are unlikely to have played a determining role in preventing tumor growth, given the observed tumor volumes and incidences (Figure 6A). Instead, rMSCs appeared to accelerate the angiogenic switch and enhance the proliferation and viability of tumor cells. Thus, rMSCs conferred more pro-tumorigenic than anti-tumorigenic effects. We further provided evidence of anti-tumor effects of miR-503-i-rMSCs. Xenografts from mice treated with miR-503-i-rMSCs contained an encapsulated small tumor nest (1/5) or relatively acellular granulation tissue (1/5). Given these findings, we suggest that miR-503-i-rMSCs be capable of tumor suppression and show promise for clinical development as an anti-tumor therapy.
MiR-503 is reported to play an important role in tumorigenesis.37,38 In our study, we found that up-regulation of miR-503 in rMSCs could reduce the apoptosis levels, and enhance the proliferation and capillary tube formation of rMSCs cultured in TCM. However, up-regulation of miR-503 in A549 cells had the opposite effects, i.e. a reduction in proliferation and capillary tube formation and increased apoptosis of A549 cells. Consistent with this, Yang et al also found that the ectopic expression of miR-503 suppressed the proliferation and metastasis-related traits of NSCLC both in vitro and in vivo, supporting an anti-cancer role for miR-503 in the progression of NSCLC.39 Paradoxically, Li et al reported that miR-503 expression in an adenoma cell line promoted a malignant transformation in vitro as well as in vivo, and that blocking miR-503 suppressed the angiogenic signature of cells, indicating that miR-503 plays pro-oncogenic effects in the transformation of colon adenoma to adenocarcinoma.40 Thus, these discrepancies demonstrate the precise role of miR-503 may be changed in a cell type-dependent manner or developmental stage,37 and reflect the multitude of gene networks regulated by miR-503, demonstrating that miR-503 may exert multiple effects. Unfortunately, we did not find the exact target gene for miR-503 during this anti-tumor process in vivo, one explanation is that miR-503 had multitudinous target genes may play redundant functions in regulating tumor initiation and growth in vivo.
It is worth noting that miR-503-i-rMSCs rather than rMSCs inhibit tumor initiation and growth in A549 xenografts in vivo. Thus, our study provides greater insights into the biological processes during which miR-503 modulates the intrinsic properties of rMSCs in the tumor microenvironment, and influences tumor initiation and growth. Our results at the very least suggest that the potential exists to exploit the biology of miR-503-i-rMSCs to treat a subset of human malignancies. Of course, further research will be needed to 1) evaluate the role of miR-503-i-rMSCs in other malignancies; 2) evaluate the role of miR-503-i-rMSCs in animal models with immune systems to better-mimetic what happens in vivo; 3) evaluate anti-tumor effects of human-derived MSCs. Such studies may broaden the translational aspects of miR-503-i-MSCs, which are shown to have therapeutic potential, and improve the safety of stem cell treatments for clinical use.
Conclusion
The present study demonstrated that miR-503 is expressed after the transformation of rMSCs in a tumor microenvironment. We found that miR-503-i-rMSCs but not rMSCs are capable of tumor suppression both in vitro and in vivo. Further studies are required to provide a detailed analysis of the characteristics of miR-503-i-rMSCs or miR-503-i-MSCs in the tumor environment and to develop clinical therapies based on inhibition of the tumor-promoting properties and potentiation of the anti-tumor properties of MSCs.
Abbreviations
MSCs, mesenchymal stem cells; rMSCs, rat mesenchymal stem cells; TCM, tumor-conditioned medium; miR-503, microRNA-503; p-miR-503, PGCMV-EGFP-rno-miR-503; p-miR-nc, pGCMV-EGFP-rno-miR-nc; pGPU6-miR-503, pGPU6-rno-miR-503; pGPU6-miR-nc, pGPU6-miR-nc; RT, Reverse transcription; CAF, carcinoma-associated fibroblasts; NSCLC, human non-small cell lung carcinoma; MTC, mesenchymal tumor cell; XTT, 2–3-bis(2-methoxy-4-nitro-5-sulfophenyl)-5-[(phenylamino)carbonyl]-2H-tetrazolium hydroxide; RBC, red blood cells; miR-503-rMSCs, rMSCs transfected with PGCMV-EGFP-rno-miR-503; miR-503-i-rMSCs, rMSCs transfected with pGPU6-rno-miR-503; AS, antisense strands.
Data Sharing Statement
All data used to support the findings of this study are available from the corresponding author upon reasonable request.
Acknowledgments
This study was funded by the National Natural Science Foundation of China (81270059); the Science and Technology Base and Talent Project of Guangxi Province (AD19245006).
Disclosure
The authors report no conflicts of interest for this work.
References
1. Wei X, Yang X, Han ZP, Qu FF, Shao L, Shi YF. Mesenchymal stem cells: a new trend for cell therapy. Acta Pharmacol Sin. 2013;34(6):747–754. doi:10.1038/aps.2013.50
2. Wang X, Lin Q, Zhang T, et al. Low-intensity pulsed ultrasound promotes chondrogenesis of mesenchymal stem cells via regulation of autophagy. Stem Cell Res Ther. 2019;10(1):41. doi:10.1186/s13287-019-1142-z
3. Khakoo AY, Pati S, Anderson SA, et al. Human mesenchymal stem cells exert potent antitumorigenic effects in a model of Kaposi’s sarcoma. The Journal of Experimental Medicine. 2006;203(5):1235–1247. doi:10.1084/jem.20051921
4. Otsu K, Das S, Houser SD, Quadri SK, Bhattacharya S, Bhattacharya J. Concentration-dependent inhibition of angiogenesis by mesenchymal stem cells. Blood. 2009;113(18):4197–4205. doi:10.1182/blood-2008-09-176198
5. Naderi EH, Skah S, Ugland H, et al. Bone marrow stroma-derived PGE2 protects BCP-ALL cells from DNA damage-induced p53 accumulation and cell death. Mol Cancer. 2015;14(1):14. doi:10.1186/s12943-014-0278-9
6. Serakinci N, Guldberg P, Burns JS, et al. Adult human mesenchymal stem cell as a target for neoplastic transformation. Oncogene. 2004;23(29):5095–5098. doi:10.1038/sj.onc.1207651
7. Klopp AH, Gupta A, Spaeth E, Andreeff M, Marini F
8. Zhang X, Liu S, Hu T, Liu S, He Y, Sun S. Up-regulated microRNA-143 transcribed by nuclear factor kappa B enhances hepatocarcinoma metastasis by repressing fibronectin expression. Hepatology (Baltimore, Md). 2009;50(2):490–499. doi:10.1002/hep.23008
9. Burger ML, Xue L, Sun Y, Kang C, Winoto A. Premalignant PTEN-deficient thymocytes activate microRNAs miR-146a and miR-146b as a cellular defense against malignant transformation. Blood. 2014;123(26):4089–4100. doi:10.1182/blood-2013-11-539411
10. Duan L, Zhao H, Xiong Y, et al. miR-16-2* interferes with WNT5A to regulate osteogenesis of mesenchymal stem cells. Cell Physiol Biochem. 2018;51(3):1087–1102. doi:10.1159/000495489
11. Gu W, Hong X, Le Bras A, et al. Smooth muscle cells differentiated from mesenchymal stem cells are regulated by microRNAs and suitable for vascular tissue grafts. J Biol Chem. 2018;293(21):8089–8102. doi:10.1074/jbc.RA118.001739
12. Zhang X, Wang H, Shi Y, et al. Role of bone marrow-derived mesenchymal stem cells in the prevention of hyperoxia-induced lung injury in newborn mice. Cell Biol Int. 2012;36(6):589–594. doi:10.1042/CBI20110447
13. Zhang E, Yang Y, Chen S, et al. Bone marrow mesenchymal stromal cells attenuate silica-induced pulmonary fibrosis potentially by attenuating Wnt/beta-catenin signaling in rats. Stem Cell Res Ther. 2018;9(1):311. doi:10.1186/s13287-018-1045-4
14. Zhang X, Xu J, Wang J, et al. Reduction of microRNA-206 contributes to the development of bronchopulmonary dysplasia through up-regulation of fibronectin 1. PLoS One. 2013;8(9):e74750. doi:10.1371/journal.pone.0074750
15. Zhang X, Peng W, Zhang S, et al. MicroRNA expression profile in hyperoxia-exposed newborn mice during the development of bronchopulmonary dysplasia. Respir Care. 2011;56(7):1009–1015. doi:10.4187/respcare.01032
16. Mirshahi P, Rafii A, Vincent L, et al. Vasculogenic mimicry of acute leukemic bone marrow stromal cells. Leukemia. 2009;23(6):1039–1048. doi:10.1038/leu.2009.10
17. Mishra PJ, Mishra PJ, Humeniuk R, et al. Carcinoma-associated fibroblast-like differentiation of human mesenchymal stem cells. Cancer Res. 2008;68(11):4331–4339. doi:10.1158/0008-5472.CAN-08-0943
18. Shangguan L, Ti X, Krause U, et al. Inhibition of TGF-beta/Smad signaling by BAMBI blocks differentiation of human mesenchymal stem cells to carcinoma-associated fibroblasts and abolishes their protumor effects. Stem Cells. 2012;30(12):2810–2819. doi:10.1002/stem.1251
19. Sligh J, Janda J, Jandova J. Mutations in BALB mitochondrial DNA induce CCL20 up-regulation promoting tumorigenic phenotypes. Mutat Res. 2014;769:49–58. doi:10.1016/j.mrfmmm.2014.07.003
20. Abelev B, Adam J, Adamova D, et al. Exclusive J/psi photoproduction off protons in ultraperipheral p-Pb collisions at sqrt[s_{NN}]=5.02 TeV. Phys Rev Lett. 2014;113(23):232504.
21. Chittezhath M, Dhillon MK, Lim JY, et al. Molecular profiling reveals a tumor-promoting phenotype of monocytes and macrophages in human cancer progression. Immunity. 2014;41(5):815–829. doi:10.1016/j.immuni.2014.09.014
22. Subimerb C, Wongkham C, Khuntikeo N, Leelayuwat C, McGrath MS, Wongkham S. Transcriptional profiles of peripheral blood leukocytes identify patients with cholangiocarcinoma and predict outcome. Asian Pac J Cancer Prev. 2014;15(10):4217–4224. doi:10.7314/APJCP.2014.15.10.4217
23. Yu X, Lin Y, Yan X, Tian Q, Li L, Lin EH. CD133, stem cells, and cancer stem cells: myth or reality? Curr Colorectal Cancer Rep. 2011;7(4):253–259. doi:10.1007/s11888-011-0106-1
24. Abrishami M, Maemori GA, Boskabadi H, Yaeghobi Z, Mafi-Nejad S, Abrishami M. Incidence and risk factors of retinopathy of prematurity in mashhad, northeast iran. Iranian Red Crescent Medical Journal. 2013;15(3):229–233. doi:10.5812/ircmj.4513
25. Suehiro J, Kanki Y, Makihara C, et al. Genome-wide approaches reveal functional vascular endothelial growth factor (VEGF)-inducible nuclear factor of activated T cells (NFAT) c1 binding to angiogenesis-related genes in the endothelium. J Biol Chem. 2014;289(42):29044–29059. doi:10.1074/jbc.M114.555235
26. Kurmi OP, Li L, Smith M, et al. Regional variations in the prevalence and misdiagnosis of air flow obstruction in China: baseline results from a prospective cohort of the China Kadoorie Biobank (CKB). BMJ Open Respir Res. 2014;1(1):e000025. doi:10.1136/bmjresp-2014-000025
27. Li X, Feng Y, Liu J, Feng X, Zhou K, Tang X. Epigallocatechin-3-gallate inhibits IGF-I-stimulated lung cancer angiogenesis through downregulation of HIF-1alpha and VEGF expression. J Nutrigenet Nutrigenomics. 2013;6(3):169–178. doi:10.1159/000354402
28. Huang Y, Song N, Ding Y, et al. Pulmonary vascular destabilization in the premetastatic phase facilitates lung metastasis. Cancer Res. 2009;69(19):7529–7537. doi:10.1158/0008-5472.CAN-08-4382
29. Skirecki T, Hoser G, Kawiak J, Dziedzic D, Domagala-Kulawik J. Flow cytometric analysis of CD133- and EpCAM-positive cells in the peripheral blood of patients with lung cancer. Arch Immunol Ther Exp (Warsz). 2014;62(1):67–75. doi:10.1007/s00005-013-0250-1
30. Sun XT, Yuan XW, Zhu HT, et al. Endothelial precursor cells promote angiogenesis in hepatocellular carcinoma. World J Gastroenterol. 2012;18(35):4925–4933. doi:10.3748/wjg.v18.i35.4925
31. Li F, Zeng H, Ying K. The combination of stem cell markers CD133 and ABCG2 predicts relapse in stage I non-small cell lung carcinomas. Med Oncol. 2011;28(4):1458–1462.
32. Tan Y, Chen B, Xu W, Zhao W, Wu J. Clinicopathological significance of CD133 in lung cancer: a meta-analysis. Mol Clin Oncol. 2014;2(1):111–115. doi:10.3892/mco.2013.195
33. Muehlberg FL, Song YH, Krohn A, et al. Tissue-resident stem cells promote breast cancer growth and metastasis. Carcinogenesis. 2009;30(4):589–597. doi:10.1093/carcin/bgp036
34. Galie M, Konstantinidou G, Peroni D, et al. Mesenchymal stem cells share molecular signature with mesenchymal tumor cells and favor early tumor growth in syngeneic mice. Oncogene. 2008;27(18):2542–2551. doi:10.1038/sj.onc.1210920
35. Weber CE, Kothari AN, Wai PY, et al. Osteopontin mediates an MZF1-TGF-β1-dependent transformation of mesenchymal stem cells into cancer-associated fibroblasts in breast cancer. Oncogene. 2015;34(37):4821–4833. doi:10.1038/onc.2014.410
36. Prockop DJ. Marrow stromal cells as stem cells for nonhematopoietic tissues. Science. 1997;276(5309):71–74. doi:10.1126/science.276.5309.71
37. Park GB, Kim D. MicroRNA-503-5p inhibits the CD97-mediated JAK2/STAT3 pathway in metastatic or paclitaxel-resistant ovarian cancer cells. Neoplasia. 2019;21(2):206–215. doi:10.1016/j.neo.2018.12.005
38. Zhou B, Ma R, Si W, et al. MicroRNA-503 targets FGF2 and VEGFA and inhibits tumor angiogenesis and growth. Cancer Letters. 2013;333(2):159–169. doi:10.1016/j.canlet.2013.01.028
39. Yang Y, Liu L, Zhang Y, et al. MiR-503 targets PI3K p85 and IKK-β and suppresses progression of non-small cell lung cancer. Int J Cancer. 2014;135(7):1531–1542. doi:10.1002/ijc.28799
40. Li L, Sarver AL, Khatri R, et al. Sequential expression of miR-182 and miR-503 cooperatively targets FBXW7, contributing to the malignant transformation of colon adenoma to adenocarcinoma. J Pathol. 2014;234(4):488–501. doi:10.1002/path.4407
 © 2021 The Author(s). This work is published and licensed by Dove Medical Press Limited. The full terms of this license are available at https://www.dovepress.com/terms.php and incorporate the Creative Commons Attribution - Non Commercial (unported, v3.0) License.
By accessing the work you hereby accept the Terms. Non-commercial uses of the work are permitted without any further permission from Dove Medical Press Limited, provided the work is properly attributed. For permission for commercial use of this work, please see paragraphs 4.2 and 5 of our Terms.
© 2021 The Author(s). This work is published and licensed by Dove Medical Press Limited. The full terms of this license are available at https://www.dovepress.com/terms.php and incorporate the Creative Commons Attribution - Non Commercial (unported, v3.0) License.
By accessing the work you hereby accept the Terms. Non-commercial uses of the work are permitted without any further permission from Dove Medical Press Limited, provided the work is properly attributed. For permission for commercial use of this work, please see paragraphs 4.2 and 5 of our Terms.