")
Back to Journals » Cancer Management and Research » Volume 13
Silencing of LncRNA AFAP1-AS1 Inhibits Cell Proliferation in Oral Squamous Cancer by Suppressing CCNA2
Authors Li T, Liu D, Li C, Ru L, Wang X
Received 19 August 2021
Accepted for publication 7 October 2021
Published 15 October 2021 Volume 2021:13 Pages 7897—7908
DOI https://doi.org/10.2147/CMAR.S328737
Checked for plagiarism Yes
Review by Single anonymous peer review
Peer reviewer comments 2
Editor who approved publication: Dr Chien-Feng Li
Tao Li, Duanqin Liu, Chenglong Li, Lu Ru, Xuixia Wang
Department of Oral and Maxillofacial Surgery, School and Hospital of Stomatology, Cheeloo College of Medicine, Shandong University & Shandong Key Laboratory of Oral Tissue Regeneration & Shandong Engineering Laboratory for Dental Materials and Oral Tissue Regeneration, Jinan, Shandong, People’s Republic of China
Correspondence: Xuixia Wang
Department of Oral and Maxillofacial Surgery, School and Hospital of Stomatology, Cheeloo College of Medicine, Shandong University & Shandong Key Laboratory of Oral Tissue Regeneration & Shandong Engineering Laboratory for Dental Materials and Oral Tissue Regeneration, No. 44-1 Wenhua Road West, Jinan, Shandong, 250012, People’s Republic of China
Tel +86 53188382961
Fax +86 53188382923
Email [email protected]
Background: Evidence has indicated that dysregulation of long noncoding RNAs (lncRNA) is a critical factor in the occurrence of many diseases, including cancer. The lncRNA AFAP1-AS1 has been shown to participate in oncogenesis, metastasis, or drug resistance in many types of cancer. However, the potential role of AFAP1-AS1 in oral squamous cell carcinoma (OSCC) has not been fully elucidated.
Methods: Bioinformatics analysis was performed to compare AFAP1-AS1 expression levels in OSCC cancer samples and in normal controls. The biological function of AFAP1-AS1 was studied through loss-of-function assays. To study the potential mechanisms, high-throughput sequencing was applied to OSCC cancer samples and a series of bioinformatics analyses were performed. The effects of AFAP1-AS1 on OSCC tumor growth was evaluated by in vivo xenograft tumor formation assays.
Results: Bioinformatics analyses indicated that AFAP1-AS1 was upregulated in OSCC. Overexpression of AFAP1-AS1 was positively correlated with lymph node metastasis, tumor stage, and pathological grade. Down-regulation of AFAP1-AS1 in OSCC led to decreased proliferation in vitro and, notably, inhibition of tumor growth in vivo. Further research indicated that AFAP1-AS1 regulated OSCC cell proliferation by targeting CCNA2.
Conclusion: AFAP1-AS1 promotes tumor proliferation and indicates a poor prognosis in OSCC, providing a potential therapeutic strategy.
Keywords: LncRNA, bioinformatics analysis, AFAP1-AS1, oral squamous cell carcinoma, CCNA2
Introduction
Oral squamous cell carcinoma (OSCC) is the main subtype of head and neck squamous cell carcinoma (HNSCC) with a high incidence in Asia. It includes a group of cancers that originate in the oral cavity mucosa and accounted for approximately 170,000 deaths in 2018.1 The main risk factors for OSCC have been documented to be largely related to lifestyle, including exposure to tobacco, tobacco-like products, and alcohol.2 Surgical resection combined with chemoradiotherapy is the conventional treatment strategy for early OSCC.3 However, recurrence and metastasis are still the main causes of cancer-related deaths in OSCC.4 Thus, new treatment methods have been designed and research has been carried out focusing on gene-targeted therapy.5
Accumulating studies have shown that the occurrence and prognosis of OSCC are correlated with the dysfunction of oncogenes.6 Long noncoding RNAs (lncRNAs), although they do not encode proteins, were believed to have important biological functions.7–9 Studies have confirmed that the dysfunction of many lncRNAs was also involved in cancer progression and prognosis.10,11 AFAP1-AS1 is upregulated and plays an important role in a variety of tumors.12–17 For example, AFAP1-AS1 was overexpressed and promoted tumor growth in melanoma.18 However, the function of AFAP1-AS1 in OSCC has not been fully investigated.
In our study, we demonstrate that high expression of AFAP1-AS1 is associated with an unfavorable prognosis in OSCC. Bioinformatics analysis and high-throughput sequencing helped to study the role and related mechanisms. Furthermore, in vivo and in vitro experiments were performed to validate that AFAP1-AS1 functions as an oncogene in OSCC. Further studies revealed that knockdown of AFAP1-AS1 inhibited OSCC proliferation by suppressing CCNA2.
Materials and Methods
OSCC Datasets and Source
The data used in our study were obtained from the public database The Cancer Genome Atlas (TCGA) and the Gene Expression Omnibus (GEO). A total of 313 tumor cases with 30 normal controls for OSCC and corresponding phenotype information were downloaded from TCGA. The correlations between AFAP1-AS1 expression and clinical characteristics were explored based on TCGA-OSCC datasets. The GSE84805 dataset from GEO contained 12 paired OSCC tumors and normal tissue noncoding RNA profiling array data samples.
Cell Culture
The human OSCC cell line Cal 27 was obtained from the American Type Culture Collection, Manassas, VA. The cells were cultured in Dulbecco’s modified Eagle medium (DMEM, Sigma-Aldrich, St. Louis, MO, USA) in a humidified tissue culture incubator with 5% CO2 atmosphere at 37°C. The media were supplemented with 10% FBS and 1% penicillin-streptomycin.
Cell Transfection
The lentivirus used for AFAP1-AS1 knockdown (sh-AFAP1-AS1) and the corresponding negative control (sh-NC) were obtained from GeneChem (Shanghai, China). The virus was transfected for 72 h and then the culture was refreshed. Cells were cultured in medium with 2 µg/mL of puromycin for 2–3 weeks until there was no evidence of significant cell death. Cells were collected for subsequent sequencing detection and in vitro assays. Information regarding the vector construct and the three oligo sequences of all siRNAs are provided in Supplementary Figure 1 and Supplementary Table 1.
Quantitative Real-Time PCR
Total RNA was extracted and purified using the TRIzol reagent (Tiangen, Beijing, China). SYBR Green dye method was used to detect the mRNA expression levels after reverse transcription. The relative expression level was calculated using the 2−ΔΔCt method with GAPDH as a reference by quantitative real-time PCR (qRT-PCR). The sequence of primers used in our studies are supplied in Table 1.
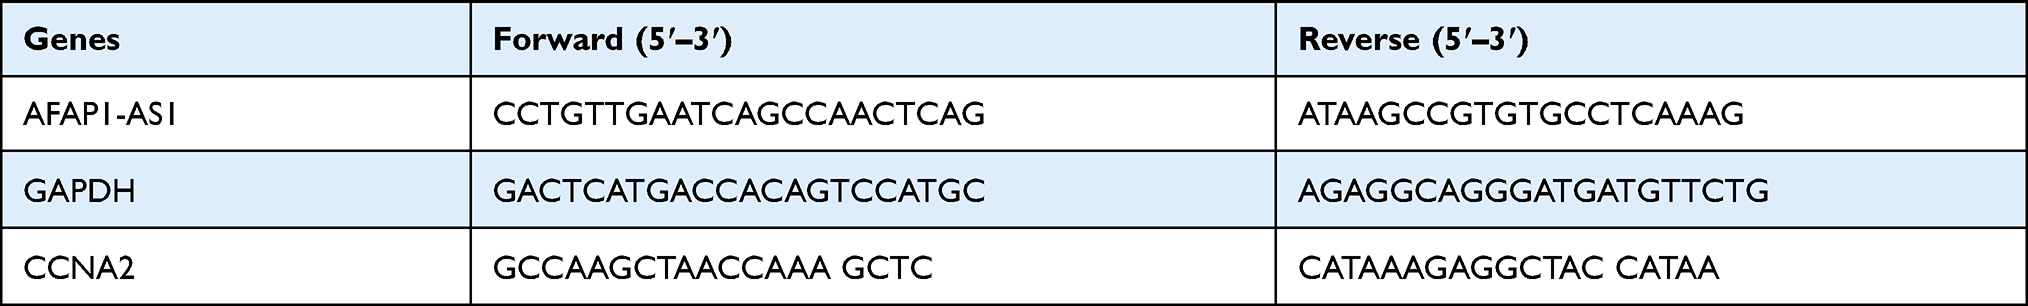 |
Table 1 Primers Used for Real‐Time PCR |
Cell-Counting Kit-8 Assay
The transfected Cal 27 cells were incubated in 96-well plates with 2000 cells per well. The optical density (OD) values were detected 2 h after refreshing the medium with 10% Cell-Counting Kit-8 (CCK-8). The OD value was measured at 450 nm with six replications each time.
Cell Cycle Analysis
The cells were cultured for 48 h, then harvested and washed with ice-cold PBS. After fixation in pre-cold ethanol, the cells were mixed and incubated with 1 mL DNA staining solution and 10 μL permeabilization solution for 30 min. The cell cycle distribution was analyzed on a flow cytometer (BECKMAN CytoFLEX). Data were determined and compared among groups.
RNA Sequencing Analysis
The cDNA library was constructed and RNA sequencing (RNA-seq) was performed using the Illumina Novaseq6000 platform. The original offline sequence (Raw Reads) obtained by sequencing was processed to obtain clean reads through the processes of removing low-quality sequences and connector contamination. Clean read data were used for subsequent analyses. The Deseq2 package R (version 1.30.0) was used to determine differentially expressed genes (DEGs) (cutoff: log2 FC>|1|, adjusted P-value<0.05). Unless specified otherwise, the DEGs mentioned herein refer to the DEGs between the sh-AFAP1-AS1#1 and sh-NC groups. Gene Ontology (GO) enrichment analysis was performed in the Metascape.19 The KEGG enrichment analysis was calculated following the clusterProfiler instruction of clusterProfiler (version 3.19.0).
Gene Set Enrichment Analysis (GSEA)
Gene set enrichment analysis (GSEA) (version v4.1.0 for Windows) was downloaded and used for GSEA following the instructions on the website. The gene sets database was selected as h.all.v7.2.symbols. GSEA was performed separately for three independent sets of data, including tumor and normal control samples in TCGA-OSCC, stratifying samples as AFAP1-AS1-high and AFAP1-AS1-low tumor samples to classify the AFAP1-AS1 phenotype inTCGA-OSCC, as well as sh-AFAP1-AS1 and sh-NC in our RNA-seq assays. Gene sets with normal p<0.05 and FDR <0.25 were significantly enriched.
Tumor Xenograft Assay
All animal experiments were carried out according to the guidelines for laboratory animals in the Animal Protection Law of the People’s Republic of China-2009 and were approved by the Animal Care and Use Committee of the Shandong Key Laboratory of Oral Tissue Regeneration. Female nude mice (6 weeks, 18–20 g) used for in vivo experiments were randomly divided into sh-AFAP1-AS1#1 group and sh-NC group. Stable transfected Cal 27 cells (1×10⁶ cells per site) were implanted subcutaneously on the back of the mice. The mice were euthanized 4 weeks after inoculation. The xenografts were excised and weighed. Furthermore, collected xenograft tissues were used for immunohistochemical (IHC) staining of cyclin A2.
Western Blotting
Western blotting experiments were performed according to the conventional procedure. The experimental methods and reagents were introduced in our previous studies.20 The primary antibodies used in this study were as follows, cyclin A2 (ab181591), c-Myc (ab32072), E2F2 (ab138515) and GAPDH (ab181602). The bands were finally analyzed by the ImageJ software.
Statistical Analysis
The data were presented as mean±standard deviation. The differences were compared by Student’s t-tests or one-way analyses of variance. The influence of AFAP1-AS1 or CCNA2 on the overall survival of OSCC patients was assessed using the Kaplan–Meier method. P < 0.05 was considered statistically significant.
Results
AFAP1-AS1 Was Upregulated in OSCC
The qualified data were successfully downloaded from TCGA and GEO. By analyzing the samples in TCGA-OSCC and the GSE8485, it was found that the expression levels of AFAP1-AS1 in cancer tissue samples were significantly higher than those in normal controls (Figure 1A and B). The abnormal expression was also found to be correlated with lymph node metastasis (N0 vs N1–N3), pathological grade (G1 vs G2/G3), tumor pathological stage (stage I vs stage II/IV) (Figure 1C–E). Overall survival analysis indicated that high expression of AFAP1-AS1 in OSCC predicted a worse prognosis (cutoff=median) (Figure 1F). The associations between AFAP1-AS1 and the clinicopathological characteristics in the TCGA-OSCC samples are summarized in Table 2. The results indicate that OSCC patients with relatively high expression of AFAP1-AS1 are more apt to suffer a lymphovascular invasion (P<0.05).
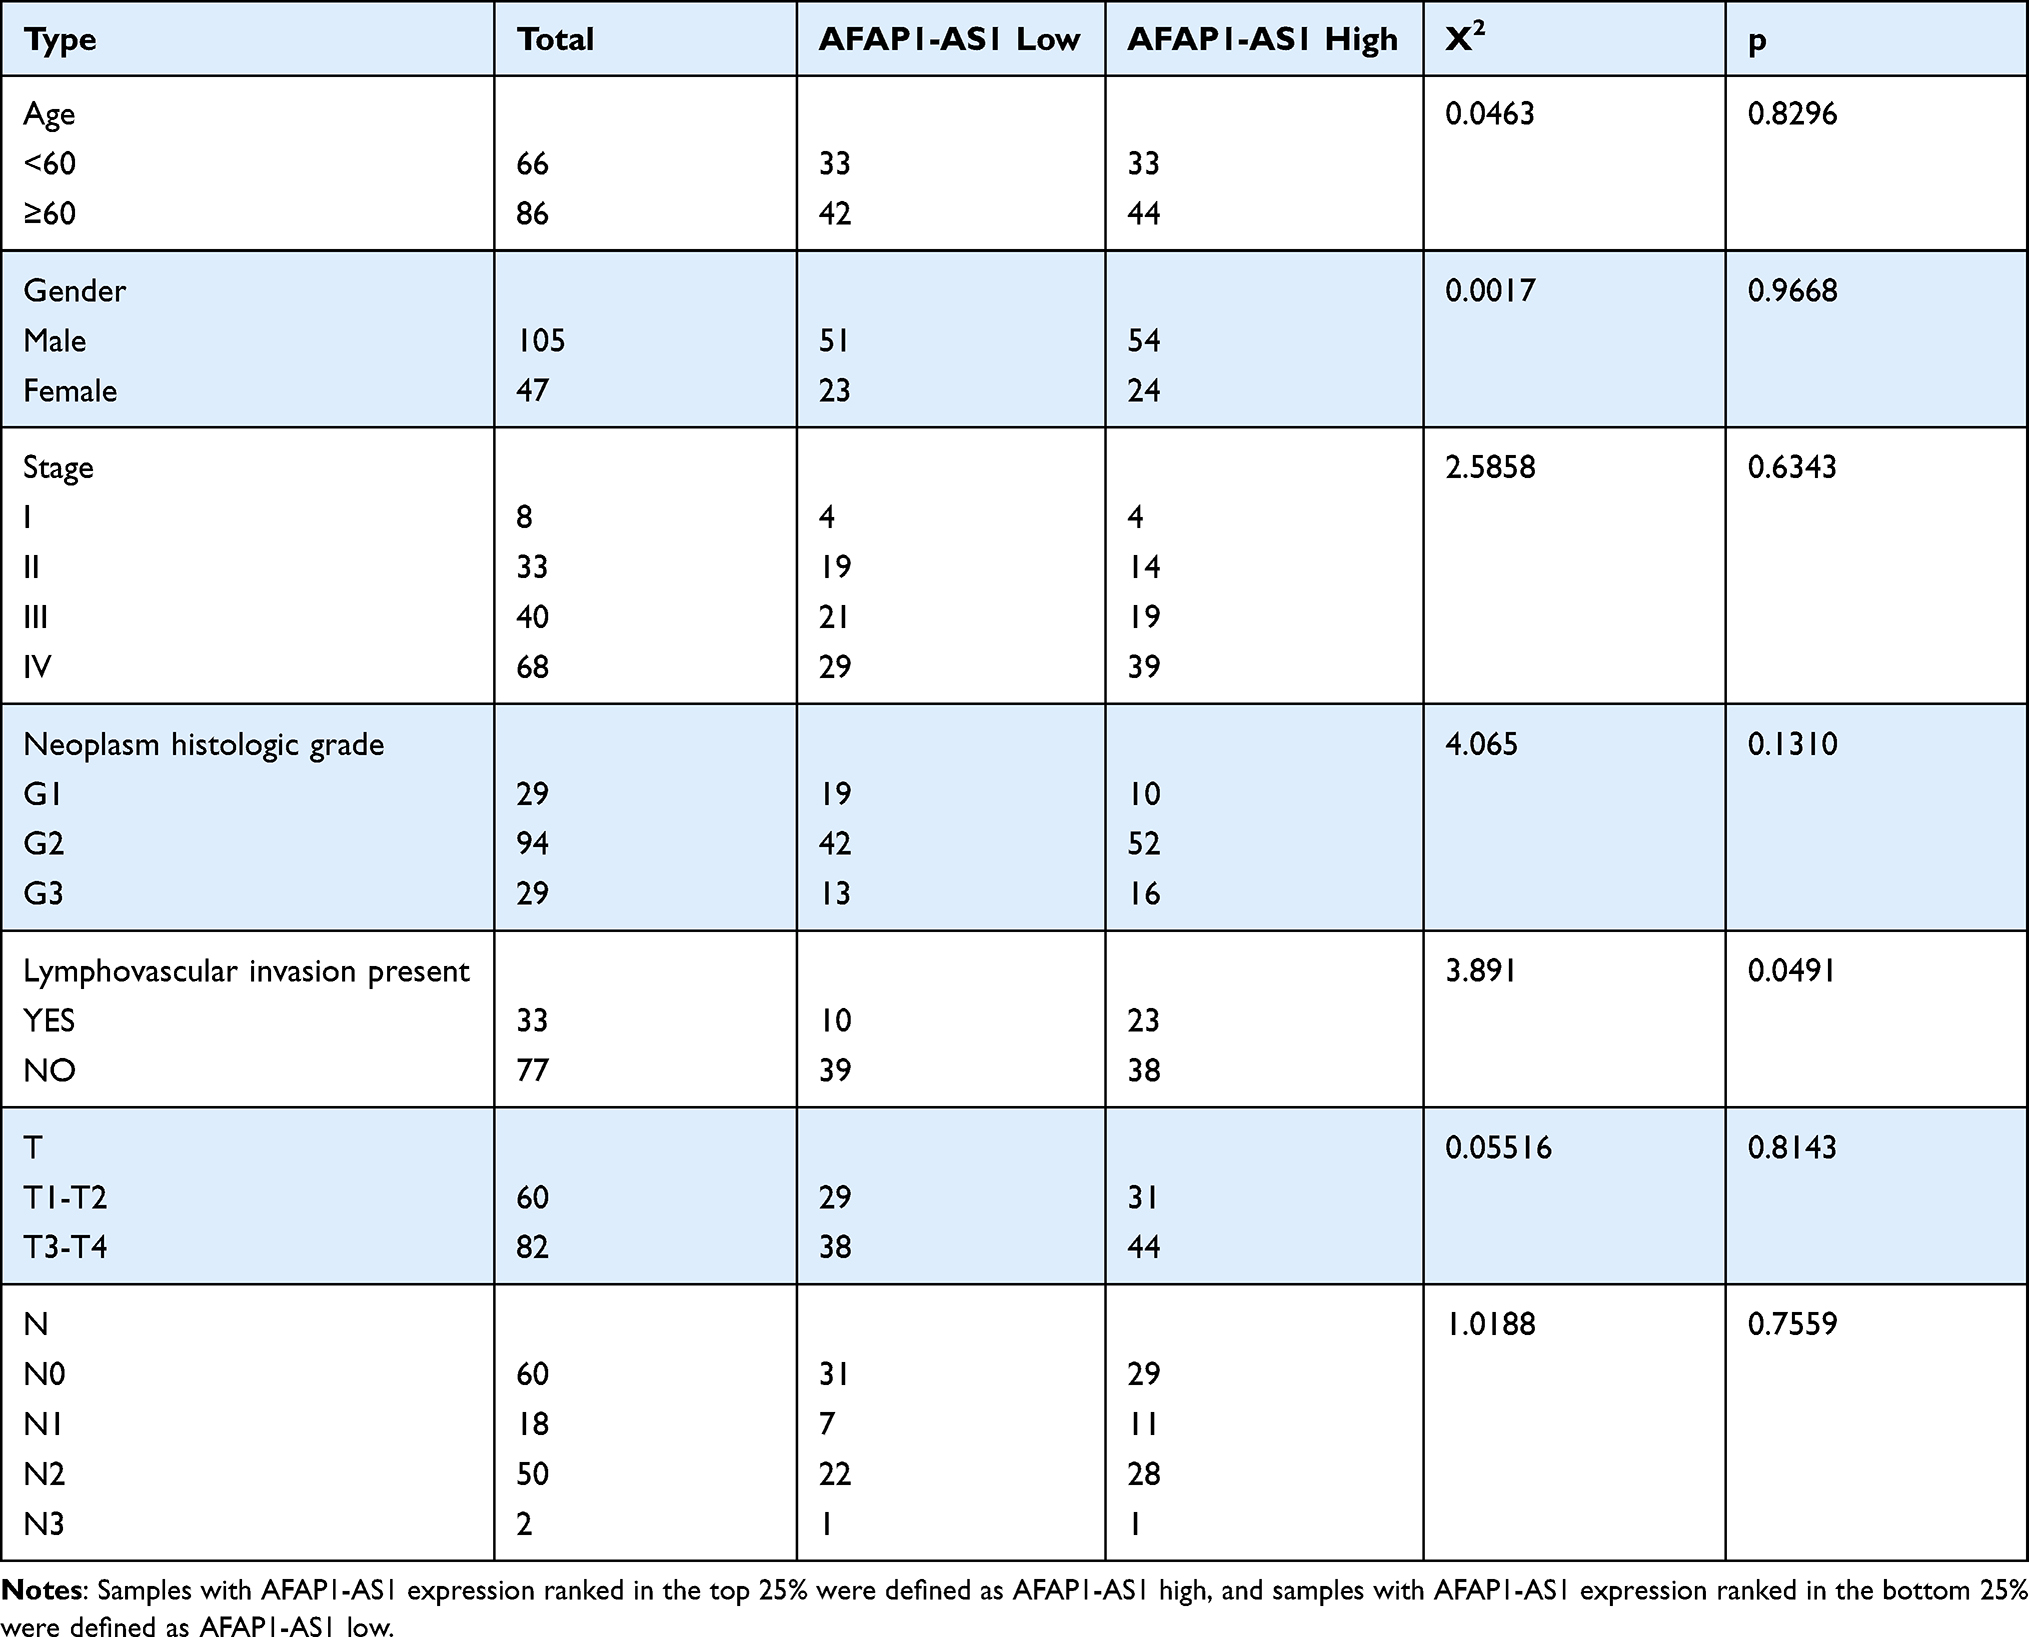 |
Table 2 Association of AFAP1-AS1 Expression with Clinicopathologic Features in TCGA OSCC |
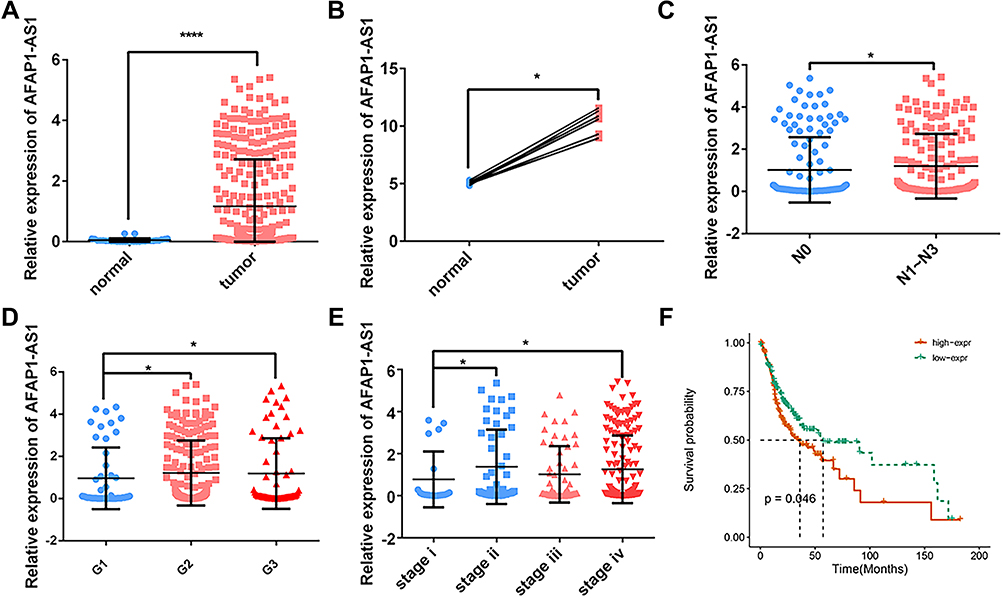 |
Figure 1 AFAP1-AS1 was up-regulated in OSCC and indicated a worse prognosis. AFAP1-AS1 expression was significantly higher in OSCC based on TCGA-OSCC (A) and GSE84505 (B) datasets. The expression of AFAP1-AS1 in TCGA-OSCC is grouped by lymph node metastasis (C), pathological grades (D), and pathological stages (E). (F) Overall survival based on AFAP1-AS1 expression in TCGA-OSCC (cutoff=median). *P<0.05 and ****P<0.0001. |
Knockdown AFAP1-AS1 Suppressed OSCC Proliferation in vitro
The expression levels of AFAP1-AS1 were knocked down significantly in Cal 27 cells transfected with sh-AFAP1-AS1 (Figure 2A). Significant inhibition of proliferation ability was observed using the CCK8 assay (Figure 2B). The colony formation assays indicated that down-regulation of AFAP1-AS1 in OSCC could induce a decrease in colony numbers. (Figure 2C and D). Flow cytometry showed that the knockdown of AFAP1-AS1 induced an increase in the proportion of cells in G0/G1 (Figure 2E and F).
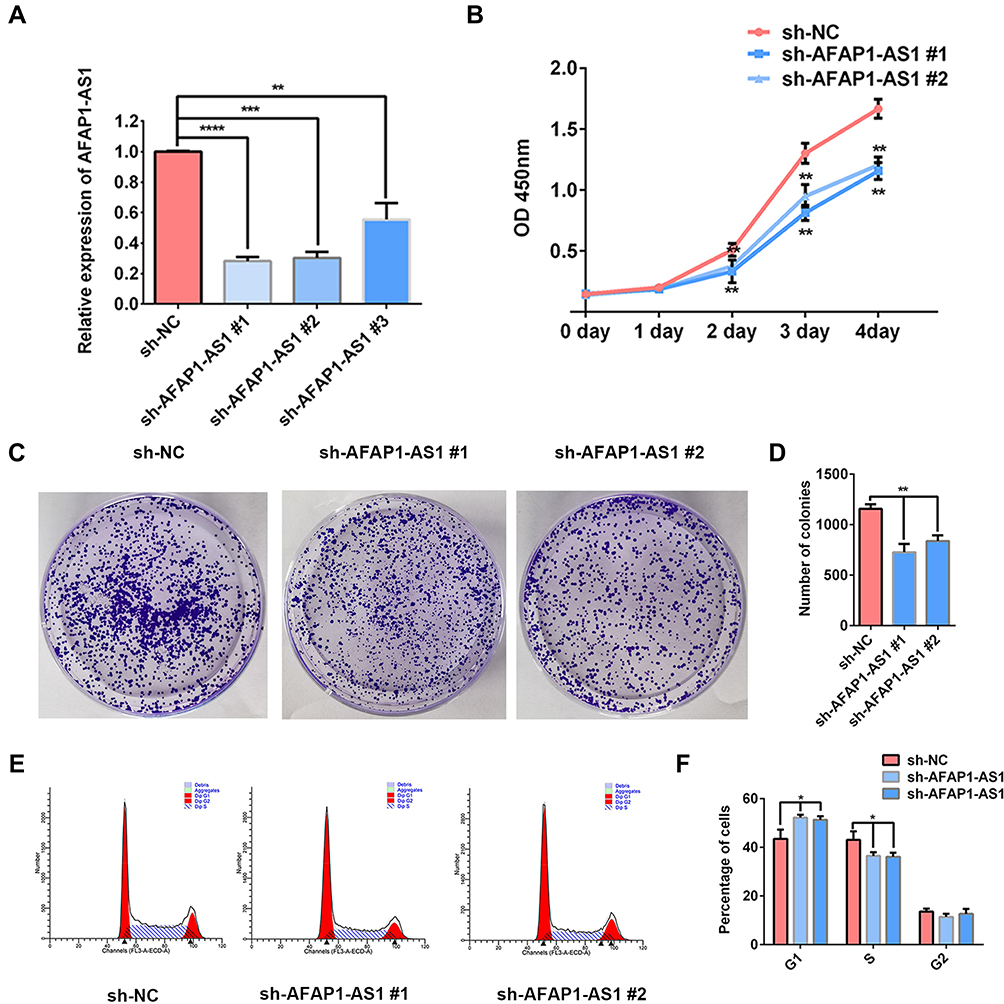 |
Figure 2 AFAP1-AS1 knockdown suppresses OSCC proliferation in vitro. (A) The expression of AFAP1-AS1 was dramatically decreased in Cal 27 by transfection with sh-AFAP1-AS1 lentivirus. CCK-8 (B) and colony formation assay (C and D) showed that AFAP1-AS1 knockdown inhibited Cal 27 cell proliferation in vitro. (E and F) The cell cycle was analyzed by flow cytometry. *P<0.05, **P<0.01, ***P<0.001; ****P<0.0001. |
Identification and Functional Enrichment of DEGs
The Cal 27 cells transfected with sh-AFAP1-AS1#1 and relative sh-NC were used for further RNA-seq assays by high-throughput sequencing technique. DEGs were calculated using the R package Deseq2 according to the software instructions. Finally, 1521 DEGs were identified with 947 genes upregulated and 574 genes downregulated (Figure 3A and B). The DEGs were uploaded to Metascape, an online database tool, for GO enrichment analysis. DEGs were found to be correlated with negative regulation of cell proliferation and positive regulation of cell death. (Figure 3C, Supplementary Figure 2). A total of 67 enriched pathways were found based on DEGs (p<0.05) (Supplementary Table 2) and the top 50 pathways are shown in Figure 3D.
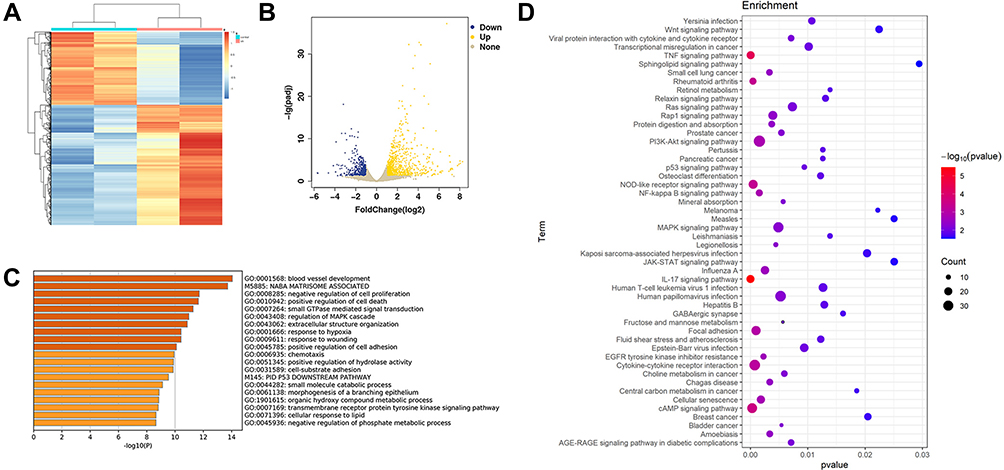 |
Figure 3 Bioinformatics analysis of RNA-seq results of sh-AFAP1-AS1 and sh-NC. (A and B) The heatmap and volcano plot showed the DEGs between Cal 27 sh-AFAP1-AS1 and sh-NC samples (C). Metascape bar graph exhibited the top 20 nonredundant GO enrichment clusters of the DEGs. (D) The bubble diagram showed the top 50 enriched KEGG pathways. |
AFAP1-AS1 Was Correlated with Enrichment of MYC Target Genes
GSEA was used to identify sets of differentially enriched genes between two groups of samples. Three pairs of samples were used for GSEA respectively (Figure 4A). HALLMARK_MYC_TARGETS V1 and V2 were found to be enriched in all three paired groups (Supplementary Tables 3–5). Firstly, the two gene sets were differentially enriched in the TCGA-OSCC tumor samples compared with TCGA-OSCC normal control samples. (Figure 4B and C) They were also enriched in TCGA-OSCC tumor samples with high AFAP1-AS1 expression compared with TCGA-OSCC tumor samples with low AFAP1-AS1 expression. (Figure 4D and E) Further, when compared Cal 27 sh-NC samples with Cal 27 sh-AFAP1-AS1 samples, the two gene sets were found to be enriched in the former (Figure 4F and G). In conclusion, it was found that MYC target gene sets were significantly enriched in groups with relatively high AFAP1-AS1 expression.
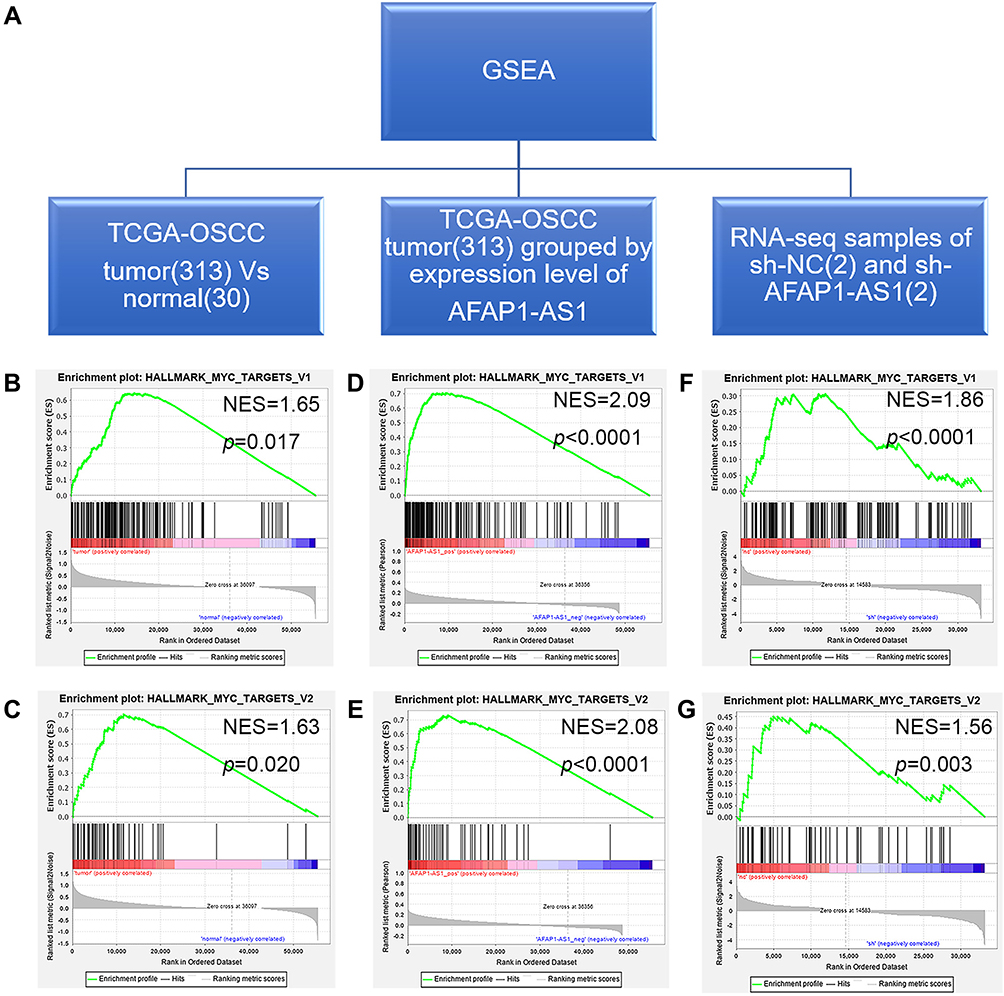 |
Figure 4 GSEA results indicated that the gene sets HALLMARK_MYC_TARGETS V1 and HALLMARK_MYC_TARGETS V2 were enriched in samples with relatively high expression of AFAP1-AS1. (A) Three independent GSEA datasets were evaluated. (B and C) The gene sets HALLMARK_MYC_TARGETS V1 and HALLMARK_MYC_TARGETS V2 were significantly enriched in TCGA-OSCC tumor samples compared to normal control samples. (D and E) The gene sets HALLMARK_MYC_TARGETS V1 and HALLMARK_MYC_TARGETS V2 were significantly enriched in TCGA-OSCC tumor samples with high expression of AFAP1-AS1. (F and G) The gene sets HALLMARK_MYC_TARGETS V1 and HALLMARK_MYC_TARGETS V2 were significantly enriched in the Cal 27 sh-NC group compared to the sh-AFAP1-AS1 group. |
Knocking Down AFAP1-AS1 Suppressed CCNA2 in OSCC
The HALLMARK_MYC_TARGETS V1 and V2 contain a subgroup of genes regulated by c-Myc. There are 241 genes in these two gene sets (Supplementary Table 6). The amplification of c-Myc was believed to be correlated with tumorigenesis and prognosis of multiple tumors. Next, the expression patterns of these c-Myc target genes in our RNA sequence data were investigated and 13 genes were found differentially expressed between sh-NC and sh-AFAP1-AS1 (Figure 5A). The protein–protein interaction (PPI) network of these genes was analyzed using the online STRING tool (https://string-db.org/). The PPI network indicated that CCNA2 was a hub gene in this subnet (Figure 5B). The correlation analysis suggested that the expression level of CCNA2 was positively correlated with AFAP1-AS1 in TCGA-OSCC (Figure 5C). High expression of CCNA2 predicted a worse 5-year overall survival rate (cutoff=median) (Figure 5D). The expression of CCNA2 was proved to be downregulated after AFAP1-AS1 knockdown by qRT-PCR in OSCC cells (Figure 5E). Further, Western blotting assays were conducted to analyze the changes in expression that were correlated with the cell cycle, including c-Myc, CCNA2, and E2F2. The expression of cyclin A2 was downregulated, while the expression of E2F2 was upregulated after AFAP1-AS1 knockdown in Cal 27 (Figure 5F and G). The protein levels of c- Myc showed no significant differences in expression. Since the lncRNA can function as micro-RNA (miRNA) molecular sponges,21 the miRNAs targets of both AFAP1-AS1 and CCNA2 were predicted using online databases. Three candidates were identified by the intersection of the two datasets: miR-655-3p, miR-320a, and miR-145-5p (Figure 5H and I).
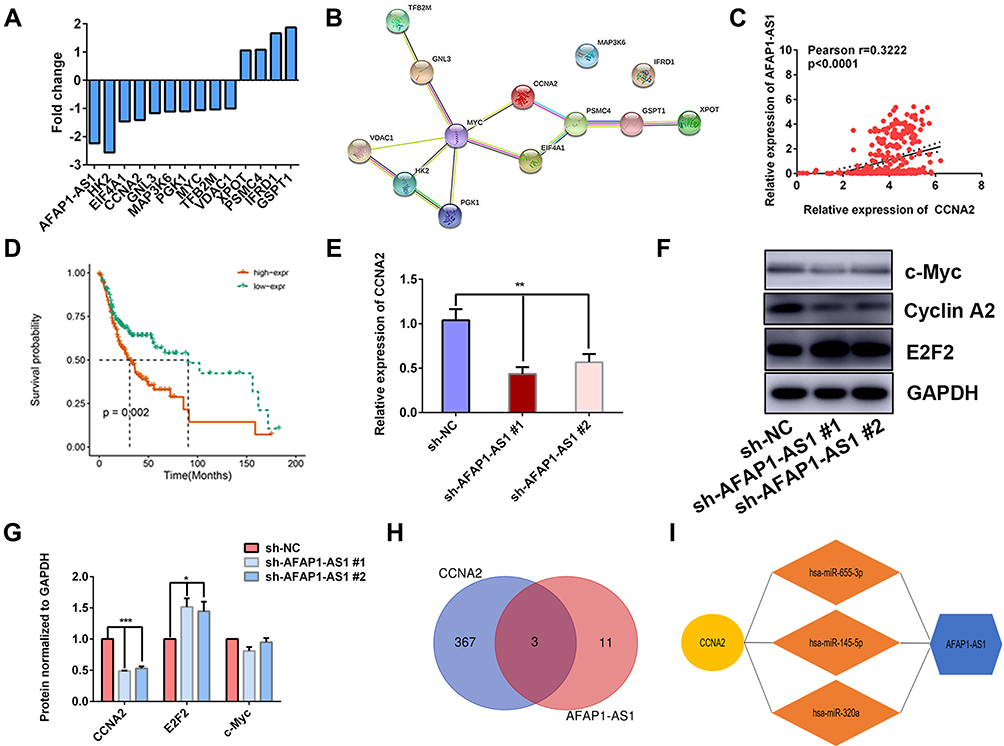 |
Figure 5 AFAP1-AS1 promotes OSCC proliferation by targeting CCNA2. (A) Bar graph showing the fold changes of 13 differentially expressed Myc target genes after AFAP1-AS1 knockdown. (B) PPI network of the 13 differential expressed genes. (C) Correlation analysis of AFAP1-AS1 and CCNA2 in OSCC based on TCGA-OSCC. (D) The high expression of the CCNA2 predicted poor prognosis in TCGA-OSCC. (E) qRT-PCR assays examined CCNA2 expression in Cal 27 cells after AFAP1-AS1 knockdown. (F and G) The expression of c-Myc, cyclin A2, and E2F2 was examined by Western blotting assay. (H and I) Three miRNAs were predicted to target both AFAP1-AS1 and CCNA2. *P<0.05; **P<0.01; and ***P<0.001. |
Knockdown AFAP1-AS1 Inhibited OSCC Tumor Growth in vivo
The nude mouse xenograft tumor model was established by injecting sh-AFAP1-AS1#1 and sh-NC in Cal 27 cells. The mice were euthanized 4 weeks after being implanted. The xenograft tumors were harvested and weighted. The mean tumor volume was significantly smaller in the sh-AFAP1-AS1 group, indicating tumor inhibition after AFAP1-AS1 was knocked down in vivo. (Figure 6A and B). The expression of cyclin A2 was proved to be downregulated after AFAP1-AS1 knockdown in Cal 27 by Western blotting assays in vitro (Figure 6C). Finally, the tumors were also used for preparing IHC staining with cyclin A2. The results of IHC analysis showed that the expression levels of cyclin A2 were decreased in tumors of the sh-AFAP1-AS1 group (Figure 6D).
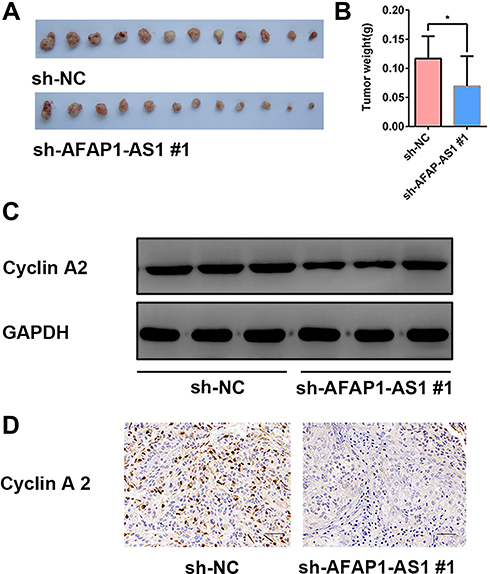 |
Figure 6 Knockdown of AFAP1-AS1 inhibited tumor growth and suppressed the expression of CCNA2 in vivo. (A and B) Tumor xenografts in the sh-AFAP1-AS1#1 group were significantly smaller than those in the sh-NC group. (C) Protein expression levels of cyclin A2 were determined by Western blotting of xenograft samples. (D) Representative IHC staining of cyclin A2 proteins in OSCC xenograft specimens. (×400). *P<0.05. |
Discussion
Although lncRNAs were not translated into proteins and were initially considered to be junk DNA, it has been demonstrated that lncRNAs perform important functions including transcriptional regulation and regulation of protein expression.22 Emerging evidence reveals that lncRNAs not only affect the adjacent genes in cis but also perform important regulatory functions throughout the cell in trans.23 AFAP1-AS1 was first reported to be overexpressed in Barrett’s esophagus and esophageal adenocarcinoma, and led to a reduction in cell apoptosis and the promotion of cell migration.24 Since then several studies have reported that dysfunction of AFAP1-AS1 was closely related to human oncogenesis, metastasis, and drug resistance in cancer.25–28 However, the underlying mechanisms behind these effects appeared to be multiple and complex. AFAP1-AS1 can influence gene regulation and genome complexity in cis or trans. As a typical example, AFAP1-AS1 was shown to enhance the cell migration of NSCLC via upregulating the expression of AFAP1.29 AFAP1-AS1 can also function as competing endogenous RNA (ceRNA) by binding to miRNAs.30 In pancreatic cancer, AFAP1-AS1 can upregulate ACVR1 and promote tumor cell stemness and tumorigenicity by functioning as a ceRNA of miR-384.31
To study the biological role of AFAP1-AS1 in OSCC, we searched the TCGA and GEO database for data sets with OSCC tumor and normal control samples. TCGA-OSCC and the GSE84805 datasets were downloaded and were subjected to further investigation. The results showed that AFAP1-AS1 was overexpressed in OSCC tumors. Meanwhile, the overexpression of AFAP1-AS1 in TCGA-OSCC datasets was associated with poor clinical phenotype and indicated an unfavorable prognosis for patients. In vitro experiments verified that silencing AFAP1-AS1 suppressed cell proliferation in OSCC. Further, transcriptome changes after AFAP1-AS1 gene knockdown by stable lentivirus infection were detected by next-generation sequencing, and the results were analyzed using a series of R packages. GO enrichment showed that the DEGs were enriched in the biological process of cell proliferation and cell death. KEGG enrichment analysis revealed the pathways in which DEGs were involved and some of these pathways were closely correlated with cancer progression, such as the PI3K/AKT pathway and the Wntβ-catenin signaling pathway.32–34
Although GO and KEGG enrichment analysis with the DEGs is an important tool used to identify the biological processes in which the target genes participate, extracting the complete biological information remains challenging. GSEA is another powerful analytical method we used in this study.35 As mentioned earlier, GSEA was performed on three data sets respectively. HALLMARK_MYC_TARGETS V1 and V2 were found to be enriched gene sets in these three analyses. c-Myc target genes tended to be enriched in OSCC samples with a higher level of expression of AFAP1-AS1. Previous studies have shown that c-Myc was involved in biological processes such as proliferation, apoptosis, and the cell cycle in OSCC.36,37 LncRNAs have been reported to regulate c-Myc in various ways.38,39 c-Myc or genes whose expression was regulated by c-Myc might prove to be viable therapeutic targets in cancer.40 RNA sequencing analysis showed that 13 genes were differentially expressed in OSCC after AFAP1-AS1 knockdown. Among these genes, we focused on CCNA2 in this study. CCNA2 protein has been reported to play a critical role and act as a prognostic biomarker in cancer.41,42 CCNA2 was also found to be overexpressed in TCGA-OSCC and predicted poor prognosis in our study. CCNA2 protein levels were identified to be down-regulated, while E2F2 expression levels were up-regulated after AFAP1-AS1 knockdown. E2F2 is a downstream gene of CCNA2 in the cell cycle pathway. In our study, the expression of E2F2 increased at the protein level on silencing of AFAP1-AS1 expression in OSCC, which was consistent with previous studies that indicated E2F2 might play a tumor suppressor role.43,44 However, our findings indicated that AFAP1-AF1 might not influence the expression of CCNA2 via regulating c-Myc. The subcellular location of AFAP1-AS1 appears to vary in different tumor cell lines.45,46 As AFAP1-AS1 has been reported to be mainly located in the cytoplasm of OSCC cells,47 it could regulate CCNA2 expression through the ceRNA network. Candidate miRNAs predicted by bioinformatics analyses were miR-655-3p, miR-320a, and miR-145-5p. Taking mir-145-5p for example, mir-145-5p was reported to suppress the expression of CCNA2 in esophageal squamous cell carcinoma, and to downregulate AFAP1-AS1 expression in triple-negative breast cancer cell.48,49 To clarify the regulatory relationship of AFAP1-AS1 and CCNA2, further experimental studies are still needed.
Conclusions
AFAP1-AS1 was identified as an unfavorable biomarker for OSCC. Knockdown of AFAP1-AS1 inhibited OSCC proliferation by interacting with CCNA2. This provides a basis for future treatment strategies of OSCC.
Author Contributions
All authors made a significant contribution to the work reported, whether that is in the conception, study design, execution, acquisition of data, analysis and interpretation, or in all these areas; took part in drafting, revising or critically reviewing the article; gave final approval of the version to be published; have agreed on the journal to which the article has been submitted; and agree to be accountable for all aspects of the work.
Disclosure
The authors report no conflicts of interest in this work.
References
1. Bray F, Ferlay J, Soerjomataram I, Siegel RL, Torre LA, Jemal A. Global cancer statistics 2018: GLOBOCAN estimates of incidence and mortality worldwide for 36 cancers in 185 countries. CA Cancer J Clin. 2018;68(6):394–424. doi:10.3322/caac.21492
2. Marur S, Forastiere AA. Head and neck squamous cell carcinoma: update on epidemiology, diagnosis, and treatment. Mayo Clin Proc. 2016;91(3):386–396. doi:10.1016/j.mayocp.2015.12.017
3. Kim D, Li R. Contemporary treatment of locally advanced oral cancer. Curr Treat Options Oncol. 2019;20(4):1–9. doi:10.1007/s11864-019-0631-8
4. Miller KD, Siegel RL, Lin CC, et al. Cancer treatment and survivorship statistics, 2016. CA Cancer J Clinicians. 2016;66(4):271–289. DOI:10.3322/caac.21349
5. Knudsen ES, Pruitt SC, Hershberger PA, Witkiewicz AK, Goodrich DW. Cell cycle and beyond: exploiting new RB1 controlled mechanisms for cancer therapy. Trends Cancer. 2019;5(5):308–324. doi:10.1016/j.trecan.2019.03.005
6. Sinevici N, O’sullivan J. Oral cancer: deregulated molecular events and their use as biomarkers. Oral Oncol. 2016;61:12–18. doi:10.1016/j.oraloncology.2016.07.013
7. Guttman M, Rinn JL. Modular regulatory principles of large non-coding RNAs. Nature. 2012;482(7385):339–346. doi:10.1038/nature10887
8. Tang J, Yan T, Bao Y, et al. LncRNA GLCC1 promotes colorectal carcinogenesis and glucose metabolism by stabilizing c-Myc. Nat Commun. 2019;10(1):1–15. doi:10.1038/s41467-019-11447-8
9. Yang Y, Wen L, Zhu H. Unveiling the hidden function of long non-coding RNA by identifying its major partner-protein. Cell Biosci. 2015;5(1):1–10. doi:10.1186/s13578-015-0050-x
10. Wang Y, Lan Q. Long non-coding RNA AFAP1-AS1 accelerates invasion and predicts poor prognosis of glioma. Eur Rev Med Pharmacol Sci. 2018;22(16):5223–5229. doi:10.26355/eurrev_201808_15720
11. Yang Y, Chen D, Liu H, Yang K. Increased expression of lncRNA CASC9 promotes tumor progression by suppressing autophagy-mediated cell apoptosis via the AKT/mTOR pathway in oral squamous cell carcinoma. Cell Death Dis. 2019;10(2). doi:10.1038/s41419-018-1280-8
12. Yin D, Lu X, Su J, et al. Long noncoding RNA AFAP1-AS1 predicts a poor prognosis and regulates non-small cell lung cancer cell proliferation by epigenetically repressing p21 expression. Mol Cancer. 2018;17(1):1–12. doi:10.1186/s12943-018-0836-7
13. Dai W, Tian Y, Jiang B, Chen W. Down-regulation of long non-coding RNA AFAP1-AS1 inhibits tumor growth, promotes apoptosis and decreases metastasis in thyroid cancer. Biomed Pharmacother. 2018;99(August2017):191–197. doi:10.1016/j.biopha.2017.12.105
14. Zhang JY, Weng MZ, Bin SF, et al. Long noncoding RNA AFAP1-AS1 indicates a poor prognosis of hepatocellular carcinoma and promotes cell proliferation and invasion via upregulation of the RhoA/Rac2 signaling. Int J Oncol. 2016;48(4):1590–1598. doi:10.3892/ijo.2016.3385
15. Ma F, Wang SH, Cai Q, Di ZM, Yang Y, Ding J. Overexpression of LncRNA AFAP1-AS1 predicts poor prognosis and promotes cells proliferation and invasion in gallbladder cancer. Biomed Pharmacother. 2016;84:1249–1255. doi:10.1016/j.biopha.2016.10.064
16. Zhao Y, Chu Y, Sun J, Song R, Li Y, Xu F. LncRNA GAS8-AS inhibits colorectal cancer (CRC) cell proliferation by downregulating lncRNA AFAP1-AS1. Gene. 2019;710:140–144. doi:10.1016/j.gene.2019.05.040
17. Fei D, Zhang X, Lu Y, Tan L, Xu M, Zhang Y. Long noncoding RNA AFAP1-AS1 promotes osteosarcoma progression by regulating miR-497/IGF1R axis. Am J Transl Res. 2020;12(5):2155–2168.
18. Liu F, Hu L, Pei Y, et al. Long non-coding RNA AFAP1-AS1 accelerates the progression of melanoma by targeting miR-653-5p/RAI14 axis. BMC Cancer. 2020;20(1):1–11. doi:10.1186/s12885-020-6665-2
19. Zhou Y, Zhou B, Pache L, et al. Metascape provides a biologist-oriented resource for the analysis of systems-level datasets. Nat Commun. 2019;10(1). doi:10.1038/s41467-019-09234-6
20. Li T, Wu Q, Liu D, Wang X. miR-27b suppresses tongue squamous cell carcinoma epithelial-mesenchymal transition by targeting ITGA5. Onco Targets Ther. 2020;13:11855–11867. doi:10.2147/OTT.S281211
21. Shen W, Yu L, Cong A, et al. Silencing lncRNA AFAP1-AS1 inhibits the progression of esophageal squamous cell carcinoma cells via regulating the miR-498/ VEGFA axis. Cancer Manag Res. 2020;12:6397–6409. doi:10.2147/CMAR.S254302
22. Kopp F, Mendell JT. Functional classification and experimental dissection of long noncoding RNAs. Cell. 2018;172(3):393–407. doi:10.1016/j.cell.2018.01.011
23. Derrien T, Johnson R, Bussotti G, et al. The GENCODE v7 catalog of human long noncoding RNAs: analysis of their gene structure, evolution, and expression. Genome Res. 2012;22(9):1775–1789. doi:10.1101/gr.132159.111
24. Wu W, Bhagat TD, Yang X, et al. Hypomethylation of noncoding DNA regions and overexpression of the long noncoding RNA, AFAP1-AS1, in Barrett’s esophagus and esophageal adenocarcinoma. Gastroenterology. 2013;144(5):956–966. doi:10.1053/j.gastro.2013.01.019
25. Zhang F, Li J, Xiao H, Zou Y, Liu Y, Huang W. AFAP1-AS1: a novel oncogenic long non-coding RNA in human cancers. Cell Prolif. 2018;51(1):1–11. doi:10.1111/cpr.12397
26. Wang F, Ni H, Sun F, Li M, Chen L. Overexpression of lncRNA AFAP1-AS1 correlates with poor prognosis and promotes tumorigenesis in colorectal cancer. Biomed Pharmacother. 2016;81:152–159. doi:10.1016/j.biopha.2016.04.009
27. Guo JQ, Li SJ, Guo GX. Long noncoding RNA AFAP1-AS1 promotes cell proliferation and apoptosis of gastric cancer cells via PTEN/p-AKT pathway. Dig Dis Sci. 2017;62(8):2004–2010. doi:10.1007/s10620-017-4584-0
28. Hao F, Mou Y, Zhang L, Wang S, Yang Y. LncRNA AFAP1-AS1 is a prognostic biomarker and serves as oncogenic role in retinoblastoma. Biosci Rep. 2018;38(3):1–8. doi:10.1042/BSR20180384
29. He J, Wu K, Guo C, et al. Long non-coding RNA AFAP1-AS1 plays an oncogenic role in promoting cell migration in non-small cell lung cancer. Cell Mol Life Sci. 2018;75(24):4667–4681. doi:10.1007/s00018-018-2923-8
30. Fu Z, Li G, Li Z, et al. Endogenous miRNA Sponge LincRNA-ROR promotes proliferation, invasion and stem cell-like phenotype of pancreatic cancer cells. Cell Death Discovery. 2017;3(1). doi:10.1038/cddiscovery.2017.4
31. Wu XB, Feng X, Chang QM, et al. Cross-talk among AFAP1-AS1, ACVR1 and microRNA-384 regulates the stemness of pancreatic cancer cells and tumorigenicity in nude mice. J Exp Clin Cancer Res. 2019;38(1):1–15. doi:10.1186/s13046-019-1051-0
32. Liu Y, Hu Q, Wang X. (2.311) AFAP1-AS1 induces cisplatin resistance in non-small cell lung cancer through PI3K/AKT pathway. Oncol Lett. 2020;19(1):1024–1030. doi:10.3892/ol.2019.11175
33. Bi Z, Li Q, Dinglin X, et al. Nanoparticles (NPs)-Meditated LncRNA AFAP1-AS1 silencing to block Wnt/β-Catenin signaling pathway for synergistic reversal of radioresistance and effective cancer radiotherapy. Adv Sci. 2020;7(18):1–14. doi:10.1002/advs.202000915
34. Zhang K, Liu P, Tang H, et al. AFAP1-AS1 Promotes epithelial-mesenchymal transition and tumorigenesis through Wnt/β-catenin signaling pathway in triple-negative breast cancer. Front Pharmacol. 2018;9:1–13. doi:10.3389/fphar.2018.01248
35. Subramanian A, Tamayo P, Mootha VK, et al. Gene set enrichment analysis: a knowledge-based approach for interpreting genome-wide expression profiles. Proc Natl Acad Sci U S A. 2005;102(43):15545–15550. doi:10.1073/pnas.0506580102
36. Meškytė EM, Keskas S, Ciribilli Y. MYC as a multifaceted regulator of tumor microenvironment leading to metastasis. Int J Mol Sci. 2020;21(20):7710. doi:10.3390/ijms21207710
37. Pérez-Sayáns M, Suárez-Peñaranda JM, Pilar GD, Barros-Angueira F, Gándara-Rey JM, García-García A. What real influence does the proto-oncogene c-myc have in OSCC behavior? Oral Oncol. 2011;47(8):688–692. doi:10.1016/j.oraloncology.2011.05.016
38. Hua Q, Jin M, Mi B, et al. LINC01123, a c-Myc-activated long non-coding RNA, promotes proliferation and aerobic glycolysis of non-small cell lung cancer through miR-199a-5p/c-Myc axis. J Hematol Oncol. 2019;12(1):1–18. doi:10.1186/s13045-019-0773-y
39. Swier LJYM, Dzikiewicz-Krawczyk A, Winkle M, van den Berg A, Kluiver J. Intricate crosstalk between MYC and non-coding RNAs regulates hallmarks of cancer. Mol Oncol. 2019;13(1):26–45. doi:10.1002/1878-0261.12409
40. Robson S, Pukonen I, Abouna S, Pelengaris S, Khan M. c-Myc and downstream targets in the pathogenesis and treatment of cancer. Front Anti-Cancer Drug Discov. 2011;340–379. doi:10.2174/978160805161811001010340
41. Gao T, Han Y, Yu L, Ao S, Li Z, Ji A. CCNA2 is a prognostic biomarker for ER+ breast cancer and tamoxifen resistance. PLoS One. 2014;9(3):1–5. doi:10.1371/journal.pone.0091771
42. Blanchard JM. Cyclin A2 transcriptional regulation: modulation of cell cycle control at the G1/S transition by peripheral cues. Biochem Pharmacol. 2000;60(8):1179–1184. doi:10.1016/S0006-2952(00)00384-1
43. Li T, Luo W, Liu K, Lv X, Xi T. miR-31 promotes proliferation of colon cancer cells by targeting E2F2. Biotechnol Lett. 2015;37(3):523–532. doi:10.1007/s10529-014-1715-y
44. Infante A, Laresgoiti U, Fernández-Rueda J, et al. E2F2 represses cell cycle regulators to maintain quiescence. Cell Cycle. 2008;7(24):3915–3927. doi:10.4161/cc.7.24.7379
45. Ma HW, Xi DY, Ma JZ, et al. Long noncoding RNA AFAP1-AS1 promotes cell proliferation and metastasis via the miR-155-5p/FGF7 axis and predicts poor prognosis in gastric cancer. Dis Markers. 2020:2020. doi:10.1155/2020/8140989.
46. Shi D, Wu F, Mu S, et al. LncRNA AFAP1-AS1 promotes tumorigenesis and epithelial-mesenchymal transition of osteosarcoma through RhoC/ROCK1/p38MAPK/Twist1 signaling pathway. J Exp Clin Cancer Res. 2020;39(1):1–12. doi:10.1186/s13046-020-01574-2
47. Li M, Yu D, Li Z, Zhao C, Su C, Ning J. Long non-coding RNA AFAP1-AS1 facilitates the growth and invasiveness of oral squamous cell carcinoma by regulating the miR-145/HOXA1 axis. Oncol Rep. 2021;45(3):1094–1104. doi:10.3892/or.2020.7908
48. Mei LL, Wang WJ, Qiu YT, Xie XF, Bai J, Shi ZZ. miR-145-5p suppresses tumor cell migration, invasion and epithelial to mesenchymal transition by regulating the sp1/NF-kB signaling pathway in esophageal squamous cell carcinoma. Int J Mol Sci. 2017;18(9):1833. doi:10.3390/ijms18091833
49. Zhang X, Zhou Y, Mao F, Lin Y, Shen S, Sun Q. lncRNA AFAP1-AS1 promotes triple negative breast cancer cell proliferation and invasion via targeting miR-145 to regulate MTH1 expression. Sci Rep. 2020;10(1):1–11. doi:10.1038/s41598-020-64713-x
 © 2021 The Author(s). This work is published and licensed by Dove Medical Press Limited. The full terms of this license are available at https://www.dovepress.com/terms.php and incorporate the Creative Commons Attribution - Non Commercial (unported, v3.0) License.
By accessing the work you hereby accept the Terms. Non-commercial uses of the work are permitted without any further permission from Dove Medical Press Limited, provided the work is properly attributed. For permission for commercial use of this work, please see paragraphs 4.2 and 5 of our Terms.
© 2021 The Author(s). This work is published and licensed by Dove Medical Press Limited. The full terms of this license are available at https://www.dovepress.com/terms.php and incorporate the Creative Commons Attribution - Non Commercial (unported, v3.0) License.
By accessing the work you hereby accept the Terms. Non-commercial uses of the work are permitted without any further permission from Dove Medical Press Limited, provided the work is properly attributed. For permission for commercial use of this work, please see paragraphs 4.2 and 5 of our Terms.