")
Back to Journals » Diabetes, Metabolic Syndrome and Obesity » Volume 13
Silencing of KCNQ1OT1 Decreases Oxidative Stress and Pyroptosis of Renal Tubular Epithelial Cells
Authors Zhu B, Cheng X, Jiang Y, Cheng M, Chen L, Bao J, Tang X
Received 2 August 2019
Accepted for publication 17 December 2019
Published 13 February 2020 Volume 2020:13 Pages 365—375
DOI https://doi.org/10.2147/DMSO.S225791
Checked for plagiarism Yes
Review by Single anonymous peer review
Peer reviewer comments 4
Editor who approved publication: Prof. Dr. Antonio Brunetti
Bei Zhu,1 Xingbo Cheng,2 Yilan Jiang,3 Ming Cheng,4 Luping Chen,3 Jiajun Bao,3 Xiaofeng Tang3
1Department of Endocrinology, The First Affiliated Hospital of Soochow University, Suzhou 215006, People’s Republic of China, Department of Endocrinology, Rugao People’s Hospital, Nantong 226500, People’s Republic of China; 2Department of Endocrinology, The First Affiliated Hospital of Soochow University, Suzhou 215006, People’s Republic of China; 3Department of Endocrinology, Rugao People’s Hospital, Nantong 226500, People’s Republic of China; 4School of Rail Transportation, Soochow University, Suzhou 215131, People’s Republic of China
Correspondence: Xingbo Cheng
Department of Endocrinology, The First Affiliated Hospital of Soochow University, 188 Shizi Street, Suzhou 215006, People’s Republic of China
Email [email protected]
Ming Cheng
School of Rail Transportation, Soochow University, 8 Ji Xue Road., Xiangcheng District, Suzhou 215131, People’s Republic of China
Email [email protected]
Background: Long noncoding RNAs (lncRNAs) can regulate the progression of DN. This research aimed to study the effect of lncRNA KCNQ1OT1 on the oxidative stress and pyroptosis of the renal tubular epithelial cells induced by high glucose (HG).
Methods: RT-qPCR analysis detected the KCNQ1OT1 expression in serum with DN and HG-induced HK-2 cells, detect the expression of NLRP3, cleaved-caspase1, P-caspase1, IL-1β, p-IL-1β and GSDMD-N in HG-induced HK-2 cells, and confirm the transfection effects. The expression of NLRP3, cleaved-caspase1, P-caspase1, IL-1β, p-IL-1β and GSDMD-N in HG-induced HK-2 cells was also analyzed by Western blot analysis. ELISA assay detected the levels of TNF-α, IL-6 and MCP-1. The levels of ROS, MDA and SOD were determined by respective ELISA kits and ROS was also detected by the ROS assay kit (containing DCFH-DA).
Results: We found that KCNQ1OT1 was increased in the plasma of patients with DN and HG-induced HK-2 cells and KCNQ1OT1 interference could decrease the inflammation, oxidative stress and pyroptosis of HG-induced HK-2 cells. In addition, KCNQ1OT1 directly targets miR-506-3p. MiR-506-3p was downregulated in the plasma of patients with DN and HG-induced HK-2 cells and KCNQ1OT1 interference promoted the expression of miR-506-3p. MiR-506-3p overexpression suppressed the inflammation, oxidative stress and pyroptosis of HG-induced HK-2 cells.
Conclusion: This study demonstrated that downregulation of KCNQ1OT1 inhibited the inflammation, oxidative stress and pyroptosis of HG-induced HK-2 cells by up-regulating the expression of miR-506-3p, which provide new insights into the treatment of DN.
Keywords: LncRNA KCNQ1OT1, oxidative stress, pyroptosis, diabetic nephropathy, renal tubular epithelial cells
Introduction
Diabetic nephropathy (DN) is a major diabetic complication and the main inducing factor for end-stage kidney diseases. The latest epidemiological data showed that DN as end-stage nephropathy was a major dead cause in patients with diabetes.1,2 By 2017, 114.4 million people suffered from diabetes in China, ranking first in the world.3 Among all complications of diabetes, DN is the most common complication and the conditions of about 20% to 30% of diabetic patients eventually deteriorate into DN.4 Therefore, it is very important to apply new methods to prevent and treat DN in order to improve the quality of life for diabetic patients.
With the length of more than 200 nucleotides,5 long noncoding RNAs (lncRNAs) were crucial in various diseases.6 Recent studies have found the role of lncRNAs in tumor,7,8 and cardiovascular diseases.9,10 Many diseases related to lncRNAs in kidney disease have been reported to show diagnostic significance.11,12 LINC00472 has demonstrated to be a diagnostic marker for DN.13 LncRNA MEG3 interference protected the hypoxia-induced kidney injury in acute renal allografts by inhibiting the TNF-α expression. LncRNA PRINS was obviously increased in patients with DN and lncRNA PRINS overexpression declined the viability of mouse podocyte cells.14 Studies have shown that lncRNA KCNQ1OT1 expression is increased in patients with diabetic cardiomyopathy, and KCNQ1OT1 interference can reduce the functional damage to diabetic cardiomyocytes and the pyroptosis of cells.15,16 Mary E. Travers et al have demonstrated that CDKN1C, KCNQ1, and KCNQ1OT1 are possibly mediate diabetes susceptibility at the KCNQ1 locus and mediate the diabetes risk in early development. This shows that lncRNAs are related to kidney diseases including the DN and KCNQ1OT1 is related to diabetes. However, the role of KCNQ1OT1 in DN is still unknown.
Therefore, this research aimed to investigate the expression of KCNQ1OT1 in the plasma of patients with DN and its effect on the oxidative stress and pyroptosis of HK-2 cells induced by high glucose (HG).
Materials and Methods
Human Serum Specimens
The clinical trial was approved by the Human Ethics Committee Review Board of the First Affiliated Hospital of Soochow University, and every patient signed the informed consent. Serum samples were collected from 30 DN patients and 30 healthy people in the First Affiliated Hospital of Soochow University between September 2017 and August 2018. All patients were diagnosed according to the standard established by the Chinese Medical Association (2014). All patients were firstly diagnosed and treated. Diagnostic criteria for DN are as follows: (1) Urine albumin excretion rate (UAER) is continued to be greater than 200 μg/min or positive urine protein (urine protein ration is greater than 0.5g/24h); (2) Radionuclide dynamic glomerular filtration rate (GFR) and kidney volume are increased; (3) Qualitative examination of urine sugar; (4) Endogenous creatinine clearance rate is decreased and blood urea nitrogen and creatinine increased. The clinical data for patients and controls are presented in the Supplementary Materials.
Cell Culture and HG Induction
HK-2 cells were obtained from American Type Culture Collection (ATCC). HK-2 cells were cultured in DMEM/F12 medium (containing 10% fetal bovine serum) in a constant temperature incubator at 37°C with 5% CO2 and saturated humidity. In the normal group, HK-2 cells were handled with 5.5 mmol/l glucose for 12 h, 24 h and 48 h. In the HG group, HK-2 cells were handled with 30 mmol/l glucose for 12 h, 24 h and 48 h.
Cell Transfection
ShRNA-NC, ShRNA-KCNQ1OT1-1, ShRNA-KCNQ1OT1-2, miRNA-NC, miR-506-3p mimic, pcDNA-NC and pcDNA-KCNQ1OT1 were transfected into the HK-2 cells using Lipofectamine® 2000 reagent (Thermo Fisher Scientific, Inc., USA). In the control group, HK-2 cells received no treatment. RT-qPCR analysis was used to confirm the transfection effects.
RT-qPCR Analysis
Total RNA in plasma and cells were isolated by TRIzol method (Thermo Fisher Scientific, Inc.), and RNA was, respectively, reverse-transcribed into cDNA by miRNA reverse transcription kit and PCR reverse transcription kit (Thermo Fisher Scientific, Inc.) under the following thermocycling conditions: 25°C for 5 min; 50°C for 20 min and 80°C for 20 min. mRNA expression levels were quantified by the 2−ΔΔCq method and normalized to the internal control GAPDH.
Enzyme-Linked Immunosorbent Assay (ELISA)
After cell transfection and HG induction for 48 hrs, the supernatant of cell medium was collected and the levels of TNF-α, IL-6 and MCP-1 were determined by ELISA kits according to the instructions.
ROS, MDA and SOD Measurement
After cell transfection and HG induction for 48 hrs, the levels of ROS, MDA and SOD in the supernatant of cell medium were detected with respective ELISA assay kits and analyzed with a microplate reader. DCFH-DA (Molecular probes, Dalian Meilun Biotechnology Co., LTD, China) was also used to detect the intercellular ROS level which was conducted according to the previous study.17
Western Blot Analysis
After transfection for 48 hrs, cells were added with RIPA lysate, which were centrifuged to separate the protein and supernatant. The BCA protein detection kit was used to measure protein content. Proteins were separated by 12% SDS-PAGE gels and transferred to polyvinylidene fluoride (PVDF) membranes (Merck Millipore, USA) which were sealed by 5% non-fat milk powder. Primary antibodies of NLRP3, cleaved-caspase1, Pro-caspase1, IL-1β, Pro-IL-1β, GSDMD-N and GPADH were added to the membranes overnight at 4°C. After that, secondary antibody was added, and the protein was illuminated and colored by ECL. GAPDH was the internal control. The relative protein expression was analyzed by Image J software.
Immunofluorescence
After cell transfection and HG induction for 48 hrs, the slides of HK-2 cells were fixed with 4% paraformaldehyde and vitrified with 0.5%Triton X-100. Normal 5–10% goat serum was added onto the glass slides which were sealed at room temperature for 30 min. Then, slides were incubated against GSDMD-N in wet box device overnight at 4°C and secondary antibody at 37°C for 10–30 min. At last, slides stained with DAPI in dark for 5 min, and treated by sealing liquid. The fluorescence images were observed and collected under a fluorescence microscope.
Dual-Luciferase Reporter Assay
According to starBase software, miR-506-3p was predicted to be a potential target of KCNQ1OT1. In order to verify this prediction, we performed the dual-luciferase reporter assay according to the previous study.18
Statistical Analysis
The measurement data of normal distribution were expressed as mean ± standard deviation, and SPSS 20.0 software analyzed the data. One way ANOVA analyzed the differences between multiple groups with LSD-t method. T-test analyzed the differences between two groups. P<0.05 was considered as statistically significant difference.
Results
KCNQ1OT1 Was Increased in the Plasma of Patients with DN and HG-Induced HK-2 Cells
The serum of patients with DN and healthy people was collected and the KCNQ1OT1 expression was obviously up-regulated in patients with DN compared with healthy people (Figure 1A). The expression of KCNQ1OT1 was gradually increased when the induction time of HG for HK-2 cells was prolonged (Figure 1B). Therefore, HK-2 cells induced by HG for 48 hrs were selected to simulate DN cells.
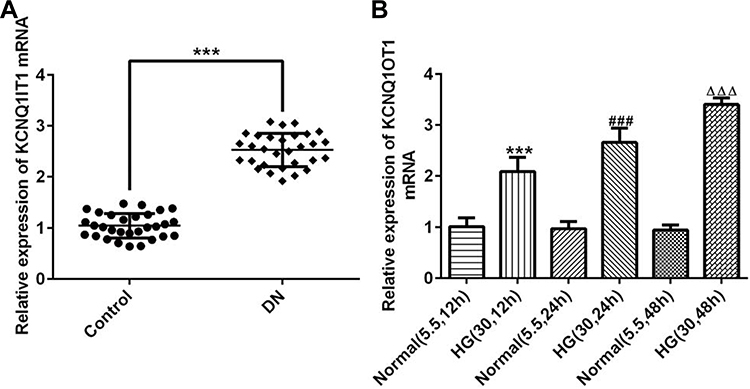 |
Figure 1 KCNQ1OT1 was increased in the plasma of patients with DN and HG-induced HK-2 cells. (A) KCNQ1OT1 expression was up-regulated in the plasma of patients with DN. ***P<0.001 vs. control group. (B) KCNQ1OT1 expression was gradually up-regulated in HG-induced HK-2 cells with time. ***P<0.001 vs. normal (5.5, 12 hrs) group. ###P<0.001 vs. normal (5.5, 24 hrs) group. ∆∆∆P<0.001 vs. normal (5.5, 48 hrs) group. (n=3). |
KCNQ1OT1 Interference Reduced the Expression of Inflammatory Factors in HG-Induced HK-2 Cells
The transfection effects of ShRNA-KCNQ1OT1 were determined by RT-qPCR. KCNQ1OT1 expression was down-regulated in HK-2 cells transfected with ShRNA-KCNQ1OT1-1 and ShRNA-KCNQ1OT1-2, and KCNQ1OT1 expression in HK-2 cells transfected with ShRNA-KCNQ1OT1-1 was less than that in HK-2 cells transfected with ShRNA-KCNQ1OT1-2 (Figure 2A). Therefore, ShRNA-KCNQ1OT1-1 was selected for the subsequent experiment. Increased inflammation is a vital mechanism in the development of DN. As shown in Figure 2B–D, the levels of TNF-α, IL-6 and MCP-1 were increased in HG-induced HK-2 cells and KCNQ1OT1-1 interference decrease the levels of TNF-α, IL-6 and MCP-1 in HG-induced HK-2 cells. Therefore, KCNQ1OT1 interference inhibited the inflammation in HG-induced HK-2 cells.
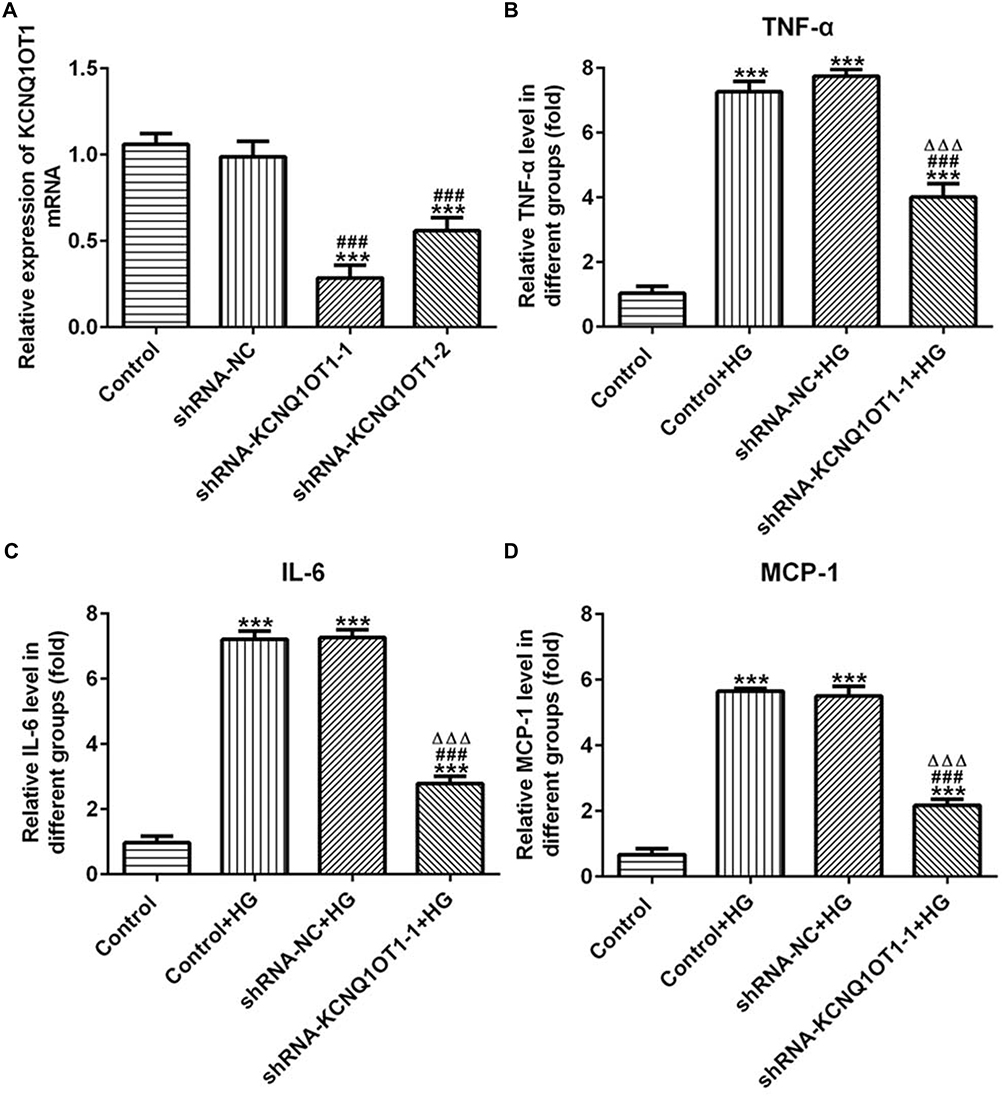 |
Figure 2 KCNQ1OT1 interference reduced the expression of inflammatory factors in HG-induced HK-2 cells. (A) KCNQ1OT1 expression was decreased in HK-2 cells transfected with shRNA-KCNQ1OT1. ***P<0.001 vs. control group. ###P<0.001 vs. shRNA-NC group. (B) TNF-α level was increased in HG-induced HK-2 cells and KCNQ1OT1 expression was decreased in HG-induced HK-2 cells transfected with shRNA-KCNQ1OT1-1. ***P<0.001 vs. control group. ###P<0.001 vs. control+HG group. ∆∆∆P<0.001 vs. shRNA-NC+HG group. (C) IL-6 level was increased in HG-induced HK-2 cells and KCNQ1OT1 expression was decreased in HG-induced HK-2 cells transfected with shRNA-KCNQ1OT1-1. ***P<0.001 vs. control group. ###P<0.001 vs. control+HG group. ∆∆∆P<0.001 vs. shRNA-NC+HG group. (D) MCP-1 level was increased in HG-induced HK-2 cells and KCNQ1OT1 expression was decreased in HG-induced HK-2 cells transfected with shRNA-KCNQ1OT1-1. ***P<0.001 vs. control group. ###P<0.001 vs. control+HG group. ∆∆∆P<0.001 vs. shRNA-NC+HG group. (n=3). |
KCNQ1OT1 Interference Alleviated the Oxidative Stress in HG-Induced HK-2 Cells
The levels of ROS, MDA and SOD reflected the level of oxidative stress. As shown in Figure 3A–C, the levels of ROS and MDA were up-regulated and the level of SOD was reduced in HG-induced HK-2 cells. In addition, KCNQ1OT1 interference could down-regulate the levels of ROS and MDA and up-regulate the level of SOD in HG-induced HK-2 cells. The fluorescence diagram of ROS assay verified the ROS level analyzed by the ELISA kit (Figure 3D). Therefore, KCNQ1OT1 interference alleviated the oxidative stress in HG-induced HK-2 cells.
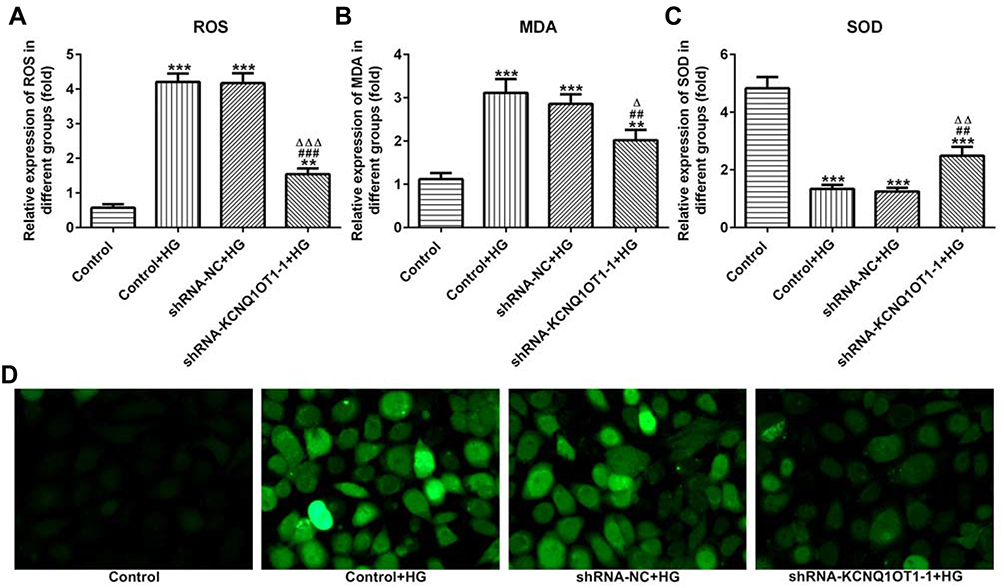 |
Figure 3 KCNQ1OT1 interference alleviated the oxidative stress in HG-induced HK-2 cells. (A) ROS level was increased in HG-induced HK-2 cells and KCNQ1OT1 expression was decreased in HG-induced HK-2 cells transfected with shRNA-KCNQ1OT1-1. **P<0.01 and ***P<0.001 vs. control group. ###P<0.001 vs. control+HG group. ∆∆∆P<0.001 vs. shRNA-NC+HG group. (B) MDA level was increased in HG-induced HK-2 cells and KCNQ1OT1 expression was decreased in HG-induced HK-2 cells transfected with shRNA-KCNQ1OT1-1. **P<0.01 and ***P<0.001 vs. control group. ##P<0.01 vs. control+HG group. ∆P<0.05 vs. shRNA-NC+HG group. (C) SOD level was decreased in HG-induced HK-2 cells and KCNQ1OT1 expression was increased in HG-induced HK-2 cells transfected with shRNA-KCNQ1OT1-1. ***P<0.001 vs. control group. ##P<0.01 vs. control+HG group. ∆∆P<0.01 vs. shRNA-NC+HG group. (D) ROS level was verified by the images of immunofluorescence. (n=3). |
KCNQ1OT1 Interference Down-Regulated the Pyroptosis of HG-Induced HK-2 Cells
The NLRP3, cleaved-caspase1, P-caspase1, IL-1β, p-IL-1β and GSDMD-N were the characteristic proteins of pyroptosis. As Figure 4A and B show, the protein and mRNA expression of NLRP3, cleaved-caspase1, IL-1β and GSDMD-N were increased in HG-induced HK-2 cells while KCNQ1OT1 interference effectively reversed the high expression of NLRP3, cleaved-caspase1, IL-1β and GSDMD-N. The GSDMD-N expression detected by immunofluorescence was consistent with the above results (Figure 4C). Therefore, KCNQ1OT1 interference inhibited the pyroptosis of HG-induced HK-2 cells.
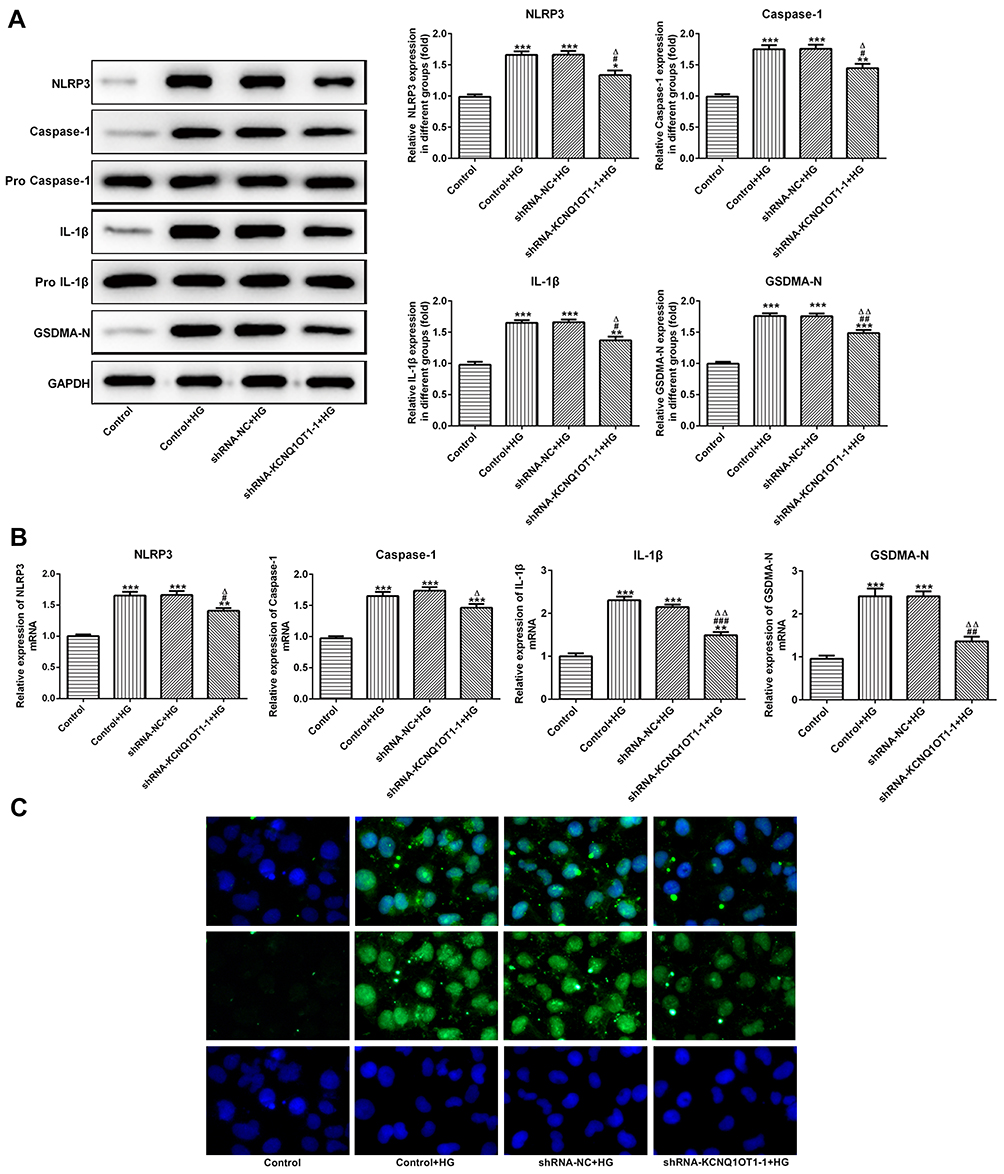 |
Figure 4 KCNQ1OT1 interference decreased the pyroptosis of HG-induced HK-2 cells. (A) The protein expression of NLRP3, cleaved-caspase1, IL-1β and GSDMD-N was decreased in HG-induced HK-2 cells and increased in HG-induced HK-2 cells transfected with shRNA-KCNQ1OT1-1. *P<0.05, **P<0.01 and ***P<0.001 vs. control group. #P<0.05 and ##P<0.01 vs. control+HG group. ∆P<0.05 and ∆∆P<0.01 vs. shRNA-NC+HG group. (B) The mRNA expression of NLRP3, cleaved-caspase-1, IL-1β and GSDMD-N was decreased in HG-induced HK-2 cells and increased in HG-induced HK-2 cells transfected with shRNA-KCNQ1OT1-1. **P<0.01 and ***P<0.001 vs. control group. #P<0.05, ##P<0.01 and ###P<0.001 vs. control+HG group. ∆P<0.05 and ∆∆P<0.01 vs. shRNA-NC+HG group. (C) GSDMD-N expression was verified by the images of immunofluorescence. (n=3). |
KCNQ1OT1 Directly Targeted miR-506-3p
MiR-506-3p, which contains one binding site in KCNQ1OT1 transcript (Figure 5A), was selected for KCNQ1OT1 candidate prediction. The results presented that luciferase activities of miR-506-3p 3´UTR-WT and miR-506-3p 3´UTR-MUT were and were not suppressed by pcDNA KCNQ1OT1, respectively (Figure 5B). MiR-506-3p expression was decreased in HG-induced HK-2 cells and KCNQ1OT1 interference promoted the expression of miR-506-3p (Figure 5C). MiR-506-3p expression was also decreased in the serum of patients with DN compared with healthy people (Figure 5D). In summary, KCNQ1OT1 directly targets miR-506-3p.
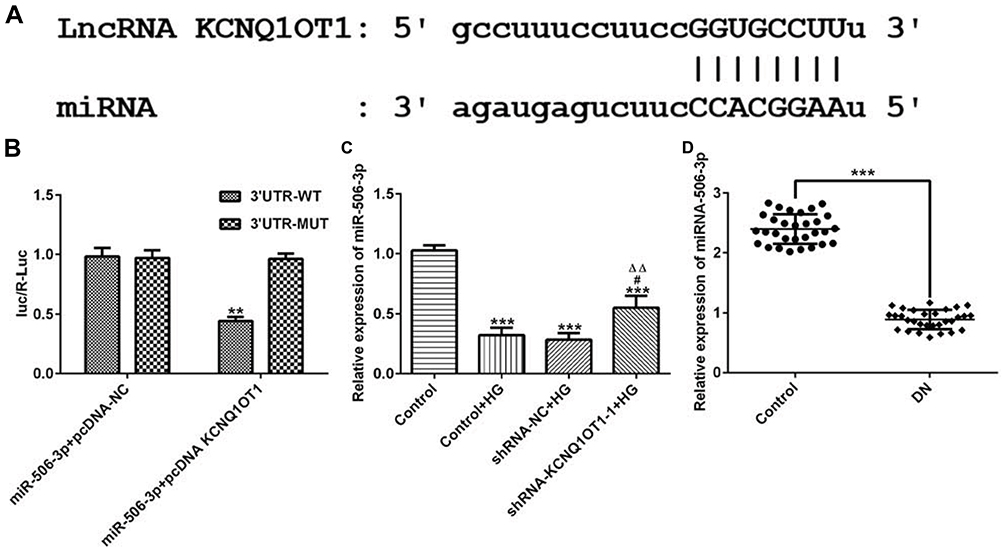 |
Figure 5 KCNQ1OT1 directly targeted miR-506-3p. (A) The putative target sequence for KCNQ1OT1 on the 3ʹ-UTR of miR-506-3p. (B) Luciferase reporter analysis showed the target role of KCNQ1OT1 on the 3ʹ-UTR of miR-506-3p. **P<0.01 vs. miR-506-3p+pcDNA-NC group; UTR, untranslated region; WT, wild-type; MUT, mutated. (C) miR-506-3p expression was decreased in HG-induced HK-2 cells and miR-506-3p expression was increased in HG-induced HK-2 cells transfected with shRNA-KCNQ1OT1-1. ***P<0.001 vs. control group. #P<0.05 vs. control+HG group. ∆∆P<0.01 vs. shRNA-NC+HG group. (D) miR-506-3p expression was down-regulated in the plasma of patients with DN. ***P<0.001 vs. control group. (n=3). |
MiR-506-3p Overexpression Inhibited the Inflammation and Oxidative Stress in HG-Induced HK-2 Cells
As Figure 6A shows, the levels of TNF-α, IL-6 and MCP-1 in HG-induced HK-2 cells were increased. MiR-506-3p overexpression down-regulated the levels of TNF-α, IL-6 and MCP-1 and KCNQ1OT1 interference reversed the function of miR-506-3p overexpression in HG-induced HK-2 cells. The levels of ROS and MDA were up-regulated and the level of SOD was decreased in HG-induced HK-2 cells. MiR-506-3p overexpression could decrease the levels of ROS and MDA and increase the level of SOD in HG-induced HK-2 cells (Figure 6B). KCNQ1OT1 interference alleviated the function of miR-506-3p overexpression. Therefore, miR-506-3p overexpression inhibited the inflammation and oxidative stress in HG-induced HK-2 cells.
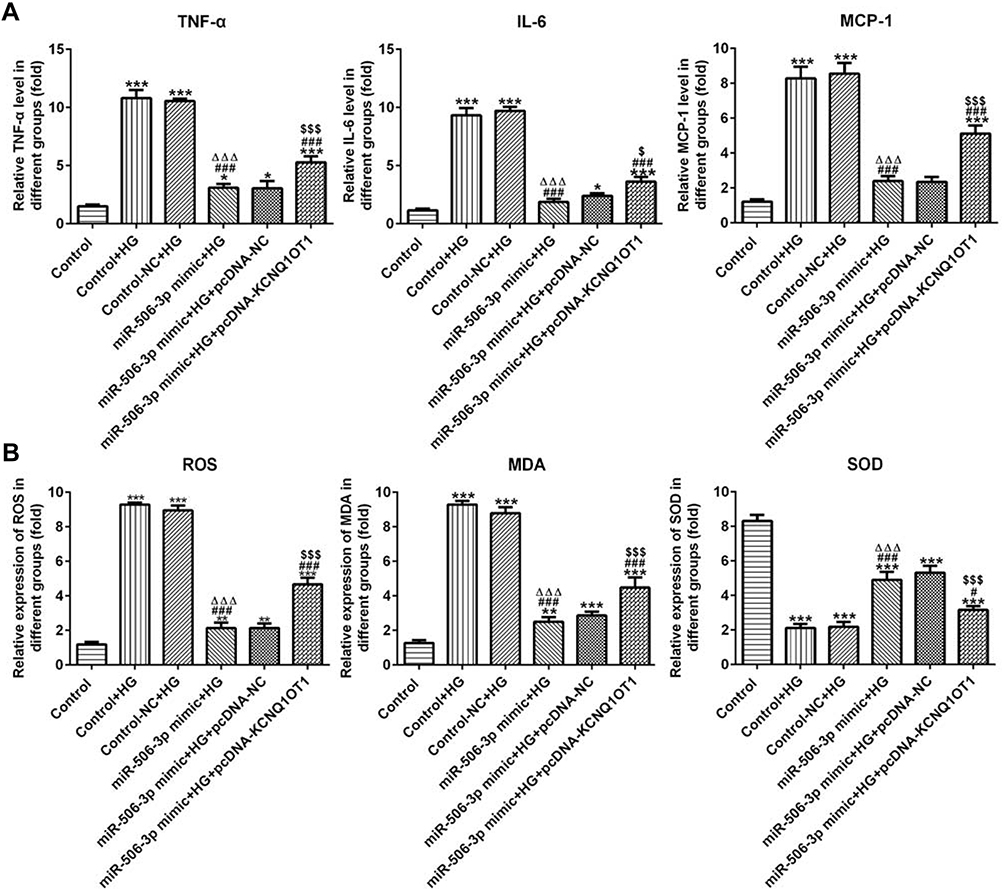 |
Figure 6 MiR-506-3p overexpression inhibited the inflammation and oxidative stress in HG-induced HK-2 cells. (A) The levels of TNF-α, IL-6 and MCP-1 were increased in HG-induced HK-2 cells and miR-506-3p overexpression down-regulated the levels of TNF-α, IL-6 and MCP-1 in HG-induced HK-2 cells while reversed by KCNQ1OT1 overexpression. *P<0.05 and ***P<0.001 vs. control group. ###P<0.001 vs. control+HG group. ∆∆∆P<0.001 vs. control-NC+HG group. $P<0.05 and $$$P<0.001 vs. miR-506-3p mimic+HG+pcDNA-NC group. (B) The levels of ROS and MDA were increased while SOD level was decreased in HG-induced HK-2 cells. MiR-506-3p overexpression down-regulated the levels of ROS and MDA and up-regulated the SOD level in HG-induced HK-2 cells while reversed by KCNQ1OT1 overexpression. **P<0.01 and ***P<0.001 vs. control group. #P<0.05 and ###P<0.001 vs. control+HG group. ∆∆∆P<0.001 vs. control-NC+HG group. $$$P<0.001 vs. miR-506-3p mimic+HG+pcDNA-NC group. (n=3). |
MiR-506-3p Overexpression Reduced the Pyroptosis of HG-Induced HK-2 Cells
As Figure 7A and B showed, the protein expression and mRNA expression of NLRP3, cleaved-caspase1, IL-1β and GSDMD-N were increased in HG-induced HK-2 cells. MiR-506-3p overexpression, in turn, suppressed the expression of NLRP3, cleaved-caspase1, IL-1β and GSDMD-N in HG-induced HK-2 cells, which was reversed by KCNQ1OT1 interference. The GSDMD-N expression determined by the immunofluorescence method was in agreement with the above results (Figure 7C). Therefore, miR-506-3p overexpression inhibited the pyroptosis of HG-induced HK-2 cells.
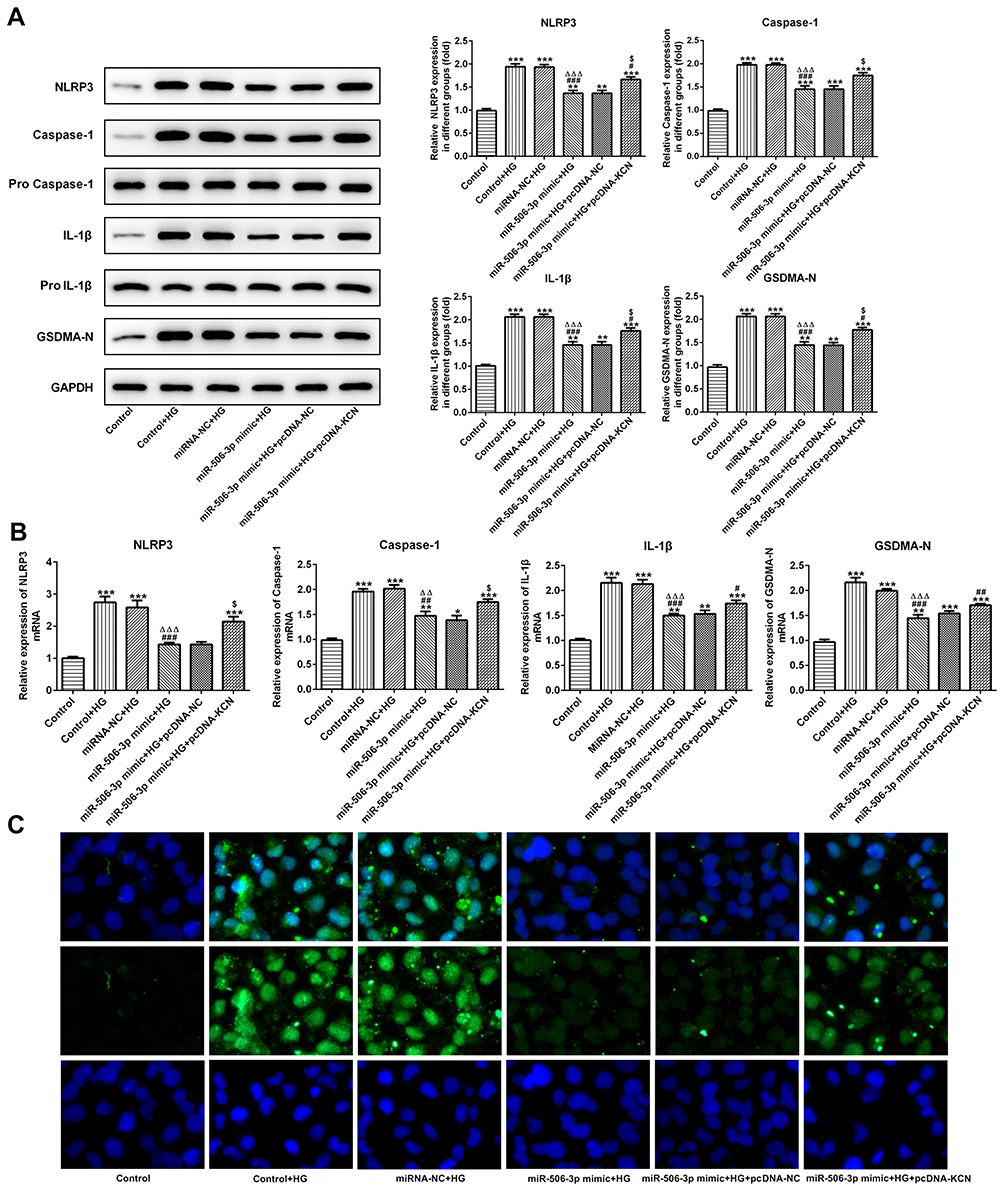 |
Figure 7 MiR-506-3p overexpression inhibited the pyroptosis of HG-induced HK-2 cells. (A) The protein expression of NLRP3, cleaved-caspase1, IL-1β and GSDMD-N was increased in HG-induced HK-2 cells and miR-506-3p overexpression down-regulated the protein expression in HG-induced HK-2 cells while reversed by KCNQ1OT1 overexpression. **P<0.01 and ***P<0.001 vs. control group. #P<0.05 and ###P<0.001 vs. control+HG group. ∆∆∆P<0.001 vs. control-NC+HG group. $P<0.05 vs. miR-506-3p mimic+HG+pcDNA-NC group. (B) The mRNA expression of NLRP3, cleaved-caspase1, IL-1β and GSDMD-N was increased in HG-induced HK-2 cells and miR-506-3p overexpression down-regulated the protein expression in HG-induced HK-2 cells while reversed by KCNQ1OT1 overexpression. *P<0.05, **P<0.01 and ***P<0.001 vs. control group. #P<0.05, ##P<0.01 and ###P<0.001 vs. control+HG group. ∆∆P<0.01 and ∆∆∆P<0.001 vs. control-NC+HG group. $P<0.05 vs. miR-506-3p mimic+HG+pcDNA-NC group. (C) GSDMD-N expression was verified by the images of immunofluorescence. (n=3). |
Discussion
DN often leads to renal failure,19 but effective treatment for it is presently unavailable.20 Therefore, it is essential to find new therapeutic targets for DN.
LncRNAs play a vital role in diabetes.21 LncRNA LOC103690121 was increased in diabetic rats and LOC103690121 overexpression inhibited the neuron apoptosis.22 LncRNA MEG3 was increased in HG-induced AC16 cells and silencing MEG3 decreased the apoptosis of HG-induced AC16 cells.23 LncRNA MIAT overexpression was observed in the serum of diabetic patients and MIAT interference could reduce the apoptosis of vascular endothelial cells to alleviate erectile dysfunction in diabetic rats.24 Asahara et al25 indicated that KCNQ1OT1 was related to pancreatic β-cell mass and mediated the early development of diabetes. KCNQ1OT1 was also related to diabetic cardiomyopathy. KCNQ1OT1 expression was increased in the serum of diabetic patients and HG-treated cardiac fibroblasts and pyroptosis was activated in HG-treated cardiac fibroblasts.15,16 However, the biological function of KCNQ1OT1 in DN remains unknown. In this research, we found that KCNQ1OT1 was increased in the plasma of patients with DN and HG-induced HK-2 cells. KCNQ1OT1 interference obviously reduced the inflammation, oxidative stress and pyroptosis of HG-induced HK-2 cells. The differential expression of KCNQ1OT1 in DN models was firstly demonstrated by us.
The binding sites of KCNQ1OT1 with miR-506-3p predicted by bioinformatics analysis were confirmed by the luciferase assay. Although there is no research about the relations between miR-506-3p and diabetes, miR-506-3p was demonstrated to be involved in the regulation of ROS generation.26 MiR-506 was decreased in the H2O2-induced human cardiomyocyte and miR-506 overexpression could down-regulate the levels of ROS.27 Hence, miR-506 could regulate the progress of oxidative stress. Presently, miR-506-3p was decreased in HG-induced HK-2 cells and miR-506-3p overexpression suppressed inflammatory response, oxidative stress and pyroptosis of HG-induced HK-2 cells. KCNQ1OT1 overexpression could reverse the function of miR-506-3p overexpression in HG-induced HK-2 cells.
Pyroptosis is a specific inflammatory cell death pattern, which is regulated by NLRP3 inflammasome, mediated by caspase-1, and involved in the GSDMD signaling pathway.28–30 Jourdan et al31 prepared a model of type 2 diabetes and found that endocannabinoid activated NLRP3 inflammasome in a cannabinoid receptor-dependent way, thereby activating caspase-1 to exacerbate symptoms such as insulin resistance and abnormal glucose tolerance. Activation of inflammasome is the key to the occurrence of pyroptosis, and NLRP3 inflammasome is the core of inflammatory response, so NLRP3 inflammasome is closely related to the occurrence of pyroptosis. Li et al32 found that lncRNA MALAT1 promoted the generation of caspase-1, IL-1β and IL-1 to ultimately lead to renal inflammatory response and pyroptosis of renal tubular epithelial cells in DN. Furthermore, caspase-1 will eventually transmit the pyroptosis signal to GSDMD protein for execution. GSDMD cut by caspase-1 generates the active group GSDMD-N and the self-inhibited GSDMD-C. GSDMD-N specifically binds to lipids in the cell membrane to form many protein pores, which can cause cell swelling. And, when the swollen cells are infected by microorganisms and infection-related danger signals, it will induce the occurrence of cell pyroptosis.33 In this study, KCNQ1OT1 interference and miR-506-3p overexpression reduced the pyroptosis by decreasing the expression of NLRP3, cleaved-caspase1, IL-1β and GSDMD-N.
In conclusion, present research revealed that KCNQ1OT1 was up-regulated in the plasma of patients with DN and HG-induced HK-2 cells. KCNQ1OT1 interference reduced the inflammation, oxidative stress and pyroptosis of HG-induced HK-2 cells by up-regulating the miR-506-3p expression. Therefore, KCNQ1OT1 may be a promising therapeutic target for DN in the future. However, this study is limited because of the limited numbers of patients/controls. The findings presented will need to be supported by our further studies on larger, independent patient cohorts. Furthermore, this experiment is a preliminary cell experiment. The DN mice or rats model will be constructed and the KCNQ1OT1 expression in DN patient renal tissues will be detected in our further study to further explore more profound problems.
Data Sharing Statement
The datasets in the current study are available on request.
Disclosure
The authors declare they have no competing interests.
References
1. Zhang L, Long J, Jiang W, et al. Trends in chronic kidney disease in China. N Engl J Med. 2016;375(9):905–906. doi:10.1056/NEJMc1602469
2. Jian W, Jibo L, Yaqin D, et al. MiR-455-3p suppresses renal fibrosis through repression of ROCK2 expression in diabetic nephropathy. Biochem Biophys Res Commun. 2018;503(2):977–983. S0006291X18314177.
3. IDF. IDF global overview of diabetes. Chin Cent Pract. 2014;17(26):3124.
4. Chen L, Magliano DJ, Zimmet PZ. The worldwide epidemiology of type 2 diabetes mellitus—present and future perspectives. Nat Rev Endocrinol. 2011;8(4):228. doi:10.1038/nrendo.2011.183
5. Aboudehen K, Farahani S, Kanchwala M, et al. Long noncoding RNA Hoxb3os is dysregulated in autosomal dominant polycystic kidney disease and regulates mTOR signaling. J Biol Chem. 2018;293(24):
6. Skroblin P, Mayr M. “Going Long”: long non-coding RNAs as biomarkers. Circ Res. 2014;115(7):607–609. doi:10.1161/CIRCRESAHA.114.304839
7. Sheng S-R, Wu J-S, Tang Y-L, Liang X-H. Long noncoding RNAs: emerging regulators of tumor angiogenesis. Future Oncol. 2017;13(17):1551–1562. fon-2017-0149.
8. Liu B, Sun L, Liu Q, et al. A cytoplasmic NF-κB interacting long noncoding RNA blocks IκB phosphorylation and suppresses breast cancer metastasis. Cancer Cell. 2015;27(3):370–381. doi:10.1016/j.ccell.2015.02.004
9. Viereck J, Thum T. Circulating noncoding RNAs as Biomarkers of cardiovascular disease and injury. Circ Res. 2017;120(2):381–399. doi:10.1161/CIRCRESAHA.116.308434
10. Thum T, Condorelli G. Long noncoding RNAs and MicroRNAs in cardiovascular pathophysiology. Circ Res. 2015;116(4):751–762. doi:10.1161/CIRCRESAHA.116.303549
11. Arvaniti E, Moulos P, Vakrakou A, et al. Whole-transcriptome analysis of UUO mouse model of renal fibrosis reveals new molecular players in kidney diseases. Sci Rep. 2016;6:26235. doi:10.1038/srep26235
12. Zhou P, Chen Z, Zou Y, Wan X. Roles of non-coding RNAs in acute kidney injury. Kidney Blood Press Res. 2016;41(6):757. doi:10.1159/000450566
13. Wang YZ, Zhu DY, Xie XM, et al. EA15, MIR22, LINC00472 as diagnostic markers for diabetic kidney disease. J Cell Physiol. 2019;234(6):8797–8803. doi:10.1002/jcp.27539
14. Jiao HY, Xie DL, Qiao YH. LncRNA PRINS is involved in the development of nephropathy in patients with diabetes via interaction with Smad7. Exp Ther Med. 2019;17(4):3203–3208. doi:10.3892/etm.2019.7307
15. Yang F, Qin Y, Wang Y, et al. LncRNA KCNQ1OT1 mediates pyroptosis in diabetic cardiomyopathy. Cell Physiol Biochem. 2018;50(4):1230–1244. doi:10.1159/000494576
16. Travers ME, Mackay DJ, Dekker Nitert M, et al. Insights into the molecular mechanism for type 2 diabetes susceptibility at the KCNQ1 locus from temporal changes in imprinting status in human islets. Diabetes. 2013;62(3):987–992
17. Yu Q, Lu Z, Tao L, et al. ROS-dependent neuroprotective effects of nahs in ischemia brain injury involves the PARP/AIF pathway. Cell Physiol Biochem. 2015;36(4):1539–1551. doi:10.1159/000430317
18. Dong Z, Yang P, Qiu X, et al. KCNQ1OT1 facilitates progression of non-small-cell lung carcinoma via modulating miRNA-27b-3p/HSP90AA1 axis. J Cell Physiol. 2019;234(7):11304–11314. doi:10.1002/jcp.v234.7
19. Rask-Madsen C, GL K. Vascular complications of diabetes: mechanisms of injury and protective factors. Cell Metab. 2013;17(1):20–33. doi:10.1016/j.cmet.2012.11.012
20. Fineberg D, Jandeleit-Dahm KAM, Cooper ME. Diabetic nephropathy: diagnosis and treatment. Nat Rev Endocrinol. 2013;9(12):713–723. doi:10.1038/nrendo.2013.184
21. Guo J, Liu ZS, Gong RJ. Long noncoding RNA: an emerging player in diabetes and diabetic kidney disease. Clin Sci. 2019;133(12):1321–1339. doi:10.1042/CS20190372
22. Hao LJ, Li Q, Zhao X, Li YL, Zhang C. A long noncoding RNA LOC103690121 promotes hippocampus neuronal apoptosis in streptozotocin-induced type 1 diabetes. Neurosci Lett. 2019;703:11–18. doi:10.1016/j.neulet.2019.03.006
23. Chen YW, Zhang ZF, Zhu DQ, Zhao WC, Li F. Long non-coding RNA MEG3 serves as a ceRNA for microRNA-145 to induce apoptosis of AC16 cardiomyocytes under high glucose condition. Biosci Rep. 2019;39:8. doi:10.1042/BSR20190444
24. Huo W, Hou Y, Li Y, Li H. Downregulated lncRNA-MIAT confers protection against erectile dysfunction by downregulating lipoprotein lipase via activation of miR328a-5p in diabetic rats. Biochim Biophys Acta Mol Basis Dis. 2019;1865(6):1226–1240. doi:10.1016/j.bbadis.2019.01.018
25. Asahara SI, Etoh H, Inoue H, Teruyama K, Kido Y. Paternal allelic mutation at the Kcnq1 locus reduces pancreatic β-cell mass by epigenetic modification of Cdkn1c. Proc Natl Acad Sci U S A. 2015;112(27):8332–8337. doi:10.1073/pnas.1422104112
26. Yin M, Ren X, Zhang X, et al. Selective killing of lung cancer cells by miRNA-506 molecule through inhibiting NF-κB p65 to evoke reactive oxygen species generation and p53 activation. Oncogene. 2015;34(6):691–703. doi:10.1038/onc.2013.597
27. Zhang XZ, Liu FY, Wang QQ, Geng YX. Overexpressed microRNA-506 and microRNA-124 alleviate H2O2-induced human cardiomyocyte dysfunction by targeting kruppel-like factor 4/5. Mol Med Rep. 2017;16(4):5363–5369. doi:10.3892/mmr.2017.7243
28. Miao EA, Leaf IA, Treuting PM, et al. Caspase-1-induced pyroptosis is an innate immune effector mechanism against intracellular bacteria. Nat Immunol. 2010;11(12):1136–1142. doi:10.1038/ni.1960
29. Jorgensen I, Zhang Y, Krantz BA, Miao EA. Pyroptosis triggers pore-induced intracellular traps (PITs) that capture bacteria and lead to their clearance by efferocytosis. J Exp Med. 2016;213(10):2113–2128. doi:10.1084/jem.20151613
30. Kayagaki N, Stowe IB, Lee BL, et al. Caspase-11 cleaves gasdermin D for non-canonical inflammasome signaling. Nature. 2015;526(7575):666–671.
31. Jourdan T, Godlewski G, Cinar R, et al. Activation of the Nlrp3 inflammasome in infiltrating macrophages by endocannabinoids mediates beta cell loss in type 2 diabetes. Nat Med. 2013;19(9):1132–1140.
32. Li X, Zeng L, Cao C, et al. Long noncoding RNA MALAT1 regulates renal tubular epithelial pyroptosis by modulated miR-23c targeting of ELAVL1 in diabetic nephropathy. Exp Cell Res. 2017;350(2):327–335. doi:10.1016/j.yexcr.2016.12.006
33. Ding J, Wang K, Liu W, et al. Erratum: pore-forming activity and structural autoinhibition of the gasdermin family. Nature. 2016;540(7631):150
 © 2020 The Author(s). This work is published and licensed by Dove Medical Press Limited. The full terms of this license are available at https://www.dovepress.com/terms.php and incorporate the Creative Commons Attribution - Non Commercial (unported, v3.0) License.
By accessing the work you hereby accept the Terms. Non-commercial uses of the work are permitted without any further permission from Dove Medical Press Limited, provided the work is properly attributed. For permission for commercial use of this work, please see paragraphs 4.2 and 5 of our Terms.
© 2020 The Author(s). This work is published and licensed by Dove Medical Press Limited. The full terms of this license are available at https://www.dovepress.com/terms.php and incorporate the Creative Commons Attribution - Non Commercial (unported, v3.0) License.
By accessing the work you hereby accept the Terms. Non-commercial uses of the work are permitted without any further permission from Dove Medical Press Limited, provided the work is properly attributed. For permission for commercial use of this work, please see paragraphs 4.2 and 5 of our Terms.