")
Back to Journals » OncoTargets and Therapy » Volume 9
Silencing of Foxp3 delays the growth of murine melanomas and modifies the tumor immunosuppressive environment
Authors Moises Armides Franco-Molina MA, Miranda-Hernández D, Mendoza-Gamboa E, Zapata-Benavides P, Coronado-Cerda E, Sierra-Rivera C, Saavedra-Alonso S , Tamez-Guerra R, Rodríguez-Padilla C
Received 14 June 2015
Accepted for publication 14 October 2015
Published 12 January 2016 Volume 2016:9 Pages 243—253
DOI https://doi.org/10.2147/OTT.S90476
Checked for plagiarism Yes
Review by Single anonymous peer review
Peer reviewer comments 3
Editor who approved publication: Dr Faris Farassati
Moisés A Franco-Molina,* Diana F Miranda-Hernández,* Edgar Mendoza-Gamboa, Pablo Zapata-Benavides, Erika E Coronado-Cerda, Crystel A Sierra-Rivera, Santiago Saavedra-Alonso, Reyes S Taméz-Guerra, Cristina Rodríguez-Padilla
Immunology and Virology Department, Biological Sciences Faculty, University Autonoma of Nuevo León (UANL), San Nicolás de los Garza, Nuevo León, Mexico
*These authors contributed equally to this work
Abstract: Forkhead box p3 (Foxp3) expression was believed to be specific for T-regulatory cells but has recently been described in non-hematopoietic cells from different tissue origins and in tumor cells from both epithelial and non-epithelial tissues. The aim of this study was to elucidate the role of Foxp3 in murine melanoma. The B16F10 cell line Foxp3 silenced with small interference Foxp3 plasmid transfection was established and named B16F10.1. These cells had lower levels of Foxp3 mRNA (quantitative real-time reverse transcription-polymerase chain reaction [0.235-fold]), protein (flow cytometry [0.02%]), CD25+ expression (0.06%), cellular proliferation (trypan blue staining), and interleukin (IL)-2 production (enzyme-linked immunosorbent assay [72.35 pg/mL]) than those in B16F10 wild-type (WT) cells (P<0.05). Subcutaneous inoculation of the B16F10.1 cell line into C57BL/6 mice delayed the time of visible tumor appearance, increased the time of survival, and affected the weight of tumors, and also decreased the production of IL-10, IL-2, and transforming growth factor beta compared with mice inoculated with the B16F10 WT cell line. The B16F10.1 cells derived from tumors and free of T-cells (isolated by Dynabeads and plastic attachment) expressed relatively lower levels of Foxp3 and CD25+ than B16F10 WT cells (P<0.05) in a time-dependent manner. The population of tumor-infiltrating lymphocytes of T CD4+ cells (CD4+, CD4+CD25+, and CD4+CD25+Foxp3+) increased in a time-dependent manner (P<0.05) in tumors derived from B16F10 WT cells and decreased in tumors derived from B16F10.1 cells. Similar data were obtained from spleen cells. These results suggest that, in melanomas, Foxp3 partly induces tumor growth by modifying the immune system at the local and peripheral level, shifting the environment toward an immunosuppressive profile. Therapies incorporating this transcription factor could be strategies for cancer treatment.
Keywords: melanoma, Foxp3, cancer, T-regulatory cells
Introduction
Forkhead box p3 (Foxp3) has been reported in several tumor cell lines and tumors of patients.1,2 Foxp3 expression in cancer cells induced immune evasion and reduced the growth of CD4+CD25+ T-cells.3 Foxp3 is expressed in T-regulatory cells (Tregs), metastatic melanoma tissue, and tumor cell lines from melanomas.4 Furthermore, at a clinical level, Foxp3 expression in tumors is associated with worse overall survival. T-cell function may be addressed by Foxp3 and tumor-associated Foxp3, but it is not known if intratumoral Foxp3 expression affects the immune system at the level of the tumor microenvironment.4 In some studies, Foxp3 expression induced a suppressive phenotype in human T-cells, but there are some populations of T-cells that, despite Foxp3 expression, are not considered as Tregs.5,6 Patients with metastatic melanoma have increased migration and/or proliferation of CD4+ Tregs in intratumoral regions compared to peritumoral regions, and these values are higher in peripheral blood of cancer patients compared with healthy donors.7 The presence of tumor-infiltrating lymphocytes (TIL), including the Treg phenotype, and the induction of a immunosuppressive tumor microenvironment are not clear, but it has been suggested that an increase in the conversion of Foxp3− T-cells into Foxp3+ T-cells may occur in the presence of transforming growth factor beta-1 (TGF-β1) and retinoic acid.8
This study analyzed the effect of silencing Foxp3 expression on tumorigenicity and the tumor microenvironment in murine melanomas in vitro and in vivo. Our results demonstrated that silencing Foxp3 in B16F10 melanoma cells in vitro decreased cell viability and the expression of Foxp3 mRNA, CD25+, and interleukin (IL)-2. Silencing in vivo delayed the time of visible tumor appearance, increased the time of survival, affected the weight of tumors, and partly avoided the immunosuppressive cellular phenotype within the tumor. These results suggest Foxp3 could serve as a target therapeutic in melanoma treatment.
Materials and methods
B16F10 murine melanoma cell line
The murine B16F10 melanoma cell line was obtained from the American Type Culture Collection (ATCC), Manassas, VA, USA, and cultivated in Dulbecco’s Modified Eagle Medium (DMEM/F12; Thermo Fisher Scientific, St Louis, MO, USA) supplemented with 10% fetal bovine serum (FBS; Thermo Fisher Scientific, Waltham, MA, USA), 100 U/mL penicillin, and 100 μg/mL streptomycin. The cells were maintained in culture flasks at 37°C in a humidified atmosphere with 5% CO2. The protocol for the animal study was approved by the Animal Committee of the Faculty of Biological Science of University Autonomous of Nuevo Leon.
Animals
C57BL/6 mice (6 weeks old) were acquired from Harlan México, SA de CV. The mice were housed according to experimental protocols that were approved by the Ethics Review Committee for Animal Experimentation of the Faculty of Biological Sciences of the University Autonomous of Nuevo León.
Preparation of polyethylenimine–DNA complexes
Polyethylenimine (PEI, 25 kDa branched form; Sigma-Aldrich Co., St Louis, MO, USA) stock solution was prepared at a concentration of 4.3 mg/mL (0.1 M in nitrogen) in water. The DNA was at 3 nmol of phosphate per microgram, and 1 μL of the 0.1 M PEI solution contained 100 nmol of amine nitrogen. The resulting charge ratio was expressed as the ratio of PEI nitrogen to DNA phosphorus (N:P). A 10:1 N:P was used for the experiments, which corresponds to a 1.29:1 PEI:DNA weight ratio.
Foxp3 small interference RNA expression constructs
Three oligo pairs (sense and antisense) for Foxp3-small interference RNA (siRNA) were designed using siRNA design guidelines online software (Ambion, Austin, TX, USA), synthesized at a concentration of 0.05 μg (Ambion), and used to create three recombinant plasmids (termed Foxp3-siRNA1, Foxp3-siRNA2, and Foxp3-siRNA3). For plasmid Foxp3-1, the oligos were 5′-CAUGGACUACUUCAAGUACtt-3′ and 3′-GUACUUGAAGUAGUCCAUGtt-5′; for plasmid Foxp3-2, 5′-AUCUACCAUUGGUUUACUCtt-3′ and 3′-GAGUAAACCAAUGGUAGAUtt-5′; and for plasmid Foxp3-3, 5′-UUUGAGUUUCGCAAGAAGAtt-3′ and 3′-UCUUCUUGCGAAACUCAAAtt-5′. The oligos were resuspended to a final concentration of 1 μg/μL−1, annealed, and ligated into plasmid of expression green fluorescence protein-N2 (pEGFP-N2; Clontech, Palo Alto, CA, USA). The constructs were tested by enzymatic digestion with HindIII and were produced on a large scale and purified with the EndoFree Plasmid Giga Kit (Qiagen NV, Venlo, the Netherlands), according to the manufacturer’s instructions.
Effect of small interference Foxp3 on B16F10-transfected melanoma cells
Briefly, 24 hours before transfection, 5×10⁵ B16F10 wild-type (WT) cells were seeded in 96-well culture plates. Thereafter, B16F10 WT cells were transfected with small interference Foxp3 (siFoxp3) plasmids (siFoxp3-1, siFoxp3-2, and siFoxp3-3) and pEGFP-N2 (as a negative control). The complex PEI:DNA was performed as described previously. At 72 hours, 3-(4,5-dimethylthiazolyl-2)-2, 5-diphenyltetrazolium bromide (MTT) assay was performed for cell viability analysis. The MTT solution was prepared by mixing 0.025 g of MTT (Sigma-Aldrich Co.) with 5 mL of phosphate-buffered saline (PBS) for a final MTT concentration of 5 mg/mL. Then, 20 μL of this solution was added to each well. The cells were incubated with the MTT solution at 37°C for 2–4 hours until a purple precipitate was visible, followed by removal of the medium and addition of 80 μL dimethylsulfoxide to each well. The samples were rocked for 10 minutes. The optical density was determined at 570 nm using a microplate autoreader (Microplate Autoreader EL311; BioTek Instruments Inc., Winooski, VA, USA). Data are presented as the percentage of relative cell viability ± standard error.
Generation of silenced Foxp3 B16F10 clones
siFoxp3-1 plasmids were selected for pre-transfection of the B16F10 WT cells. The B16F10 WT cells were adjusted to 5×10⁵ cells/well in six-well plates and transfected as previously described. At 48 hours, the cells were visualized in confocal microscopy to corroborate the presence of green fluorescent protein in positive B16F10-transfected cells. Then, 1 mg/mL G418 (Geneticin; Thermo Fisher Scientific), a neomycin analog, was added and was gradually decreased as follows: 1 mg/mL for 4 days; 750 μg/mL for 4 days; 500 μg/mL for 4 days; and 250 μg/mL as a sustaining dose. At day 20 after transfection, G418-resistant clones were isolated. The selected cell colonies were transferred from 10 mm dishes to 96-well plates and then to 24-well plates. The selection was continued by replacing the media with G418 every 3 days. The G418-resistant clones were isolated once they were selected. Foxp3 mRNA and protein expression were analyzed. The selected clone was widely reproduced for further use (named B16F10.1). The B16F10 WT cells were cultured under identical conditions.
Foxp3 mRNA expression
Foxp3 mRNA expression in B16F10 WT and B16F10.1 cells (selected clones) was evaluated by quantitative real-time reverse transcription-polymerase chain reaction (qRT-PCR). After total RNA isolation and reverse transcription into cDNA, qRT-PCR was performed using the automated thermocycler PTC-200 (MJ Research, Watertown, MA, USA), the SYBR Supermix kit (Thermo Fisher Scientific), the RT2 PCR Primer Set for Foxp3 (SuperArray Biosciences, Bethesda, MD, USA), and β-actin as a reference gene (RT2 PCR Primer Set; SuperArray Biosciences). The qRT-PCR thermocycling conditions for Foxp3 were 10 minutes at 95°C for an initial hold, followed by 40 cycles of denaturation at 95°C, annealing at 60°C, and extension at 72°C, all for 15 seconds. The qRT-PCR thermocycling conditions for β-actin were 10 minutes at 95°C for an initial hold, followed by 40 cycles of denaturation at 95°C for 15 seconds and annealing/extension at 60°C for 60 seconds. Relative expression was analyzed using Rotor Gene software. For RT-PCR amplification, 20 μM of forward 5′-GGCATCGTGATGGACTCCG-3′ and reverse 3′-GCTGGAAGGTGGACAGCGA-5′ primers was used for β-actin. The RT2 PCR Primer Set was used for Foxp3 (SuperArray Biosciences) in a total reaction volume of 25 μL.
Flow cytometry analysis
To analyze the cellular expression levels of CD25+ and Foxp3, 1×10⁶ B16F10 WT and B16F10.1 cells were stained using an anti-mouse CD25 antibody (eBioscience, San Diego, CA, USA) in a final volume of 100 μL of flow cytometry staining buffer and incubated at 4°C for 30 minutes. An Fc block was added to the incubation buffer with anti-mouse CD25, and then the cells were washed in cold flow cytometry staining buffer. The cells were pelleted by centrifugation, the supernatant was discarded, and the cells were resuspended with a vortex pulse. Freshly prepared fixation/permeabilization working solution (1 mL) was added to the cells which were then incubated at 4°C for 30 minutes, washed twice with 2 mL 1× permeabilization buffer, and centrifuged to collect the cells. The supernatant was discarded, and an Fc block in 1× permeabilization buffer was added to the cells in a final volume of 100 μL before incubation at 4°C for 15 minutes. An anti-mouse/rat Foxp3 (clone FJK-16s) antibody (eBioscience) in 1× permeabilization buffer was added without washing after the blocking step and incubated at 4°C for 30 minutes in the dark. Subsequently, the cells were washed once with 2 mL 1× permeabilization buffer. The stained cells were collected by centrifugation after discarding the supernatant and resuspended in 1% paraformaldehyde. The data were analyzed using a flow cytometer (EPICS ALTRA; Beckman Coulter, Fullerton, CA, USA).
Proliferative response of B16F10 WT and B16F10.1 cells
For analysis of cellular proliferation, the B16F10 WT and B16F10.1 melanoma cells (2.5×10⁵ cells) were plated in six-well plates at 37°C in a 5% CO2 atmosphere. The proliferation index was determined by a trypan blue exclusion assay at 24 hours, 48 hours, and 72 hours.
Animal study
Groups of 6-week-old C57BL/6 mice (ten mice per group) were subcutaneously inoculated in the right flank with B16F10 WT or B16F10.1 cells (5×10⁵ cells/200 μL PBS) and were monitored until tumor appearance was visible. Mouse survival was then determined. In a parallel study, mice inoculated with B16F10 WT or B16F10.1 cells were established. At euthanasia, the tumors and spleen were aseptically removed, and the weight and Foxp3 expression (qRT-PCR) were analyzed. Cytokine production (IL-2, interferon gamma [INF-γ], TGF-β, and IL-10) was assessed by enzyme-linked immunosorbent assay (ELISA) and flow cytometry (T-cells CD4+, CD4+CD25+, CD4+CD25+FOXP3+ Tregs, and CD25+ expression). The procedures for each experiment are described in the following sections.
TILs and B16F10 WT or B16F10.1 cell isolation from tumors
The melanoma cells were removed from the tumors of mice inoculated with B16F10 WT (7 days, 14 days, and 21 days post tumor appearance) or B16F10.1 cells (7 days, 14 days, 21 days, and 28 days post tumor appearance). B16F10 WT and B16F10.1 cells were obtained from the tumor by washing the tumor tissues with DMEM/F12 using a sterile syringe. After washing several times, 15 mL of ammonia–chloride–potassium (ammonia–chloride–potassium lysis buffer: 0.15 M NH4Cl; 0.1 mM KHCO3; 0.1 mM disodium ethylenediaminetetraacetic acid, pH 7.2) was added to the collected cells to remove red blood cells, and the cells were centrifuged at 1,600 rpm/10 minutes. To isolate the T-cells and the B16F10 WT or B16F10.1 cells from the tumor, the cells were resuspended in isolation buffer from the Dynabeads FlowComp Mouse Pan T (CD90.2) kit (Thermo Fisher Scientific) at a concentration of 1×10⁸ cells/mL. The FlowComp TM mouse CD90.2 antibody from the kit was added to the cell suspension at a ratio of 25 μL antibodies per 500 μL cell suspension (5×10⁷ cells), mixed, and incubated for 10 minutes at 2°C–8°C. After incubation, the cells were washed by adding 2 mL of isolation buffer, centrifuged at 1,600 rpm for 8 minutes, and resuspended in 1 mL of isolation buffer. Resuspended FlowComp TM Dynabeads (75 μL) were added to the tube, mixed, and incubated for 15 minutes at room temperature with rolling and tilting. The tubes were then placed on a magnet for a minimum of 1 minute. The supernatants containing the melanoma cells were carefully collected while the tube was still on the magnet. The washing step was repeated once, and the supernatants were collected. Finally, the supernatants were cultured in a 25 cm2 cell culture flask and incubated at 37°C in a 5% CO2 atmosphere for 3 hours. After adherence of the intratumoral B16F10 WT and B16F10.1 cells to the flask, they were washed with PBS to remove cell debris and other cell types. The concentration of intratumoral B16F10 WT and B16F10.1 melanoma cells was adjusted to 1×10⁶ cells in a final volume of 100 μL of flow cytometry staining buffer (eBioscience). These cells were analyzed for Foxp3+ and CD25+ expression as described earlier. The TIL cells remained on the magnet and were collected after the tube was removed and analyzed by flow cytometry.
Measurement of cytokine production
B16F10 WT or B16F10.1 melanoma cells (5×10⁵ cells/mL DMEM/F12 supplemented with 10% FBS) were cultured for 48 hours at 37°C in a 5% CO2 atmosphere. The supernatants were collected and stored at −20°C for subsequent analysis of cytokine production (IFN-γ, IL-2, TGF-β, and IL-10; Thermo Fisher Scientific) by ELISA. The tumors were aseptically collected and macerated by adding 1× PBS at a proportion of 400 g of tumor:1 mL of PBS. The supernatants were collected and stored at −20°C until use. Protein quantification was analyzed using the Lowry assay and adjusted to 1 mg protein concentration. Then, ELISA experiments were performed for cytokine production (IFN-γ, IL-2, TGF-β, and IL-10; Thermo Fisher Scientific), according to the manufacturer’s specifications. The absorbance was determined at 450 nm using a microplate autoreader (EL311; Bio-Tek Instruments).
Regulatory T-cells in TIL and spleen cells in murine melanomas
TIL and spleen cells were obtained during murine melanoma growth. For analysis of Tregs, a Human Regulatory T Cell Staining Kit (eBioscience), including fluorescein isothiocyanate CD4, phycoerythrin (PE) CD25, and PE-cyanin 5 Foxp3, was used. Tregs were analyzed according to the manufacturer’s instructions. Isotype-negative controls included a mouse isotype matched to a nonrelevant immunoglobulin to define the positive population. After gating the TIL population and spleen T-cells, the CD4+CD25+ and CD4+CD25+Foxp3+ populations were sequentially gated and analyzed. The percentage of Foxp3+ cells (CD4+CD25+Foxp3+) was evaluated in the CD4+CD25+ population. The data were analyzed using a flow cytometer.
Analysis of CD25+ expression in TIL and spleen cells in murine melanoma
To analyze the cellular expression levels of CD25+ during murine melanoma growth, 1×10⁶ TIL and spleen T-cells were stained using an anti-mouse CD25+ antibody (PE; eBioscience) in a final volume of 100 μL of flow cytometry staining buffer and were incubated at 4°C for 30 minutes. The stained cells were collected by centrifugation after discarding the supernatant and were resuspended in 1% paraformaldehyde. The data were analyzed using a flow cytometer.
Statistical analysis
The results of the cytokine ELISA were analyzed using Student’s t-test. Differences between the cells were analyzed by the Dunnett’s test. All differences reported in the results were significant (P<0.05). Each analysis was repeated in triplicate.
Results
Characterization of plasmids
The siRNA Foxp3-specific constructions (siFoxp3-1, siFoxp3-2, and siFoxp3-3) were elaborated. To confirm the correct ligation, the plasmids were treated with HindIII that resulted in a fragment size consistent with the size of the plasmid (the control vector pEGFP-N2 was 4.7 kbp). The siRNA sequences corresponding to each plasmid of 5,381 bp (siFoxp3-1, siFoxp3-2, and siFoxp3-3) were determined by 1% agarose gel electrophoresis analysis (Figure 1).
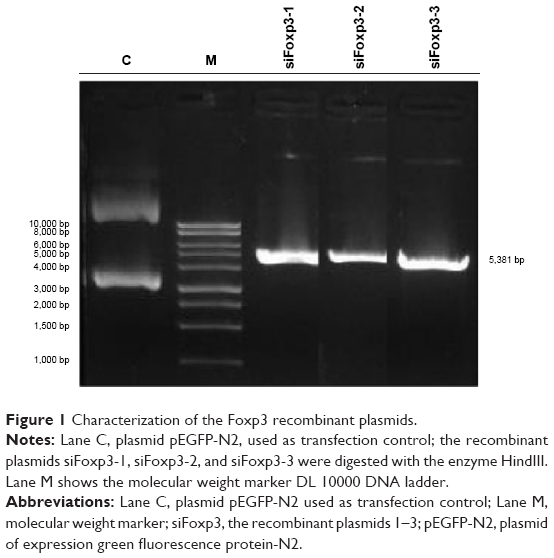 | Figure 1 Characterization of the Foxp3 recombinant plasmids. |
Effect of siRNA Foxp3 on cell viability of B16F10 WT
To test whether Foxp3 is required for B16F10 WT cell proliferation or survival, we silenced Foxp3 expression in the murine melanoma cell line using the siRNA against Foxp3 (siFoxp3-1, siFoxp3-2, and siFoxp3-3). The plasmid transfections with siFoxp3-3 (94.99%) significantly decreased the relative cell viability compared with siFoxp3-1 (21.32%) and siFoxp3-2 (9.84%) in the B16F10 WT cell line. The untransfected B16F10 WT cell line and the pEGFP-N2 plasmid were used as controls (Figure 2). Foxp3 expression was determined by qRT-PCR in each B16F10 WT group treated with or without siFoxp3-1, siFoxp3-2, and siFoxp3-3. All siFoxp3 plasmid transfections significantly (P<0.005) decreased Foxp3 (siFoxp3-1 [0.236-fold], siFoxp3-2 [0.546-fold], and siFoxp3-3 [0.065-fold]) expression compared with B16F10 WT cells (onefold; Figure 3). We chose the siFoxp3-1 plasmid for establishing a stable transfection in the B16F10 cells, because the effect on cell growth allowed the establishment of a cell line with lower Foxp3 expression.
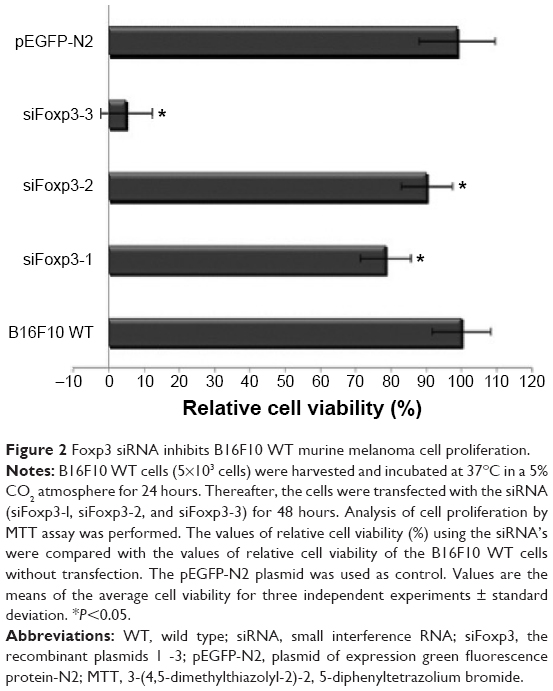 | Figure 2 Foxp3 siRNA inhibits B16F10 WT murine melanoma cell proliferation. |
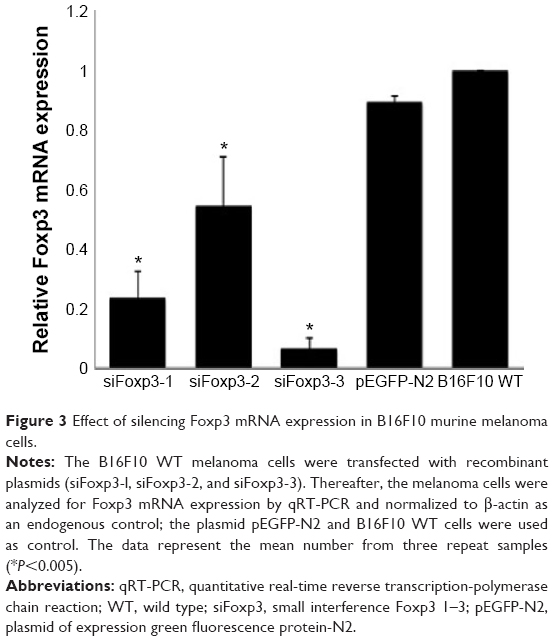 | Figure 3 Effect of silencing Foxp3 mRNA expression in B16F10 murine melanoma cells. |
Transfection of siFoxp3-1 B16F10 cell line (B16F10.1)
The B16F10 cell line containing the silenced Foxp3 was named B16F10.1 and was maintained with G418 antibiotic selection during the study. The levels of Foxp3 mRNA and protein expression were evaluated by qRT-PCR (0.235-fold) and flow cytometry (0.02%). The results were significantly lower (P<0.05) than B16F10 WT cells (onefold and 1.4%, respectively; Figure 4A and B).
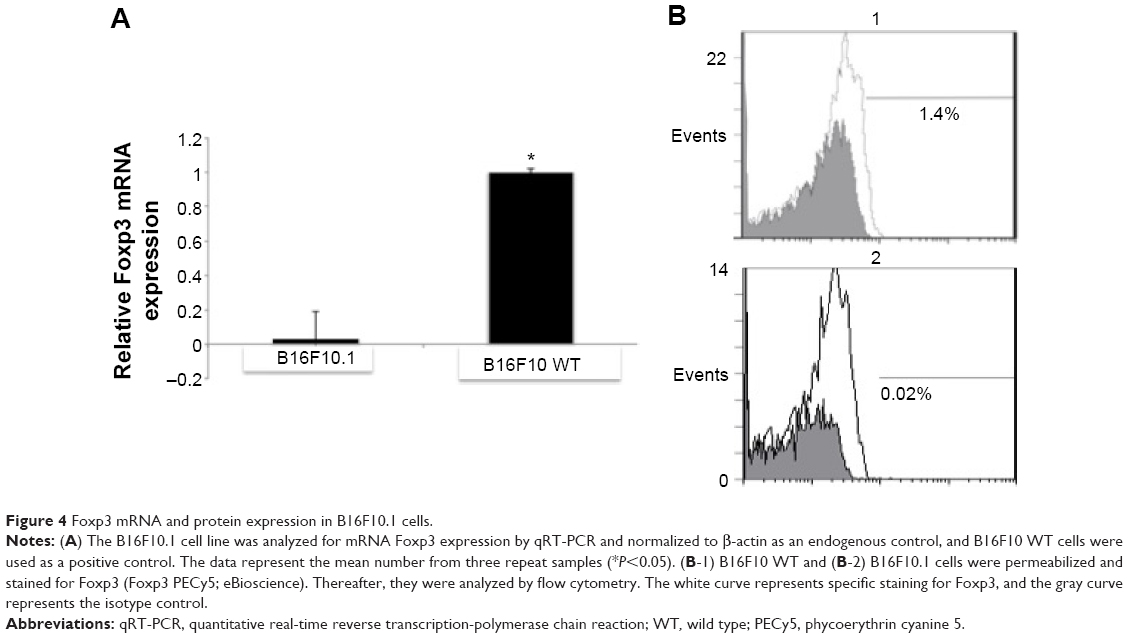 | Figure 4 Foxp3 mRNA and protein expression in B16F10.1 cells. |
Effects of silencing Foxp3 on cell growth, CD25+ expression, and cytokine production
Silencing Foxp3 significantly decreased cell proliferation as evaluated by trypan blue staining in the B16F10.1 cell line at 0 hour (2.5×10⁵ cells), 24 hours (2.7×10⁵ cells), 48 hours (3.4×10⁵ cells), and 72 hours (6.38×10⁵ cells). This decrease was lower than that in B16F10 WT cells, as follows: 0 hours (2.5×10⁵ cells), 24 hours (5.9×10⁵ cells), 48 hours (9.2×10⁵ cells), and 72 hours (15×105 cells; Figure 5). CD25+ expression significantly decreased in B16F10.1 cells (0.06%) compared with B16F10 WT cells (0.69%; Figure 6). IL-2 production was only affected (P<0.05) in the B16F10.1 cell line (72.35 pg/mL) compared with B16F10 WT cells (86.41 pg/mL), and there was no difference (P<0.05) in the other evaluated cytokines: B16F10 WT cells (TGF-β [2.85 pg/mL], IL-10 [1.75 pg/mL], and INF-γ [2.45 pg/mL]) and B16F10.1 cells (TGF-β [2.73 pg/mL], IL-10 [1.72 pg/mL], and INF-γ [2.55 pg/mL]; Figure 7).
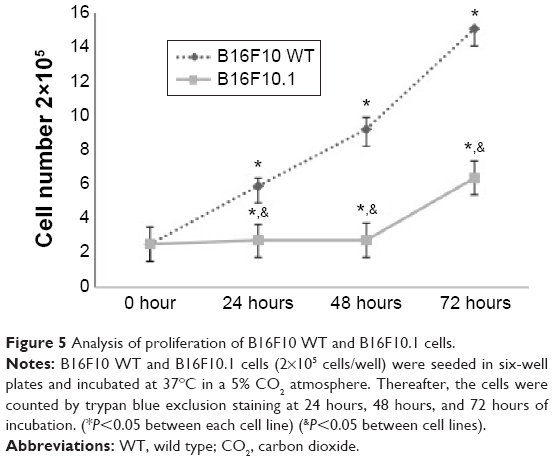 | Figure 5 Analysis of proliferation of B16F10 WT and B16F10.1 cells. |
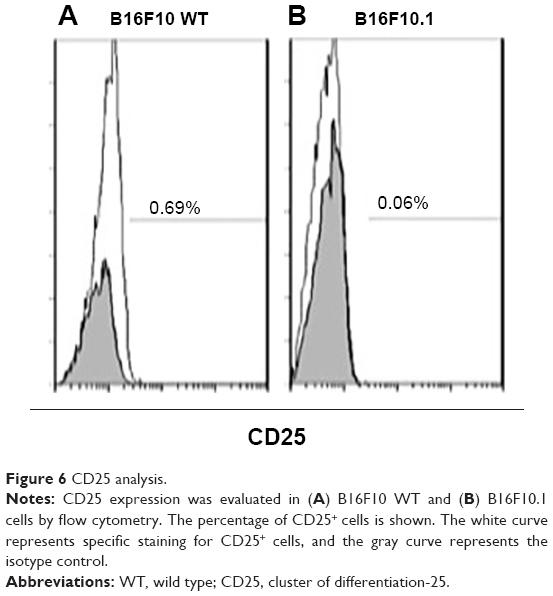 | Figure 6 CD25 analysis. |
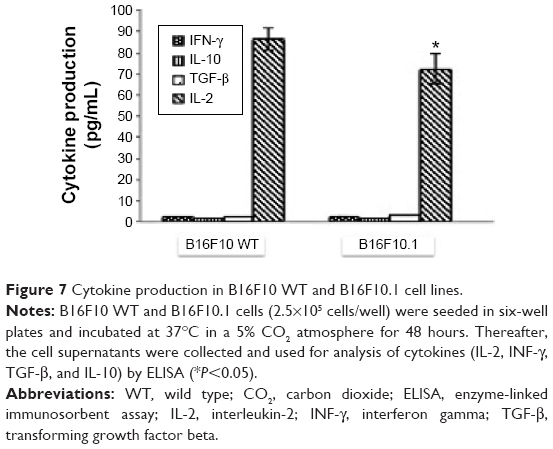 | Figure 7 Cytokine production in B16F10 WT and B16F10.1 cell lines. |
Inoculation with B16F10.1 cell line
Subcutaneous inoculation of B16F10.1 cell line into C57BL/6 mice delayed the time of visible tumor appearance (day 19 post inoculation; Figure 8A and B), increased the time of survival (day 51 post inoculation; Figure 9C), and affected the weight of tumors (at days 7 [0.45 g], 14 [2.14 g], 21 [3.13 g], and 28 [4.13 g]; Figure 9A and B) compared with mice inoculated with the B16F10 WT cell line. In the B16F10 WT cell line, visible tumor appearance increased at day 11 post inoculation (Figure 8A and B), the time of survival was day 39 post inoculation (Figure 9C), and the weights of the tumors were 0.85 g (day 7), 2.39 g (day 14), and 7.31 g (day 21; Figure 9A and B).
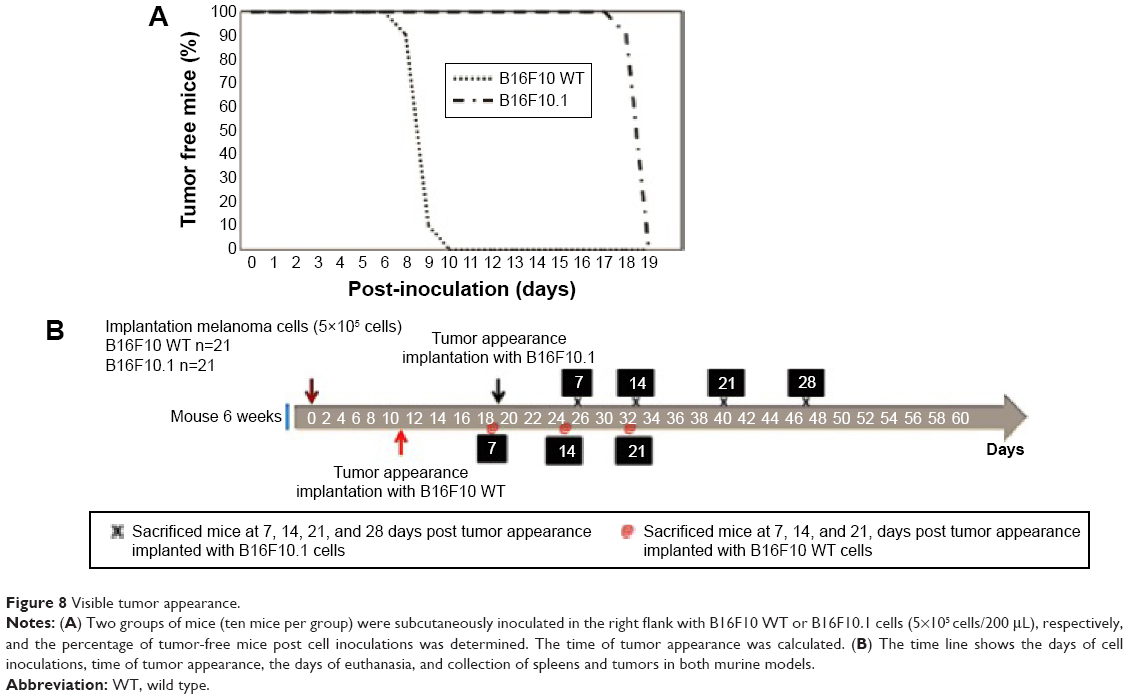 | Figure 8 Visible tumor appearance. |
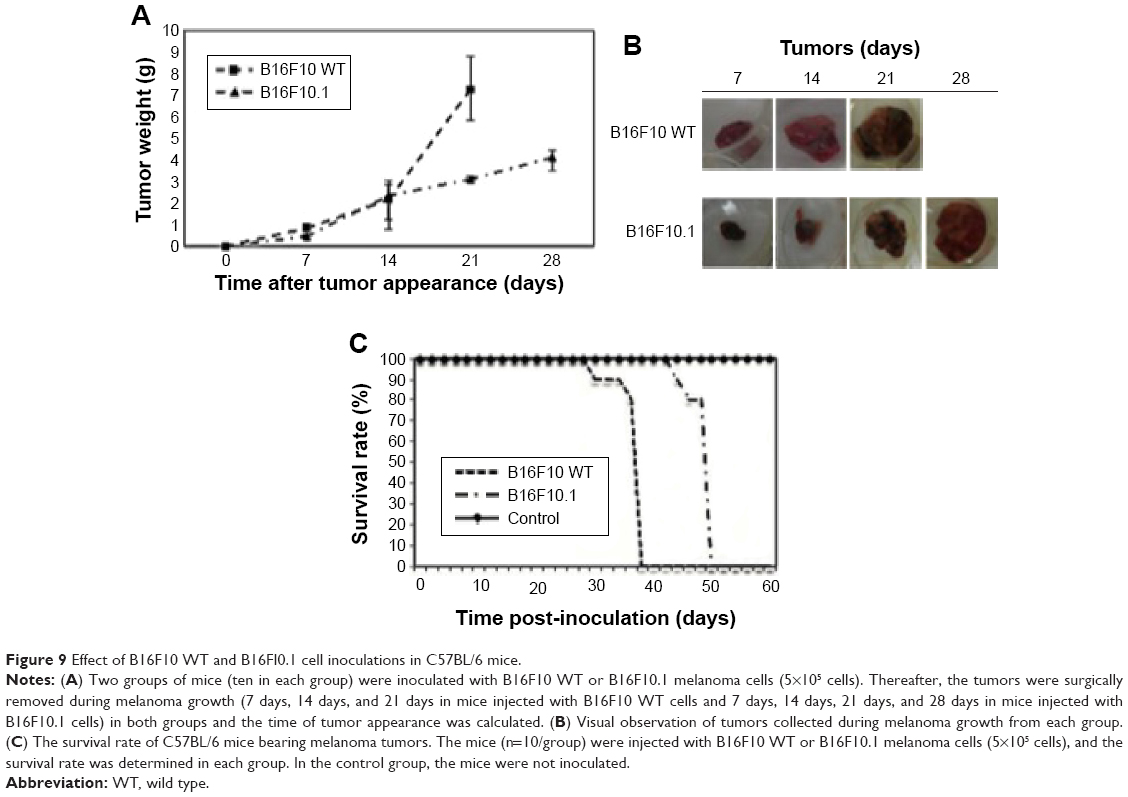 | Figure 9 Effect of B16F10 WT and B16FI0.1 cell inoculations in C57BL/6 mice. |
Foxp3 expression in tumors
After inducing tumors in mice by the inoculation of B16F10 WT or B16F10.1 cell lines, the mice were euthanized at different times to evaluate Foxp3 expression in the tumors using qRT-PCR. The relative Foxp3 expression level increased in B16F10 WT cell line in a time-dependent manner (P<0.05) during tumor growth, as follows: 7 days (onefold), 14 days (21.9-fold), and 21 days (196.7-fold) post tumor appearance. The B16F10.1 cell line had a decrease in the relative Foxp3 expression level during the 7 days (onefold), 14 days (1.03-fold), and 21 days (0.26-fold) of tumor growth compared with the B16F10 WT cell line, but the relative Foxp3 expression level increased at day 28 (12.9-fold; Table 1). To remove the influence of TILs on the Foxp3 expression level, we positively selected lymphocytes using Dynabeads and evaluated the Foxp3 expression by flow cytometry. The results of this analysis showed the same pattern of Foxp3 expression: increased expression during melanoma growth at 7 days (1.47%), 14 days (21.57%), and 21 days (89.25%) in intratumoral B16F10 WT cells, while intratumoral B16F10.1 cells had a decrease in Foxp3 expression during the 7 days (0.02%), 14 days (0.04%), and 21 days (0.40%) of tumor growth. However, Foxp3 expression increased at day 28 (12.82%; Table 1).
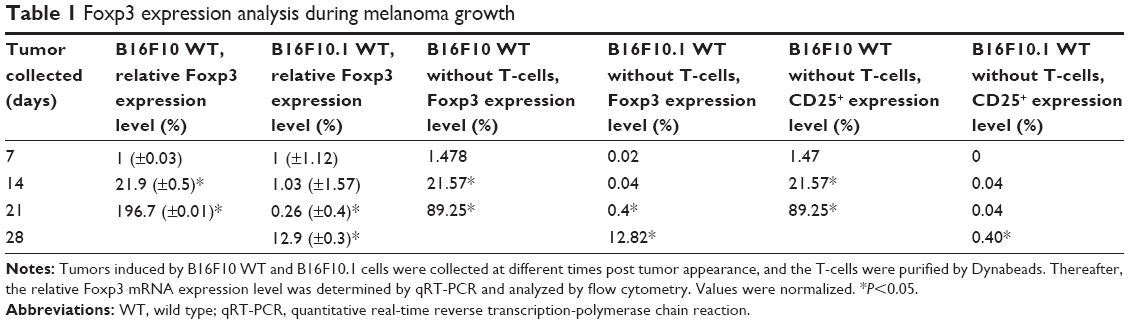 | Table 1 Foxp3 expression analysis during melanoma growth |
CD25+ expression in tumors
The expression of CD25+ was evaluated in intratumoral B16F10 cell lines after the positive selection of lymphocytes by Dynabeads. The expression was higher during melanoma growth at 7 days (1.47%), 14 days (21.57%), and 21 days (89.25%; Table 1) in intratumoral B16F10 WT cells (P<0.05). The intratumoral B16F10.1 cells revealed a decreased CD25+ expression at 7 days (0.0%), 14 days (0.04%), 21 days (0.04%), and 28 days (0.40%) of tumor growth compared with intratumoral B16F10 WT cells (P<0.05; Table 1).
Cytokine production
The cytokine production in tumors induced by B16F10 WT or B16F10.1 cells was determined. Increased amounts of IL-10 and IL-2 in a time-dependent manner (P<0.05) were observed, whereas IFN-γ production was decreased and the production of TGF-β was not affected (P<0.05; Table 2). However, the production of IL-10, IL-2, and TGF-β from tumors induced by B16F10.1 cells was lower than that in tumors induced by B16F10 WT cells, whereas INF-γ production was higher in tumors induced by B16F10.1 cells during melanoma growth than in tumors induced by B16F10 WT cells (P<0.05; Table 2).
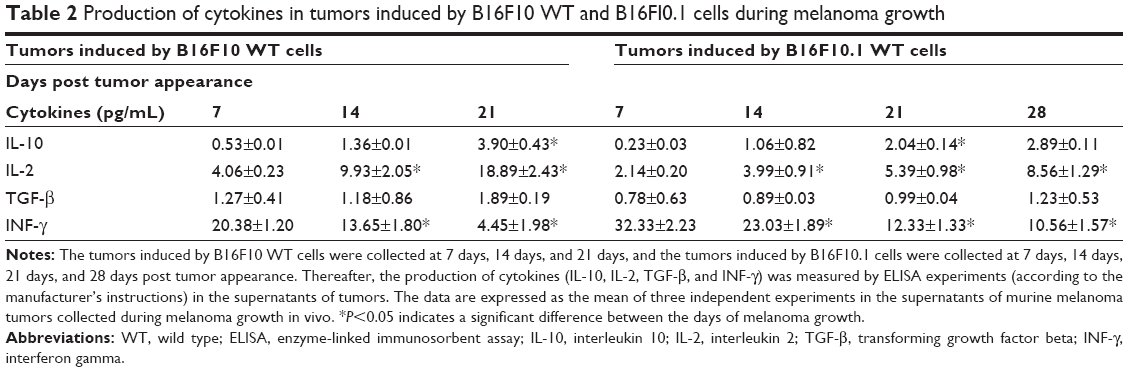 | Table 2 Production of cytokines in tumors induced by B16F10 WT and B16FI0.1 cells during melanoma growth |
Evaluation of CD4+ TIL populations
The levels of Foxp3 expression in tumors induced by B16F10 WT or B16F10.1 cells affected the CD4+ TIL population numbers. There was an increase in the population of lymphocytes (CD4+, CD4+CD25+, and CD4+CD25+FOXP3+) in a time-dependent manner (P<0.05) in the tumors induced by B16F10 WT cells (Table 3). In tumors induced by B16F10.1 cells, the cell numbers did not change significantly (P<0.05) in CD4+, CD4+CD25+, and CD4+CD25+FOXP3+ populations (P<0.05; Table 3). The percentages of T CD4+ lymphocyte populations were lower in tumors from mice inoculated with B16F10.1 cells than those in mice inoculated with B16F10 WT cells during melanoma growth (Table 3).
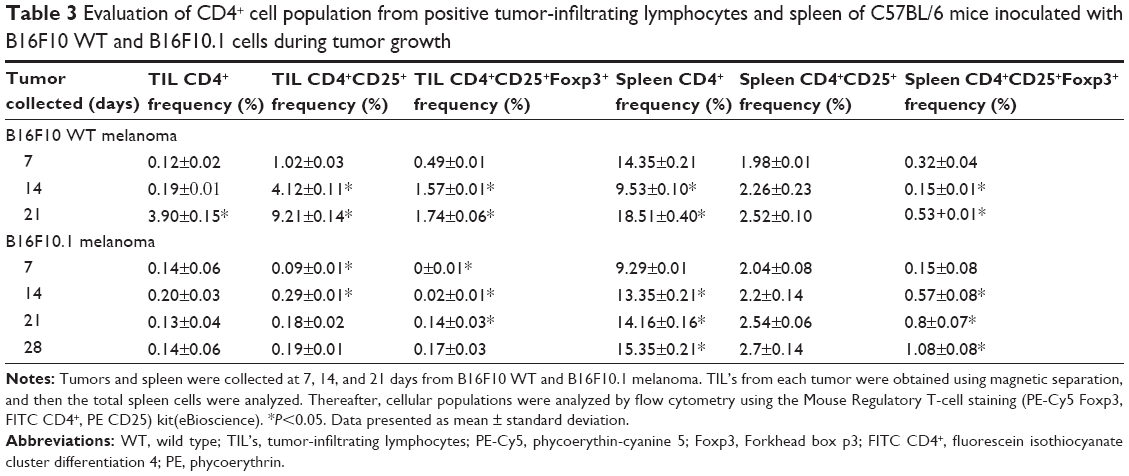 | Table 3 Evaluation of CD4+ cell population from positive tumor-infiltrating lymphocytes and spleen of C57BL/6 mice inoculated with B16F10 WT and B16F10.1 cells during tumor growth |
Evaluation of T CD4+ positive cells in spleen
The population levels of T CD4+ positive cells were evaluated in spleens from mice inoculated with B16F10 WT or B16F10.1 cells. There was a decrease in the CD4+ population at 14 days and an increase at 21 days compared to that at 7 days in mice inoculated with B16F10 WT cells. The populations of CD4+CD25+ and CD4+CD25+FOXP3+ were not significantly different (P>0.05) during melanoma growth in spleens of mice inoculated with B16F10 WT cells (Table 3). The population of T CD4+ cells increased in a time-dependent manner and did not show significant changes in CD4+CD25+ and CD4+CD25+FOXP3+ populations until 28 days, when there was an increase in CD4+CD25+FOXP3+ populations in mice inoculated with B16F10.1 cells (Table 3). The T CD4+ cell populations at 7 days and 21 days were higher in spleen cells of mice inoculated with B16F10 WT cells compared to those in mice inoculated with B16F10.1 cells. At 14 days, the population was lower in mice inoculated with B16F10 WT compared with mice inoculated with B16F10.1 cells and did not show significant changes between CD4+CD25+ and CD4+CD25+FOXP3+ populations from mice inoculated with B16F10 WT cells and mice inoculated with B16F10.1 cells (Table 3).
Discussion and conclusion
In this study, a cellular clone of B16F10.1 cells was obtained by transfection with siFoxp3-1 plasmid for silencing Foxp3, with the purpose of determining the role of Foxp3 expression in tumor cells. This is a controversial topic, with in vitro studies pointing to an oncosuppressive action, whereas studies conducted on human samples associate Foxp3 expression by tumor cells with metastatic spread.9
The plasmid siFoxp3-3 decreased the relative cell viability of B16F10 cells (94.99%) and was not optimal for the establishment of a cellular clone. These findings are controversial because an increase10 or decrease11 of Foxp3 expression has been associated with cellular death, suggesting that the action is dependent on the primer design. The silencing of Foxp3 reduced Foxp3 expression and cellular proliferation and decreased the expression of CD25+ and IL-2 production compared with B16F10 WT cells. These results were in agreement with those reported previously by Miranda-Hernandez et al, 2013, where Foxp3 and CD25+ expression and IL-2 production correlated with tumor growth.12 In lymphocytes, Foxp3 interacts with the nuclear factor of activated T-cells (NFAT) to induce suppressive molecules such as IL-10, TGF-β, cytotoxic T-lymphocyte antigen 4 (CTLA-4), and CD25+, maintaining the anergic features and suppressive functions of Tregs.13 In melanoma cells, apoptosis is triggered by CsA or NFATc2 silencing, suggesting that NFAT could be a therapeutic target in melanoma.9 However, there was no difference (P<0.05) in the production of cytokines such as TGF-β, IL-10, and INF-γ in B16F10 WT and B16F10.1 cells, suggesting that IL-2 and its receptor CD25+ play a role in melanoma proliferation in a Foxp3 expression–dependent manner. The effect of silencing of Foxp3 on tumor proliferation was corroborated in vivo, when the B16F10.1 cells were subcutaneously inoculated into mice. This treatment significantly delayed (P<0.05) the time of visible tumor appearance, increased the time of survival, and decreased the tumor weight compared with B16F10 WT cells. These results are different compared to other studies that reported that Foxp3 inhibits breast tumor growth by directly repressing the transcription activity of two oncogenes, HER2 and SKP2, while inducing the transcription activity of the tumor suppressor gene p21.14 Foxp3 has been identified as an X-linked tumor suppressor gene for both breast cancer and prostate cancer and has been proposed as a strategy to address the reactivation of Foxp3 for cancer therapy.15
Foxp3 expression was lower in B16F10.1 cells derived from tumors than in B16F10 WT cells. These results confirm those reported by our team,12 suggesting that Foxp3 could play a role in melanoma growth. On the other hand, the expression of the cytokines IL-10, IL-2, and TGF-β and CD25+ were lower in melanomas derived from B16F10.1 cell clones than in melanomas derived from B16F10 WT cells during tumor growth, although INF-γ production was higher. In lymphocytes, but not melanomas, previous reports indicated that Foxp3 forms complexes with the Rel family transcription factors NFAT and nuclear factor-kappa B and blocks their ability to activate IL-2 and INF-γ transcription.16 In contrast to this, our results suggest that Foxp3 plays a more complex role in melanoma cells than in lymphocytes and partly modulates the interaction with other transcription factors related to cytokine production and expression of CD25+. The populations of CD4+ TILs (CD4+, CD4+CD25+, and CD4+CD25+Foxp3+) were lower in melanomas derived from B16F10.1 cells than in melanomas derived from B16F10 WT cells, which is related to the type and amount of cytokines secreted by the tumor cells. Similar results were observed in spleens until 28 days, when the CD4+CD25+Foxp3+ cells increased in mice inoculated with B16F10.1 cells. Other studies have shown that coculture of Foxp3-expressing melanoma cells with naive CD4+CD25+ T-cells resulted in a strong Foxp3-dependent inhibition of T-cell proliferation,17 when the cells were either in contact or separated using Transwells.
In this study, Foxp3 induced tumor growth in melanoma cells by modifying the immune system at the local and peripheral level, shifting the environment toward an immunosuppressive profile. Therapies based on this transcription factor could be strategies for melanoma treatment, although similar studies in human melanoma cell lines should be undertaken to corroborate these findings.
Acknowledgments
This work was supported by the Immunology and Virology Department, Biological Sciences Faculty, University Autonomous of Nuevo León in collaboration with “Red Temática de Inmunología en Cáncer y Enfermedades Infecciosas” with registry number 253053, CONACYT.
Author contributions
All authors contributed toward data analysis, drafting and critically revising the paper and agree to be accountable for all aspects of the work.
Disclosure
The authors report no conflicts of interest in this work.
References
Karanikas V, Speletas M, Zamanakou M, et al. Foxp3 expression in human cancer cells. J Transl Med. 2008;6:19. | ||
Zhang B, Dou Y, Xu X, et al. Endogenous FOXP3 inhibits cell proliferation, migration and invasion in glioma cells. Int J Clin Exp Med. 2015;15:1792–1802. | ||
Hinz S, Pagerols-Raluy L, Oberg HH, et al. Foxp3 expression in pancreatic carcinoma cells as a novel mechanism of immune evasion in cancer. Cancer Res. 2007;67:8344–8350. | ||
Ebert LM, Tan BS, Browning J, et al. The regulatory T cell-associated transcription factor FoxP3 is expressed by tumor cells. Cancer Res. 2008;68:3001–3009. | ||
Gavin MA, Torgerson TR, Houston E, et al. Single-cell analysis of normal and FOXP3-mutant human T cells: FOXP3 expression without regulatory T cell development. Proc Natl Acad Sci U S A. 2006;103:6659–6664. | ||
Ahmadzadeh M, Antony PA, Rosenberg SA. IL-2 and IL-15 each mediate de novo induction of FOXP3 expression in human tumor antigen-specific CD8 T cells. J Immunother. 2007;30:294–302. | ||
Ahmadzadeh M, Felipe-Silva A, Heemskerk B, et al. FOXP3 expression accurately defines the population of intratumoral regulatory T cells that selectively accumulate in metastatic melanoma lesions. Blood. 2008;112:4953–4960. | ||
Coombes JL, Siddiqui KR, Arancibia-Carcamo CV, et al. A functionally specialized population of mucosal CD103+ DCs induces Foxp3+ regulatory T cells via a TGF-beta and retinoic acid-dependent mechanism. J Exp Med. 2007;204:1757–1764. | ||
Triulzi T, Tagliabue E, Balsari A, Casalini P. FOXP3 expression in tumor cells and implications for cancer progression. J Cell Physiol. 2013;228(1):30–35. | ||
Ma GF, Miao Q, Liu YM, et al. High FoxP3 expression in tumour cells predicts better survival in gastric cancer and its role in tumour microenvironment. Br J Cancer. 2014;110:1552–1560. | ||
Douglass S, Meeson AP, Overbeck-Zubrzycka D, et al. Breast cancer metastasis: demonstration that FOXP3 regulates CXCR4 expression and the response to CXCL12. J Pathol. 2014;234:74–85. | ||
Miranda-Hernández DF, Franco-Molina MA, Mendoza-Gamboa E, et al. Expression of Foxp3, CD25 and IL-2 in the B16F10 cancer cell line and melanoma is correlated with tumor growth in mice. Oncol Lett. 2013;6(5):1195–1200. | ||
Lee SM, Gao B, Fang D. FoxP3 maintains Treg unresponsiveness by selectively inhibiting the promoter DNA-binding activity of AP-1. Blood. 2008;111(7):3599–3606. | ||
Liu R, Wang L, Chen G, et al. FOXP3 up-regulates p21 expression by site-specific inhibition of histone deacetylase 2/histone deacetylase 4 association to the locus. Cancer Res. 2009;69:2252–2259. | ||
Wang L, Liu R, Ribick M, Zheng P, Liu Y. FOXP3 as an X-linked tumor suppressor. Discov Med. 2010;10(53):322–328. | ||
Soligo M, Camperio C, Caristi S, et al. CD28 costimulation regulates FOXP3 in a RelA/NF-kappaB-dependent mechanism. Eur J Immunol. 2011;41:503–513. | ||
Niu J, Jiang C, Li C, et al. Foxp3 expression in melanoma cells as a possible mechanism of resistance to immune destruction. Cancer Immunol Immunother. 2011;60(8):1109–1118. |
 © 2016 The Author(s). This work is published and licensed by Dove Medical Press Limited. The full terms of this license are available at https://www.dovepress.com/terms.php and incorporate the Creative Commons Attribution - Non Commercial (unported, v3.0) License.
By accessing the work you hereby accept the Terms. Non-commercial uses of the work are permitted without any further permission from Dove Medical Press Limited, provided the work is properly attributed. For permission for commercial use of this work, please see paragraphs 4.2 and 5 of our Terms.
© 2016 The Author(s). This work is published and licensed by Dove Medical Press Limited. The full terms of this license are available at https://www.dovepress.com/terms.php and incorporate the Creative Commons Attribution - Non Commercial (unported, v3.0) License.
By accessing the work you hereby accept the Terms. Non-commercial uses of the work are permitted without any further permission from Dove Medical Press Limited, provided the work is properly attributed. For permission for commercial use of this work, please see paragraphs 4.2 and 5 of our Terms.