")
Back to Journals » OncoTargets and Therapy » Volume 10
Silencing of AQP3 induces apoptosis of gastric cancer cells via downregulation of glycerol intake and downstream inhibition of lipogenesis and autophagy
Authors Chen L, Li Z, Zhang Q, Wei S, Li B, Zhang X, Zhang L, Li Q, Xu H , Xu Z
Received 6 February 2017
Accepted for publication 5 May 2017
Published 1 June 2017 Volume 2017:10 Pages 2791—2804
DOI https://doi.org/10.2147/OTT.S134016
Checked for plagiarism Yes
Review by Single anonymous peer review
Peer reviewer comments 3
Editor who approved publication: Dr Yao Dai
Liang Chen,* Zheng Li,* Qiang Zhang,* Song Wei, Bowen Li, Xuan Zhang, Lei Zhang, Qing Li, Hao Xu, Zekuan Xu
Department of General Surgery, The First Affiliated Hospital of Nanjing Medical University, Nanjing, People’s Republic of China
*These authors contributed equally to this work
Abstract: Gastric cancer (GC) has a poor prognosis and is a leading cause of cancer-related death. Optimal therapeutic targets have not been identified. AQP3 is capable of transporting glycerol across the cytomembrane. Previous studies have shown that AQP3 is involved in proliferation, invasion and migration by regulating glycerol and lipid metabolism in diverse cancer cell types. However, the potential roles of glycerol and lipid metabolism in AQP3-related cell apoptosis in GC remain unclear. In this study, we observed that AQP3 expression was upregulated in tumor tissues, and positively correlated with tumor size, lymph node metastasis and glycerol concentration in human GC samples. Silencing of AQP3 resulted in decreased glycerol intake and impaired lipid synthesis, which contributed to increased cell apoptosis. Furthermore, inhibition of autophagy induced by AQP3 knockdown promoted cell apoptosis. Administration of either glycerol or rapamycin restored cell viability, and overexpression of AQP3 increased cell viability by upregulating cellular glycerol metabolism and autophagy. Our study demonstrates that the increase in cell apoptosis of AQP3-deficient GC cells is a consequence of reduced glycerol uptake and lipogenesis and is associated with autophagy inhibition induced by AQP3 deficiency.
Keywords: AQP3, glycerol uptake, lipid metabolism, autophagy, apoptosis
Background
Gastric cancer (GC), a common and lethal malignancy worldwide, is a leading cause of cancer deaths, especially in Eastern Asia.1 The prognosis for GC patients is poor, particularly for those diagnosed at an advanced stage.2 Effective therapeutic targets for GC are lacking.
AQP3, a member of the aquaporin family of integral transmembrane proteins, is mainly expressed in the epithelial cells of the upper digestive tract.2–6 AQP3 is primarily responsible for transporting water and other small molecules such as glycerol and urea across the plasma membrane.7–10 AQP3 is also involved in several signal transduction pathways in cancer cells, such as epidermal growth factor receptor signaling and the stress response via H2O2 transport.11,12 Several studies have implicated abnormal expression of AQP3 in dysregulation of intestinal barrier integrity and function13 and in cell proliferation, invasion, migration and apoptosis of various cancer types, including GC.14–17 In addition, functional inhibition of AQP3 has been reported to block cell proliferation.18 We have previously demonstrated that AQP3 promotes proliferation of GC cells by upregulating intracellular lipid metabolism, and the dysregulation of lipogenesis results in a reduction of energy production.3 However, the pathogenic mechanism of AQP3-associated cancer cell apoptosis has not been elucidated.
In cancer cells, lipids are essential for maintaining the integrity of biological membranes, such as the cytomembrane, and for providing energy for malignant biological behavior.19,20 With the catalysis of glycerol kinase, glycerol can be transformed into glycerol-3-phosphate, the primary intermediate for generating lipids such as triacylglycerol (TAG) and adenosine triphosphate (ATP).21,22 We have also demonstrated that glycerol transported by AQP3 is the key material for TAG formation and subsequent ATP production, which are required for cell proliferation, through a multistep enzymatic reaction, and knockdown of AQP3 induces dysregulation of glycerol-related lipid and downstream energy metabolism, which contributes to decreased cellular proliferation activity in GC.3 Furthermore, AQP3 has been reported to be correlated with autophagy,23 which plays an important role in regulating apoptosis in GC cells.24,25 As an autophagy agonist, rapamycin has been used to activate autophagy in alveolar epithelial cells.26 ATG5 plays a critical role in promoting cell autophagy progression, and knockdown of ATG5 reduces cell autophagy.27 Given the reported relationship between AQP3 and GC cell apoptosis, the purpose of our study was to investigate whether loss of AQP3 can trigger cell apoptosis via disorder of glycerol-associated lipogenesis and illuminate the role of autophagy regulation in the process of AQP3-related cell apoptosis in GC.
Materials and methods
Cell culture
The human GC cell lines BGC-823 and SGC-7901 were purchased from the Shanghai Institutes for Biological Sciences (Shanghai, People’s Republic of China) and cultivated in Roswell Park Memorial Institute (RPMI) 1640 (Gibco, Carlsbad, CA, USA) supplemented with 10% fetal bovine serum (FBS, Thermo Fisher Scientific, Waltham, MA, USA) and 1% penicillin–streptomycin solution (10,000 units/mL penicillin, 10,000 μg/mL streptomycin; HyClone, Logan, UT, USA). Cells were cultured in a humid incubator at 37°C supplemented with 5% carbon dioxide.
Human samples
Thirty pairs of samples of GC, including tumor tissues and corresponding normal tissues, were collected postoperatively from patients admitted at the First Affiliated Hospital of Nanjing Medical University and immediately stored at −80°C. All the patients signed informed consent before sample collection. The study was approved by the Institutional Ethical Board of the First Affiliated Hospital of Nanjing Medical University.
Antibodies and reagents
Anti-AQP3, anti-glyceraldehyde 3-phosphate dehydrogenase, anti-mouse IgG-horseradish peroxidase (HRP), and anti-rabbit IgG-HRP antibodies were purchased from Santa Cruz (Dallas, TX, USA). Anti-LC3 and anti-P62 were purchased from Cell Signaling (Beverly, MA, USA). Anti-Ki-67 was purchased from Abcam (Cambridge, UK). Glycerol and rapamycin were purchased from Sigma (St Louis, MO, USA). TRIzol was purchased from TaKaRa (Shiga, Japan).
Lentivirus, plasmid and siRNA transfection
Short hairpin RNAs (shRNAs), including AQP3-targeting shRNA (shAQP3) and control vectors (shCTL), were packaged in lentiviral vectors by Genepharma (Shanghai, People’s Republic of China). The shRNAs were purchased from Genepharma and had the following sequences: shAQP3, 5′-GGATATGATCAATGGCTTCTT-3′; shCTL, 5′-TTCTCCGAACGTGTCACGT-3′; siATG5, 5′-GGATGAGATAACTGAAAGG-3′. The GFP-LC3 plasmid was purchased from Genepharma. Lipofectamine 2000 was purchased from Invitrogen (Carlsbad, CA, USA). All transfections of GC cell lines were performed precisely according to the manufacturer’s instructions.
Real-time polymerase chain reaction (PCR) and primers
GC samples collected from 30 patients were employed to analyze the correlation between clinicopathological factors and AQP3 expression. Informed consent was signed by all patients before sample collection. TRIzol was used to extract AQP3 mRNA from cells or GC samples, followed by reverse transcription (RT) into cDNA using RT reagents. Xenograft model tissues were homogenized before extraction of AQP3 mRNA. FastStart Universal SYBR Green Master (Rox) (Hoffman-La Roche Ltd., Basel, Switzerland) was used in real-time PCR. Primers were purchased from Realgene (Nanjing, People’s Republic of China) with the following sequences: AQP3-F, 5′-CCGTGACCTTTGCCATGTG-3′; AQP3-R, 5′-CGAAGTGCCAGATTGCATCATAA-3′. Beta-actin was used as the reference gene. All procedures were conducted according to the manufacturer’s guidelines.
Cell counting assay
Equal numbers of cells (5,000 cells per well) were plated into 96-well plates after transfection and starved (cultured in RPMI 1640 without supplementation with FBS and penicillin–streptomycin solution) for 48 h. The cell number was estimated with Cell Counting kit 8 (CCK-8; Dojindo, Kumamoto, Japan) according to the manufacturer’s instructions. Glycerol was added at different concentrations (0.175, 0.35 and 0.70 mol/L).
Flow cytometry assay
Equal numbers of cells transfected with lentiviral vector were cultivated in each well of a 6-well plate. All cells were collected using trypsin solution (without EDTA, Nalgene, Rochester, NY, USA) and stained with a fluorescein isothiocyanate Annexin V Apoptosis Detection kit (BD Pharmingen, Franklin Lakes, NJ, USA). A flow cytometer (BD Biosciences, San Jose, CA, USA) was employed to determine the apoptosis ratio of the cells. Glycerol was supplemented at the concentrations indicated above. Rapamycin was added at concentration of 1 μmol/L.28
Oil Red O staining
After transfection, identical numbers of cells were cultured in each well of a 6-well plate. Following starvation for 48 h, the cells were fixed in 10% formaldehyde solution (Nanjing Chemical Reagent Co. Ltd., Nanjing, People’s Republic of China) for 1 h and then dyed with an Oil Red O staining kit (Jiancheng Biotech, Nanjing, People’s Republic of China) for 30 min according to the manufacturer’s instructions. Images of the cells were acquired with a microscope (Nikon Corporation, Tokyo, Japan).
Detection of cellular glycerol levels
After transfection, the cells were plated in 6-well plates and cultured for 48 h. The cells were collected and lysed by repeated freeze-thawing. The cellular glycerol level was determined using a glycerol detection kit (Applygen, Beijing, People’s Republic of China) according to the manufacturer’s protocol. Human tissue samples and xenograft model tissues were homogenized and lysed as described above before determining the glycerol level. Cell protein, which was used to normalize the glycerol level, was quantified with the bicinchoninic acid assay method using a protein quantitative reagent kit (Applygen, Beijing, People’s Republic of China) in different cell groups and tissue samples.
Cellular TAG level detection assay
Following transfection and cultivation in 6-well plates for 48 h, cells were collected and lysed as described above. The TAG level in the cells was measured with a TAG detection kit (Applygen) according to the manufacturer’s instructions.
Western blot assay
After transfection, a protein extraction kit (Keygen Biotech, Nanjing, People’s Republic of China) was used to extract cell proteins from different groups of BGC-823 and SGC-7901 cells. Gels were prepared with sodium dodecyl sulfate polyacrylamide gel electrophoresis gel preparation kit (Beyotime, Shanghai, People’s Republic of China). The extracted proteins were separated by electrophoresis in a gel of suitable acrylamide concentration and then transferred onto polyvinylidene difluoride western blotting membranes (Hoffman-La Roche Ltd.). The membrane with bound protein was then blocked with 5% bovine serum albumin in Tris-buffered saline with Tween-20 (TBST; Beyotime). Following incubation with the corresponding primary antibodies overnight at 4°C and washing three times with TBST for 30 min, the membranes were incubated with the relevant secondary antibodies for 2 h at room temperature and then washed in TBST three times for 30 min. A chemiluminescent HRP substrate (Millipore, Darmstadt, Germany) and an enhanced chemiluminescence detection system were used to analyze the protein blots.
Xenograft model of GC in nude mice
Female 4-week-old nude mice (BALB/c nude mice, Vital River, Beijing, People’s Republic of China) were provided by the Laboratory Animal Centre of Nanjing Medical University. All experimental procedures in vivo complied with the guidelines of the experimental animal care and use committee. Cells stably transfected with shAQP3 or shCTL were suspended in sterile phosphate-buffered saline (PBS; Wisent, St-Bruno, Quebec, Canada) and injected subcutaneously into the bilateral armpits of mice, with a cell number of 106 per side. Glycerol dissolved in sterile PBS was injected intraperitoneally into the mice every 3 days at a dosage of 2 g/kg body weight beginning 1 week after the injection of cells.29 Four weeks after injection of cells, the nude mice were sacrificed, and xenograft tumors were dissected. The formula for measuring tumor volume was as follows: Tumor volume =0.5× length × width2.
Immunohistochemical staining
The xenograft tumor samples were fixed in 4% formaldehyde solution. After embedding in paraffin, the tumor tissues were sectioned into 4-μm slices. The slices were incubated with rabbit anti-Ki67 antibody (Abcam) overnight at 4°C and then washed three times with PBS. Following incubation with HRP-polymer-conjugated secondary antibody at room temperature for 1 h, the slices were dyed with diaminobenzidine solution for 3 min and then stained with hematoxylin. Images of three random fields were acquired for each sample using a microscope (Nikon).
TdT-mediated dUTP nick end labeling (TUNEL) detection assay
A cell apoptosis detection kit (Roche) was used in a TUNEL assay. Sections prepared from the paraffin mass were hydrated in an ethanol gradient (100% for 5 min, 100% for 3 min, 95% for 3 min, 85% for 3 min, 70% for 3 min and 50% for 3 min), fixed in 4% formaldehyde solution, and then incubated with Proteinase K for 15 min at room temperature. Endogenous peroxidases were blocked with 3% H2O2. TUNEL reaction solution containing rTdT was prepared immediately before use according to the manufacturer’s protocol. After washing with PBS, the slices were counterstained with hematoxylin. Apoptotic cells in the slices were detected by microscopy (Nikon).
Laser confocal imaging
Cells transfected with shAQP3 or shCTL were evenly seeded into dishes for confocal imaging (2×10⁴ cells per dish), followed by transfection for 48 h with GFP-LC3 plasmid (Genepharma) for immunofluorescence. The cells were then fixed with fixative solution (Beyotime) for 10 min, and cell nuclei were stained with 4′,6-diamidino-2-phenylindole (Beyotime) for 5 min in the dark. A confocal microscope (Carl ZeissLSM710; Carl Zeiss Meditec AG, Jena, Germany) was used to detect the number of LC3 puncta per cell. The average number of LC3 dots per cell was counted in at least three fields.
Detection by electron microscopy
After transfection, the cells were plated into 6-cm dishes at 106 cells per dish. After 48 h, the cells from a dish were collected in a 1.5-mL Eppendorf tube and centrifuged at 1,500 rpm for 15 min. The cell mass at the bottom of the tube was fixed in 2.5% glutaraldehyde solution (provided by the testing and analysis center of Nanjing Medical University) overnight at 4°C after decanting the supernatant, followed by fixation in 1% osmium tetroxide for 1 h. The samples were dehydrated in an ethanol gradient (50%–100%) and embedded in Epon. A Reichert ultramicrotome was used to prepare ultrathin sections (50–70 nm) of the cell masses. After counterstaining with 0.3% lead citrate solution for 15 min, the slices were analyzed using a JEM-1010 electron microscope (provided by the testing and analysis center of Nanjing Medical University).
Statistical analysis
All statistical analyses were performed using the SPSS 19.0 software package. Data were analyzed with unpaired Student’s t-tests. Categorical data were analyzed with the Chi-square test. At least three independent experiments were performed for all procedures in this study, and the data are expressed as the mean ± standard error of the mean. A P-value <0.05 was considered statistically significant.
Ethics approval
Our study was approved by the Institutional Ethical Board of the First Affiliated Hospital of Nanjing Medical University. All the animal experiments were performed according to the guidelines of the Institutional Animal Care and Use Committee of Nanjing Medical University.
Results
The AQP3 expression level is associated with tumor size and lymph node metastasis in GC patients
AQP3 expression levels were detected by real-time PCR to analyze the correlation between clinicopathological factors and AQP3 expression in 30 GC samples. The AQP3 expression level was positively associated with tumor size and lymph node metastasis (Table 1). The expression level of AQP3 was significantly higher in the group with tumor size ≥2 cm than in the group with tumor size <2 cm (Figure 1A). These differences suggest that AQP3 contributes to the development of GC.
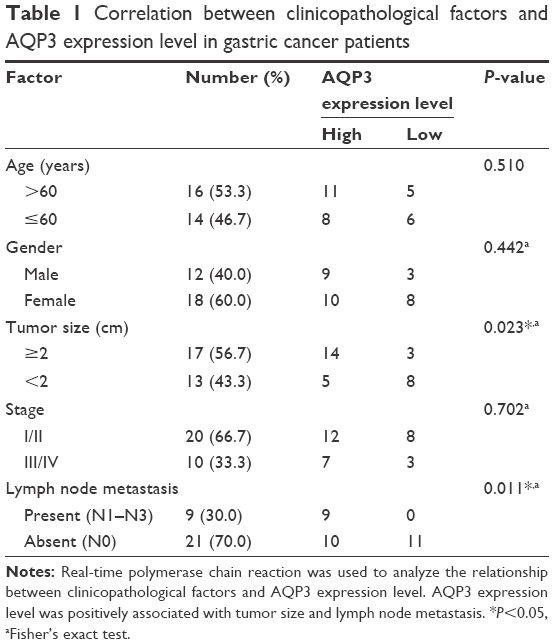 | Table 1 Correlation between clinicopathological factors and AQP3 expression level in gastric cancer patients |
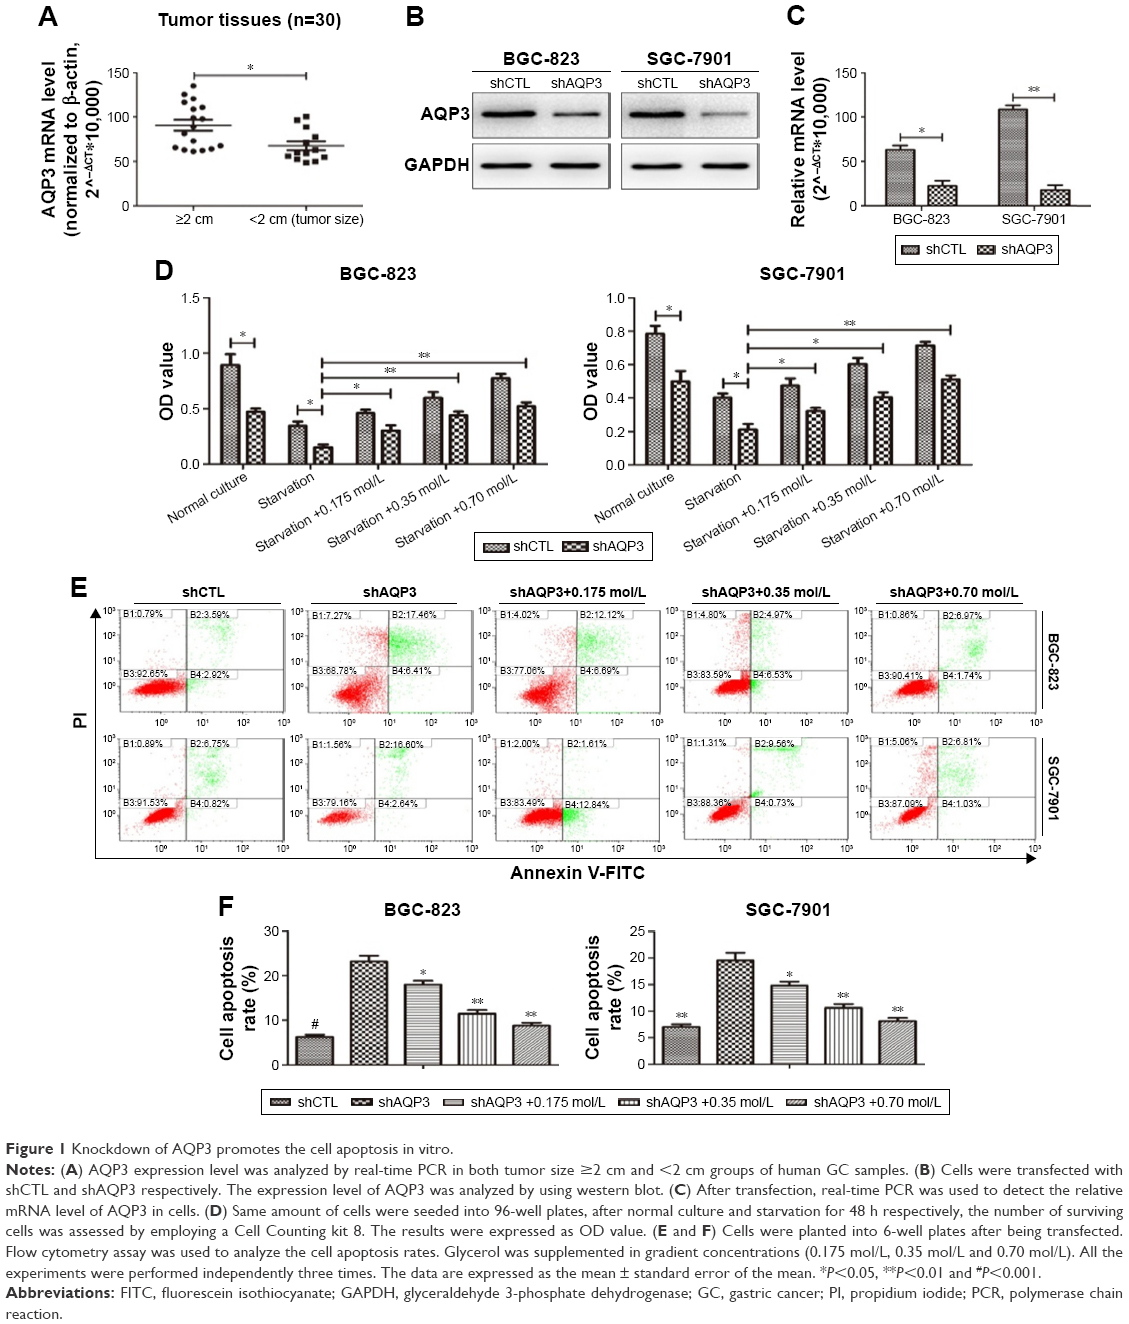 | Figure 1 Knockdown of AQP3 promotes the cell apoptosis in vitro. |
Loss of AQP3 promotes apoptosis of GC cells
After transfection of GC cells with shCTL or shAQP3, we confirmed the effect of AQP3 on the regulation of apoptosis. Western blot analysis and real-time PCR showed that the expression level of AQP3 was significantly lower in cells transfected with shAQP3 than in cells transfected with shCTL (Figure 1B and C). The CCK-8 assay revealed fewer number of cells among shAQP3 cells than among shCTL cells. In addition, after starvation for 48 h, cell viability was significantly decreased in both groups. When starved cells were supplemented with glycerol at different concentrations, cell viability was reversed in a glycerol concentration-dependent manner (Figure 1D). Flow cytometry indicated that the apoptosis rate of shAQP3 cells was much higher than that of shCTL cells. Treatment with glycerol restored the cell apoptosis ratios in shAQP3 cells in a glycerol concentration-dependent manner (Figure 1E and F).
AQP3 inhibition impairs the cell viability of GC cells in vivo
Real-time PCR was used to detect the expression level of AQP3 in human tumor and corresponding normal mucosa samples from 30 patients. The expression level of AQP3 was obviously upregulated in the tumor tissues (Figure 2A).
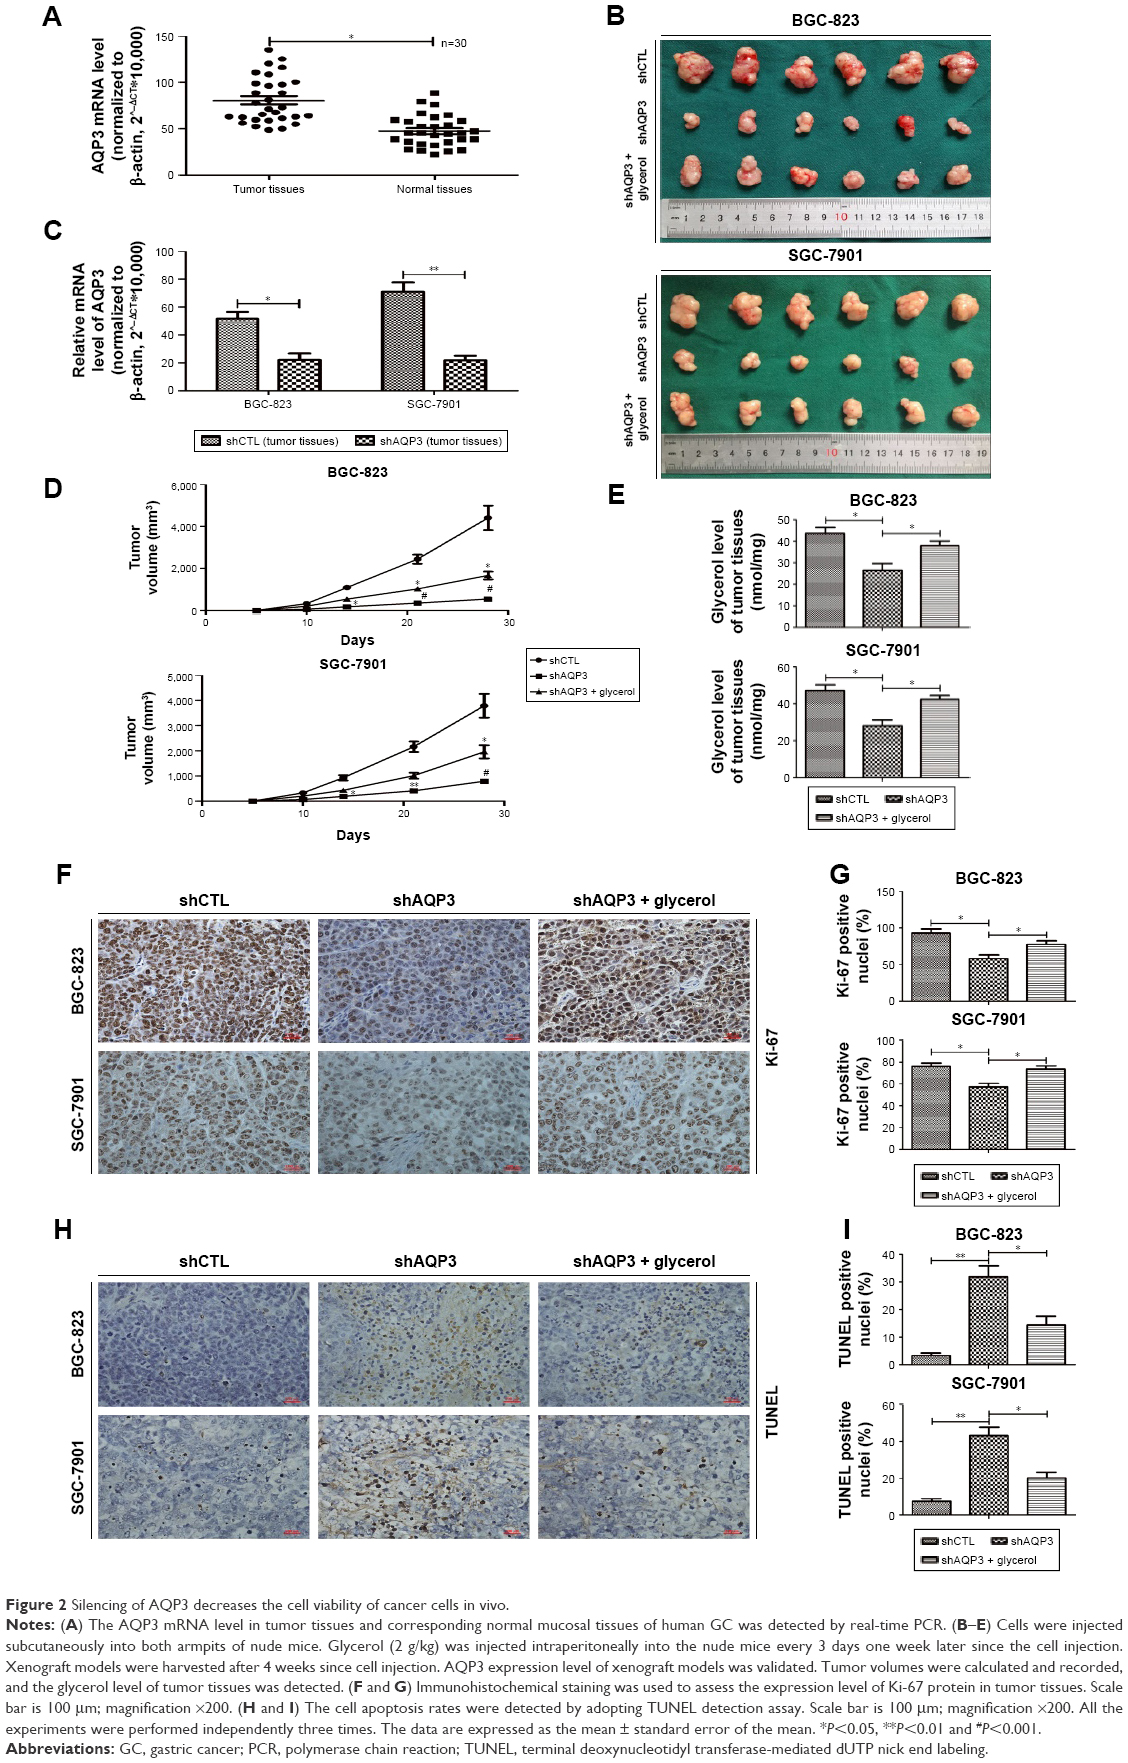 | Figure 2 Silencing of AQP3 decreases the cell viability of cancer cells in vivo. |
Cells transfected with shCTL or shAQP3 were injected subcutaneously into the bilateral armpits of nude mice to assess the influence of AQP3 on tumor formation by GC cells in vivo. Glycerol was injected intraperitoneally into the mice every 3 days 1 week after cell injection to validate the correlation between glycerol supplementation and increased cell viability. As shown in Figure 2B, compared with the control group (shCTL), tumor volume was significantly smaller in the xenograft group with impaired AQP3 expression, indicating a decreased number of tumor cells. However, the tumor volume was remarkably enhanced in the glycerol-supplemented group. Real-time PCR revealed a significant difference in AQP3 expression levels between the shCTL and shAQP3 groups (Figure 2C). The growth curves of the xenograft models are shown in Figure 2D. The glycerol level in xenograft tumor tissues was obviously lower in the shAQP3 group compared with the other groups (Figure 2E). Furthermore, Ki-67-positive immunohistochemical staining was significantly lower in the shAQP3 group compared with the other groups (Figure 2F and G). TUNEL detection assay showed that the proportion of cell apoptosis was much higher in shAQP3 tumor tissues than in shCTL tumor tissues and was obviously reversed in the tumor tissues from the glycerol-administered mice (Figure 2H and I).
AQP3 deficiency impairs glycerol uptake and lipid synthesis
Glycerol is mainly transported across the cytomembrane by AQP3 and is vital for lipid synthesis.30,31 Lipids form biological membranes and provide energy in cancer cells.20 We validated the correlation between AQP3 expression and glycerol levels reported in our previous study in human GC tissues.3 As shown in Figure 3A, AQP3 mRNA levels were positively correlated with glycerol levels. A glycerol detection kit and TAG detection kit were employed to evaluate intracellular glycerol and TAG concentrations, respectively. The glycerol levels of several normal GC cell lines were detected, and moderate glycerol levels were observed in BGC-823 and SGC-7901 cell lines (Figure 3B). In addition, cellular glycerol levels were obviously lower in cells transfected with shAQP3 than in shCTL cells, and higher supplementary glycerol concentrations resulted in higher intracellular glycerol levels (Figure 3C). The results of the TAG detection assays were similar to those for glycerol detection in all cell groups (Figure 3D). Furthermore, Oil Red O staining used to assess lipid storage in the cancer cells revealed that the number of lipid droplets was remarkably higher in shCTL cells than in shAQP3 cells. An obvious increase in the number of lipid droplets was observed following glycerol supplementation (Figure 3E and F).
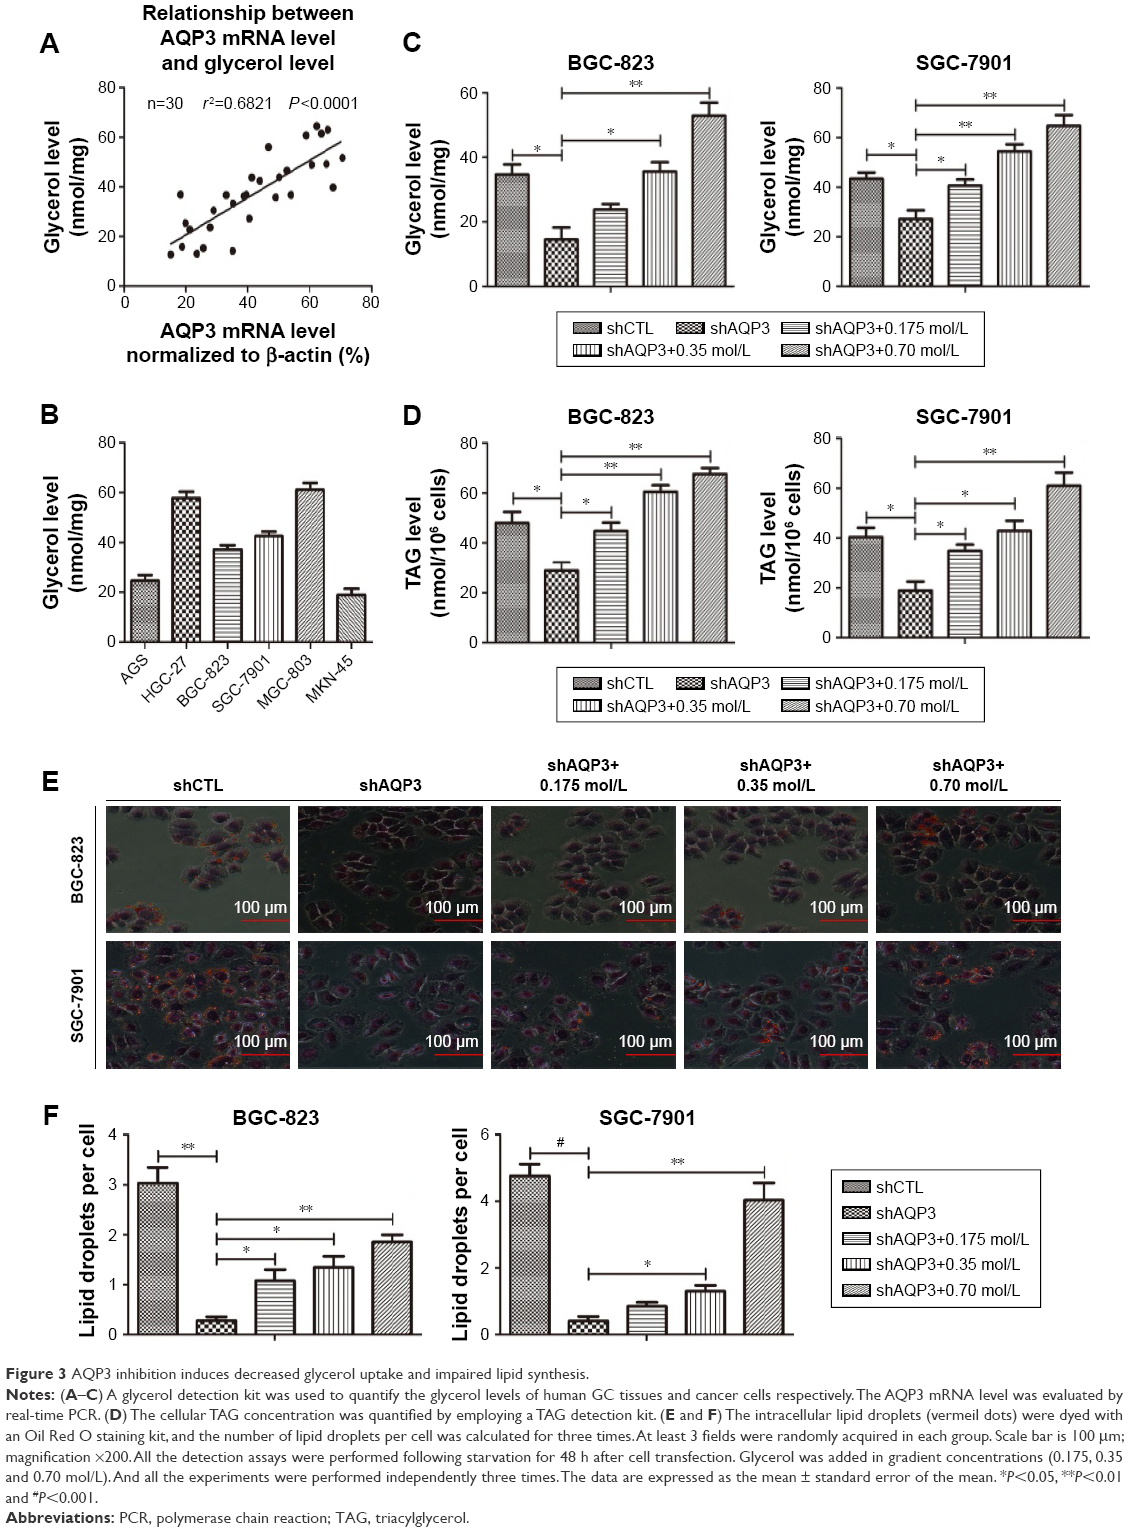 | Figure 3 AQP3 inhibition induces decreased glycerol uptake and impaired lipid synthesis. |
Implication of autophagy in AQP3-related apoptosis in GC cells
Autophagy plays a critical role in the regulation of cell apoptosis. Lipid rafts have been correlated with autophagy regulation,32 and increased lipid synthesis contributes to the generation of lipid raft.33 However, whether AQP3 inhibition induces GC cell apoptosis through glycerol and lipid metabolism-regulated autophagy remains unclear.
Autophagy can be evaluated at different levels using many methods. LC3 and P62 are among the most important autophagy-related proteins and are usually employed to evaluate the autophagy level.34 Western blot analysis (Figure 4A and B) confirmed that the LC3 expression level was significantly lower in shAQP3 cells than in the corresponding shCTL cells and increased in a concentration-dependent manner in glycerol-supplemented cells. By contrast, compared with shCTL cells, P62 expression increased obviously in the corresponding shAQP3 cells and decreased gradually upon supplementation with increasing concentrations of glycerol. We also validated the difference in LC3 expression between the shCTL and shAQP3 groups using a laser confocal imaging assay. The number of LC3 puncta was remarkably lower in shAQP3 cells compared with shCTL cells, and the administration of glycerol reversed the decrease in LC3 puncta (Figure 4C and D). Furthermore, transmission electron microscopy revealed that the number of autophagosomes was lower in shAQP3 cells than in shCTL cells and that glycerol supplementation restored the number of autophagosomes (Figure 4E).
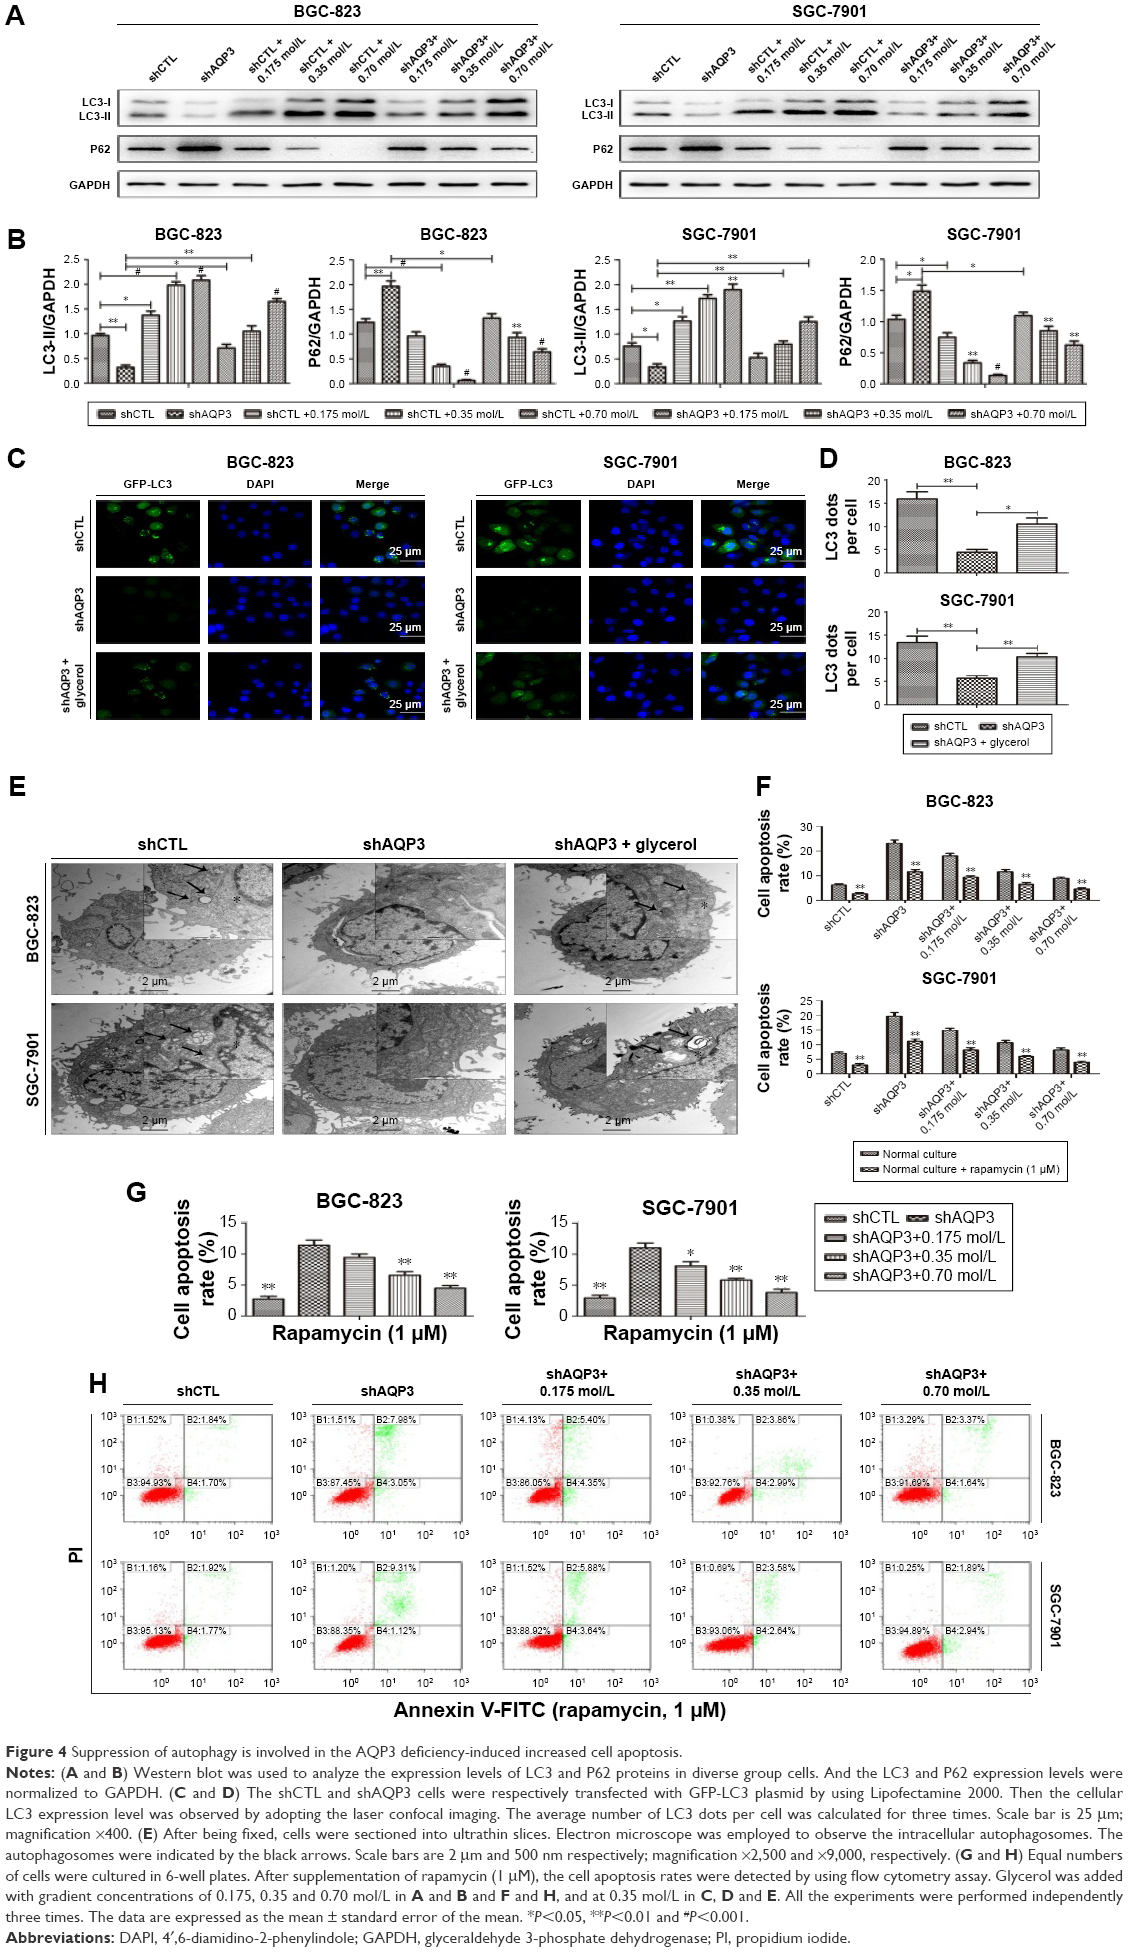 | Figure 4 Suppression of autophagy is involved in the AQP3 deficiency-induced increased cell apoptosis. |
A flow cytometry assay was employed to evaluate the role of autophagy in regulating AQP3 inhibition-induced cell apoptosis. Rapamycin, an autophagy activator, was added at a concentration of 1 μmol/L28 to promote the autophagy of GC cells under the basic culture conditions described in Figure 1E and F. The cell apoptosis rate was obviously higher among shAQP3 cells than among shCTL and glycerol-supplemented cells (Figure 4H and G). However, compared with the corresponding results shown in Figure 1E and F, the cell apoptosis rates were significantly decreased in all cell groups (Figure 4F). These results revealed that silencing of AQP3 resulted in autophagy inhibition, which, in turn, has been implicated in the increase of AQP3 deficiency-induced cell apoptosis in GC cells.
Overexpression of AQP3 enhances cell viability by increasing cellular glycerol levels and autophagy in GC cells
AQP3 was overexpressed to further validate the results described above. After transfection, real-time PCR revealed that the AQP3 expression level was significantly higher in cells overexpressing AQP3 compared with control cells (Figure 5A). Evaluation of cell viability by the CCK-8 assay showed that the number of cells in the AQP3-overexpressing group was obviously higher than that in the control group. In both groups, cell viability was decreased following starvation for 48 h. Starvation followed by supplementation with glycerol significantly reversed the decrease in cell viability in both the AQP3-overexpressing and control groups (Figure 5B). Compared with control cells, the increase of glycerol levels in AQP3-overexpressing cells was remarkable. Supplementation with glycerol further increased cellular glycerol levels in both groups (Figure 5C). The expression levels of LC3 and P62 were detected by western blot to assess the effect of AQP3 overexpression on autophagy. As shown in Figure 5D and E, LC3 expression was obviously upregulated in AQP3-overexpressing cells compared with the control cells and further increased in both groups after supplementation with glycerol. By contrast, P62 expression was significantly lower in AQP3-overexpressing cells than in control cells, and glycerol supplementation further decreased the P62 expression level in both groups.
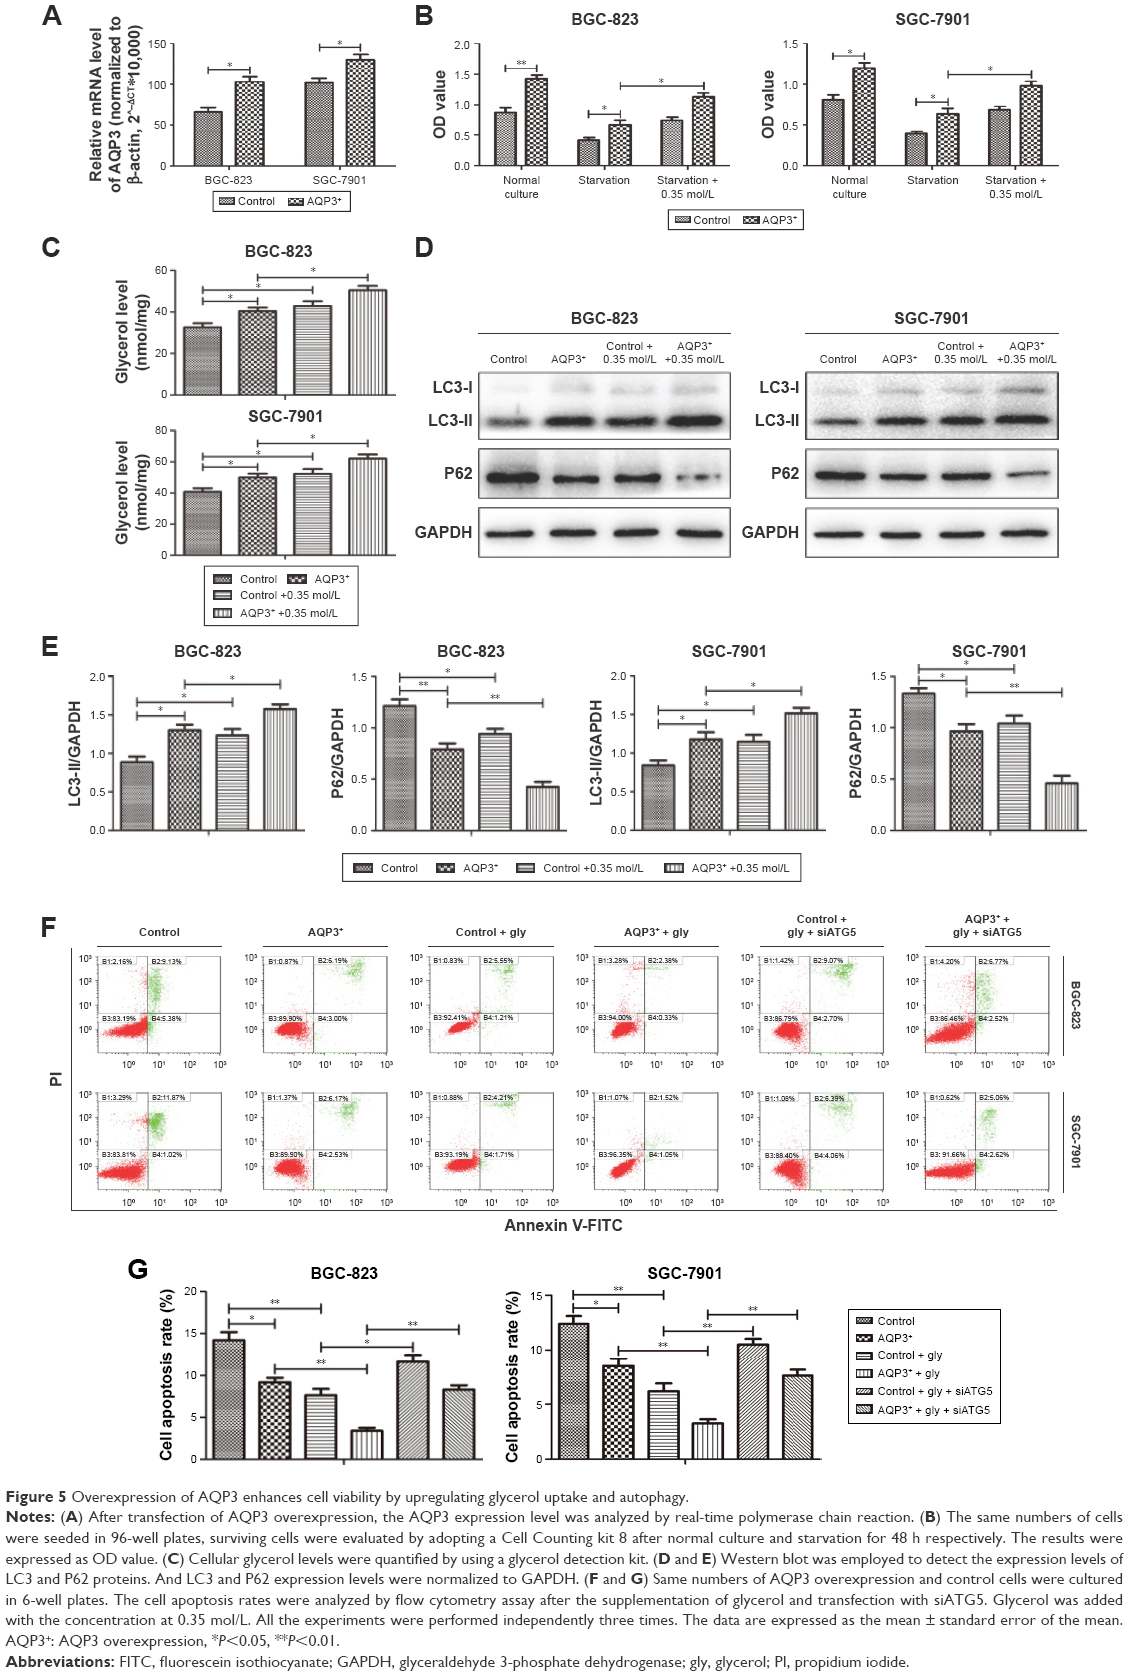 | Figure 5 Overexpression of AQP3 enhances cell viability by upregulating glycerol uptake and autophagy. |
The role of autophagy in regulating AQP3-related cell apoptosis was further validated by flow cytometry. Knockdown of ATG5, an autophagy-specific gene, can inhibit autophagy.27 An interference sequence of ATG5 was used to regulate cell autophagy. The apoptosis rate of AQP3-overexpressing cells was obviously lower than that of control cells, and cell apoptosis rates decreased significantly in both groups upon glycerol supplementation. By contrast, transfection of siATG5, which inhibits cell autophagy, resulted in remarkable increases in the cell apoptosis rates in both groups (Figure 5F and G). Thus, overexpression of AQP3 enhanced cell viability by upregulating cellular glycerol levels and downstream autophagy.
Discussion
Despite developments in the treatment of GC, a common and lethal malignancy, prognosis remains frustratingly poor.1,2 Novel and effective therapeutic targets must be identified to enhance the clinical therapy of GC. We previously demonstrated that upregulation of AQP3 expression contributes to the proliferative activity of GC cells.3 AQP3 expression has also been implicated in the regulation of cell apoptosis.35,36 But the association between AQP3 expression and cell apoptosis in GC has not been elucidated in detail. Therefore, the aim of our study was to illuminate the pathogenic mechanism of AQP3-related apoptosis in GC cells.
AQP3 can transport glycerol across the cytomembrane7 and is involved in the regulation of cell proliferation and migration in both normal and tumor tissues.2,10,37,38 Overexpression of AQP3 has been reported in diverse tumors, including GC,39 colorectal cancer,40 lung carcinoma41 and esophageal and oral squamous cell carcinoma.9 Consistent with results reported by Jiang et al,42 we observed that the expression level of AQP3 was significantly higher in human GC tissues compared with normal mucosal tissues, and positively associated with tumor size and lymph node metastasis. Glycerol is critical for the formation of lipids such as TAG, which is necessary for the division, proliferation, and survival of cancer cells.19 Consistent with our previous study,3 in this study, decreased AQP3 expression resulted in inhibition of lipogenesis due to impaired glycerol uptake, and this inhibition was ameliorated by the administration of exogenous glycerol.
Xie et al35 demonstrated that AQP3 contributes to the inhibition of cell apoptosis in normal human skin fibroblasts by upregulating the expression level of Bcl-2, an anti-apoptosis protein. Hou et al17 also reported that AQP3 knockdown clearly induces cell apoptosis in non-small cell lung cancer but failed to clarify the detailed pathogenic mechanism. We speculate that the pathogenesis of AQP3-associated cell apoptosis, which has rarely been investigated, is complicated. Our study confirms the role of AQP3 deficiency in inducing cell apoptosis via regulation of glycerol-mediated lipogenesis in GC cells in vitro and in vivo.
Autophagy is the main protein degradation pathway in eukaryotic cells and is responsible for eliminating impaired cellular structures, senescent organelles and unnecessary macromolecules, and for recycling cell segments for reuse.43 Some studies have shown that lipid rafts play an important role in initiating autophagy,32,44,45 and lipids are involved in the formation of lipid rafts.33 AQP3 has been implicated in the regulation of cell autophagy.23 Moon et al46 and Pan et al47 also demonstrated that inhibition of autophagy enhances apoptosis of GC cells. Similarly, in the present study, knockdown of AQP3 resulted in partial suppression of autophagy by retarding glycerol intake and lipid synthesis, and this autophagy inhibition contributed to the increase in the apoptosis rate of GC cells. Additionally, supplementation with rapamycin, an autophagy activator, reversed the increase in cell apoptosis induced by the AQP3 deficiency-mediated inhibition of autophagy, and knockdown of ATG5, an autophagy-related gene, increased cell apoptosis. By contrast, overexpression of AQP3 and glycerol supplementation inhibited cell apoptosis. While the detailed mechanism of AQP3-associated autophagy regulation remains to be further clarified, we speculate that lipid rafts, which are derived from glycerol and lipids, mediate the initiation of AQP3-related autophagy.
Conclusion
We have illuminated the role of AQP3 in cell apoptosis regulation as well as the related mechanism of AQP3-mediated cell apoptosis. We demonstrated that silencing of AQP3 impairs glycerol uptake and downstream lipogenesis and inhibits the initiation of autophagy, both of which contribute to increased apoptosis of GC cells. Thus, the role of AQP3 in cancer progression has been further validated. Furthermore, the AQP3-mediated glycerol and lipid metabolism pathways might represent novel and effective therapeutic targets for the treatment of GC.
Acknowledgments
This study was sponsored by the National Natural Science Foundation of People’s Republic of China (30901421), the National Natural Science Foundation Project of International Cooperation (NSFC-NIH, 812111519), the Natural Science Foundation of Jiangsu Province of People’s Republic of China (BK20141493), and the Program for Development of Innovative Research Team in the First Affiliated Hospital of Nanjing Medical University. We would like to thank Guangli Sun and Jianghao Xu for contributing to the revision of this manuscript.
Disclosure
The authors report no conflicts of interest in this work.
References
Torre LA, Bray F, Siegel RL, et al. Global cancer statistics, 2012. CA Cancer J Clin. 2015;65(2):87–108. | ||
Zhou Y, Wang Y, Wen J, et al. Aquaporin 3 promotes the stem-like properties of gastric cancer cells via Wnt/GSK-3β/β-catenin pathway. Oncotarget. 2016;7(13):16529–16541. | ||
Li Z, Li B, Zhang L, et al. The proliferation impairment induced by AQP3 deficiency is the result of glycerol uptake and metabolism inhibition in gastric cancer cells. Tumor Biol. 2016;37(7):9169–9179. | ||
Matsuzaki T, Tajika Y, Ablimit A, Aoki T, Hagiwara H, Takata K. Aquaporins in the digestive system. Med Electron Microsc. 2004;37(2):71–80. | ||
Larsen HS, Ruus AK, Galtung HK. Aquaporin expression patterns in the developing mouse salivary gland. Eur J Oral Sci. 2009;117(6): 655–662. | ||
Wang YH, Liu TT, Kung WM, et al. Expression of aquaporins in intestine after heat stroke. Int J Clin Exp Pathol. 2015;8(8):8742–8753. | ||
Laia TM, Sandra PT, Casado FJ, Míriam MA, Marçal PA. Aquaporin 3 (AQP3) participates in the cytotoxic response to nucleoside-derived drugs. BMC Cancer. 2012;12:434–443. | ||
Kobayashi K, Yasui M. Cellular and subcellular localization of aquaporins 1, 3, 8, and 9 in amniotic membranes during pregnancy in mice. Cell Tissue Res. 2010;342(2):307–316. | ||
Kusayama M, Wada K, Nagata M, et al. Critical role of aquaporin 3 on growth of human esophageal and oral squamous cell carcinoma. Cancer Sci. 2011;102(6):1128–1136. | ||
Hara-Chikuma M, Verkman AS. Aquaporin-3 facilitates epidermal cell migration and proliferation during wound healing. J Mol Med (Berl). 2008;86(2):221–231. | ||
Hara-Chikuma M, Watanabe S, Satooka H. Involvement of aquaporin-3 in epidermal growth factor receptor signaling via hydrogen peroxide transport in cancer cells. Biochem Biophys Res Commun. 2016;471(4):603–609. | ||
Thiagarajah JR, Chang J, Goettel JA, Verkman AS, Lencer WI. Aquaporin-3 mediates hydrogen peroxide-dependent responses to environmental stress in colonic epithelia. Proc Natl Acad Sci. 2017;114(3):568–573. | ||
Zhang W, Xu Y, Chen Z, Xu Z, Xu H. Knockdown of aquaporin 3 is involved in intestinal barrier integrity impairment. FEBS Lett. 2011;585(19):3113–3119. | ||
Xu H, Xu Y, Zhang W, Shen L, Yang L, Xu Z. Aquaporin-3 positively regulates matrix metalloproteinases via PI3K/AKT signal pathway in human gastric carcinoma SGC7901 cells. J Exp Clin Canc Res. 2011;30:86–91. | ||
Gao L, Gao Y, Li X, et al. Aquaporins mediate the chemoresistance of human melanoma cells to arsenite. Mol Oncol. 2012;6(1):81–87. | ||
Aure MH, Ruus AK, Galtung HK. Aquaporins in the adult mouse submandibular and sublingual salivary glands. J Mol Histol. 2014;45(1):69–80. | ||
Hou SY, Li YP, Wang JH, et al. Aquaporin-3 inhibition reduces the growth of NSCLC cells induced by hypoxia. Cell Physiol Biochem. 2016;38(1):129–140. | ||
Serna A, Galan-Cobo A, Rodrigues C, et al. Functional inhibition of aquaporin-3 with a gold-based compound induces blockage of cell proliferation. J Cell Physiol. 2014;229(11):1787–1801. | ||
Zheng H, Liu W, Anderson LY, Jiang QX. Lipid-dependent gating of a voltage-gated potassium channel. Nat Commun. 2011;2:250–258. | ||
Moreno-Sanchez R, Rodriguez-Enriquez S, Marin-Hernandez A, Saavedra E. Energy metabolism in tumor cells. FEBS J. 2007;274(6):1393–1418. | ||
Nye CK, Hanson RW, Kalhan SC. Glyceroneogenesis is the dominant pathway for triglyceride glycerol synthesis in vivo in the rat. J Biol Chem. 2008;283(41):27565–27574. | ||
Idahl LA, Lembert N. Glycerol 3-phosphate-induced ATP production in intact mitochondria from pancreatic B-cells. Biochem J. 1995;312(Pt 1):287–292. | ||
Dong X, Wang Y, Zhou Y, Wen J, Wang S, Shen L. Aquaporin 3 facilitates chemoresistance in gastric cancer cells to cisplatin via autophagy. Cell Death Discov. 2016;2:16087–16092. | ||
Liu J, Zhang Y, Qu J, et al. β-Elemene-induced autophagy protects human gastric cancer cells from undergoing apoptosis. BMC Cancer. 2011;11:183–192. | ||
Pan WR, Chen YL, Hsu HC, Chen WJ. Antimicrobial peptide GW-H1-induced apoptosis of human gastric cancer AGS cell line is enhanced by suppression of autophagy. Mol Cell Biochem. 2015;400(1–2):77–86. | ||
Fan T, Chen L, Huang Z, et al. Autophagy activation by rapamycin before hypoxia-reoxygenation reduces endoplasmic reticulum stress in alveolar epithelial cells. Cell Physiol Biochem. 2017;41(1):79–90. | ||
Kim M, Sandford E, Gatica D, et al. Mutation in ATG5 reduces autophagy and leads to ataxia with developmental delay. Elife. 2016;5:12245–12262. | ||
Huangfu L, Liang H, Wang G, et al. miR-183 regulates autophagy and apoptosis in colorectal cancer through targeting of UVRAG. Oncotarget. 2015;7(4):4735–4745. | ||
Kosuga M, Henderson-MacLennan NK, Zhang YH, Huang BL, Dipple KM, McCabe ER. Glycerol homeostasis and metabolism in glycerol kinase carrier mice. Mol Genet Metab. 2011;103(3):297–299. | ||
Verkman AS, Mitra AK. Structure and function of aquaporin water channels. Am J Physiol Renal Physiol. 2000;278(1):F13–F28. | ||
Lass A, Zimmermann R, Oberer M, Zechner R. Lipolysis – a highly regulated multi-enzyme complex mediates the catabolism of cellular fat stores. Prog Lipid Res. 2011;50(1):14–27. | ||
Ren T, Takahashi Y, Liu X, et al. HTLV-1 Tax deregulates autophagy by recruiting autophagic molecules into lipid raft microdomains. Oncogene. 2013;34(3):334–345. | ||
Brandstaetter H, Kishi-Itakura C, Tumbarello DA, Manstein DJ, Buss F. Loss of functional MYO1C/myosin 1c, a motor protein involved in lipid raft trafficking, disrupts autophagosome-lysosome fusion. Autophagy. 2014;10(12):2310–2323. | ||
Mowers EE, Sharifi MN, Macleod KF. Novel insights into how autophagy regulates tumor cell motility. Autophagy. 2016;12(9):1679–1680. | ||
Xie H, Liu F, Liu L, et al. Protective role of AQP3 in UVA-induced NHSFs apoptosis via Bcl2 up-regulation. Arch Dermatol Res. 2013;305(5):397–406. | ||
Szpilbarg N, Castro-Parodi M, Reppetti J, et al. Placental programmed cell death: insights into the role of aquaporins. Mol Hum Reprod. 2016;22(1):46–56. | ||
Nakahigashi K, Kabashima K, Ikoma A, Verkman AS, Miyachi Y, Hara-Chikuma M. Upregulation of aquaporin-3 is involved in keratinocyte proliferation and epidermal hyperplasia. J Invest Dermatol. 2011;131(4):865–873. | ||
Galan-Cobo A, Ramirez-Lorca R, Serna A, Echevarria M. Overexpression of AQP3 modifies the cell cycle and the proliferation rate of mammalian cells in culture. PLoS One. 2015;10(9):137692–137707. | ||
Huang Y, Zhu Z, Sun M, et al. Critical role of aquaporin-3 in the human epidermal growth factor-induced migration and proliferation in the human gastric adenocarcinoma cells. Cancer Biol Ther. 2014;9(12):1000–1007. | ||
Moon C, Soria JC, Jang SJ, et al. Involvement of aquaporins in colorectal carcinogenesis. Oncogene. 2003;22(43):6699–6703. | ||
Liu YL, Matsuzaki T, Nakazawa T, et al. Expression of aquaporin 3 (AQP3) in normal and neoplastic lung tissues. Hum Pathol. 2007;38(1):171–178. | ||
Jiang B, Li Z, Zhang W, et al. miR-874 Inhibits cell proliferation, migration and invasion through targeting aquaporin-3 in gastric cancer. J Gastroenterol. 2014;49(6):1011–1025. | ||
Xu L, Qu XJ, Liu YP, et al. Protective autophagy antagonizes oxaliplatin-induced apoptosis in gastric cancer cells. Chin J Cancer. 2011;30(7):490–496. | ||
Vollrath JT, Sechi A, Dreser A, et al. Loss of function of the ALS protein SigR1 leads to ER pathology associated with defective autophagy and lipid raft disturbances. Cell Death Dis. 2014;5:1290–1302. | ||
Yue HW, Liu J, Liu PP, et al. Sphingosylphosphorylcholine protects cardiomyocytes against ischemic apoptosis via lipid raft/PTEN/Akt1/mTOR mediated autophagy. Biochim Biophys Acta. 2015;1851(9):1186–1193. | ||
Moon JY, Cho SK. Nobiletin induces protective autophagy accompanied by ER-stress mediated apoptosis in human gastric cancer SNU-16 cells. Molecules. 2016;21(7):914–926. | ||
Pan WR, Chen PW, Chen YL, Hsu HC, Lin CC, Chen WJ. Bovine lactoferricin B induces apoptosis of human gastric cancer cell line AGS by inhibition of autophagy at a late stage. J Dairy Sci. 2013;96(12):7511–7520. |
 © 2017 The Author(s). This work is published and licensed by Dove Medical Press Limited. The full terms of this license are available at https://www.dovepress.com/terms.php and incorporate the Creative Commons Attribution - Non Commercial (unported, v3.0) License.
By accessing the work you hereby accept the Terms. Non-commercial uses of the work are permitted without any further permission from Dove Medical Press Limited, provided the work is properly attributed. For permission for commercial use of this work, please see paragraphs 4.2 and 5 of our Terms.
© 2017 The Author(s). This work is published and licensed by Dove Medical Press Limited. The full terms of this license are available at https://www.dovepress.com/terms.php and incorporate the Creative Commons Attribution - Non Commercial (unported, v3.0) License.
By accessing the work you hereby accept the Terms. Non-commercial uses of the work are permitted without any further permission from Dove Medical Press Limited, provided the work is properly attributed. For permission for commercial use of this work, please see paragraphs 4.2 and 5 of our Terms.