")
Back to Journals » Clinical Ophthalmology » Volume 9
Significance of the disc damage likelihood scale objectively measured by a non-mydriatic fundus camera in preperimetric glaucoma
Authors Pahlitzsch M, Torun N, Erb C, Bruenner J, Maier A, Gonnermann J, Bertelmann E, Klamann M
Received 27 July 2015
Accepted for publication 31 August 2015
Published 20 November 2015 Volume 2015:9 Pages 2147—2158
DOI https://doi.org/10.2147/OPTH.S93213
Checked for plagiarism Yes
Review by Single anonymous peer review
Peer reviewer comments 2
Editor who approved publication: Dr Scott Fraser
Milena Pahlitzsch,1 Necip Torun,1 Carl Erb,2 Jeanette Bruenner,1 Anna Karina B Maier,1 Johannes Gonnermann,1 Eckart Bertelmann,1 Matthias K J Klamann1
1Department of Ophthalmology, University Medicine Charité, Campus Virchow Clinic, Berlin, 2Augenklinik am Wittenbergplatz, Berlin, Germany
Purpose: To assess the correlation between the disc damage likelihood scale (DDLS) objectively measured by a non-mydriatic fundus camera, Heidelberg Retina Tomograph 3, and optic coherence tomography in preperimetric glaucoma.
Methods: One-hundred-twenty-five patients with preperimetric primary open-angle glaucoma (POAG) and pseudoexfoliation glaucoma (n=30) were included (mean age 58.9±15.9 years). All three devices graded the optic disc topography: Diagnosis 1 was defined as “outside normal limits”, while Diagnosis 2 as “borderline or outside normal limits”.
Results: For Diagnosis 1, a significant correlation was shown between DDLS and Moorfields regression analysis (P=0.022), and for Diagnosis 2 with glaucoma probability score analysis (P=0.024), in POAG. In pseudoexfoliation glaucoma, DDLS did not correlate significantly with Heidelberg Retina Tomograph 3 and optic coherence tomography. Regarding the area under the curve the highest predictive power was demonstrated by the objective DDLS (0.513–0.824) compared to Burk (0.239–0.343) and Mikelberg (0.093–0.270) coefficients.
Conclusions: The DDLS showed a significant correlation to the Moorfields regression analysis in preperimetric POAG. The objective DDLS showed the highest predictive power and thus is an additive tool in diagnosing preperimetric glaucoma.
Keywords: DDLS, preperimetric glaucoma, optic coherence tomography, stereophotography, Heidelberg Retina Tomograph
Introduction
To distinguish between preperimetric glaucoma and a variant of the standard optic nerve head (ONH) morphology is probably one of the most difficult decisions in glaucoma diagnostics.1,2 Therefore, further study to find the most accurate parameters for early detection and diagnosis of preperimetric glaucoma is needed.
Many patients show distinctive structural before detectable changes of the ONH in the automated perimetry.1 Furthermore, pathohistological findings have indicated that a large number of retinal ganglion cells need to be damaged before a noticeable abnormality is apparent on standard automated perimetry.3–5 In the early stages of glaucoma the standard automated perimetry is likely to underestimate the impact that the damage will have on the ONH.1,6 Other devices have been developed in order to detect glaucomatous visual field (VF) changes during these early stages.7,8 Frequency-doubling technology, short-wavelength automated perimetry, and flicker-defined form perimetry are tests that specifically target the visual function, such as movement perception, contrast sensitivity, and color vision.7,8 However, the earliest detectable manifestation of glaucoma seems to be the structural abnormality of the ONH and retinal nerve fiber layer (RNFL).9 The risk of progression in preperimetric glaucoma increases with the appearance of disc hemorrhage and insufficient intraocular pressure (IOP) control.2 These results strengthen the importance of lowering IOP, already at a preperimetric stage of disease.2 Structural changes were generally assessed by funduscopy and optic disc (OD) photography.1,9
However, due to the large variations in the normal disc appearance, diagnostic difficulties may occur.1 The classification of the cup/disc ratio (CDR) was developed by Armaly for describing the ONH in 1967.10,11 The influence of the OD size or focal changes of the neuroretinal rim were not taken into account by the CDR.12 Large discs have larger CDRs (but may have normal neuroretinal rims) and therefore were more likely to be classified as glaucomatous.12 Whereas smaller CDRs were more likely to be classified as normal, they also could already show glaucomatous damage to the ONH.12 The disc damage likelihood scale (DDLS) was enunciated by Spaeth et al to integrate the disc size and focal rim width into a clinical grading chart in 2002.13 DDLS showed a high interobserver reproducibility.13
Diagnostic procedures like the Heidelberg Retina Tomograph 3 (HRT3) (Heidelberg Engineering GmBHa, Heidelberg, Germany), spectral domain optic coherence tomography (SD-OCT) (Carl Zeiss Meditec AG, Jena, Germany), and stereo photography were developed to objectively evaluate the ONH. The aim of this study was to assess the correlation of the RNFL (SD-OCT), coefficients of the HRT3, and the DDLS in preperimetric glaucoma. In this study, the DDLS was objectively measured by the KOWA nonmyd WX 3D fundus camera (2D/3D Nonmydriatic Retinal Camera; Kowa Company Ltd., Tokyo, Japan).
Methods
This study was designed as a prospective study with the agreement of the Ethical Committee of the Charité – Universitätsmedizin Berlin. The criteria of the Declaration of Helsinki were fulfilled. A total of 155 patients (female 55.1%, male 44.9%, mean age 58.9±15.9 years) were categorized based on their diagnosis of primary open-angle glaucoma (POAG) and pseudoexfoliation (PEX) glaucoma. This study analyzed data from 125 POAG patients (n=67 female [53.6%], n=58 males [46.4%]) and 30 pseudoexfoliation glaucoma patients (n=21 females [70%], n=9 males [30%]).
All patients demonstrated glaucomatous OD alterations and an open chamber angle in the gonioscopy. Inclusion criteria were best-corrected visual acuity of at least 20/200 (6/60), reliable VF testing, mean deviation in dB, pattern standard deviation ±4 dpt, and informed patient consent. Patients with higher spherical errors (>5 dpt), higher astigmatism (>2.5 dpt), contact lenses, hazy optic media interfering with fundus examination, ocular trauma, and patients who underwent intraocular surgery <3 months before the study, were excluded.
All patients were measured by the KOWA nonmyd WX 3D fundus camera, the HRT3, and OCT by one examiner on the same day. The correlation of the CDR between KOWA, HRT3, and Funduscopy was analyzed in POAG and PEX glaucoma.
All three devices graded the OD topography related to the predictability for glaucomatous damage. The study population was therefore split into two groups: Diagnosis 1 “outside normal limits” and Diagnosis 2 “borderline and outside normal limits”.
KOWA nonmyd WX 3D fundus camera
The KOWA nonmyd WX 3D fundus camera simultaneously recorded two images (stereometric) of the OD, which were at an angle of 34° to each other. The pupil diameter should not fall below a minimum diameter of 4 mm. Due to the different shooting angles, a horizontal shift of the pixels (1,600×1,600 pixels) was obtained, which was highly reproducible. Based on the correlation coefficient of the red, green, and blue channel images, the corresponding pixels of the two captured images could be identified, and the disparity was calculated. This correlated with the depth of the image and was specified via an algorithm.
The retina was chosen as a reference plane, which was defined by a horizontal line through the center of the papilla.
Common stereometric parameters could be obtained according to the HRT3 outcome, identifying most of the following: disc area, rim volume, cup volume, disc volume, vertical CDR, cup/disc area ratio, rim/disc area ratio, and height variation contour. In this study, we concentrated on a few items (vertical CDR, disc area, and cup volume) used in other comparative studies.14–16 Further, the rim/disc ratio was objectively quantified in the six quadrants of the ONH.
SD-OCT
Optical coherence tomography represents an optical signal acquisition method. It captures micrometer-resolution, three-dimensional images from optical scattering media. OCT is an interferometric technique using near-infrared light and a long wavelength spectrum, which will make it possible to penetrate into the scattering medium. The OCT RNFL thickness analysis was performed by fast RNFL map protocols using an internal fixation target.17,18 Only high quality scans without eye movement were included.
HRT3
The HRT3 technology is established on the confocal laser scanning ophthalmoscopy technique. The HRT3 displayed high-resolution optical images with depth selectivity, allowing the acquisition of in-focus images from different selected depths. Images are built up point-by-point and reconstructed with a software program to allow the 3D formation of the objects. Moorfields regression analysis (MRA), glaucoma probability scores (GPS), and stereometric parameters were evaluated. Furthermore, the Burk (RB) and Mikelberg (FSM) coefficients were analyzed and correlated to the DDLS. The FSM coefficient is defined as function F = (rim volume ×1.95) + (height variation contour ×30.12) − (corrected cup shape ×28.52) −10.18, where the corrected cup shape = cup shape + (0.0019× [50 − age]).19 The RB coefficient is defined as function F =4.197× (contour line height difference temporal − temporal superior) + (5.642× contour line height difference temporal − temporal inferior) − (3.885× temporal superior cup shape measure) −0.974.20 The MRA is defined as rim area =1.021+0.443× disc area −0.006× age.21
DDLS
This scale incorporates the size of the disc and the radial width of the neuroretinal rim in evaluating the ONH (Figure 1). The system categorized the ONH as small (<1.5 mm), medium (1.5–2.0 mm), or large (>2.0 mm).13 This could help to reduce the misclassification bias based on the disc size.22,23 In this study, the DDLS was objectively measured by the KOWA nonmyd WX 3D.
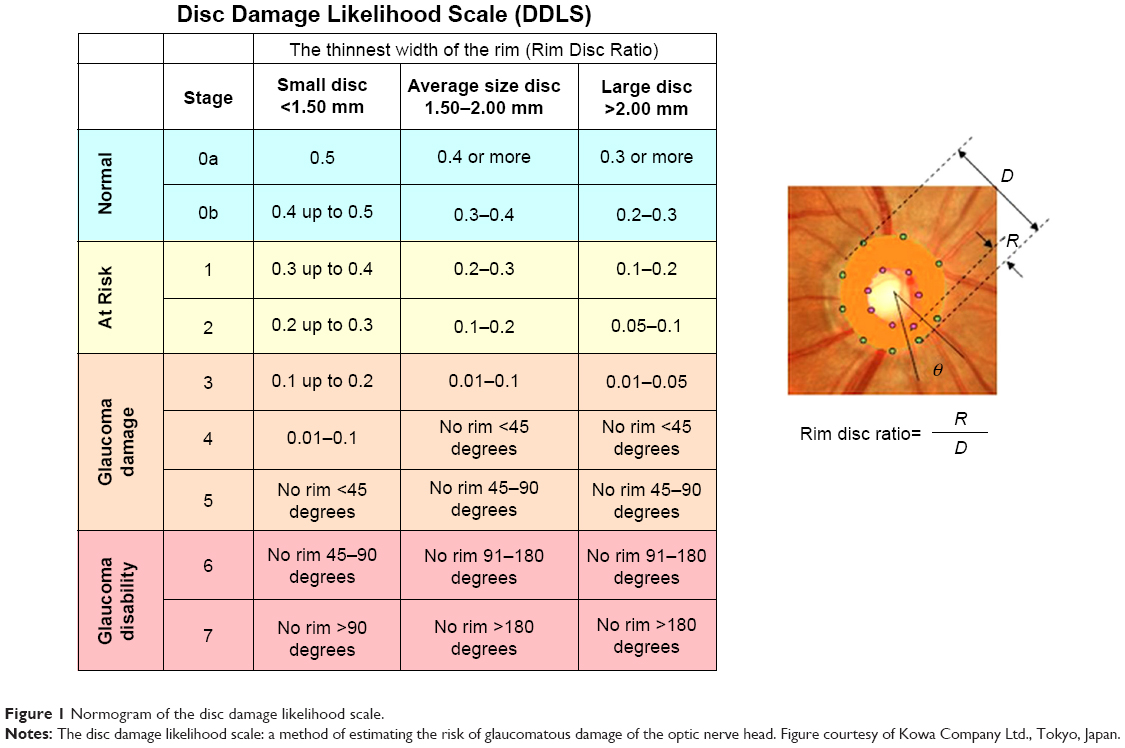 | Figure 1 Normogram of the disc damage likelihood scale. |
Statistical analysis
Statistical data were calculated using Statistical Package for the Social Sciences (SPSS) version 20.0 (IBM Corporation, Armonk, NY, USA). Linear regression analysis and descriptive statistics (mean, standard deviation, 95% limits of agreement, and correlation quotients) were processed. The relationship between DDLS, HRT3 parameters, and OCT RNFL was analyzed with a χ2-test. The area under the curve ROC was used to identify useful parameters to detect glaucomatous damage. A P-value <0.05 indicated a statistically significant difference.
Results
Data from 125 POAG and 30 PEX glaucoma patients were analyzed. The mean disc area as measured by HRT3 was 2.21±0.46 mm2, and the mean disc area of the KOWA was 2.80±0.55 mm2 in POAG patients (P<0.001, Table 1). The mean disc area of the HRT3 was 2.31±0.5 mm2, whereas the mean disc area of the KOWA camera was 2.66±0.62 mm2 in PEX glaucoma patients (P=0.004, Table 1).
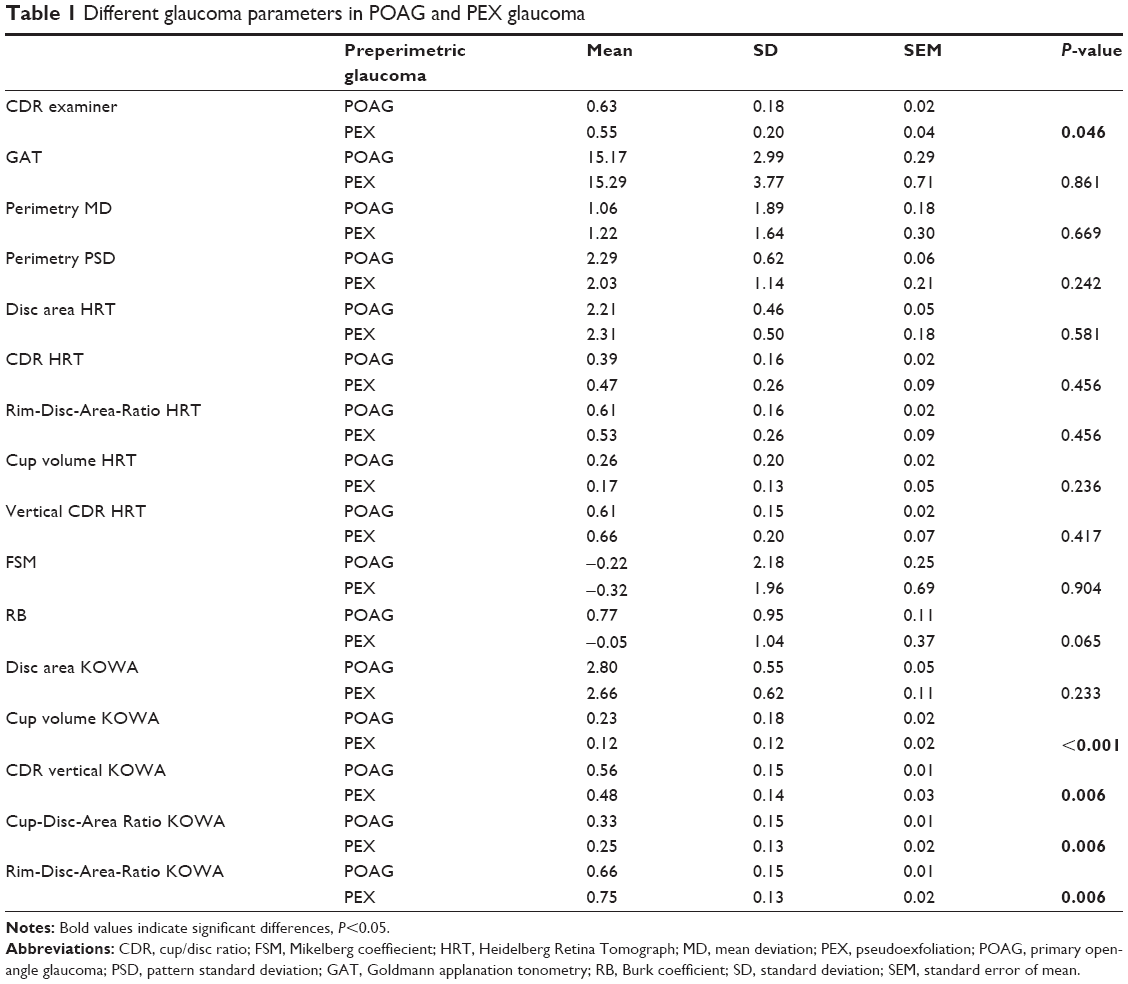 | Table 1 Different glaucoma parameters in POAG and PEX glaucoma |
Analysis of the cup volume by HRT3 was 0.26±0.2 mm2, and the mean cup volume of the KOWA was 0.23±0.18 mm2 in POAG patients (P<0.001, Table 1). The mean cup volume of the HRT3 was 0.17±0.13 mm2, whereas the mean cup volume of the KOWA camera was 0.12±0.12 mm2 in PEX glaucoma patients (P=0.153, Table 1).
The correlation of the KOWA rim/disc ratio compared to RNFL, MRA, and GPS in the six quadrants of the ONH in preperimetric POAG and PEX glaucoma is displayed in Table 2.
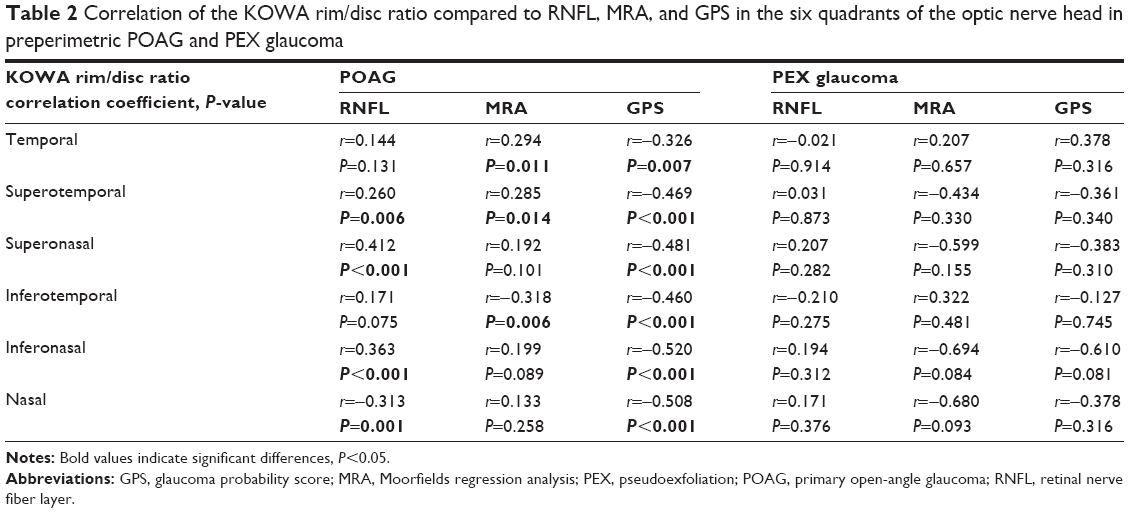 | Table 2 Correlation of the KOWA rim/disc ratio compared to RNFL, MRA, and GPS in the six quadrants of the optic nerve head in preperimetric POAG and PEX glaucoma |
Correlation of the CDR between KOWA, HRT3, and funduscopy in POAG patients
The CDR of the KOWA compared to CDR by HRT3 (r=0.641, P<0.001) and to the CDR of the funduscopic examiner (r=0.578, P=0.001) showed a good, statistically significant correlation. However, the CDR of the HRT3 compared to the CDR of the funduscopic examiner showed a poor correlation (r=0.390, P=0.001).
Correlation of the CDR between KOWA, HRT3, and funduscopy in PEX glaucoma patients
The CDR of the KOWA and the CDR of the funduscopic examiner compared to CDR by HRT3 did not show a statistically significant correlation (r=−0.029, P=0.950; r=−0.310, P=0.455), additionally the CDR of the KOWA compared to the CDR of the examiner (r=0.369, P=0.084).
Glaucoma diagnostic analysis in POAG patients
Diagnosis 1 (outside normal limits) as displayed in Figure 2, the DDLS showed a significant correlation with MRA (P=0.022), whereas the GPS analysis (P=0.624) and the RNFL (P=0.329) did not show a significant correlation.
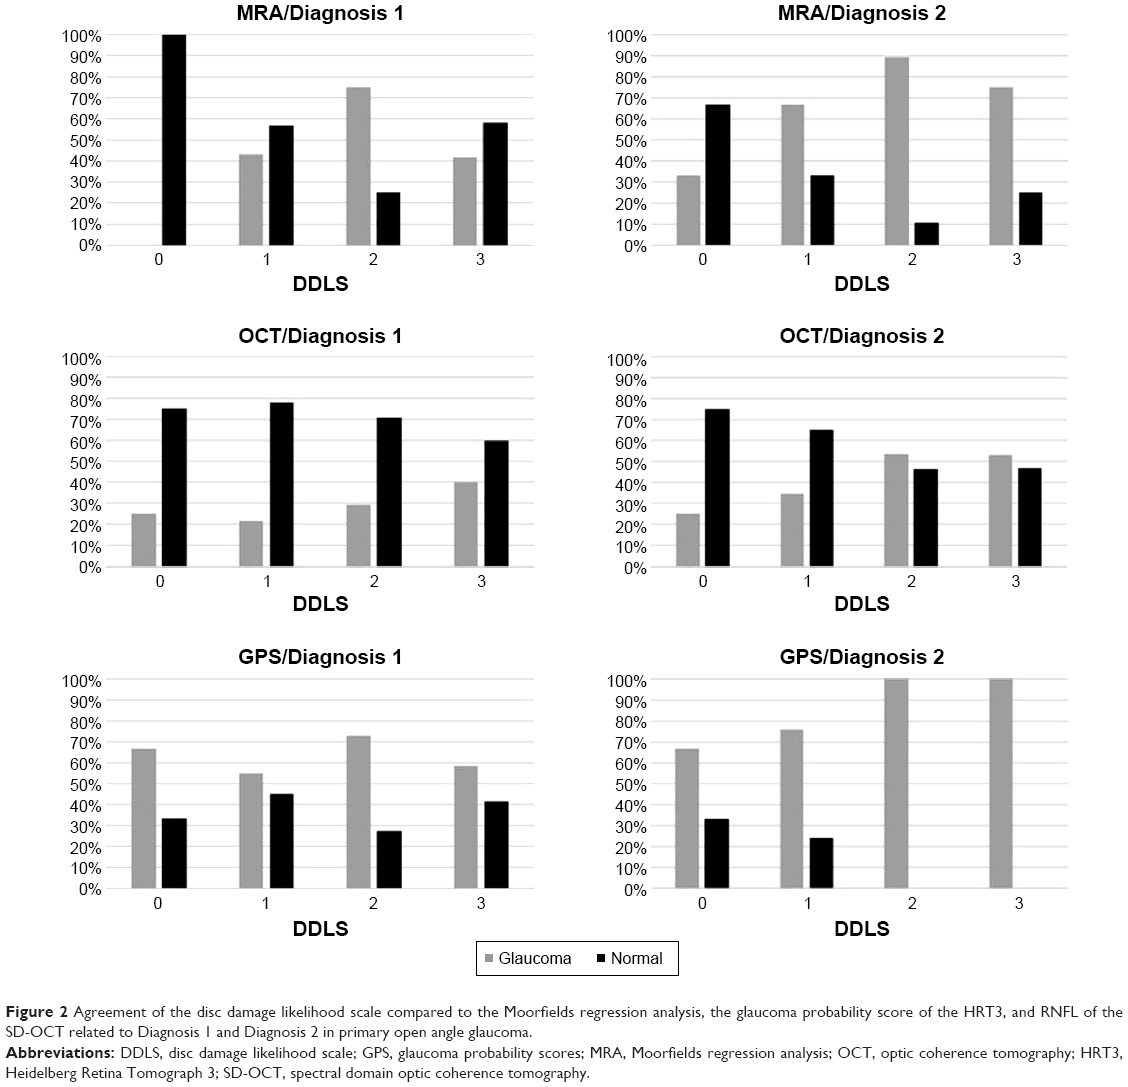 | Figure 2 Agreement of the disc damage likelihood scale compared to the Moorfields regression analysis, the glaucoma probability score of the HRT3, and RNFL of the SD-OCT related to Diagnosis 1 and Diagnosis 2 in primary open angle glaucoma. |
Diagnosis 2 (borderline or outside normal limits) as displayed in Figure 2, the DDLS showed a significant correlation with the GPS analysis (P=0.024), while the MRA (P=0.117) and RNFL (P=0.191) did not correlate significantly.
RB and FSM coeffiecients showed the correlation between DDLS 0–4 and the RB (P=0.481) and FSM coefficients (P=0.071) did not reach statistical significance.
Glaucoma diagnostic analysis in PEX glaucoma patients
Diagnosis 1 (outside normal limits) as displayed in Figure 3, the DDLS did not show a significant correlation with MRA (P=0.140), GPS analysis (P=0.165), or RNFL (P=0.644).
 | Figure 3 Agreement of the disc damage likelihood scale compared to the Moorfields regression analysis, the glaucoma probability score of the HRT3 and RNFL of the SD-OCT related to Diagnosis 1 and Diagnosis 2 in PEX glaucoma. |
Diagnosis 2 (borderline or outside normal limits) as displayed in Figure 3, the DDLS did not correlate significantly with MRA (P=0.190), GPS analysis (P=0.234), or RNFL (P=0.814).
RB and FSM coefficients showed no significant correlation between DDLS Grading 0–4 and the RB (P=0.337) and FSM coefficients (P=0.589).
Using the area under the curve (ROC) comparing RB and FSM coefficient and DDLS for Diagnosis 1+2, the DDLS (0.513–0.824) had the best predictive power in in comparison to HRT3 and OCT in the complete preperimetric cohort (Table 3, Figures 4 and 5). The two glaucoma coefficients (RB 0.239–0.343 and FSM 0.093–0.270) did not show superiority in all ROC areas (Table 3, Figures 4 and 5).
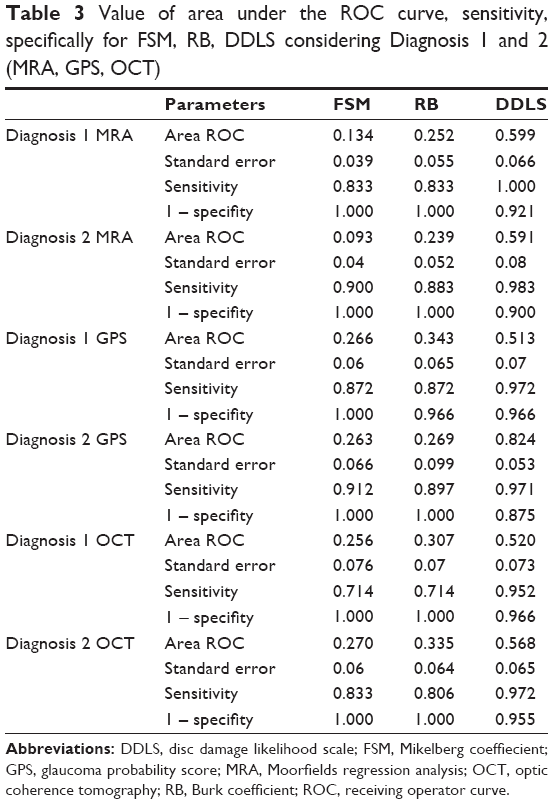 | Table 3 Value of area under the ROC curve, sensitivity, specifically for FSM, RB, DDLS considering Diagnosis 1 and 2 (MRA, GPS, OCT) |
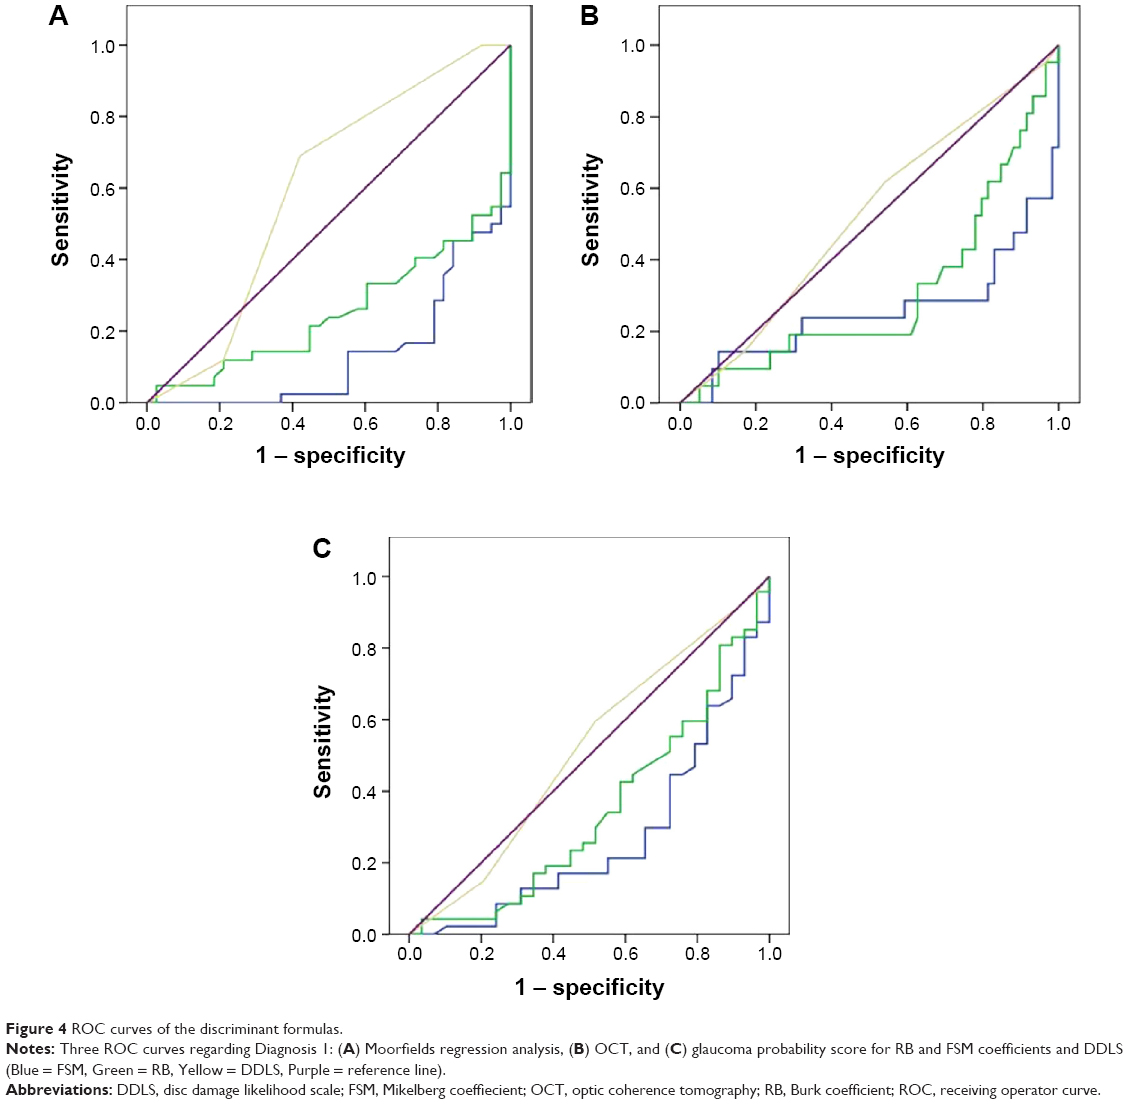 | Figure 4 ROC curves of the discriminant formulas. |
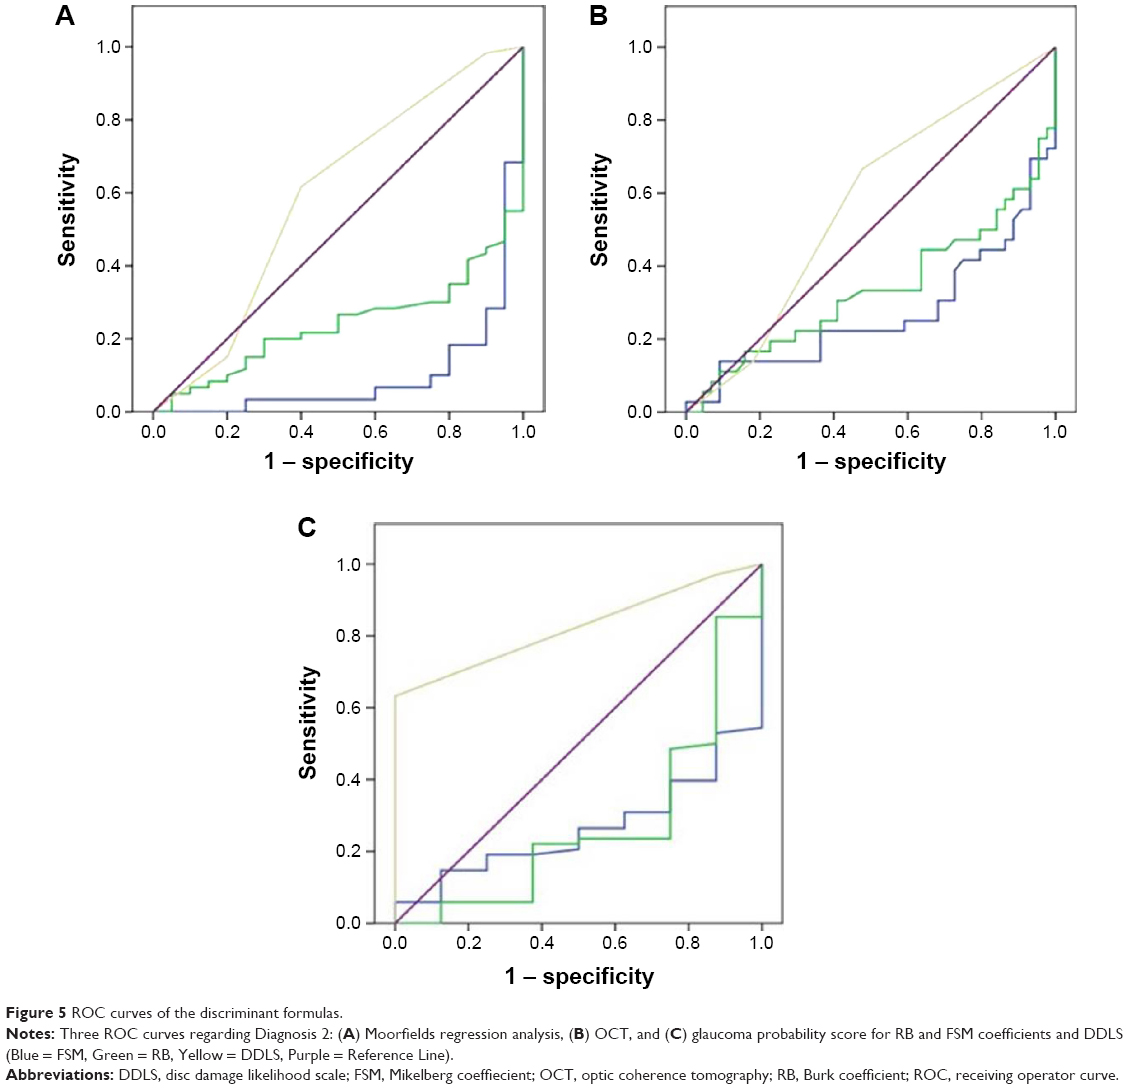 | Figure 5 ROC curves of the discriminant formulas. |
Discussion
Findings of recent studies showed that the loss of RNFL is one of the earliest clinical factors in the glaucoma disease.6,24 It is reported that RNFL loss is existing in the majority of glaucoma patients before any detectable VF defects.6,24 Red free fundus photography is currently entitled as the gold standard for RNFL analysis.25 Other objective devices available for RNFL evaluation were the scanning laser polarimetry and OCT.26–29 Deleon-Ortega et al stated that similar diagnostic efficiency was found for all objective imaging techniques (HRT II, scanning laser polarimetry, and OCT), however no superiority was observed compared to the subjective assessment of the ONH stereophotography.30 Andersson et al findings suggest that the sensitivity of MRA is superior to that of the average physician, but not including glaucoma experts.31 However, Pablo et al showed that the diagnostic accuracy for differentiating normal eyes from those with early VF defects was similar between clinical evaluation of the OD and evaluation with the HRT3.32
Horn et al stated that the combining function and morphology in the frequency-doubling technology perimetry and the SD-OCT performed as well as/or better than each single examination in detecting early glaucoma.33 Another method to evaluate the ONH is the DDLS, which was formerly measured by using a slit lamp. The DDLS is an useful diagnostic parameter in glaucoma patients and was closely correlated to the perimetry, CDR, and OCT parameters.34
The DDLS can be objectively analyzed by the KOWA fundus camera. This study presented the first objectively measured DDLS in preperimetric glaucoma.
Stereometric parameters
In this study, we found a statistically significant difference in the disc area evaluation of the KOWA camera compared to the HRT3 in both glaucoma cohorts. Januschowsky et al found in normal and glaucomatous eyes a significant mean difference in the disc area of 0.33 mm.14 In contrast, we found a larger difference of 0.59 mm2 and 0.35 mm2 in preperimetric POAG (P>0.001) and PEX glaucoma (P=0.004, Table 1). The explanation for the difference between both techniques may potentially be the ocular magnification factor, which is different between the KOWA fundus camera and the HRT3. However, a standard protocol of the KOWA fundus camera is not available and needs to be presented by the KOWA company in the future. As shown in Table 1, the analysis of the cup volume between HRT3 and KOWA showed similar results in preperimetric POAG and PEX glaucoma patients (mean difference 0.03 mm3, P<0.001; and 0.05 mm3, P=0.153). Additionally, Januschowsky et al found a difference of the cup volume of 0.03 mm3 in normal eyes and −0.03 mm3 in glaucomatous eyes.14
The rim/disc ratio of the KOWA fundus camera correlated well to the RNFL in the superotemporal, superonasal, inferonasal, and nasal quadrants of the ONH in preperimetric POAG (Table 2).
Compared to the MRA, the supero-, infero- and temporal sectors correlated significantly to the KOWA fundus camera. Rao et al reported that more preperimetric glaucomatous RNFL defects were seen in the superior quadrant than in the inferior quadrant.27 Additionally, the GPS correlated significantly to the rim/disc ratio of the KOWA fundus camera in all six quadrants of the ONH (Table 2).
The correlation of the rim/disc ratio of the KOWA fundus camera compared to HRT3 and SD-OCT in PEX glaucoma did not demonstrate a statistical significance in any of the six sectors of the ONH. Whether these results are due to the distinctive features of the PEX glaucoma remains subject of future studies.
The CDR of the KOWA fundus camera compared to the CDR as measured by HRT3 (r=0.641, P<0.001) and to the CDR of the funduscopic examiner (r=0.578, P=0.001) showed a good, statistically significant correlation in POAG, whereas the CDR of the HRT3 compared to the CDR of the funduscopic examiner showed a poor correlation (r=0.390, P=0.001) in POAG. Following these results, the CDR of the KOWA might be considered comparable to the subjective CDR of a glaucoma specialist. In contrast, the subjective and objective analysis did not show any significant correlation in PEX glaucoma. Thus, in PEX glaucoma the three subjective and objective techniques cannot be used interchangeably.
Glaucoma diagnostics
Referring to Diagnosis 1 in POAG, the DDLS showed a significant correlation with MRA (P=0.022). The GPS analysis and RNFL were not significantly associated (P>0.05). These results suggest that the three diagnostic techniques cannot be used interchangeably in preperimetric glaucoma, which is consistent with the findings of Iliev et al and Seymenoğlu et al.35,36
In addition to our study, Deleon-Ortega et al demonstrated that the agreement of disease classification with subjective and objective imaging ONH assessment increased when evaluating the ONH topography in contrast to methods analyzing the RNFL parameters.30 Referring to Diagnosis 2, the DDLS score showed a significant correlation with the GPS (P=0.024). One important factor limiting the MRA is the dependence on the position of the contour line, whereas the contour line independence of the GPS is, an important advantage and might be especially important in borderline results.37 The MRA classified more often the nasal inferior and temporal-inferior OD sectors of glaucoma patients as borderline or outside normal limits than other parts. However, no significant predominance was seen with the GPS analysis.37 The GPS scale within the six different sectors of the ONH were highly associated with each other and did not provide additional information to the global classification. 37 As we are following Coop’s results, our study did not analyze the DDLS to segmental data of the HRT3.37 When classifying borderline results, this correlation between the DDLS and the HRT3 should be considered.
The analysis of the DDLS to the RB and FSM coefficients were not significantly correlated between POAG and PEX glaucoma.
In PEX glaucoma, the DDLS score by KOWA fundus camera did not show a statistically significant correlation to the HRT and OCT, either in Diagnosis 1 or Diagnosis 2. Accordingly, the correlation between the DDLS and the RB and FSM coefficients did not show a statistical significance. This might be due to the different disease characteristics of the PEX glaucoma compared to POAG.38
High IOP levels, IOP fluctuations with marked diurnal periods, and rapid and intense damage of the ONH might explain problems in the neuro imaging process.38
Regarding the area under the ROC curve the highest predictive power was demonstrated by the objectively measured DDLS (0.513–0.824) in comparison to RB (0.239–0.343) and FSM (0.093–0.270) coefficients considering all devices in the complete preperimetric cohort (Table 3, Figures 4 and 5). An increase in this area was noticed when excluding the borderline results in the MRA in the complete preperimetric cohort. We could not find an increase considering the GPS and the OCT after borderline results were excluded. Abdul Majid et al stated the following results for the subjectively obtained DDLS: for the glaucoma versus the glaucoma suspect plus normal groups, the DDLS had the best predictive power (0.917), followed by corrected pattern standard deviation (0.895) and average RNFL thickness (0.864).34 Danesh-Meyer stated that the subjective DDLS had the best predictive power with an area under the curve of 0.95, when healthy controls were excluded.15 The clinical examination of CDR (0.84), and HRT-II MRA (0.68) showed lower predictive power values.15 Additionally, in another comparative study the largest area (74.4%) under the ROC curve was obtained by using the subjective DDLS compared to the vertical, horizontal, and maximum CDR.22 The values of the areas under the curve in the comparative studies are higher than our results, but in these studies a glaucoma disease including VF defects was subject of the study design. According to the known difficulties in diagnosing preperimetric glaucoma the objectively measured DDLS seems to be an effective additive tool.
Limitations of studies analyzing diagnostic tools may be found in the categorization of the test results as normal, borderline, or outside normal limits. However, these classifications do not take into account the pretest disease probability.1 Future software should include risk factors (such as IOP, disc hemorrhage, and cornea thickness) and clinical examination findings to improve diagnostic accuracy and reliability in early glaucoma.39 Likelihood ratios are meant to be the best way of integrating the results of diagnostic tests into clinical decisions.40 They can be used to determine whether a test result distinctively changes the probability of disease. For example, a larger likelihood ratio is leading to a greater increase in the likelihood of disease.40 As potential limitations of this study, the missing follow up control needs to be mentioned. Furthermore as described above, the magnification factor for the KOWA fundus camera is unknown and may lead to a deviation between the techniques being used.
To our knowledge, this is the first study comparing the KOWA fundus camera, HRT3, and SD-OCT in preperimetric glaucoma. In conclusion, this first objective analysis of DDLS by KOWA fundus camera showed a significant correlation compared to the MRA of the HRT3 in POAG patients.
In contrast, PEX glaucoma patients did not demonstrate a significant correlation of DDLS to OCT and HRT3, which might be due to the different disease characteristics.
In the complete preperimetric cohort the objectively measured DDLS showed the highest predictive power and thus is an additive tool in diagnosing preperimetric glaucoma. These three devices cannot be used interchangeably. As stereophotography is the gold standard in detecting structural changes before the incidence of VF loss, the KOWA camera might be a useful diagnostic tool.
Disclosure
The authors report no conflicts of interest in the work.
References
Tatham AJ, Weinreb RN, Medeiros FA. Strategies for improving early detection of glaucoma: the combined structure-function index. Clin Ophthalmol. 2014;8:611–621. | ||
Kim KE, Jeoung JW, Kim DM, Ahn SJ, Park KH, Kim SH. Long-term follow-up in preperimetric open-angle glaucoma: progression rates and associated factors. Am J Ophthalmol. 2015;159(1):160–168. | ||
Kerrigan-Baumrind LA, Quigley HA, Pease ME, Kerrigan DF, Mitchell RS. Number of ganglion cells in glaucoma eyes compared with threshold visual field tests in the same persons. Invest Ophthalmol Vis Sci. 2000;41(3):741–748. | ||
Harwerth RS, Carter-Dawson L, Smith EL 3rd, Barnes G, Holt WF, Crawford ML. Neural losses correlated with visual losses in clinical perimetry. Invest Ophthalmol Vis Sci. 2004;45(9):3152–3160. | ||
Quigley HA, Dunkelberger GR, Green WR. Retinal ganglion cell atrophy correlated with automated perimetry in human eyes with glaucoma. Am J Ophthalmol. 1989;107(5):453–464. | ||
Tuulonen A, Lehtola J, Airaksinen PJ. Nerve fiber layer defects with normal visual fields. Do normal optic disc and normal visual field indicate absence of glaucomatous abnormality? Ophthalmology. 1993; 100(5):587–598. | ||
Johnson CA, Adams AJ, Casson EJ, Brandt JD. Blue-on-yellow perimetry can predict the development of glaucomatous visual field loss. Arch Ophthalmol. 1993;111(5):645–650. | ||
Johnson CA, Samuels SJ. Screening for glaucomatous visual field loss with frequency-doubling perimetry. Invest Ophthalmol Vis Sci. 1997;38(2):413–425. | ||
Miglior S, Zeyen T, Pfeiffer N, Cunha-Vaz J, Torri V, Adamsons I. Results of the European Glaucoma Prevention Study. Ophthalmology. 2005;112(3):366–375. | ||
Armaly MF. Genetic determination of cup/disc ratio of the optic nerve. Arch Ophthalmol. 1967;78:35–43. | ||
Armaly MF, Sayegh RE. The cup-disc ratio. The findings of tonometry and tonography in the normal eye. Arch Ophthalmol. 1969;82: 191–196. | ||
Chandra A, Bandyopadhyay AK, Bhaduri G. A comparative study of two methods of optic disc evaluation in patients of glaucoma. Oman J Ophthalmol. 2013;6(2):103–107. | ||
Spaeth GL, Henderer J, Liu C, et al. The disc damage likelihood scale: Reproducibility of a new method of estimating the amount of optic nerve damage caused by glaucoma. Trans Am Ophthalmol Soc. 2002;100:181–185. | ||
Januschowski K, Blumenstock G, Rayford II CE, Bartz-Schmidt KU, Schiefer U, Ziemssen F. Stereometrische Parameter der Papillentopographie: Vergleich einer simultan-stereoskopischen Non-Mydriasis-Funduskamera (KOWA WX 3D) mit dem Heidelberg Retina Tomograph (HRT III) [Stereometric parameters of the optic disc. Comparison between a simultaneous non-mydriatic stereoscopic fundus camera (KOWA WX 3D) and the Heidelberg scanning laser ophthalmoscope (HRT IIII)]. Ophthalmologe. 2011;108(10):957–962. German. | ||
Danesh-Meyer HV, Gaskin BJ, Jayusundera T, Donaldson M, Gamble GD. Comparison of disc damage likelihood scale, cup to disc ratio, and Heidelberg retina tomograph in the diagnosis of glaucoma. Br J Ophthalmol. 2006;90(4):437–441. | ||
Danesh-Meyer HV, Ku JYF, Papchenko TL, Jayasundera T, Hsiang JC, Gamble GD. Regional correlation of structure and function in glaucoma, using the Disc Damage Likelihood Scale, Heidelberg Retina Tomograph, and visual fields. Ophthalmology. 2006;113:603–611. | ||
Budenz DL, Michael A, Chang RT, McSoley J, Katz J. Sensitivity and specificity of the Stratus OCT for perimetric glaucoma. Ophthalmology. 2005;112(1):3–9. | ||
Fercher AF, Hitzenberger CK, Drexler W, Kamp G, Sattmann H. In vivo optical coherence tomography. Am J Ophthalmol. 1993;116(1):113–114. | ||
Mikelberg FS, Parfitt CM, Swindale NV, et al. Ability of the Heidelberg retina tomograph to detect early glaucomatous visual field loss. J Glaucoma. 1995;4(4):242–247. | ||
Burk RO, Noack H, Rohrschneider K, Volcker HE. Prediction of glaucomatous visual field defects by reference plane independent three-dimensional optic nerve head parameters. In: Wall M, Wild JM eds. Perimetry Update 1998/1999: Proceedings of the XIIIth International Perimetric Society Meeting. Gardone Riviera (BS), Italy, September 6–9, 1998. The Hague, Netherlands. Kugler; 1999: 463–474. | ||
Wollstein G, Garway-Heath DF, Hitchings RA. Identification of early glaucoma cases with the scanning laser ophthalmoscope. Ophthalmology. 1998;105(8):1557–1563. | ||
Henderer JD, Liu C, Kesen M, et al. Reliability of the disk damage likelihood scale. Am J Ophthalmol. 2003;135:44–48. | ||
Bayer A, Harasymowycz P, Henderer JD, Steinmann WG, Spaeth GL. Validity of a new disk grading scale for estimating glaucomatous damage: Correlation with visual field damage. Am J Ophthalmol. 2002;133(6):758–763. | ||
Sommer A, Katz J, Quigley HA, et al. Clinically detectable nerve fiber atrophy precedes the onset of glaucomatous field loss. Arch Ophthalmol. 1991;109(1):77–83. | ||
Hoyt WF, Frisen L, Newman NM. Fundoscopy of nerve fiber layer defects in glaucoma. Invest Ophthalmol. 1973;12(11):814–829. | ||
Rao HL, Yadav RK, Addepalli UK, et al. Peripapillary retinal nerve fiber layer assessment of spectral domain optical coherence tomography and scanning laser polarimetry to diagnose preperimetric glaucoma. PLoS One. 2014;9(10):e108992. | ||
Rao HL, Addepalli UK, Yadav RK, Choudhari NS, Senthil S, Garudadri CS. Factors affecting the ability of the spectral domain optical coherence tomograph to detect photographic retinal nerve fiber layer defects. PLoS One. 2014;9(12):e116115. | ||
Burgoyne CF. Image analysis of optic nerve disease. Eye (Lond). 2004;18(11):1207–1213. | ||
Sánchez-Cano A, Baraibar B, Pablo LE, Honrubia F. Scanning laser polarimetry with variable corneal compensation to detect preperimetric glaucoma using logistic regression analysis. Ophthalmologica. 2009; 223(4):256–262. | ||
Deleon-Ortega JE, Arthir SN, McGwin G Jr, Xie A, Monheit BE, Girkin CA. Discrimination between glaucomatous and nonglaucomatous eyes using quantiative imaging devices and subjective optic nerve head assessment. Invest Opthalmol Vis Sci. 2006;47(8):3374–3380. | ||
Andersson S, HeijI A, Bengtsson B. Optic disc classification by the Heidelberg Retina Tomograph and by physicians with varying experience of glaucoma. Eye (Lond). 2011;25(11):1401–1407. | ||
Pablo LE, Ferreras A, Fogagnolo P, Figus M, Pajarin AB. Optic nerve head changes in early glaucoma: a comparison between stereophotography and Heidelberg retina tomography. Eye (Lond). 2010;24(1):123–130. | ||
Horn FK, Mardin CY, Bendschneider D, Jünemann AG, Adler W, Tornow RP. Frequency doubling technique perimetry and spectral domain optical coherence tomography in patients with early glaucoma. Eye (Lond). 2011;25(1):17–29. | ||
Abdul Majid AS, Kwag JH, Jung SH, Yim HB, Kim YD, Kang KD. Correlation between disc damage likelihood scale and optical coherence tomography in the diagnosis of glaucoma. Ophthalmologica. 2010;224(5):274–282. | ||
Iliev ME, Meyenberg A, Garweg JG. Morphometric assessment of normal, suspect and glaucomatous optic discs with Stratus OCT and HRT II. Eye (Lond). 2006;20(11):1288–1299. | ||
Seymenoğlu G, Başer E, Oztürk B. Comparison of spectral-domain optical coherence tomography and Heidelberg retina tomograph III optic nerve head parameters in glaucoma. Ophthalmologica. 2013; 229(2):101–105. | ||
Coops A, Henson DB, Kwartz AJ, Artes PH. Automated analysis of heidelberg retina tomograph optic disc images by glaucoma probability score. Invest Ophthalmol Vis Sci. 2006;47(12):5348–5355. | ||
Jünemann AG. Diagnose und Therapie des Pseudoexfoliationsglaukoms. [Diagnosis and therapy of pseudoexfoliation glaucoma]. Ophthalmologe. 2012;109(10):962–975. German. | ||
Gordon MO, Beiser JA, Brandt JD, et al. The Ocular Hypertension Treatment Study: baseline factors that predict the onset of primary open-angle glaucoma. Arch Ophthalmol. 2002;120(6):714–720. | ||
Jaeschke R, Guyatt GH, Sackett DL. Users’ guides to the medical literature. III. How to use an article about a diagnostic test. B. What are the results and will they help me in caring for my patients? The Evidence-Based Medicine Working Group. JAMA. 1994;271:1615–1619. |
 © 2015 The Author(s). This work is published and licensed by Dove Medical Press Limited. The full terms of this license are available at https://www.dovepress.com/terms.php and incorporate the Creative Commons Attribution - Non Commercial (unported, v3.0) License.
By accessing the work you hereby accept the Terms. Non-commercial uses of the work are permitted without any further permission from Dove Medical Press Limited, provided the work is properly attributed. For permission for commercial use of this work, please see paragraphs 4.2 and 5 of our Terms.
© 2015 The Author(s). This work is published and licensed by Dove Medical Press Limited. The full terms of this license are available at https://www.dovepress.com/terms.php and incorporate the Creative Commons Attribution - Non Commercial (unported, v3.0) License.
By accessing the work you hereby accept the Terms. Non-commercial uses of the work are permitted without any further permission from Dove Medical Press Limited, provided the work is properly attributed. For permission for commercial use of this work, please see paragraphs 4.2 and 5 of our Terms.