")
Back to Journals » International Journal of General Medicine » Volume 14
Significance of TEAD Family in Diagnosis, Prognosis and Immune Response for Ovarian Serous Carcinoma
Authors Ren X , Wang X, Peng B, Liang Q, Cai Y, Gao K, Hu Y, Xu Z , Yan Y
Received 3 September 2021
Accepted for publication 19 October 2021
Published 27 October 2021 Volume 2021:14 Pages 7133—7143
DOI https://doi.org/10.2147/IJGM.S336602
Checked for plagiarism Yes
Review by Single anonymous peer review
Peer reviewer comments 2
Editor who approved publication: Dr Scott Fraser
Xinxin Ren,1 Xiang Wang,2 Bi Peng,3 Qiuju Liang,2 Yuan Cai,3 Kewa Gao,3 Yongbin Hu,3 Zhijie Xu,3,4 Yuanliang Yan2
1Center for Molecular Medicine, Xiangya Hospital, Central South University, Changsha, People’s Republic of China; 2Department of Pharmacy, Xiangya Hospital, Central South University, Changsha, People’s Republic of China; 3Department of Pathology, Xiangya Hospital, Central South University, Changsha, People’s Republic of China; 4National Clinical Research Center for Geriatric Disorders, Xiangya Hospital, Central South University, Changsha, People’s Republic of China
Correspondence: Yuanliang Yan
Department of Pharmacy, Xiangya Hospital, Central South University, Changsha, 410008, Hunan, People’s Republic of China
Email [email protected]
Purpose: To explore the molecular profiles of transcriptional enhanced associate domain (TEAD) family in ovarian serous carcinoma (OSC).
Methods: In this study, we use bioinformatics methods including GEPIA, GE-mini, Oncomine 3.0, Kaplan–Meier plotter, cBioPortal, WebGestalt, TIMER2.0 and DiseaseMeth2.0, and in vitro experimental RT-PCR to assess the expression profiles and prognostic significance of TEAD family in OSC.
Results: According to the bioinformatics analysis, TEAD family was abnormally expressed in OSC. In terms of prognosis, Kaplan–Meier plotter indicated that OSC patients with high level of TEAD4 showed poor overall survival (OS), progression-free survival (PFS) and post progression survival (PPS). TEAD family also had significantly diagnostic values for OSC patients. Tumor Immune Estimation Resource (TIMER) algorithm indicated that TEAD family was significantly associated with different types of infiltrating immune cells, including B cells, macrophages, dendritic cells, neutrophils, CD8+ T cells and CD4+ T cells. Gene set enrichment analysis of TEAD family-associated coexpression genes was further explored. In in vitro experiments, the RT-PCR results showed the upregulated TEAD2/4 in OSC tissues and cells (A2780 and TOV112D). Moreover, decreased expression of TEAD2 could induce the ferroptosis through increasing the ROS accumulation.
Conclusion: Thus, TEAD family correlated with the diagnosis, prognosis and immune infiltration in OSC. These results could provide comprehensive understanding of TEAD family in the diagnosis and prognosis of OSC patients.
Keywords: TEAD family, Hippo pathway, ovarian serous carcinoma, expression profiles, prognosis, immune infiltration
Introduction
Ovarian cancer is the second cause of death from gynecologic cancers in the world.1,2 Despite great advances have been made in diagnosis and treatment, the 5-year relative survival rate of ovarian cancer is only 47%, even in the developed countries.3 Among all histological subtypes of ovarian cancer, the ovarian serous carcinoma (OSC) has the highest mortality rate.4 In addition, late-stage presentation has a 5-year relative survival rate of 29% compared to 92% for early-stage; however, 75% of the patients are diagnosed at the late-stage due to lacking effective diagnostic methods.5 Therefore, identifying novel biomarkers is essential for improving the diagnosis and prognosis of OSC patients.
Hippo signaling pathway, as an important signaling pathway for tumor progression, has the functions of regulating organ size and maintaining the dynamic balance between cell proliferation and apoptosis.6,7 Transcriptional enhanced associate domain (TEAD) is a family of transcription factors that was initially screened by genetic mosaic in Drosophila because of its vital role in organ development.8 Studies have identified that there are currently four homologs of TEAD protein, TEAD1/2/3/4.9 As the downstream effectors of Hippo signaling pathway, TEAD proteins can regulate cell growth, proliferation and stem cell functions, which are closely related to the occurrence and development of cancer.10 Emerging reports have demonstrated that TEAD family plays a critical role in multiple types of cancer, including renal cancer, breast cancer and prostate cancer.11–13 However, the detailed mechanisms of TEAD family members in OSC needfurther confirmation.
The purpose of our study was to assess the biological significance of TEAD family members in OSC patients using comprehensive bioinformatics and experimental methods (Supplemental Table 1). TEAD family members have been discovered as the potential diagnostic and prognostic biomarkers for OSC patients for clinical practice.
Methods
Cell Culture
The human ovarian epithelial IOSE80 and the human ovarian cancer A2780, SKOV-3, OVCAR3 and TOV112D cell lines were obtained from the Cancer Research Institute, Central South University, China. The cells were maintained in Roswell Park Memorial Institute (RPMI)-DMEM medium (Gibco, Invitrogen, Carlsbad, CA, USA) with 10% fetal bovine serum (FBS, Gibco) at 37°C and 5% CO2.
Antibodies and Chemicals
The following antibodies were used in this study: TEAD2 (21159-1-AP, Proteintech), actin (66009-1-Ig, Proteintech). The ferroptosis inducer erastin (B1524), ferroptosis inhibitor ferrostatin-1 (A4371), apoptosis inhibitor ZVAD-FMK (A1902) and necroptosis inhibitor necrostatin-1 (A4213) were obtained from APExBIO (Houston, USA).
RNA Extraction and Reverse Transcription PCR (RT-PCR)
The 20 formalin-fixed, paraffin-embedded (FFPE) specimens of OSC tissues and 8 normal ovary tissues were all obtained from the Department of Pathology, Xiangya Hospital. The ethics of our study was approved by the Ethics Committee of Xiangya Hospital of Central South University and the ethical approval number is 202110181. TRIzol (Invitrogen) was applied to extract total RNA. Then, 1 µg of RNA was reverse transcribed into cDNA by utilizing a PrimeScript™ RT kit (Takara, 6210) following the manufacturer’s instructions. The SYBR Green kit and real-time fluorescent quantitative PCR (qPCR) system (Bio-Rad, USA) were applied for qPCR analysis, with 18S rRNA as the internal control. Finally, relative expression levels of target genes were decided using the 2-ΔΔCT method. The details of the TEAD family primer sequences used in the experiment were listed in Table 1.
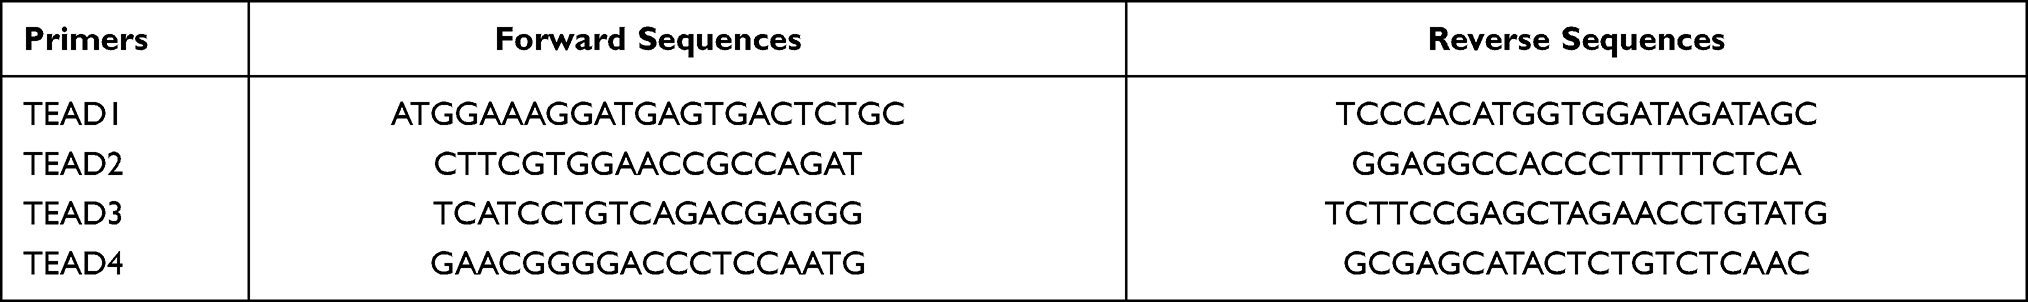 |
Table 1 The TEAD Family Primer Sequences Used in RT-PCR |
Transfections
For siRNA transfection, cells were all transfected by using Lipofectamine 3000 reagent (L3000150, Invitrogen, USA) according to the manufacturer's protocol. The sense sequences of target gene siTEAD2 are listed bellowed: siTEAD2-1-GAGTGAGCAGCCAGTATGA, siTEAD2-2-GGTTGCAGCTGGTAGAGTT.
Western Blot
Cells were lysed on ice with RIPA lysis buffer containing protease inhibitor for 15 min. After centrifugation at 13,500 × g for 15 min at 4 °C, the supernatants were collected and quantified using a BCA protein detection kit. Equal quantity of protein was resolved on SDS-PAGE. Then, PVDF membranes were blocked in 5% skim milk and incubated with different primary antibodies at 4°C overnight subsequently. After incubation with HRP-conjugated secondary antibody for 1h at room temperature, the signals were detected with a chemiluminescence reagent (Millipore, WBKLS0050).
Cell Viability Assay
Cells were plated into a 96-well plate (1000 cells/well) and cultured under the condition at 37°C with 5% CO2. The next day, the old medium was discarded and the fresh medium containing 10% CCK-8 was added. The absorbance of each group was measured at 450nm.
ROS Assay
The reactive oxygen species (ROS) in cells were assessed using DCFDA/H2DCFDA - Cellular ROS Assay Kit (ab113851, Abcam) according to the manufacturer’s instructions. Cells were stained by DCFDA Solution and incubated for 45 minutes at 37°C in the dark. Then, live cell microscopy was performed with filter set appropriate for fluorescein.
GEPIA
Gene Expression Profiling Interactive Analysis (GEPIA), a web-based tool to give rapid and customizable functionalities based on TCGA and GTEx data, could offer vital interactive and customizable functions including differential expression analysis, patient survival analysis, correlation analysis and so on.14 In the study, we used “single-gene analysis” in GEPIA to value the mRNA expression differences of TEAD family members in OSC tissues compared with normal tissues. Differences in mRNA expression were compared by Student’s t-test, and p < 0.05 was considered statistical significance.
GE-mini
GE-mini is a movable visualization instrument that integrates gene expression data on the basis of TCGA and GTEx.15 The expression viewer could be used as a convenient method for showing expression profiles of tumor and tissue types. In the study, we used the tool to analyze the mRNA expression of TEAD family in OSC tissues. P < 0.05 was considered statistically significant.
Oncomine 3.0
Oncomine 3.0, containing 65 gene expression datasets composed of about 48 million gene expression surveys form more than 4700 microarray experiments, is a cancer microarray database and web-based data-mining platform with the purpose of contributing discovery from genome-wide expression analyses.16 In the study, we evaluate the TEAD family mRNA expression in OSC. P < 0.05 was considered to show a statistically significant difference.
Kaplan–Meier Plotter
Kaplan–Meier plotter is a database evaluating the relationship between gene expression and the prognostic value in cancer patients.17 In the study, we used the database to analyze the effect of expression of TEAD family on OSC patients’ prognosis by means of overall survival (OS), progression-free survival (PFS) and post progression survival (PPS) curves. In addition, information was divided into high- and low-expression groups and HR and p values can be found on the figures. P < 0.05 was considered statistically significant.
cBioPortal
The cBioPortal for Cancer Genomics can be applied to analyze, visualize and download of large-scale cancer genomics and clinical data.18 In our study, we analyzed the genome map of the TEAD family in OSC tissues including mRNA expression and genetic alterations.
Protein–Protein Interaction
The STRING database is designed to gather and integrate functional interactions between the expressed proteins.19 In the study, we built the TEAD-associated protein–protein interaction (PPI) network using STRING.
WebGestalt
WebGestalt is a more extensive, mighty, flexible and visible gene set enrichment analysis toolkit.20 Gene set enrichment analysis of TEAD family-associated coexpression genes was explored using WebGestalt algorithm, including gene ontology (GO) and Kyoto Encyclopedia of Genes and Genomes (KEGG).
TIMER2.0
TIMER2.0 is used to analyze the immune infiltrates across diverse cancer types.21 Through the database, we obtained the relationship between TEAD family and six immune infiltrates (B cells, CD4+ cells, CD8+ cells, neutrophils, macrophages and dendritic cells).
Statistical Analyses
All experimental findings were shown as mean ± standard deviation (SD). Student’s t-test was used to explore the difference between two groups. P < 0.05 was considered statistically significant.
Results
Abnormal Expression of the TEAD Family in OSC Patients
Firstly, we used bioinformatics databases to evaluate the expression profiles of TEAD members in normal and OSC patients. Using GEPIA with the criterion of |Log2FC|>2 and p<0.05, we found the decreased TEAD1/3 and increased TEAD2/4 in OSC tissues (Figure 1A). In addition, from GE-mini database, we discovered that TEAD2/3/4 were upregulated; however, TEAD1 was downregulated in OSC tissues compared to normal tissues (Figure 1B). The Lu Ovarian dataset obtained from Oncomine revealed the upregulated expression levels of TEAD2/4 (Figure 1C). Then, RT-PCR was performed to confirm the upregulated TEAD2/4 in OSC cells A2780 and TOV112D compared with the normal ovary cell IOSE80 (Figure 1D, Supplemental Table 3). Moreover, the transcriptional levels of TEAD2/4 were significantly increased in OSC tissues compared to the normal ovary tissues (Figure 1E, Supplemental Table 4).
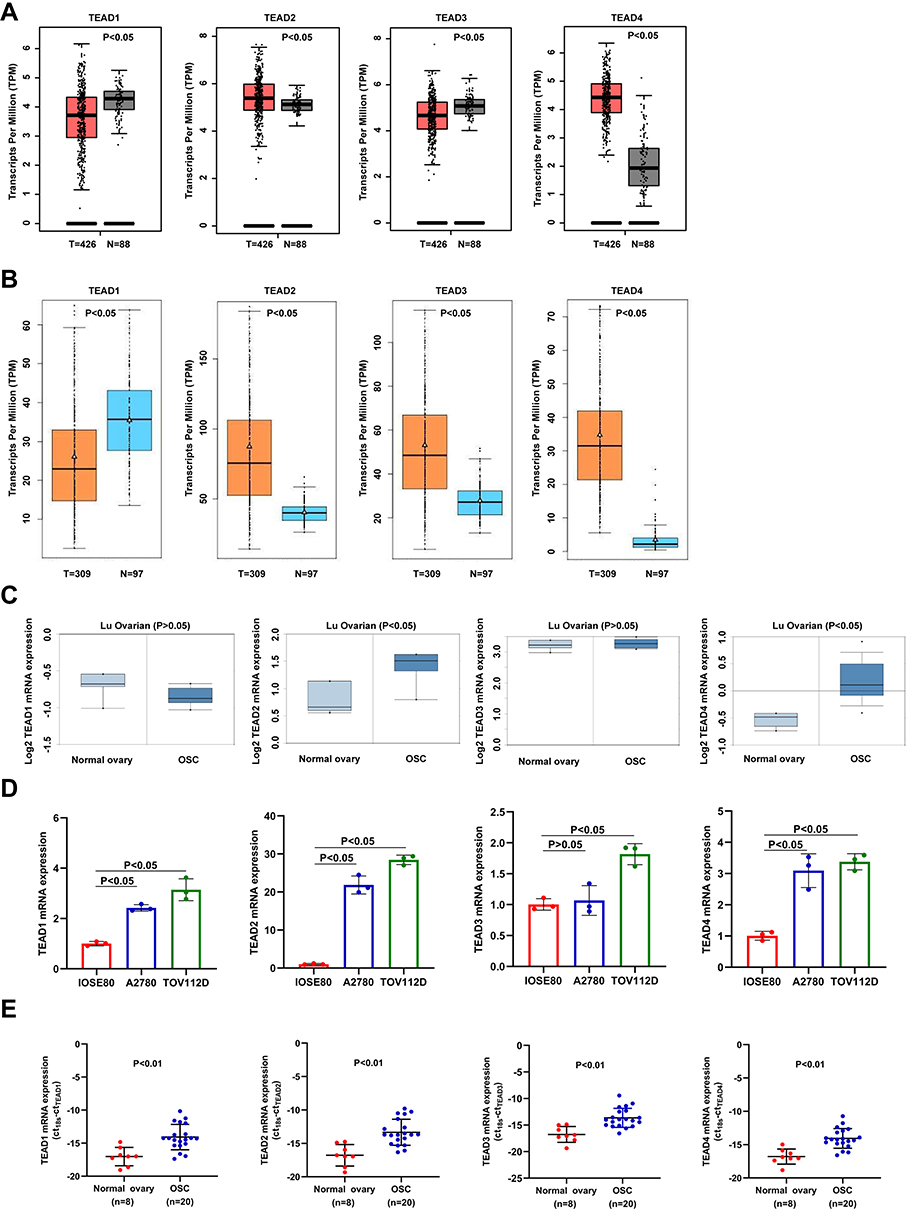 |
Figure 1 The expression of TEAD family in OSC. (A–C) The mRNA expression of TEAD family in OSC obtained from GEPIA, GE-mini and Oncomine databases. T and N represent the OSC tissues and normal tissues, respectively. (D) mRNA expression levels of different TEAD family members in normal ovary cell line IOSE80 and OSC cell lines A2780 and TOV112D experimented by RT-PCR. (E) The mRNA expression level of TEAD family members in the clinical samples. OSC represents ovarian serous carcinoma. |
The Prognostic and Diagnostic Values of TEAD Family Members in OSC Patients
Kaplan–Meier Plotter was applied to evaluate the effects of TEAD family on patients’ survival. In terms of OS, the high expression of TEAD1/2/4 was associated with a shorter OS time (Figure 2A). Moreover, patients with higher transcription levels of TEAD1/2/3/4 revealed shorter PFS (Figure 2B). Meanwhile, we assessed the prognostic value of the TEAD family on the PPS of OSC patients. Results displayed that the upregulation of TEAD4 was significantly associated with a poor PPS, while upregulation of TEAD1/2 was associated with good PPS (Figure 2C). In addition, the expression of TEAD3 had no obvious association with the patients’ OS and PPS (Figure 2A and C).
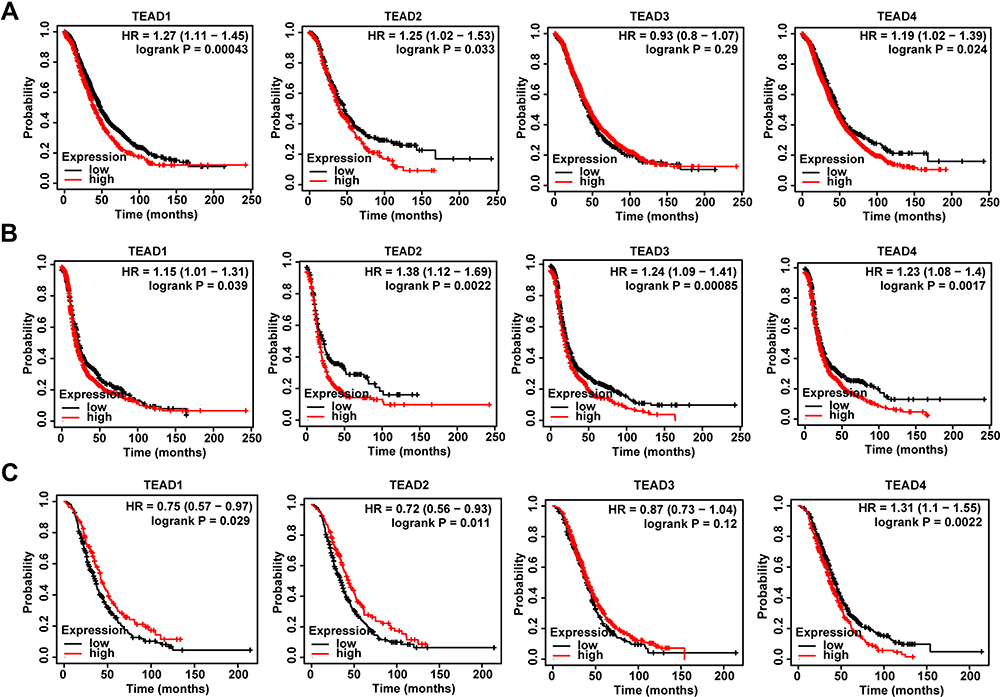 |
Figure 2 Analysis of TEAD family expression on the prognosis of OSC patients. (A–C) The relationship between TEAD family and OS, PFS and PPS in OSC patients described by Kaplan–Meier plotter, respectively. |
Subsequently, we analyzed the diagnostic values of TEAD family in OSC with ROC curves. From Xiantao Xueshu web tool (https://www.xiantao.love/products), we found that the area under the curve (AUC) of TEAD1/2/3/4 was 0.690, 0.630, 0.673 and 0.958, respectively (Figure 3A–D). Thus, because of the highest AUC, TEAD4 might have the potential to be as the diagnostic biomarker for OSC patients.
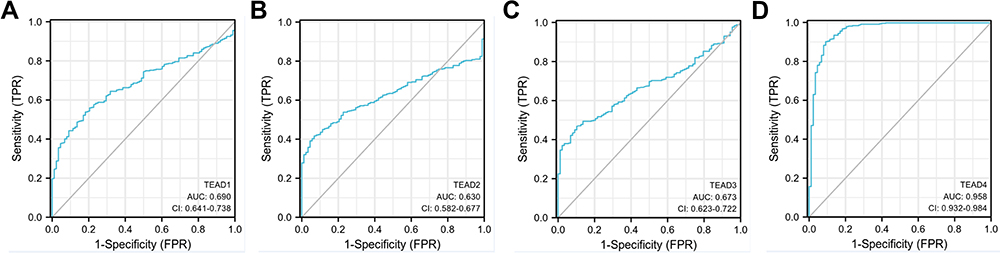 |
Figure 3 Evaluation of diagnostic value of TEAD family in OSC. (A–D) ROC curve analysis of TEAD family members for the diagnostic values of OSC patients. |
Genetic Alteration and Functional Enrichment Analysis of TEAD Family in OSC Patients
We developed an integrated biological function analysis to further investigate the molecular characteristics of TEAD family in OSC patients. From cBioPortal database, we obtained the genetic alterations information of the TEAD family members. Results showed that the alternation rates of TEAD1/2/3/4 were 8%, 1.6%, 16% and 19% in the OSC samples, respectively (Figure 4A). Moreover, amplification and up-regulated expression were the main genetic alteration of TEAD2/4 genes.
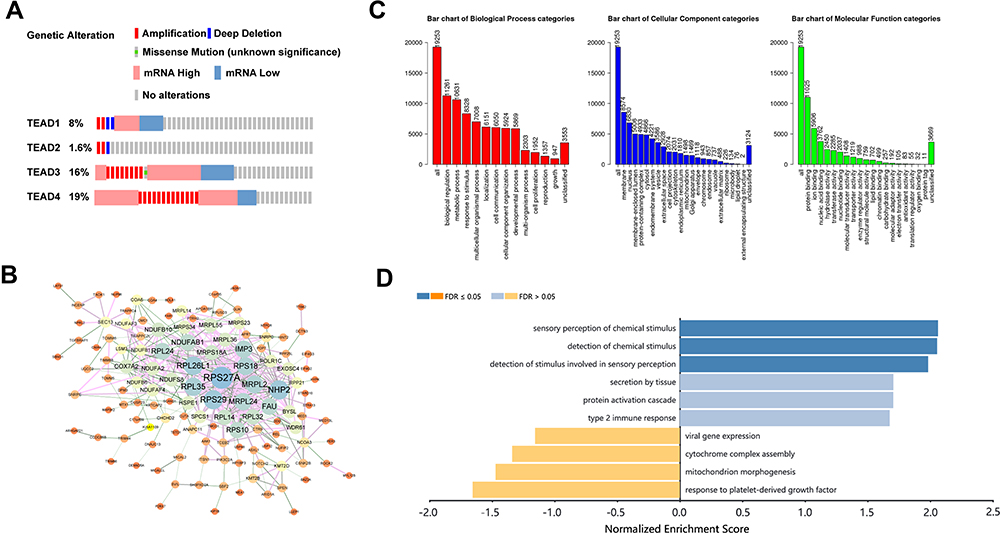 |
Figure 4 Genetic alteration and functional enrichment analysis of TEAD Family in OSC patients. (A) Description of the mutation rates in each TEAD family member in OSC patients. (B) The PPI network of TEAD family-associated coexpression genes as completed by STRING and Cytoscape. (C) Bar plot of GO analysis in biological process, cellular component and molecular function. (D) KEGG enrichment analyzed by WebGestalt. |
In addition, PPI analysis of TEAD-family-associated coexpressed genes was used to comprehend the biological functions of TEAD family in OSC patients. Firstly, we downloaded the 19,253 coexpressed genes related to TEAD family members in OSC patients through the cBioPortal database (Figure 4B). Then, using the criterion of |Spearman Correlation|>0.54 and p<0.01, we identified 200 coexpressed genes with TEAD family to conduct the PPI network (Supplemental Table 2). The PPI network revealed that ribosomal protein S27a (RPS27A), NHP2 and ribosomal protein S29 (RPS29) were the hub genes, which might regulate the biological functions of TEAD family in OSC (Figure 4B). Meanwhile, GO analysis indicated that the TEAD family was primarily gathered in biological regulation and metabolic processes in the biological processes. In aspect of cellular component and molecular function, TEAD family were mainly located in membrane and enriched in protein binding (Figure 4C). Furthermore, KEGG analyzed further verified that TEAD family was significantly connected with sensory perception and detection of chemical stimulus (Figure 4D).
Immune Cell Infiltration of TEAD Family in OSC Patients
The relationship between TEAD family and immune cell infiltration was analyzed by TIMER algorithm. The results revealed that there were negative associations between TEAD1 expression and the infiltration of CD8+ T cells, CD4+ T cells, neutrophils and dendritic cells. The positive associations could be found between TEAD1 expression and the infiltration of B cells and macrophages (Figure 5A). In addition, TEAD2/3 were negatively related to B cells, CD8+ T cells, macrophages, neutrophils and dendritic cells, while positively correlated with CD4+ T cells (Figure 5B and C). Interestingly, TEAD4 was negatively relevant to all tumor-infiltrating immune cells, such as B cells, CD8+ T cells, CD4+ cells, macrophages, neutrophils and dendritic cells (Figure 5D). Furthermore, we used the Cox proportional hazard model to analyze the clinical significance of TEAD family and the infiltration of immune cells in OSC cancer. The results showed that CD4+ T cells, macrophages, neutrophils and TEAD1 expression were significantly correlated with the clinical outcome of OSC patients (Table 2).
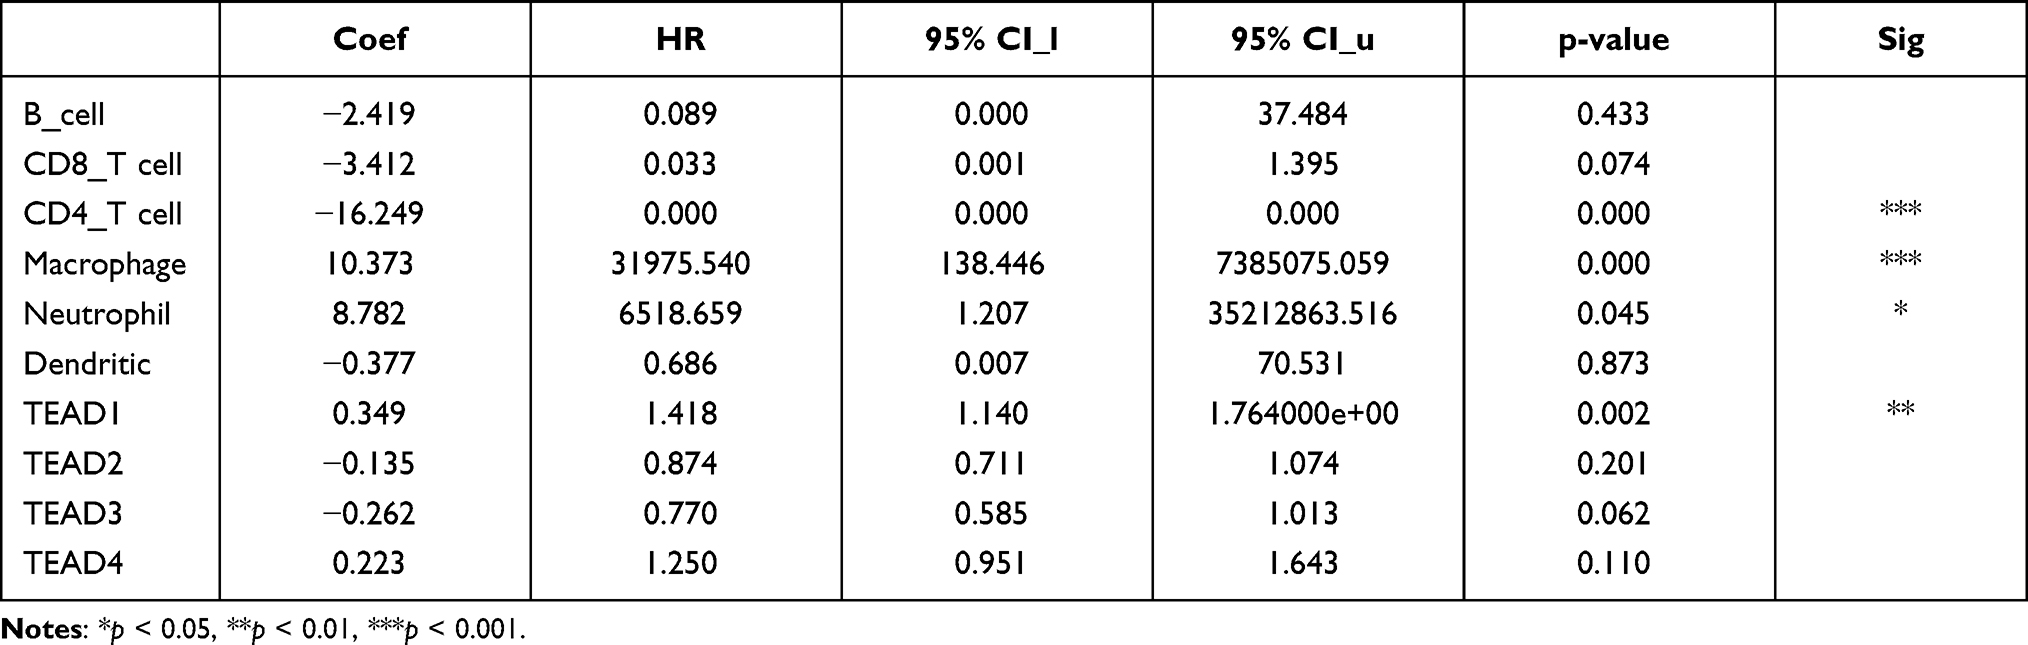 |
Table 2 The Cox Proportional Hazard Model of the TEAD Family and Six Tumor-Infiltrating Immune Cells in OSC |
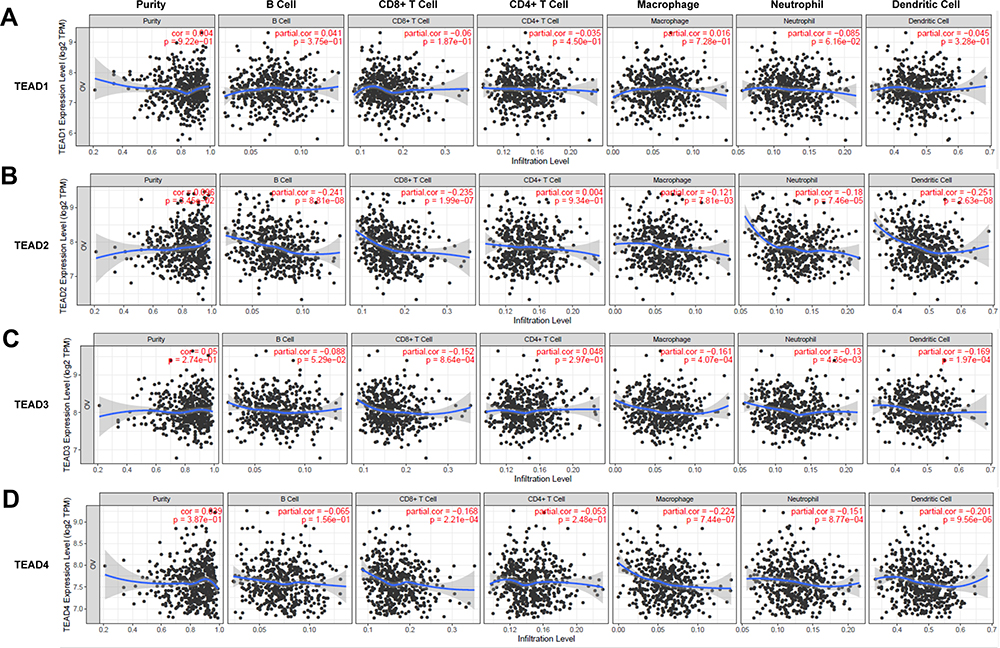 |
Figure 5 The associations between differentially expressed TEAD family members and immune cell infiltration. (A–D) The effect of TEAD1/2/3/4 on the immune cell infiltration analyzed by TIMER2.0. |
TEAD2 Inhibited Ferroptosis in OSC
As we had known that the mRNA expression of TEAD2 was obviously higher in OSC, then we discussed the protein level of TEAD2 in OSC compared to normal ovary cells. Figure 6A has shown that the protein level of TEAD2 was significantly increased in OSC cell lines including A2780, TOV112D, SKOV-3 and OVCAR3 compared to normal ovary cell line IOSE80 (Supplemental Figure 1). Moreover, we explored the function of TEAD2 in OSC by knocking down the TEAD2 in A2780 cells (Figure 6B, Supplemental Figure 2). Through CCK8 test, we found that reduced the expression of TEAD2 could promote the death of A2780 cells under the circumstance of erastin and the process could be reversed by ferrostatin-1; however, ZVAD-FMK and necrostatin-1 could not affect the death of A2780 cells (Figure 6C). Therefore, it was indicated that knocked down the TEAD2 was able to accelerate the ferroptosis in OSC.
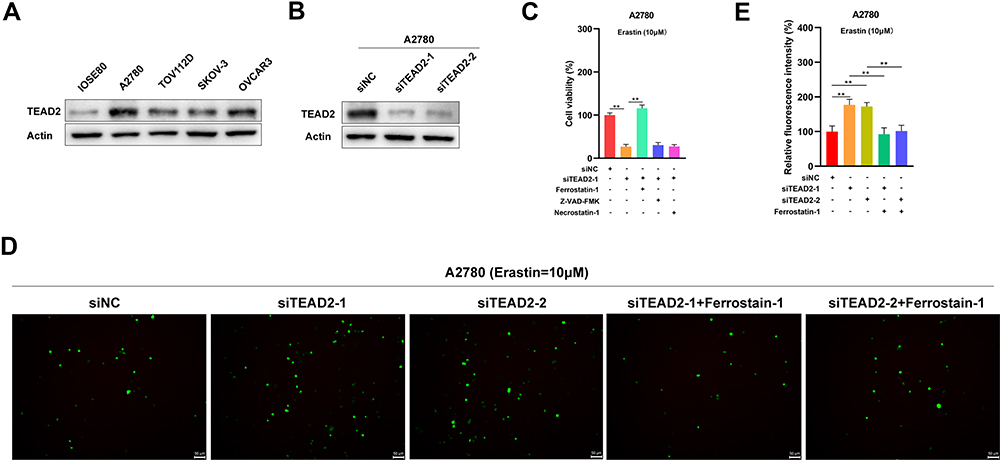 |
Figure 6 TEAD2 inhibited ferroptosis in A2780 cells. (A) The expression of TEAD2 in normal ovary cell line IOSE80 and OSC cell lines A2780, TOV112D, SKOV-3 and OVCAR3. (B) Knock down of TEAD2 in A2780 cells. (C) Knockout of TEAD2 in A2780 cells facilitated the cell death induced by erastin in A2780 cells. A2780 cells deal with erastin (10 μM) with or without a cell death inhibitor including ferrostatin-1 (5 μM), ZVAD-FMK (10 μM) and necrostatin-1 (5 μM) for 24 h. Cell death was experimented by a CCK-8 kit. Data shown represent mean ± SD (n=3). **p < 0.01. (D and E) TEAD2 could regulate the level of ROS in A2780 cells. A2780 cells deal with erastin (10 μM) for 24h and then the intracellular ROS was tested. Data shown represent mean ± SD (n=3). **p < 0.01. |
Furthermore, we discussed whether TEAD2 could influence the ROS, which was the crucial indicator for ferroptosis. Results showed that knocked down TEAD2 increased the ROS levels in A2780 cells after treating with erastin and ferrostatin-1 could reverse the process (Figure 6D and E). This suggested that TEAD2 could suppress the ferroptosis by regulating the level of ROS in OSC.
Discussion
As the transcriptional partner of Yes-associated protein/transcriptional co-activator with PDZ-binding motif (YAP/TAZ) in the Hippo signal pathway, TEAD family plays an important role in tumor progression.22,23 TEAD1 could directly integrate with the hypoxia-inducible factor-1A (HIF-1A) promoter region and regulate the expression of HIF1A, facilitating the tumor glycolysis.24,25 TEAD2 was significantly upregulated in hepatocellular carcinoma (HCC) and the higher expression was associated with poor OS time of HCC.26,27 In addition, TEAD3 could promote the proliferation of gastric cancer cell line MKN-28 through increasing SLC35B4 expression.28,29 Abnormally expressed TEAD4 could obviously cause epithelial-to-mesenchymal transition (EMT) in colon cancer.30 However, the detailed roles of the TEAD family in OSC have not been explained. Our study was the first to explore the expression and function profiles of TEAD family in OSC. The results showed that TEAD2/4 were significantly upregulated in OSC tissues and cells. In terms of the prognosis of OSC patients, the higher expression of TEAD1/2/4 was significantly associated with poor OS and PFS. Upregulation of TEAD4 was observably correlated with poor PPS in OSC; however, downregulation of TEAD1/2 were related to poor PPS. In addition, the TEAD family presented frequent genetic alteration in OSC patients.
The interaction between immune infiltration cells and tumor cells had a significant influence on tumor development and progression.31–33 Based on the TIMER database, we found that the expression of TEAD family members was obviously associated with the immune infiltration cells. TEAD2/3/4 were all significantly negative with CD8+ T cells, macrophages, neutrophils and dendritic cells in OSC. TEAD2 also had the inverse relationship with B cells. These results indicated that TEAD family might be participated in the immune response. In addition, emerging studies have demonstrated the association of immune infiltration cells and prognosis in OSC patients.34–36 Similarly, in our study, several tumor-infiltrating immune cells, such as CD4+ T cells, macrophages and neutrophils, were significantly correlated with the clinical outcome of OSC patients. Studies have shown that CD4+ T cells were obviously involved in the development of OSC.37–39 In addition, macrophages and neutrophils were also employed as the potential prognostic markers for OSC.40–42 Thus, these studies demonstrated that tumor-infiltrating immune cells could be used as the important indicators for the clinical outcome of OSC patients.
Conclusions
In conclusion, our study analyzed the molecular profiles of TEAD family in OSC patients by bioinformatics and experimental strategies. We discovered that TEAD2 was obviously upregulated in OSC. Meanwhile, the higher expression of TEAD2 was significantly associated with poor OS and PFS. Furthermore, the reduced expression of TEAD2 could promote the ferroptosis in OSC. Therefore, our findings suggested a promising insight into TEAD family in the OSC population, and provided a personalized prediction tool for prognosis and immune responses. Moreover, TEAD2 had the potential to be the biomarker of diagnosis and prognosis in OSC.
Data Sharing Statement
All data generated or analyzed during this study are included in the manuscript and Supplementary Materials.
Ethics Approval and Informed Consent
According to the National Health and Family Planning Commission Order (No. 11), the human body materials in this study do not need the informed consent statement. The ethics of our study has been approved by the Ethics Committee of Xiangya Hospital of Central South University. The ethical approval number is 202110181.
Consent for Publication
All authors have approved the manuscript for submission.
Funding
This study is supported by grants from the China Postdoctoral Science Foundation (2021T140754, 2020M672521), the National Natural Science Foundation of China (81803035), the Natural Science Foundation of Hunan Province (2020JJ5934, 2019JJ50932), and the Postdoctoral Science Foundation of Central South University (248485).
Disclosure
The authors declare no conflicts of interest for this work.
References
1. Lheureux S, Braunstein M, Oza AM. Epithelial ovarian cancer: evolution of management in the era of precision medicine. CA Cancer J Clin. 2019;69(4):280–304.
2. Bai J, Xie Z, Sun L. Case report: metachronous quadruple cancers including breast cancer and triple genital cancer. Int J Gen Med. 2020;13:1575–1580. doi:10.2147/IJGM.S278219
3. Hidayat YM, Munizar HAB, Winarno GNA, Hasanuddin SS. Chemokine ligand 5 to predict optimal cytoreduction in ovarian cancer. Int J Gen Med. 2020;13:1201–1206. doi:10.2147/IJGM.S280858
4. Nesic K, Kondrashova O, Hurley RM, et al. Acquired RAD51C promoter methylation loss causes PARP inhibitor resistance in high-grade serous ovarian carcinoma. Cancer Res. 2021;81:4709–4722. doi:10.1158/0008-5472.CAN-21-0774
5. Wan X, Zhang H, Zhang Y, Peng Y. Metastases to the breast from extramammary nonhematological malignancies: case series. Int J Gen Med. 2020;13:1105–1114. doi:10.2147/IJGM.S276602
6. Li FL, Guan KL. The two sides of Hippo pathway in cancer. Semin Cancer Biol. 2021. doi:10.1016/j.semcancer.2021.07.006
7. Liu Y, Zhang Q, Wu J, et al. Long non-coding RNA A2M-AS1 promotes breast cancer progression by sponging microRNA-146b to upregulate MUC19. Int J Gen Med. 2020;13:1305–1316. doi:10.2147/IJGM.S278564
8. Xue C, Liu X, Wen B, et al. Zebrafish vestigial like family member 4b is required for valvulogenesis through sequestration of transcription factor myocyte enhancer factor 2c. Front Cell Develop Biol. 2019;7:277. doi:10.3389/fcell.2019.00277
9. Yamaguchi N. Multiple roles of vestigial-like family members in tumor development. Front Oncol. 2020;10:1266. doi:10.3389/fonc.2020.01266
10. He Z, Li R, Jiang H. Mutations and copy number abnormalities of hippo pathway components in human cancers. Front Cell Develop Biol. 2021;9:661718. doi:10.3389/fcell.2021.661718
11. Qu L, Wu Z, Li Y, et al. A feed-forward loop between lncARSR and YAP activity promotes expansion of renal tumour-initiating cells. Nat Commun. 2016;7:12692. doi:10.1038/ncomms12692
12. Kalayci M, Hassan IA, Keinan IA, et al. The effect of hemodialysis on axial length, ocular surface, and intraocular pressure in patients with end-stage renal failure. Int J Gen Med. 2020;13:1035–1042. doi:10.2147/IJGM.S281546
13. Wang X, Wang S, Pang YP, et al. Contrast-enhanced ultrasound assessment of renal parenchymal perfusion in patients with atherosclerotic renal artery stenosis to predict renal function improvement after revascularization. Int J Gen Med. 2020;13:1713–1721. doi:10.2147/IJGM.S293316
14. Tang Z, Li C, Kang B, Gao G, Li C, Zhang Z. GEPIA: a web server for cancer and normal gene expression profiling and interactive analyses. Nucleic Acids Res. 2017;45(W1):W98–W102. doi:10.1093/nar/gkx247
15. Tang Z, Li C, Zhang K, Yang M, Hu X. GE-mini: a mobile APP for large-scale gene expression visualization. Bioinformatics. 2017;33(6):941–943.
16. Rhodes DR, Yu J, Shanker K, et al. ONCOMINE: a cancer microarray database and integrated data-mining platform. Neoplasia. 2004;6(1):1–6. doi:10.1016/S1476-5586(04)80047-2
17. Gyorffy B, Gyorffy A, Tulassay Z. [The problem of multiple testing and solutions for genome-wide studies]. Orv Hetil. 2005;146(12):559–563. Danish.
18. Cerami E, Gao J, Dogrusoz U, et al. The cBio cancer genomics portal: an open platform for exploring multidimensional cancer genomics data. Cancer Discov. 2012;2(5):401–404. doi:10.1158/2159-8290.CD-12-0095
19. Szklarczyk D, Morris JH, Cook H, et al. The STRING database in 2017: quality-controlled protein-protein association networks, made broadly accessible. Nucleic Acids Res. 2017;45(D1):D362–D368. doi:10.1093/nar/gkw937
20. Wang J, Vasaikar S, Shi Z, Greer M, Zhang B. WebGestalt 2017: a more comprehensive, powerful, flexible and interactive gene set enrichment analysis toolkit. Nucleic Acids Res. 2017;45(W1):W130–W137. doi:10.1093/nar/gkx356
21. Li T, Fu J, Zeng Z, et al. TIMER2.0 for analysis of tumor-infiltrating immune cells. Nucleic Acids Res. 2020;48(W1):W509–W514. doi:10.1093/nar/gkaa407
22. Currey L, Thor S, Piper M. TEAD family transcription factors in development and disease. Development. 2021;148(12). doi:10.1242/dev.196675
23. Brunty S, Mitchell B, Bou-Zgheib N, Santanam N. Endometriosis and ovarian cancer risk, an epigenetic connection. Ann Transl Med. 2020;8(24):1715. doi:10.21037/atm-20-2449
24. Sun Z, Zhang Q, Yuan W, et al. MiR-103a-3p promotes tumour glycolysis in colorectal cancer via hippo/YAP1/HIF1A axis. J Exp Clin Cancer Res. 2020;39(1):250. doi:10.1186/s13046-020-01705-9
25. Demircan NC, Boussios S, Tasci T, Ozturk MA. Current and future immunotherapy approaches in ovarian cancer. Ann Transl Med. 2020;8(24):1714. doi:10.21037/atm-20-4499
26. Joo JS, Cho SY, Rou WS, et al. TEAD2 as a novel prognostic factor for hepatocellular carcinoma. Oncol Rep. 2020;43(6):1785–1796.
27. Samartzis EP, Labidi-Galy SI, Moschetta M, et al. Endometriosis-associated ovarian carcinomas: insights into pathogenesis, diagnostics, and therapeutic targets-a narrative review. Ann Transl Med. 2020;8(24):1712. doi:10.21037/atm-20-3022a
28. Liu J, Zhao X, Wang K, et al. A novel YAP1/SLC35B4 regulatory axis contributes to proliferation and progression of gastric carcinoma. Cell Death Dis. 2019;10(6):452. doi:10.1038/s41419-019-1674-2
29. Tang R, Hua J, Xu J, et al. The role of ferroptosis regulators in the prognosis, immune activity and gemcitabine resistance of pancreatic cancer. Ann Transl Med. 2020;8(21):1347. doi:10.21037/atm-20-2554a
30. Yu T, Song J, Zhou H, et al. Nuclear TEAD4 with SIX1 overexpression is an independent prognostic marker in the stage I-III colorectal cancer. Cancer Manag Res. 2021;13:1581–1589. doi:10.2147/CMAR.S260790
31. Valpione S, Mundra PA, Galvani E, et al. The T cell receptor repertoire of tumor infiltrating T cells is predictive and prognostic for cancer survival. Nat Commun. 2021;12(1):4098. doi:10.1038/s41467-021-24343-x
32. Brase JC, Walter RFH, Savchenko A, et al. Role of tumor-infiltrating B cells in clinical outcome of patients with melanoma treated with dabrafenib plus trametinib. Clin Cancer Res. 2021;27:4500–4510. doi:10.1158/1078-0432.CCR-20-3586
33. Mhaidly R, Mechta-Grigoriou F. Role of cancer-associated fibroblast subpopulations in immune infiltration, as a new means of treatment in cancer. Immunol Rev. 2021;302(1):259–272. doi:10.1111/imr.12978
34. Le Saux O, Ray-Coquard I, Labidi-Galy SI. Challenges for immunotherapy for the treatment of platinum resistant ovarian cancer. Semin Cancer Biol. 2020. doi:10.1016/j.semcancer.2020.08.017
35. Fucikova J, Rakova J, Hensler M, et al. TIM-3 dictates functional orientation of the immune infiltrate in ovarian cancer. Clin Cancer Res. 2019;25(15):4820–4831. doi:10.1158/1078-0432.CCR-18-4175
36. Mesnage SJL, Auguste A, Genestie C, et al. Neoadjuvant chemotherapy (NACT) increases immune infiltration and programmed death-ligand 1 (PD-L1) expression in epithelial ovarian cancer (EOC). Ann Oncol. 2017;28(3):651–657. doi:10.1093/annonc/mdw625
37. Laumont CM, Wouters MCA, Smazynski J, et al. Single-cell profiles and prognostic impact of tumor-infiltrating lymphocytes coexpressing CD39, CD103, and PD-1 in ovarian cancer. Clin Cancer Res. 2021;27(14):4089–4100. doi:10.1158/1078-0432.CCR-20-4394
38. Xu R, Wu M, Liu S, et al. Glucose metabolism characteristics and TLR8-mediated metabolic control of CD4(+) Treg cells in ovarian cancer cells microenvironment. Cell Death Dis. 2021;12(1):22. doi:10.1038/s41419-020-03272-5
39. Wei J, Xie Q, Liu X, et al. Identification the prognostic value of glutathione peroxidases expression levels in acute myeloid leukemia. Ann Transl Med. 2020;8(11):678. doi:10.21037/atm-20-3296
40. Liu QF, Feng ZY, Jiang LL, Xu TT, Li SM, Liu KR. Immune cell infiltration as signatures for the diagnosis and prognosis of malignant gynecological tumors. Front Cell Develop Biol. 2021;9:702451. doi:10.3389/fcell.2021.702451
41. Liu R, Hu R, Zeng Y, Zhang W, Zhou HH. Tumour immune cell infiltration and survival after platinum-based chemotherapy in high-grade serous ovarian cancer subtypes: a gene expression-based computational study. EBioMedicine. 2020;51:102602. doi:10.1016/j.ebiom.2019.102602
42. Wei R, Qiu H, Xu J, et al. Expression and prognostic potential of GPX1 in human cancers based on data mining. Ann Transl Med. 2020;8(4):124. doi:10.21037/atm.2020.02.36
 © 2021 The Author(s). This work is published and licensed by Dove Medical Press Limited. The full terms of this license are available at https://www.dovepress.com/terms.php and incorporate the Creative Commons Attribution - Non Commercial (unported, v3.0) License.
By accessing the work you hereby accept the Terms. Non-commercial uses of the work are permitted without any further permission from Dove Medical Press Limited, provided the work is properly attributed. For permission for commercial use of this work, please see paragraphs 4.2 and 5 of our Terms.
© 2021 The Author(s). This work is published and licensed by Dove Medical Press Limited. The full terms of this license are available at https://www.dovepress.com/terms.php and incorporate the Creative Commons Attribution - Non Commercial (unported, v3.0) License.
By accessing the work you hereby accept the Terms. Non-commercial uses of the work are permitted without any further permission from Dove Medical Press Limited, provided the work is properly attributed. For permission for commercial use of this work, please see paragraphs 4.2 and 5 of our Terms.