")
Back to Journals » International Journal of General Medicine » Volume 15
Significance of T-Cell Subsets for Clinical Response to Peginterferon Alfa-2a Therapy in HBeAg-Positive Chronic Hepatitis B Patients
Authors Zhu L, Li J, Xu J, Chen F, Wu X, Zhu C
Received 31 December 2021
Accepted for publication 14 April 2022
Published 27 April 2022 Volume 2022:15 Pages 4441—4451
DOI https://doi.org/10.2147/IJGM.S356696
Checked for plagiarism Yes
Review by Single anonymous peer review
Peer reviewer comments 2
Editor who approved publication: Dr Scott Fraser
Li Zhu,1– 3,* Jin Li,4,5,* Junchi Xu,4,5 Fan Chen,2,3 Xunxun Wu,2,3 Chuanwu Zhu1– 3
1Department of Infectious Diseases, the Second Affiliated Hospital of Soochow University, Suzhou, Jiangsu, People’s Republic of China; 2Department of Hepatology, the Affiliated Infectious Diseases Hospital of Soochow University, Suzhou, Jiangsu, People’s Republic of China; 3Department of Hepatology, the Fifth People’s Hospital of Suzhou, Suzhou, Jiangsu, People’s Republic of China; 4Central Laboratory, the Affiliated Infectious Diseases Hospital of Soochow University, Suzhou, Jiangsu, People’s Republic of China; 5Central Laboratory, the Fifth People’s Hospital of Suzhou, Suzhou, Jiangsu, People’s Republic of China
*These authors contributed equally to this work
Correspondence: Chuanwu Zhu, Department of Infectious Diseases, the Second Affiliated Hospital of Soochow University, No. 1055 Sanxiang Road, Suzhou, 215004, People’s Republic of China, Email [email protected]
Introduction: The adaptive immune response may reflect the immunomodulatory efficacy during peginterferon alfa-2a (PEG-IFN α-2a) treatment in chronic hepatitis B (CHB) patients. We evaluated the predictive efficiency of T-cell subsets on patient’s response to PEG-IFN α-2a treatment.
Methods: The proportions of CD8+PD-1+, CD8+Tim-3+ and CD4+CD25high T-cells were measured at baseline and week 52 in CHB patients who underwent PEG-IFN α-2a treatment. The proportions of T-cell subsets were compared among different responders and non-responders (determined by biochemical, serological, and virological responses).
Results: The baseline proportions of the three T-cell subsets were significantly higher in CHB patients (65 cases) than in healthy controls (28 cases), while the proportions declined significantly after 52 weeks of PEG-IFN treatment. Responders (ALT < 40 IU/L, 89.2% [58/65]; HBV DNA < 2.7 log10 IU/ml, 66.2% [43/65]; and HBeAg seroconversion [SR], 53.9% [35/65]) experienced more pronounced declines in the proportion of T-cell subsets compared to non-responders. In particular, the baseline proportions of CD4+CD25high T-cells displayed significant difference between SR and non-SR groups. The stepwise logistic regression analysis identified that CD4+CD25high T-cells combined with baseline HBV DNA and ALT can predict SR and CR (ALT < 40 IU/L, HBV DNA < 2.7 log10 IU/mL and HBeAg seroconversion) after 52 weeks of PEG-IFN treatment with high accuracy.
Conclusion: PEG-IFN therapy induces significant declines in the proportion of some key T-cell subsets in HBeAg-positive patients. The model constructed with CD4+CD25high T-cells combined with ATL and HBV DNA may help to predict the efficacy of PEG-IFN α-2a therapy.
Keywords: PEG-IFN α-2a, chronic hepatitis B, clinical response, HBeAg seroconversion, T-cell subsets
Introduction
Hepatitis B virus (HBV) is a hepatotropic, partially double-stranded DNA virus that causes HBV infection in humans, which represents a major global health challenge.1–3 In 2019, it was reported that ~1.5 million people were newly diagnosed with chronic hepatitis B (CHB) infection (WHO, 2021). Currently, CHB infections are treated with two types of antiviral medications: IFN-α/PEG-IFN-α and nucleos(t)ide analogs.4 Nucleos(t)ide analogs directly suppress HBV replication and require a long course of treatment, while IFN-α therapy not only modulates interferon-stimulated genes (ISGs) but also possesses immunoregulatory activity, both of which are important for the elimination of HBV.5 PEG-IFN can induce a long-term off-treatment sustained response in about 25% of patients after a finite treatment course, especially in hepatitis B e antigen (HBeAg)-positive patients.6–8 For the duration of PEG-IFN α-2a treatment, it was reported that 48-week treatment led to higher rates of HBV DNA suppression and HBeAg seroconversion than 24-week treatment.9
There remains an urgent need to investigate promising predictors or novel biomarkers capable of accurately predicting the response of CHB patients to IFN-α therapy. It is well established that the host and viral factors, including on-treatment HBsAg quantification, baseline ALT and AST, HBV genotypes and HBV DNA levels, may influence and predict HBeAg seroconversion and sustained response to IFN-α treatment in HBeAg-positive patients.7,10–15 While, there is still a great need for development of novel biomarkers with higher prediction accuracy and convenient operation.
It is well recognized that the adaptive immune response plays a critical role in HBV clearance, while CHB patients display impaired and inhibitory HBV-specific T-cell function with persistent viraemia.16,17 As inhibitory receptors, programmed cell death protein 1 (PD-1) is the most highly expressed on exhausted T cells in patients with HBV infection.18,19 PD-L1 is one of the ligands for PD-1, which is normally found on cells within the liver, but its expression is increased in HBV-infected hepatocytes.20 In the course of chronic HBV infection, T-cell immunoglobulin domain and mucin domain 3 (Tim-3) are remarkably overexpressed on the surface of exhausted T cells, which can negatively regulate T-cell responses by promoting CD8+ T-cell exhaustion.21–24 CD8+Tim-3+PD-1+ T-cells are significantly more abundant in CHB patients with active rather than inactive disease.23 It was shown that the frequency of CD4+CD25+ T-cells increased significantly in CHB patients when compared with healthy controls and positively correlated with the levels of ALT and AST, both of which are indicators of the extent of liver injury.25
As an important first-line treatment option, PEG-IFN-α, the immunomodulator plays a critical role in the recovery of CHB patients, while the dynamics of some co-inhibitory molecules on T-cells during IFN-α treatment remains to be elucidated. Due to the importance of HBeAg seroconversion achieved in the treatment of HBeAg-positive CHB patients, the aim of this study was mainly to investigate the association among some key co-inhibitory molecules on T-cells with PEG-IFN therapy, and identify the predictive efficiency of certain co-inhibitory molecules for HBeAg serological response, which may be helpful to improve the personalized treatment during the antiviral therapy.
Materials and Methods
Study Participants
A total of 65 CHB patients hospitalized in the Fifth People’s Hospital of Suzhou during the year 2018 were enrolled in the study, all of them met the criteria of the guidelines of prevention and treatment for chronic hepatitis B,26 and were HBeAg-positive, had a serum HBV DNA load over 5 log10 IU/mL and an elevated serum ALT level 2–10 times the upper limit of normal (ULN, 40 IU/L). None of the patients received immunomodulator treatment, including immune enhancers or immunosuppressive agents, as well as antiviral agents including nucleos(t)ide analogs for at least 6 months before PEG-IFN-α therapy initiated. All patients were ruled out for co-infection with hepatitis A, C, D, or E viruses, as well as other liver diseases caused by alcohol, drug, autoimmunity, and so forth. All the patients received subcutaneous injection of PEG-IFN α-2a 180 µg once a week for 52 weeks. If HBV DNA load declines less than 2 log10 IU/mL compared to baseline level after 24 weeks of PEG-IFN α-2a treatment, entecavir (Baraclude) will be added on 0.5 mg once a day. During PEG-IFN α-2a treatment, liver function and blood cell counts were tested monthly, and HBV serological markers and HBV DNA load were tested every 3 months.
According to the responses of patients to PEG-IFN α-2a treatment, the enrolled patients were divided into the following groups: i) the groups of ALT < 40 IU/L and ≥ 40 IU/L; ii) the groups of HBV DNA < 2.7 log10 IU/mL (~500 copies/mL) and ≥ 2.7 log10 IU/mL group; and iii) the groups of HBeAg seroconversion and no HBeAg seroconversion. At week 52, the patients who achieved ALT < 40 IU/L or HBV DNA < 2.7 log10 IU/mL or HBeAg seroconversion were defined as responders, and the remaining patients were defined as non-responders. In addition, the serological response (SR) was defined as HBeAg seroconversion (the loss of HBeAg and the development of anti-HBe antibody), and combined response (CR) was defined as HBeAg seroconversion combined with ALT < 40 IU/L and HBV DNA < 2.7 log10 IU/mL at the end of treatment (at week 52).
Twenty-eight healthy controls were recruited from the Department of Physical Examination in our hospital. All of them had normal liver function and were tested negative for serum immunological markers of hepatitis B, C, and D virus infection. All participants provided written, informed consent before inclusion in the study. The study conforms to the ethical guidelines of the 1975 Declaration of Helsinki and was approved by the ethics committee of the Fifth People’s Hospital of Suzhou (No.2018–009).
Laboratory Measurements
Peripheral blood samples were collected from all participants before the initiation of PEG-IFN α-2a treatment. HBV serological markers (HBsAg, HBeAg, anti-HBs antibody, anti-HBe antibody, anti-HBc IgM and IgG) were detected using the Chemiluminescent Microparticle Immunoassay (Abbott Ireland, Sligo, Ireland). HBV DNA was quantified using quantitative PCR (Roche, Basel, Switzerland) with the detection range from 2.7 log10 to 8 log10 IU/mL. Biochemical tests, including serum ALT levels, were measured using an automatic biochemistry analyser (Hitachi, Tokyo, Japan).
Flow Cytometric Analysis
In order to isolate peripheral blood mononuclear cells (PBMCs) from each sample, 1 mL of heparinized whole blood from CHB patients or healthy controls was collected and subjected to Ficoll-Hypaque density gradient centrifugation. After centrifugation, PBMCs were collected and washed with FACS buffer (phosphate-buffered saline [PBS] containing 0.5% BSA, BD Biosciences). For T-cell staining, the collected PBMCs were stained with the following fluorochrome-conjugated anti-human antibodies: CD3-APC, CD8-FITC, PD-1-PE, Tim-3-PE, CD3-APC, CD4-PerCP and CD25-FITC (Biolegend, San Diego, CA, USA) for 30 min. The stained cells were then washed with FACS buffer (BD Biosciences) and resuspended in a Fixation/Permeabilization Solution (BD Biosciences), prior to being washed and resuspended with PBS, and acquired on a FACSCalibur flow cytometer (BD Biosciences). After gating, the proportions of CD3+CD8+PD-1+, CD3+CD8+Tim-3+ and CD3+CD4+CD25high cells were determined. The data were analyzed using FlowJo software (Tree Star, Ashland, OR, USA).
Statistical Analysis
The statistics and comparison of all data were conducted with GraphPad Prism 5.01 software. The gender composition was compared by chi-squared test between CHB patients and healthy controls. The normality analysis of the data was tested by KS normality test. Mann Whitney test was used for non-normal Gaussian distribution, and unpaired t test was used for normal Gaussian distribution. The correlation between age and three T-cell subsets was calculated using the Spearman rank correlation test. P value <0.05 was considered statistically significant. Stepwise logistic regression analysis was conducted with SPSS 18.0 software and used to determine the capacity of baseline factors in predicting the therapeutic effect of PEG-IFN therapy in CHB patients. The final predictors and parameters of the logistic regression were fitted with the maximum likelihood procedure. The area under the ROC curve (AUC) was calculated for the predictive model, and AUC values closer to 1 indicated higher prediction accuracy. According to the optimization combination of sensitivity and specificity, the best cutoff value of combined indicators was determined.
Results
Patient Cohort and Clinical Characteristics
A total of 65 CHB patients were enrolled and received PEG-IFN α-2a therapy for 52 weeks. At week 52, 58 cases of patients (89.2%) achieved ALT level lower than ULN (<40 IU/L) and 7 cases (10.8%) remained an elevated ALT level (≥40 IU/L); 43 (66.2%) achieved HBV DNA load <2.7 log10 IU/mL (of them, 3 cases added on to entecavir treatment at week 24), while 22 (33.8%) still ≥2.7 log10 IU/mL; and 32 (49.2%) achieved SR and 3 (4.6%) were HBeAg-negative but without development of anti-HBe antibody. The remaining 30 (46.2%) were still HBeAg-positive. Of the patients who achieved SR, 34 cases (52.3%) achieved CR.
The baseline characteristics of the enrolled CHB patients are shown in Table 1, including gender, age, baseline levels of ALT and HBV DNA, haematological cells and hemoglobin, and the frequencies of CD8+PD-1+, CD8+Tim-3+ and CD4+CD25high T-cells. The CHB patient and healthy control groups were matched for gender and age, showing no statistical differences in these parameters between the two groups (P > 0.05). Among the variables of T-cell subsets, the frequencies of CD8+PD-1+, CD8+Tim-3+ and CD4+CD25high T-cells were significantly different between CHB and control groups (P < 0.05), which were all higher in CHB patients group than those in healthy controls (P < 0.05).
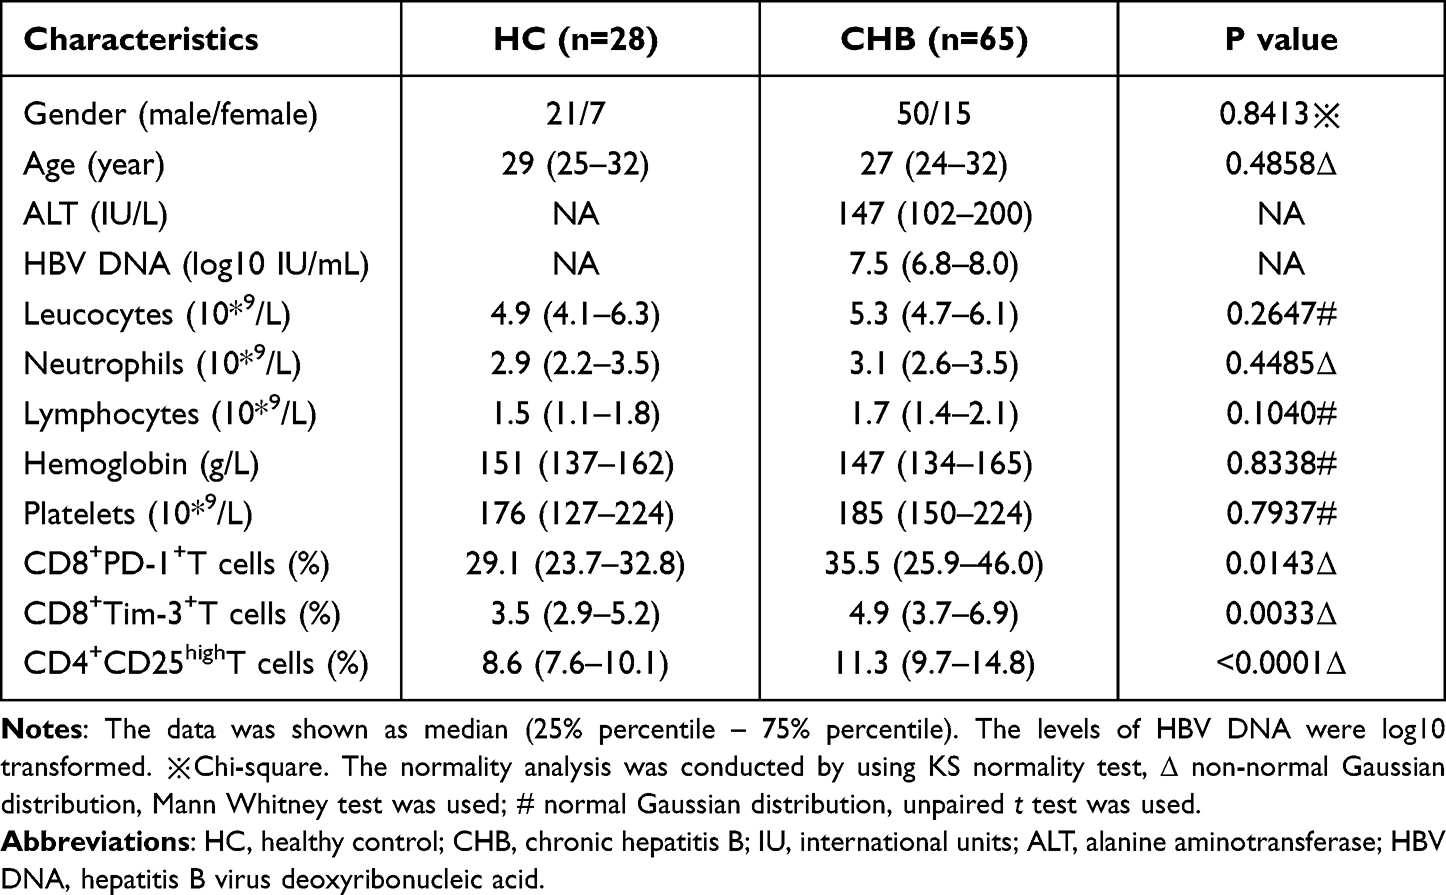 |
Table 1 Baseline Characteristics of the Enrolled Cohort |
During PEG-IFN treatment, no patients had interrupted antiviral therapy due to adverse events. Besides the flu-like symptoms at the start of treatment, the most common adverse events were neutropenia, thrombocytopenia, and so forth. Recombinant human granulocyte colony stimulating factor (rhG-CSF) 100 μg would be injected subcutaneously if the count of neutrophils decreased less than 0.75 × 10*9/L. And likewise, recombinant human interleukin 11 (rhIL-11) 1.5 mg would be injected subcutaneously if the count of platelets declined less than 50 × 10*9/L. 2 patients were just treated with PEG-IFN dose reduction (135 µg). Changes in haematological cells and hemoglobin at baseline and at the end of treatment (EOT) can be seen in Table 2.
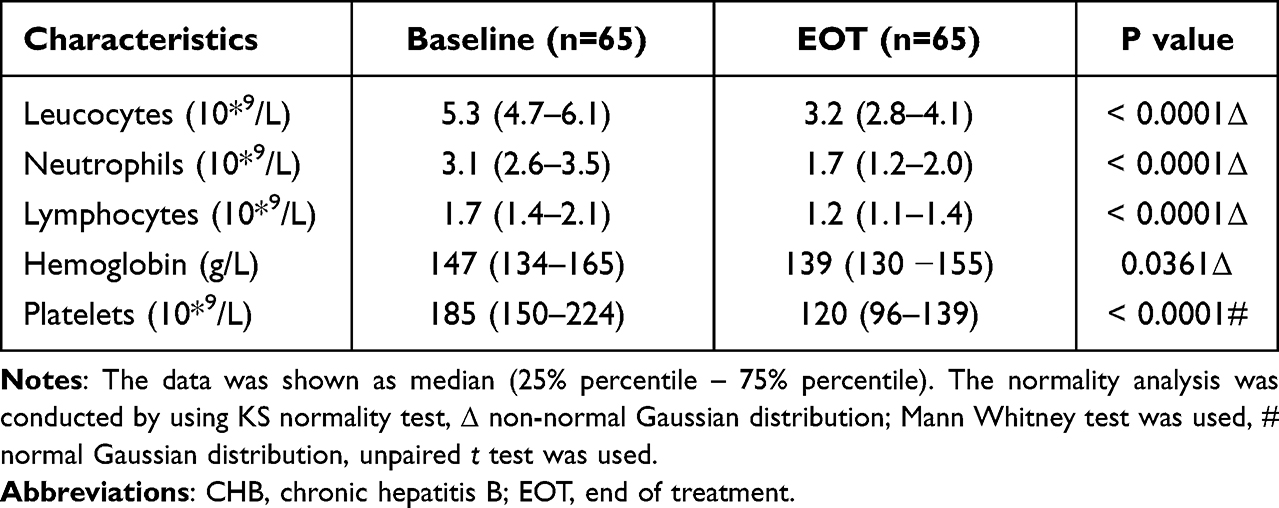 |
Table 2 The Comparison of Haematological Values Between the Levels at Baseline and EOT in Enrolled CHB Patients |
PEG-IFN α-2a Therapy Can Modulate the Proportions of T-Cell Subsets in the Peripheral Blood of CHB Patients
In order to clarify the correlation between the efficacy of PEG-IFN treatment and the expression of T-cell subsets in the peripheral blood of CHB patients, the expression ratios of CD8+PD-1+, CD8+Tim-3+ and CD4+CD25high T-cells were analyzed before and after PEG-IFN treatment. The data showed that the ratio of CD8+PD-1+ T-cells declined slightly after treatment but without statistical significance compared to that before therapy (Figure 1A); the proportions of CD8+Tim-3+ and CD4+CD25high T-cell subsets, however, were significantly decreased after PEG-IFN α-2a treatment (Figure 1B and C). Compared to healthy controls, the frequencies of CD8+PD-1+, CD8+Tim-3+ and CD4+CD25high T-cells were all higher in CHB patient group before PEG-IFN α-2a treatment, while the proportions of the three T-cells subsets at the end of treatment were not significantly different between the two groups, respectively (Figure 1A-C).
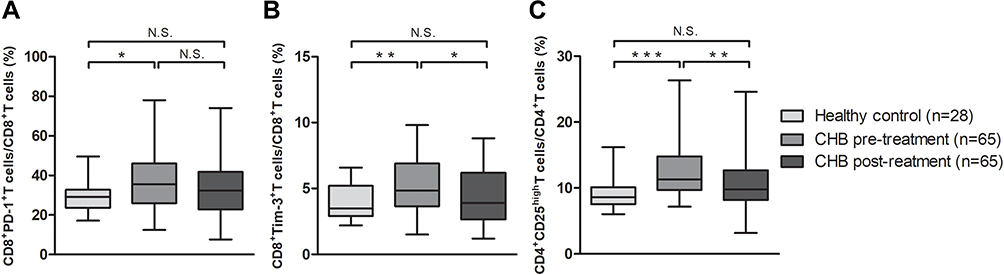 |
Figure 1 PEG-IFN alfa-2a therapy can modulate the proportions of T-cell subsets in the peripheral blood of CHB patients. Comparison of the proportions of CD8+PD-1+T-cells (A), CD8+Tim-3+T-cells (B) and CD4+CD25highT-cells (C) among healthy controls and CHB patients before and after treatment. The lines in the boxes represent median values, and the deviation bars represent min to max. N.S., p>0.05; *, p<0.05; **, p<0.01; ***, p<0.001. |
The Proportions of T-Cell Subsets Significantly Decreased in CHB Patients with ALT < 40 IU/L at Week 52
In order to further analyze the association of the T-cell subsets with biochemical response to PEG-IFN therapy, the enrolled 65 CHB patients were divided into two groups based on ALT < 40 or ≥40 IU/L at week 52. In ALT < 40 IU/L group (n = 58), the frequency of CD8+PD-1+ T-cells did not show an obvious change with treatment (Figure 2A), while the proportions of CD8+Tim-3+ and CD4+CD25high T-cells were significantly decreased (Figure 2B and C). In the group of ALT > 40 IU/L (n = 7), however, the proportions of the three T-cell subsets presented no significant difference before and after PEG-IFN treatment (Figure 2). Furthermore, it was found that the proportion of CD4+CD25high T-cells was lower in ALT < 40 IU/L group than in ≥40 IU/L group after treatment (Figure 2C).
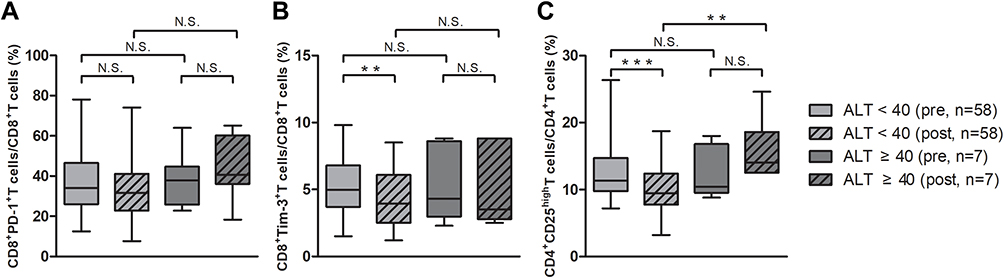 |
Figure 2 The proportions of T-cell subsets significantly decreased in CHB patients with ALT < 40 IU/L at week 52. Comparison of the proportions of CD8+PD-1+ T-cells (A), CD8+TIM-3+ T-cells (B) and CD4+CD25highT-cells (C) before and after treatment between ALT < 40 and > 40 IU/L groups. The lines in the boxes represent median values, and the deviation bars represent min to max. N.S., p>0.05; **, p<0.01; ***, p<0.001. |
The Proportions of T-cell Subsets Significantly Decreased in CHB Patients with HBV DNA < 2.7 log10 IU/mL at Week 52
To evaluate the association of the three T-cell subsets with virological response to PEG-IFN treatment, two groups of HBV DNA < 2.7 and ≥2.7 log10 IU/mL were divided according to patient’s HBV DNA levels at week 52. The data showed that the ratio of CD8+PD-1+, CD8+Tim-3+ and CD4+CD25high T-cells significantly decreased in the group of HBV DNA < 2.7 log10 IU/mL (n = 43), respectively (Figure 3A-C). The proportions of the three T-cell subsets, however, showed no significant difference in HBV DNA ≥ 2.7 log10 IU/mL group (n = 22) before and after treatment (Figure 3). Meanwhile, the proportion of CD8+PD-1+ and CD4+CD25high T-cells was significantly higher in HBV DNA ≥ 2.7 IU/mL group than in <2.7 log10 IU/mL group at the end of treatment, respectively (Figure 3A and C).
 |
Figure 3 The proportions of T-cell subsets significantly decreased in CHB patients with HBV DNA < 2.7 log10 IU/mL at week 52. Comparison of the proportions of CD8+PD-1+ T-cells (A), CD8+TIM-3+ T-cells (B) and CD4+CD25highT-cells (C) before and after treatment between HBV DNA < 2.7 log10 and ≥ 2.7 log10 IU/mL groups. The lines in boxes represent median values, and the deviation bars represent min to max. N.S., p>0.05; *, p<0.05; **, p<0.01; ***, p<0.001. |
The Proportions of T-Cell Subsets Significantly Decreased in CHB Patients Achieved SR at Week 52
A response to achieve HBeAg seroconversion is a key efficacious indicator of PEG-IFN therapy for HBeAg-positive patients. Based on the loss of HBeAg and the development of anti-HBe antibody after treatment, 35 patients achieved SR and the remaining 30 were classified as non-responders. For SR group, the proportions of CD8+PD-1+, CD8+Tim-3+ and CD4+CD25high T-cells significantly decreased after 52 weeks of treatment (Figure 4A-C). The expressions of PD-1, Tim-3 on CD8+ and CD25 on CD4+ T-cells were remarkably down-regulated in responders than in non-responders. Importantly, the baseline proportion of CD4+CD25high T-cells was higher in SR group (n = 35) than in non-SR group (n = 30) (Figure 4C). In addition, the proportions of the three T-cell subsets were significantly higher in no-SR group than in SR group after treatment (Figure 4A-C).
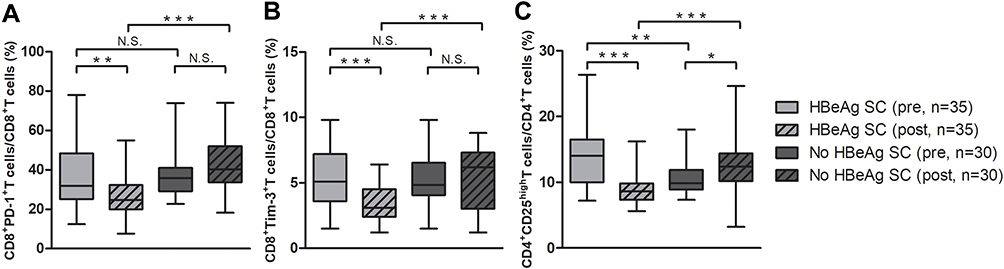 |
Figure 4 The proportions of T-cell subsets significantly decreased in CHB patients achieved SR at week 52. Comparison of the proportions of CD8+PD-1+ T-cells (A), CD8+Tim-3+ T-cells (B) and CD4+CD25highT-cells (C) before and after treatment between HBeAg seroconversion (SC) and no HBeAg SC groups. The lines in boxes represent median values, and the deviation bars represent min to max. N.S., p>0.05; *, p<0.05; **, p<0.01; ***, p<0.001. |
Performance of the Key T-cell Subsets Combined with Clinical Characteristics in Predicting the Response to PEG-IFN α-2a Treatment
From the above, the data showed that the CD8+PD-1+, CD8+Tim-3+ and CD4+CD25high T-cells subsets may influence the response of CHB patients to PEG-IFN treatment. In order to clearly clarify the association of these T-cell subsets with the efficacy of PEG-IFN therapy, the correlation between T-cell subsets and clinical characteristics of CHB patients was analyzed. Our results showed that the baseline levels of ALT were negatively correlated with CD8+PD-1+ and CD4+CD25high T-cells after treatment (Figure 5A and B). And, the baseline levels of HBV DNA were positively correlated with CD8+PD-1+, CD8+Tim-3+ and CD4+CD25high T-cells after treatment (Figure 5C-E). In addition, the baseline proportions of CD4+CD25high T-cells were positively correlated with baseline levels of ALT (Figure 5F) and negatively correlated with baseline HBV DNA, CD8+PD-1+, and CD8+Tim-3+ T-cells after treatment (Figure 5G-I).
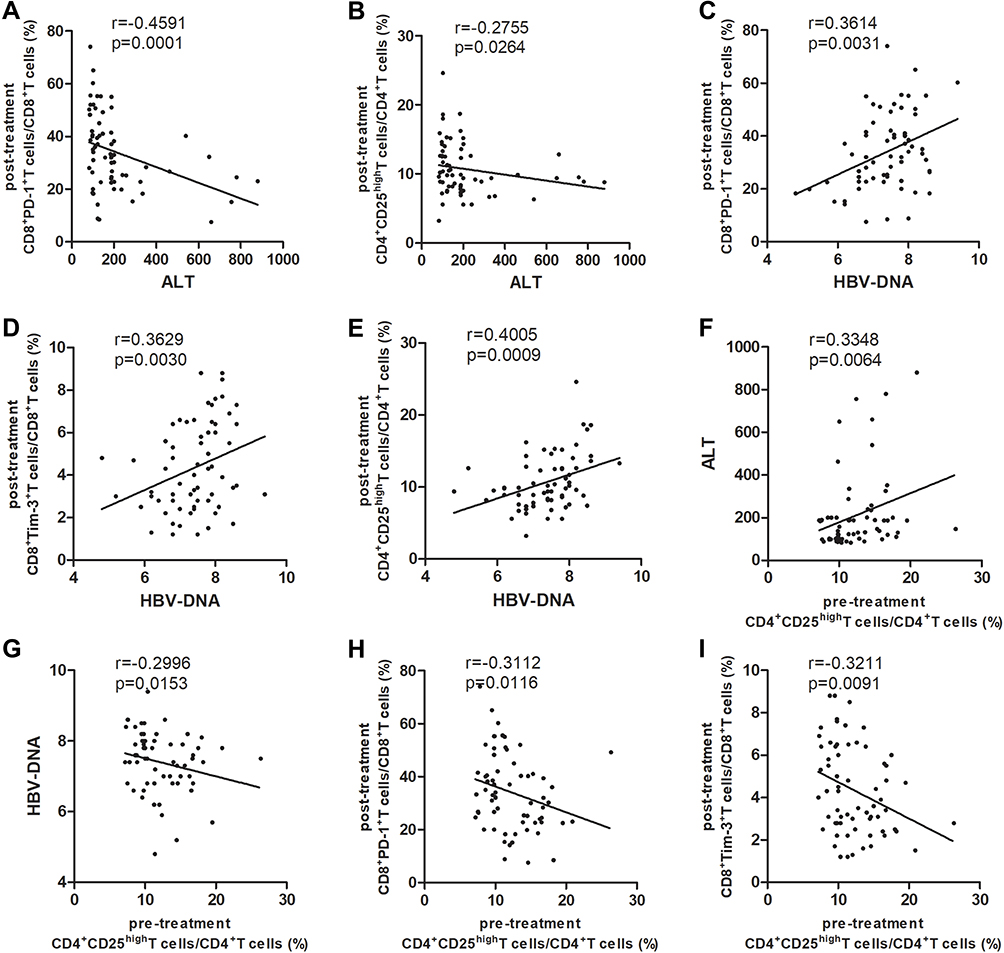 |
Figure 5 The correlation analysis was displayed between T-cell subsets and clinical characteristics of CHB patients with PEG-IFN therapy. Correlation between baseline ALT level and T-cell subsets at EOT (A and B); correlation between baseline HBV DNA load and T-cell subsets at EOT (C-E); and correlation between the baseline proportions of CD4+CD25highT-cells and baseline ALT and HBV DNA levels as well as the proportions of CD8+PD-1+ and CD8+Tim-3+ T-cells at EOT (F-I). P values were calculated using Spearman test, and r represents correlation coefficient. |
Based on the dynamics of T-cells subsets during PEG-IFN treatment and the correlation between T-cell subsets with clinical characteristics, baseline levels of ALT, HBV DNA and the key T-cell subsets were further analyzed for the prediction of PEG-IFN α-2a therapy. Stepwise logistic regression analysis led to the final identification of baseline proportions of CD4+CD25high T-cells, baseline ALT and HBV DNA as independent constituents of predictive model for CHB patients achieving SR. As candidate models, all the predictive efficiency of the models were displayed and compared in Table 3. Considering the sensitivity, specificity, simplification and the value of AUC, the combined model consisting of ATL, HBV DNA and CD4+CD25high T-cells was definitely the best predictive model for our study.
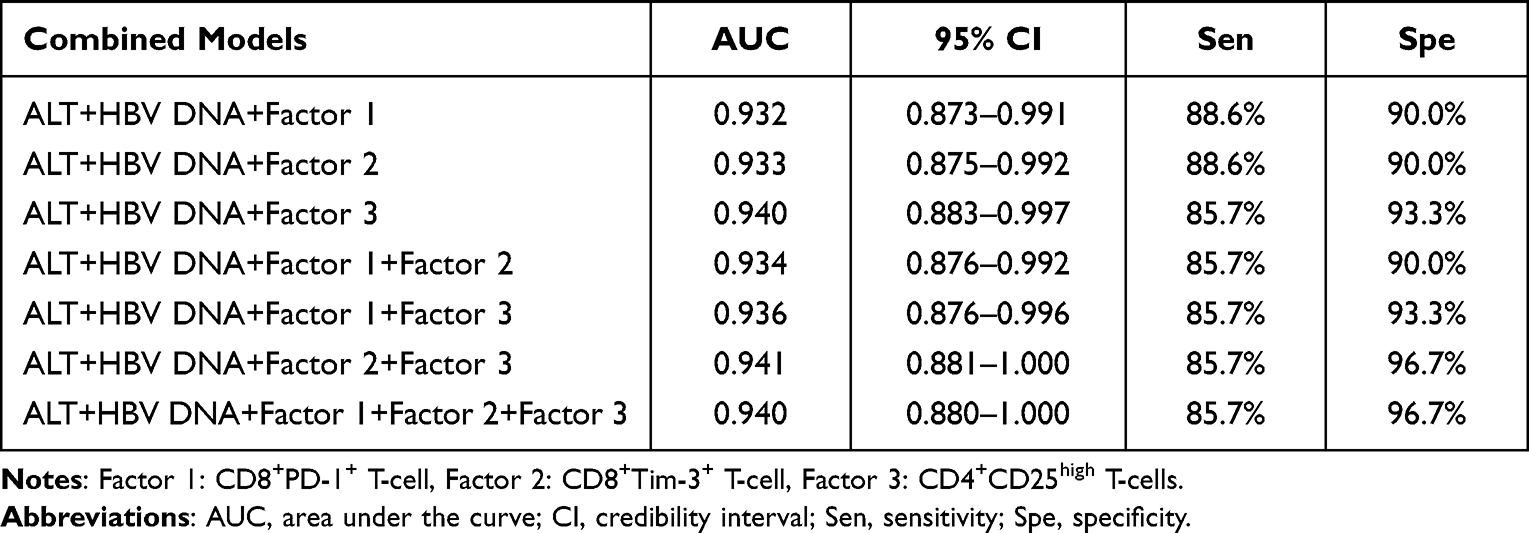 |
Table 3 The Predictive Efficiency of Candidate Combined Models for CHB Patients Achieving Serological Response |
The selected model for the prediction of SR, logit (p) = 5.572 + 0.028 * ALT + 0.178 * CD4+CD25high T-cells - 1.583 * HBV DNA, yielded the predictive value of 0.940 (95% CI, 0.883 to 0.997; sensitivity = 85.7%, specificity = 93.3%) (Figure 6A). Besides, for the prediction of CR at week 52, logit (p) = 10.852 + 0.006 * ALT + 0.158 * CD4+CD25high T-cells - 1.848 * HBV DNA (0.903, 0.828 to 0.979; sensitivity = 79.4%, specificity = 93.5%) (Figure 6B). In clinical practice, the combined model may guide clinicians in predicting the possible response to PEG-IFN therapy. If 0.028 * ALT + 0.178 * CD4+CD25high T-cells - 1.583 * HBV DNA ≥ −5.13, the patient can be predicted to achieve SR. And, if 0.006 * ALT + 0.158 * CD4+CD25high T-cells - 1.848 * HBV DNA ≥ −10.256, the patient can be predicted to achieve CR. Collectively, the predictive model consisting of CD4+CD25high T-cells and baseline ALT and HBV DNA could be used to improve personalized treatment for HBeAg-positive patients.
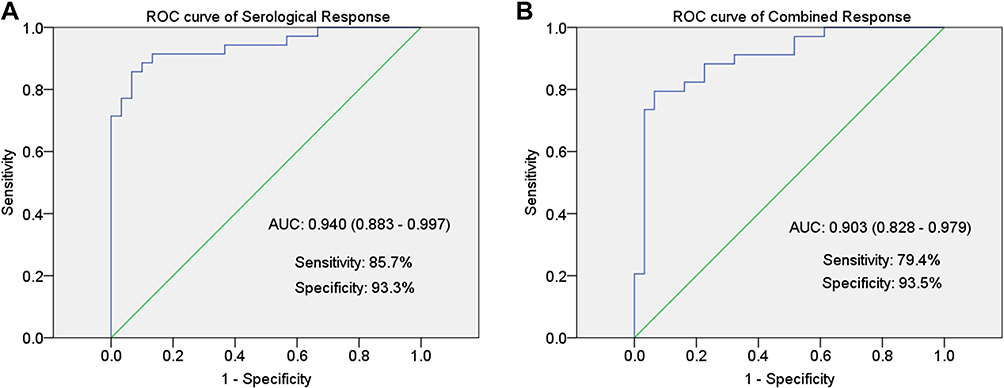 |
Figure 6 The performance of the key T-cell subsets combined with clinical characteristics in predicting the response to PEG-IFN treatment. Receiver operating characteristic (ROC) curve analysis was analyzed for the prediction of serological response (A) and combined response (B) to PEG-IFN. Area under curve (AUC) depicts the predictive power of the combined model. The green line represents the AUC reference line at 0.5. |
Discussion
Several studies have demonstrated that CHB patients display weak T-cell proliferation and have higher levels of inhibitory molecules in T-cells.27,28 It was found that the dysfunction of HBV specific CD8+ T-cells in CHB patients is closely related to the up-regulation of inhibitory molecules on HBV-specific CD8+ T-cells.16,23 The blockade of the PD-1/PD-L1 axis has been proven to help reverse T-cell exhaustion and improve specific anti-HBV T-cell responses, which have been evaluated as potential therapeutic strategy.28–34 It was also established that appropriate stimulation may enhance the function of HBV-specific CD8+ T cells in immune-tolerant phase of CHB patients.35 It was reported IFN-α/γ stimulation augmented PD-L1 expression on hepatocytes in vitro, which induced T-cell apoptosis.36,37
In order to clarify the immunomodulatory effect of PEG-IFN treatment on adaptive immune response, our study focused on CD8+PD-1+, CD8+Tim-3+ and CD4+CD25high T-cells in the peripheral blood of HBeAg-positive CHB patients. The baseline frequencies of these T-cells were higher in CHB patient group than in healthy controls. At week 52, the proportions of these T-cell subsets decreased and showed no difference with healthy controls. The frequencies of CD8+Tim-3+ and CD4+CD25high T-cells in ALT < 40 IU/L group were significantly lower at the end of treatment. Similarly, CD8+PD-1+, CD8+Tim-3+ and CD4+CD25high T-cells significantly decreased both in HBV DNA < 2.7 log10 IU/mL group and SR group, while these changes could not be seen in non-responders. Overall, we revealed that the baseline frequencies of CD4+CD25high T-cells combined with baseline ALT and HBV DNA can reliably predict SR and CR in HBeAg-positive patients with optimal efficiency.
Our results suggest that PEG-IFN treatment can decrease the proportion of the three T-cell subsets in the peripheral blood of CHB patients, and the T-cell subsets decline may further contribute to the efficacy of PEG-IFN therapy. Our data are consistent with a previous study that more CD4+CD25+ and CD8+PD-1+ T-cells were detected in CHB patients than in healthy controls, and the treatment with telbivudine could reduce the number of these cells in CHB patients.38 Moreover, it was demonstrated that the percentages of circulating CD8+PD-1+ T-cells and CD4+CD25+ T-cells were significantly higher in CHB group than in healthy controls.25,39 Meanwhile, the expression levels of PD-1 on CD8+ T-cells in the prior-treatment group were significantly higher than in the post-treatment and healthy control groups.40 These studies demonstrate that antiviral treatment correlates with the expression of costimulatory molecules on T-cells and may restore cellular immune response by modulating T-cell phenotypes of CHB patients.
Our study shows that the expression of costimulatory molecules on CD8+ and CD4+ T-cells significantly correlates with the treatment response to PEG-IFN in CHB patients, and that the lower CD8+PD-1+, CD8+Tim-3+ and CD4+CD25high T-cells were significantly associated with an improved response to PEG-IFN treatment, suggesting the key regulatory roles of these T-cell subsets in determining the efficacy of PEG-IFN treatment. The results have shown that the percentage of CD8+PD-1+ T-cells in CHB patients was positively correlated with serum HBV load and ALT level.39 It was also demonstrated that both CD4+CD25+T-cell numbers and PD-L1 expression on Tregs were positively correlated with ALT and AST levels.25 The results imply that specific T-cell subsets may potentially predict the efficacy of IFN-α treatment.
It has been reported that the immunomodulatory effect of IFN-α treatment results in a decrease in intrahepatic cccDNA, and the cccDNA level is a valid predictor of a sustained response at the end of treatment.41–43 Microarray analysis of intrahepatic mRNA profiles identified a list of candidate genes associated with enhanced immune activation, which can predict the sustained response to IFN-α therapy.44 Furthermore, Jin et al. have reported that a model composed of circulating microRNAs and ALT can predict the early virological response of IFN-α therapy in training phase and validation phase.4 However, clinical utility is limited because these can only be assessed invasively.
Song et al showed that on-treatment HBsAg quantification predicted off-treatment CR (HBeAg seroconversion combined with HBV DNA level <2000 IU/mL) after 48 weeks of PEG-IFN therapy.14 Based on a total of 474 IFN-α treated HBeAg-positive CHB patients, Mao et al. demonstrated that ALT, HBV DNA level, AST, HBV genotype, activity grading (G) of intrahepatic inflammation, score (S) of liver fibrosis, age and gender were the most significant baseline predictive factors.15 Wang et al. also reported that baseline ALT level was associated with HBeAg seroconversion, while baseline HBsAg levels of <250 IU/mL and HBV DNA <2.5 × 10⁷ IU/mL were strongly associated with sustained off-treatment response.45 Patients who do not experience HBsAg levels decline during the first 3 months of therapy have a low chance of achieving response (<5%) and no chance of HBsAg loss and should be advised to discontinue therapy.46 Our study may provide an early model for predicting the clinical response to PEG-IFN therapy.
In summary, we identified baseline levels of ALT and HBV DNA, CD4+CD25high T-cell as reliable predictors of PEG-IFN efficacy in the context of CHB patients. Models constructed with three variables may provide a promising tool for the assessment of the efficacy of PEG-IFN therapy with high value of AUC. However, there are still some shortcomings in our research, which will be further investigated in future. Firstly, we will focus on the measurement of the T-cell subsets at more time points during the treatment, including week 4, 12, 24, 48 and even more, in order to demonstrate the response of patient’s treatment with the changing trend of these T-cell subsets, especially in the early stage of treatment. Second, more detailed clinical data, including HBV genotype, on-treatment quantification of HBsAg and HBeAg levels will be detected. Finally, the training phase and validation phase will be constructed to improve the predictive model.
Conclusion
In conclusion, the baseline levels of CD8+PD-1+, CD8+Tim-3+ and CD4+CD25high T-cells are higher in the peripheral blood of CHB patients than in healthy controls. At week 52 of the treatment, the frequencies of the three T-cell subsets were significantly decreased in responders to PEG-IFN therapy. In particular, it was demonstrated that baseline frequencies of CD4+CD25high T-cells combined with baseline HBV DNA and ALT can reliably predict the efficacy of PEG-IFN α-2a treatment. Therefore, this study provides a clinical clue for exploring the dynamics of adaptive immune response during PEG-IFN treatment, some of which may become new targets for establishing the predictive model for the clinical response of PEG-IFN α-2a treatment in HBeAg-positive CHB patients.
Acknowledgment
Li Zhu and Jin Li are co-first authors for this study. We thank all the patients, clinicians, and support staff who participated in this study.
Funding
This study was supported by the Health Talent Project of Suzhou (grant number GSWS2019068); the Science and Technology Plan of Suzhou (grant number SYS2019110); the Science and Education Project of Suzhou (grant number kjxw2018045); and the National Natural Science Foundation of China (grant number 81902054 and 82172252).
Disclosure
The authors declare that they have no conflicts of interest in this work.
References
1. Zhang W, Chen J, Wu M, et al. PRMT5 restricts hepatitis B virus replication through epigenetic repression of covalently closed circular DNA transcription and interference with pregenomic RNA encapsidation. Hepatology. 2017;66(2):398–415.
2. Wang S, Chen Z, Hu C, et al. Hepatitis B virus surface antigen selectively inhibits TLR2 ligand-induced IL-12 production in monocytes/macrophages by interfering with JNK activation. Journal of Immunology. 2013;190(10):5142–5151.
3. Wu M, Wang C, Shi B, et al. A novel recombinant cccDNA-based mouse model with long term maintenance of rcccDNA and antigenemia. Antiviral Res. 2020;180:104826.
4. Li J, Zhang X, Chen L, et al. Circulating miR-210 and miR-22 combined with ALT predict the virological response to interferon-alpha therapy of CHB patients. Sci Rep. 2017;7(1):15658.
5. Zhang X, Chen C, Wu M, et al. Plasma microRNA profile as a predictor of early virological response to interferon treatment in chronic hepatitis B patients. Antivir Ther. 2012;17(7):1243–1253.
6. Buster EH, Flink HJ, Cakaloglu Y, et al. Sustained HBeAg and HBsAg loss after long-term follow-up of HBeAg-positive patients treated with peginterferon alpha-2b. Gastroenterology. 2008;135(2):459–467.
7. Janssen HL, van Zonneveld M, Senturk H, et al. Pegylated interferon alfa-2b alone or in combination with lamivudine for HBeAg-positive chronic hepatitis B: a randomised trial. Lancet. 2005;365(9454):123–129.
8. Lau GK, Piratvisuth T, Luo KX, et al. Peginterferon Alfa-2a, lamivudine, and the combination for HBeAg-positive chronic hepatitis B. N Engl J Med. 2005;352(26):2682–2695.
9. Chon YE, Kim DJ, Kim SG, et al. An Observational, Multicenter, Cohort Study Evaluating the Antiviral Efficacy and Safety in Korean Patients With Chronic Hepatitis B Receiving Pegylated Interferon-alpha 2a (Pegasys): TRACES Study. Medicine. 2016;95(14):3026.
10. Bonino F, Marcellin P, Lau GK, et al. Predicting response to peginterferon alpha-2a, lamivudine and the two combined for HBeAg-negative chronic hepatitis B. Gut. 2007;56(5):699–705.
11. Buster EH, Hansen BE, Lau GK, et al. Factors that predict response of patients with hepatitis B e antigen-positive chronic hepatitis B to peginterferon-alfa. Gastroenterology. 2009;137(6):2002–2009.
12. Kao JH. Hepatitis B viral genotypes: clinical relevance and molecular characteristics. J Gastroenterol Hepatol. 2002;17(6):643–650.
13. Tujios SR, Lee WM. Update in the management of chronic hepatitis B. Curr Opin Gastroenterol. 2013;29(3):250–256.
14. Yang S, Xing H, Wang Y, et al. HBsAg and HBeAg in the prediction of a clinical response to peginterferon α-2b therapy in Chinese HBeAg-positive patients. Virol J. 2016;13(1):016–0640.
15. Mao QG, Pan JS, Fang KN, et al. Precise prediction model and simplified scoring system for sustained combined response to interferon-alpha. World j Gastroenterol. 2010;16(27):3465–3471.
16. Peng G, Li S, Wu W, et al. PD-1 upregulation is associated with HBV-specific T cell dysfunction in chronic hepatitis B patients. Mol Immunol. 2008;45(4):963–970.
17. Park JJ, Wong DK, Wahed AS, et al. Hepatitis B Virus–Specific and Global T-Cell Dysfunction in Chronic Hepatitis B. Gastroenterology. 2016;150(3):684–695.
18. Boni C, Fisicaro P, Valdatta C, et al. Characterization of hepatitis B virus (HBV)-specific T-cell dysfunction in chronic HBV infection. J Virol. 2007;81(8):4215–4225.
19. Fisicaro P, Valdatta C, Massari M, et al. Antiviral intrahepatic T-cell responses can be restored by blocking programmed death-1 pathway in chronic hepatitis B. Gastroenterology. 2010;138(2):682–693.
20. Chen J, Wang XM, Wu XJ, et al. Intrahepatic levels of PD-1/PD-L correlate with liver inflammation in chronic hepatitis B. Inflamm Res. 2011;60(1):47–53.
21. Chen L, Flies DB. Molecular mechanisms of T cell co-stimulation and co-inhibition. Nat Rev Immunol. 2013;13(4):227–242.
22. Raziorrouh B, Schraut W, Gerlach T, et al. The immunoregulatory role of CD244 in chronic hepatitis B infection and its inhibitory potential on virus-specific CD8+ T-cell function. Hepatology. 2010;52(6):1934–1947.
23. Mohammadizad H, Shahbazi M, Hasanjani Roushan MR, et al. TIM-3 as a marker of exhaustion in CD8(+) T cells of active chronic hepatitis B patients. Microb Pathog. 2019;128:323–328.
24. Sakuishi K, Jayaraman P, Behar SM, et al. Emerging Tim-3 functions in antimicrobial and tumor immunity. Trends Immunol. 2011;32(8):345–349.
25. Feng C, Cao LJ, Song HF, et al. Expression of PD-L1 on CD4+CD25+Foxp3+ Regulatory T Cells of Patients with Chronic HBV Infection and Its Correlation with Clinical Parameters. Viral Immunol. 2015;28(8):418–424.
26. Hou J, Wang G, Wang F, et al. Guideline of Prevention and Treatment for Chronic Hepatitis B (2015 Update). J Clin Transl Hepatol. 2017;5(4):297–318.
27. Park JJ, Wong DK, Wahed AS, et al. Hepatitis B Virus–Specific and Global T-Cell Dysfunction in Chronic Hepatitis B. Gastroenterology. 2016;150(3):684–695 e685.
28. Schurich A, Pallett LJ, Lubowiecki M, et al. The third signal cytokine IL-12 rescues the antiviral function of exhausted HBV-specific CD8 T cells. PLoS Pathog. 2013;9(3):14.
29. Maier H, Isogawa M, Freeman GJ, et al. PD-1:PD-L1 interactions contribute to the functional suppression of virus-specific CD8+ T lymphocytes in the liver. Journal of Immunology. 2007;178(5):2714–2720.
30. Zhang E, Zhang X, Liu J, et al. The expression of PD-1 ligands and their involvement in regulation of T cell functions in acute and chronic woodchuck hepatitis virus infection. PLoS One. 2011;6(10):14.
31. Fisicaro P, Valdatta C, Massari M, et al. Combined blockade of programmed death-1 and activation of CD137 increase responses of human liver T cells against HBV, but not HCV. Gastroenterology. 2012;143(6):1576–1585.
32. Gane EJ. Future anti-HBV strategies. Liver International. 2017;1:40–44.
33. Cox MA, Nechanitzky R, Mak TW. Check point inhibitors as therapies for infectious diseases. Curr Opin Immunol. 2017;48:61–67.
34. Gane E, Verdon DJ, Brooks AE, et al. Anti-PD-1 blockade with nivolumab with and without therapeutic vaccination for virally suppressed chronic hepatitis B: a pilot study. J Hepatol. 2019;71(5):900–907.
35. Sung PS, Park DJ, Kim JH, et al. Ex vivo Detection and Characterization of Hepatitis B Virus-Specific CD8(+) T Cells in Patients Considered Immune Tolerant. Front Immunol. 2019;10:1319.
36. Mühlbauer M, Fleck M, Schütz C, et al. PD-L1 is induced in hepatocytes by viral infection and by interferon-alpha and -gamma and mediates T cell apoptosis. J Hepatol. 2006;45(4):520–528.
37. Liu L, Hou J, Xu Y, et al. PD-L1 upregulation by IFN-α/γ-mediated Stat1 suppresses anti-HBV T cell response. PLoS One. 2020;15(7):e0228302.
38. Ma L, Cai YJ, Yu L, et al. Treatment with telbivudine positively regulates antiviral immune profiles in Chinese patients with chronic hepatitis B. Antimicrob Agents Chemother. 2013;57(3):1304–1311.
39. Xu P, Chen YJ, Chen H, et al. The expression of programmed death-1 in circulating CD4+ and CD8+ T cells during hepatitis B virus infection progression and its correlation with clinical baseline characteristics. Gut Liver. 2014;8(2):186–195.
40. Wang L, Zhao C, Peng Q, et al. Expression levels of CD28, CTLA-4, PD-1 and Tim-3 as novel indicators of T-cell immune function in patients with chronic hepatitis B virus infection. Biomedical Rep. 2014;2(2):270–274.
41. Craxi A, Cooksley WG. Pegylated interferons for chronic hepatitis B. Antiviral Res. 2003;60(2):87–89.
42. Wursthorn K, Lutgehetmann M, Dandri M, et al. Peginterferon alpha-2b plus Adefovir induce strong cccDNA decline and HBsAg reduction in patients with chronic hepatitis B. Hepatology. 2006;44(3):675–684.
43. Sung JJ, Wong ML, Bowden S, et al. Intrahepatic hepatitis B virus covalently closed circular DNA can be a predictor of sustained response to therapy. Gastroenterology. 2005;128(7):1890–1897.
44. Jansen L, de Niet A, Makowska Z, et al. An intrahepatic transcriptional signature of enhanced immune activity predicts response to peginterferon in chronic hepatitis B. Liver International. 2015;35(7):1824–1832.
45. Wang YC, Yang SS, Su CW, et al. Predictors of response to pegylated interferon in chronic hepatitis B: a real-world hospital-based analysis. Sci Rep. 2016;6:29605.
46. Sonneveld MJ, Rijckborst V, Boucher CA, et al. Prediction of sustained response to peginterferon alfa-2b for hepatitis B e antigen-positive chronic hepatitis B using on-treatment hepatitis B surface antigen decline. Hepatology. 2010;52(4):1251–1257.
 © 2022 The Author(s). This work is published and licensed by Dove Medical Press Limited. The full terms of this license are available at https://www.dovepress.com/terms.php and incorporate the Creative Commons Attribution - Non Commercial (unported, v3.0) License.
By accessing the work you hereby accept the Terms. Non-commercial uses of the work are permitted without any further permission from Dove Medical Press Limited, provided the work is properly attributed. For permission for commercial use of this work, please see paragraphs 4.2 and 5 of our Terms.
© 2022 The Author(s). This work is published and licensed by Dove Medical Press Limited. The full terms of this license are available at https://www.dovepress.com/terms.php and incorporate the Creative Commons Attribution - Non Commercial (unported, v3.0) License.
By accessing the work you hereby accept the Terms. Non-commercial uses of the work are permitted without any further permission from Dove Medical Press Limited, provided the work is properly attributed. For permission for commercial use of this work, please see paragraphs 4.2 and 5 of our Terms.