")
Back to Journals » Cancer Management and Research » Volume 12
Signatures of Mucosal Microbiome in Oral Squamous Cell Carcinoma Identified Using a Random Forest Model
Authors Zhou J, Wang L, Yuan R, Yu X , Chen Z, Yang F, Sun G, Dong Q
Received 24 February 2020
Accepted for publication 12 June 2020
Published 3 July 2020 Volume 2020:12 Pages 5353—5363
DOI https://doi.org/10.2147/CMAR.S251021
Checked for plagiarism Yes
Review by Single anonymous peer review
Peer reviewer comments 3
Editor who approved publication: Dr Antonella D'Anneo
Jianhua Zhou,1,* Lili Wang,2,* Rongtao Yuan,1 Xinjuan Yu,2 Zhenggang Chen,1 Fang Yang,1 Guirong Sun,3 Quanjiang Dong2
1Department of Stomatology, Qingdao Municipal Hospital, Qingdao University, Qingdao 266071, Shandong, People’s Republic of China; 2Central Laboratories and Department of Gastroenterology, Qingdao Municipal Hospital, Qingdao University, Qingdao 266071, Shandong, People’s Republic of China; 3Clinical Laboratory, The Affiliated Hospital, Qingdao University, Qingdao 266011, Shandong, People’s Republic of China
*These authors contributed equally to this work
Correspondence: Quanjiang Dong
Central Laboratories and Department of Gastroenterology, Qingdao Municipal Hospital, Qingdao University, Qingdao 266071, Shandong, People’s Republic of China
Tel +86-532-88905289
Fax +86-532-85968434
Email [email protected]
Guirong Sun
Clinical Laboratory, The Affiliated Hospital, Qingdao University, Qingdao 266011, Shandong, People’s Republic of China
Email [email protected]
Objective: The aim of this study was to explore the signatures of oral microbiome associated with OSCC using a random forest (RF) model.
Patients and Methods: A total of 24 patients with OSCC were enrolled in the study. The oral microbiome was assessed in cancerous lesions and matched paracancerous tissues from each patient using 16S rRNA gene sequencing. Signatures of mucosal microbiome in OSCC were identified using a RF model.
Results: Significant differences were found between OSCC lesions and matched paracancerous tissues with respect to the microbial profile and composition. Linear discriminant analysis effect size analyses (LEfSe) identified 15 bacteria genera associated with cancerous lesions. Fusobacterium, Treponema, Streptococcus, Peptostreptococcus, Carnobacterium, Tannerella, Parvimonas and Filifactor were enriched. A classifier based on RF model identified a microbial signature comprising 12 bacteria, which was capable of distinguishing cancerous lesions and paracancerous tissues (AUC = 0.82). The network of the oral microbiome in cancerous lesions appeared to be simplified and fragmented. Functional analyses of oral microbiome showed altered functions in amino acid metabolism and increased capacity of glucose utilization in OSCC.
Conclusion: The identified microbial signatures may potentially be used as a biomarker for predicting OSCC or for clinical assessment of oral cancer risk.
Keywords: oral squamous cell carcinoma, microbiome, random forest machine learning, predicted functions
Introduction
Oral cancer is a fatal malignancy and the sixth most common cancer worldwide. Oral squamous cell carcinoma (OSCC) is the most frequently occurring oral cancer, accounting for over 90% of all oral cancers.1 In recent years, the incidence of OSCC has shown an increasing trend, which constitutes a major global health problem. OSCC is associated with a high rate of relapse, unpredictable metastasis and oral maxillofacial damage.2,3 The 5-year survival rate of patients with OSCC is approximately 50–60%.3
Mounting evidence supports the association between oral microbiome and OSCC. It has been suggested that the oral microbiome plays a role in the development of oral cancer.4–6 There are three potential mechanisms by which the oral microbiome is involved in the pathogenesis.6 Firstly, oral bacteria can induce chronic inflammation. Inflammatory mediators produced from the oral mucosa promote cell hyper-proliferation, mutagenesis, oncogene activation and angiogenesis, leading to carcinogenesis. Secondly, certain oral bacteria are directly involved in the development of OSCC through enhancing cell proliferation, causing cytoskeletal rearrangement and activation of NF-κB pathways, and inhibiting cellular apoptosis. Finally, some metabolites from oral bacteria were shown to possess carcinogenic potentials.6
A number of bacteria from the oral microbiome have been shown to be associated with OSCC. The relative abundance of Fusobacterium sp., Porphyromonas gingivalis, Streptococcus sp., Peptostreptococcus sp., and Prevotella sp. are increased in OSCC.7,8 Zhao et al reported significant enrichment of Fusobacterium, Dialister, Peptostreptococcus, Filifactor, Peptococcus, Catonella, and Parvimonas in OSCC patients compared with matched controls using linear discriminant analysis (LDA) effect size (LEfSe) analysis.9 In a prospective study, involving examination of mouth swab microbiome, Parvimonas micra and Neisseria sicca were associated with reduced risk of oral cavity cancer.10 The identified OSCC associated oral bacteria, however, vary among studies. This is partially attributable to the variations between studies with respect to the sample types used for the analysis of oral microbiome. There are substantial variations in the composition of the oral microbiome between various sample types including tissue, saliva, and mouth swab.11 Few studies have characterized the OSCC related oral microbiome from tissue, which is closely associated with oral mucosa.
Features of the oral microbiome associated with OSCC have been explored by comparing OSCC patients with healthy controls, or by comparing tumor sites with the surrounding normal tissue.9,10 It has been alerted microbial diversity and a distinctive profile of the oral microbiome in OSCC.8–10 Many bacteria of the oral microbiome are enriched or depleted in OSCC.8,9 Recent studies have also revealed that the collective behaviors of the microbial community are more closely related to the development of cancer in comparison with individual bacteria genera.12 To further explore how the oral microbiome is involved in the carcinogenic process, it is of importance to identifying signatures discriminative for the OSCC associated oral microbiome. The random forest (RF) method is a machine learning program capable of identifying an optimal set of variables with high discriminative power from a large number of dependent or independent variables. It is known for its ability to render complex dependency patterns between the outcome and the covariates.13 The method has been widely used to identify microbial signature for colorectal carcinoma, gastric cancer, and pancreatic cancer.14–16 In this study, we applied the RF model to explore the signatures of the OSCC associated oral microbiome and validated these in an independent cohort.
Patients and Methods
Patients and Sample Collection
A total of 24 patients at different stages of OSCC were enrolled in the study (Table 1). The OSCC stages were classified according to the American Joint Committee on Cancer (AJCC) staging manual (8th edition).17 Of these patients, 19 were male. The average age of patients was 61.1 ± 12.4 years. None of the enrolled subjects had history of betel chewing, or history of diabetes mellitus or other severe complications including heart, liver, or renal failures. These patients had not taken antibiotics for at least two weeks immediately prior to sampling. Tissues from the site of tumor and paracancerous tissue from 2 cm outside the edge of the tumor were sampled. The paracancerous tissues are histologically normal. All samples were stored at –80°C until further processing. This study was approved by the Research Ethics Committee of Qingdao Municipal Hospital, China. Prior to sample collection, written informed consent for the study was obtained from all participants. All experiments were performed in accordance with approved guidelines and regulations of the institution.
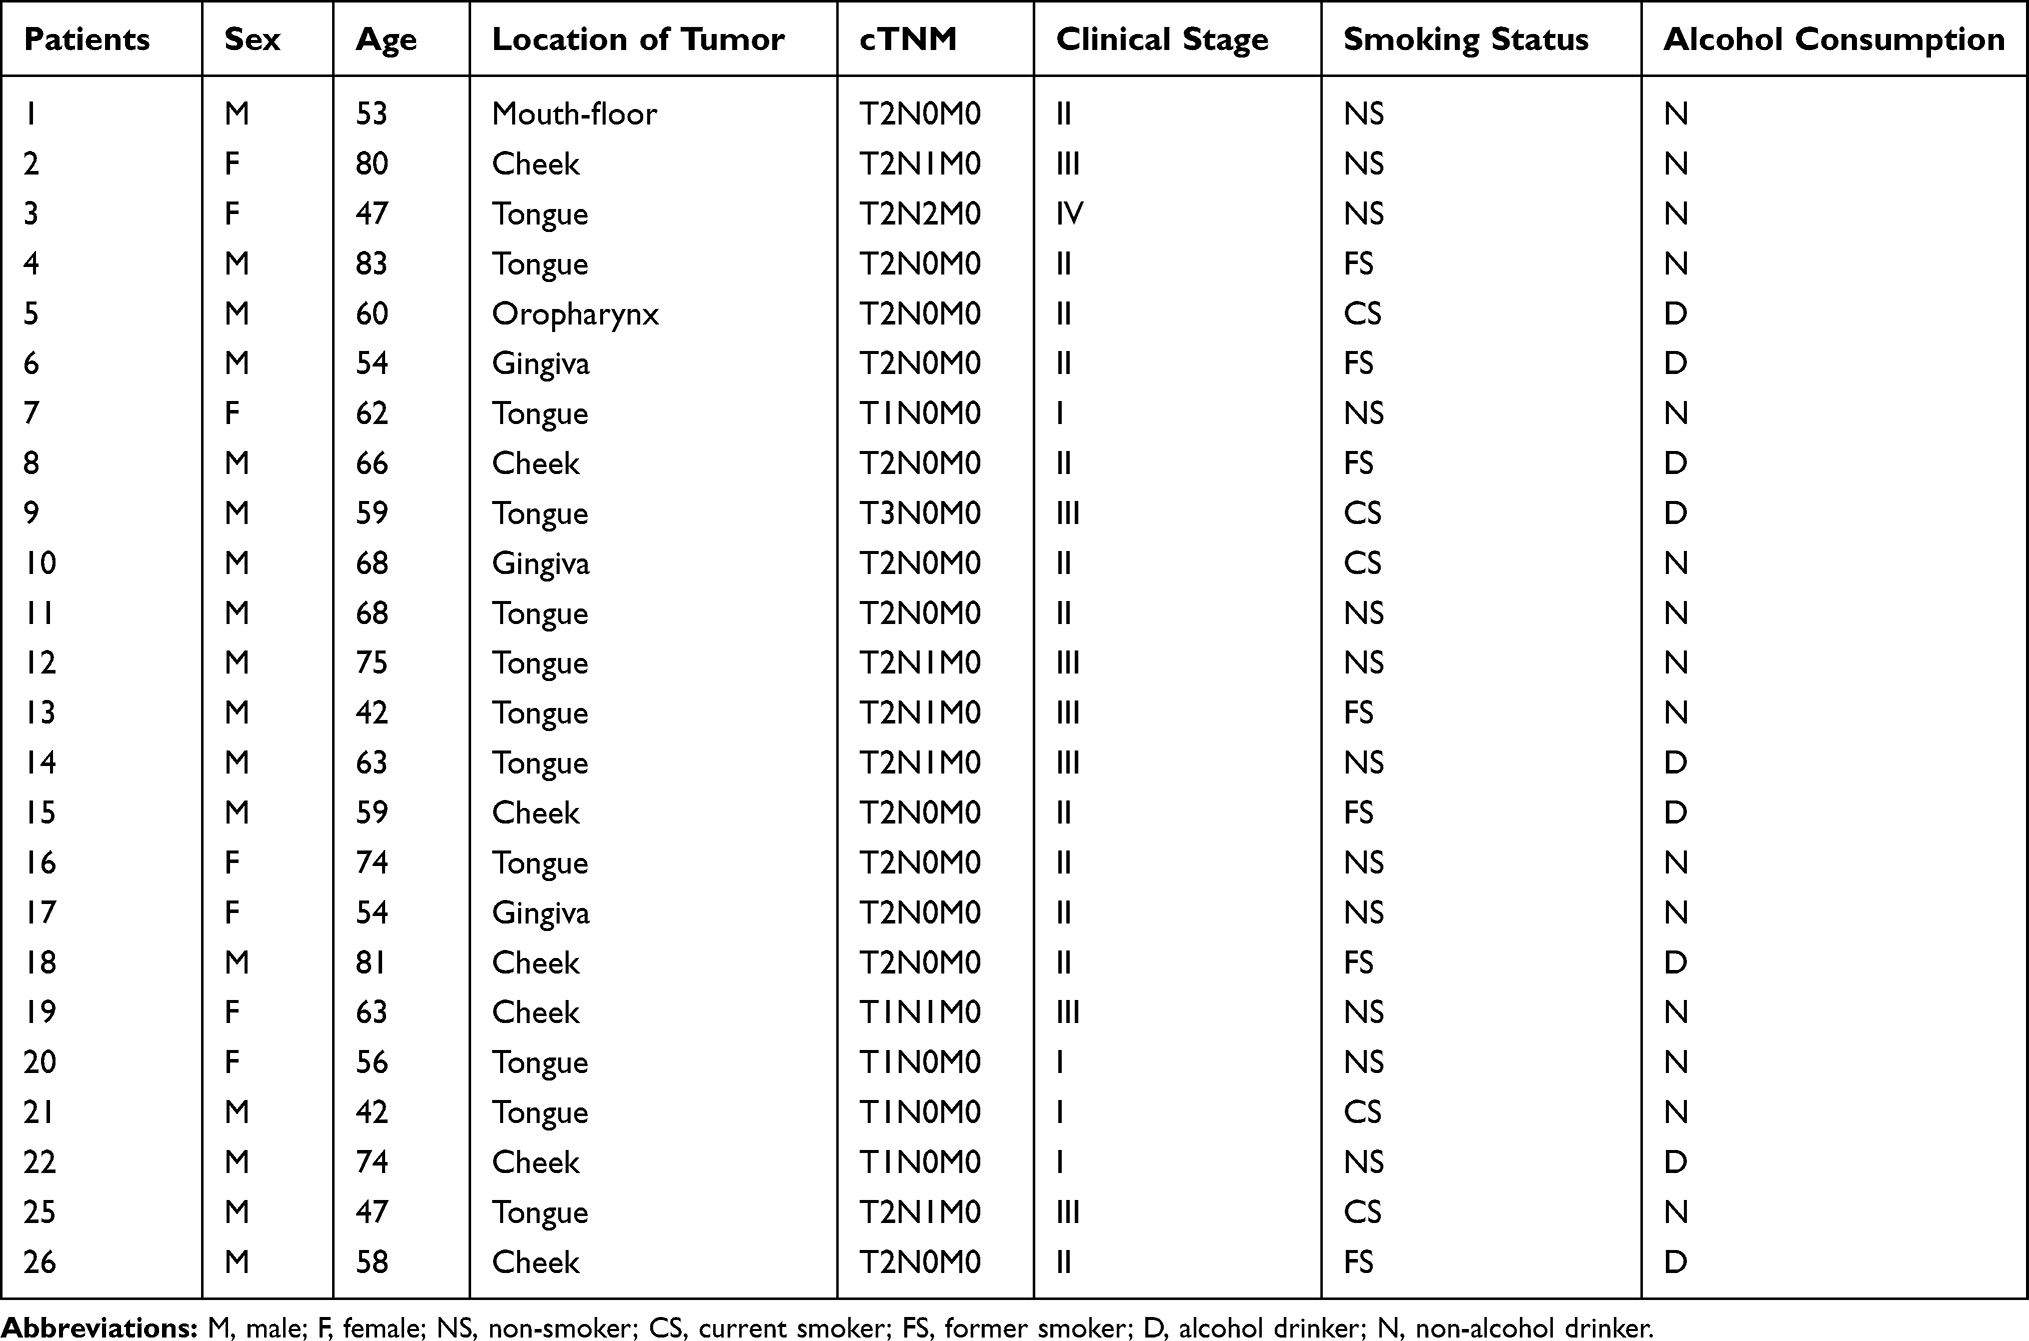 |
Table 1 Clinical Characteristics of 24 Patients with Oral Squamous Cell Carcinoma |
Analyses of the Oral Microbiome
To analyze the microbial communities of the oral mucosa, genomic DNA was extracted from the oral mucosa samples as previously reported.18 The variable V3–V4 region of the 16S rRNA gene was PCR amplified with primers 341F/806R to generate the amplicon libraries. Sequencing was performed on an Illumina PE250 platform (Illumina, Hayward, CA, USA). A total of 16,333,787 paired-ends reads were obtained. After quality control and filtration, 2,163,267 reads were produced with an average of 45,068 reads per sample. The reads were analyzed using UPARSE.19 Following global trimming at 250 nucleotides, reads were dereplicated, and singletons were discarded. Subsequently, reads were clustered into operational taxonomic units (OTUs) assuming 97% identity. Chimeric reads were then removed. Taxonomy assignment was performed using UClust.20 Analyses of alpha and beta microbial diversity were conducted as described previously.18 Comparisons of the relative abundance of taxa between groups were performed using version 1.0 of LEfSe.21 A LDA value greater than 3 with a p value less than 0.05 was considered to be statistically significant. To analyze the correlation network, Spearman correlation coefficients were computed between the genera. Correlations that had an absolute Spearman coefficient value greater than or equal to 0.6 with a p value less than 0.05 were transformed into links between two genera in the genus network. Cytoscape v3.7.1 was then used to construct network figures. PICRUSt (v1.1.1) was used to predict the functions of the microbial community according to the reference data set of GreenGenes 16S rRNA database (v13.5).22 The accuracy of the predicted functions was assessed by the nearest sequenced taxon index (NSTI). The predicted functions were categorized with KEGG orthology. STAMP (v2.1.3) was used to compare functional differences between cancerous and paracancerous groups.23
Statistical Analyses
To identify microbial signatures capable of distinguishing cancerous lesions from paracancerous lesions, a RF model was built using the AUC-RF algorithm.24 The input variables comprised the relative abundance of taxa. A taxon was included only if it was present in more than 20% samples and had a relative abundance of greater than 0.05%. A 20-times repeated 10-fold cross-validation of the RF model was performed. The performance of the RF model was demonstrated by receiver operating characteristic (ROC) curve analysis.25 Validation of OSCC associated bacteria was explored in an independent cohort in Shanghai (China) with 80 samples, of these, 40 samples were from OSCC surface lesion and 40 samples were from anatomically matched normal sites (BioProject accession number: PRJNA362794).9
The Mann–Whitney U-test was performed to detect significant differences in alpha diversity or relative abundance between disease groups. Significant P values were corrected for multiple testing using the Benjamini‐Hochberg procedure, with a cut-off false discovery rate (FDR) – adjusted P value lower than 0.1.26 Constrained PCoA is a flexible method which allows for constrained ordination on the basis of any distance or dissimilarity measure.27 It was performed in R to explore the influence of clinical stage on the microbiome of OSCC.
Data Availability
The next-generation sequencing datasets have been submitted to NCBI (https://www.ncbi.nlm.nih.gov/bioproject/PRJNA597251/). The BioProject accession number is PRJNA597251.
Results
Differences in Microbial Community Between Cancerous and Paracancerous Tissues
The microbial community between the cancerous lesions (C) and matched paracancerous tissues (P) was compared in 24 patients. Both Chao1 and Shannon indices which estimate the biodiversity of microbiome, were not significantly different between group C and group P (P > 0.05 for both) (Figure 1A and B). On multiple linear regression analyses, the alpha diversity indices of the microbiome showed no association with age, sex, smoking, alcohol consumption, degree of differentiation, or clinical stage in either group C or group P. Principal coordination analyses (PCoA) showed that the microbial community structure of group C was distinct from that of group P (P = 0.048) (Figure 1C). Constrained PCoA analyses were performed to explore the influence of clinical stage on the OSCC microbiome. The results demonstrated an apparent separation between the clinical stage I, II, and III in group C, especially between stages II and III. This suggested the progression of OSCC was associated with alteration of oral mucosa microbiome (Figure 1D). In group P, however, the microbial community structure was not discernible in the plots between stages (Figure 1E).
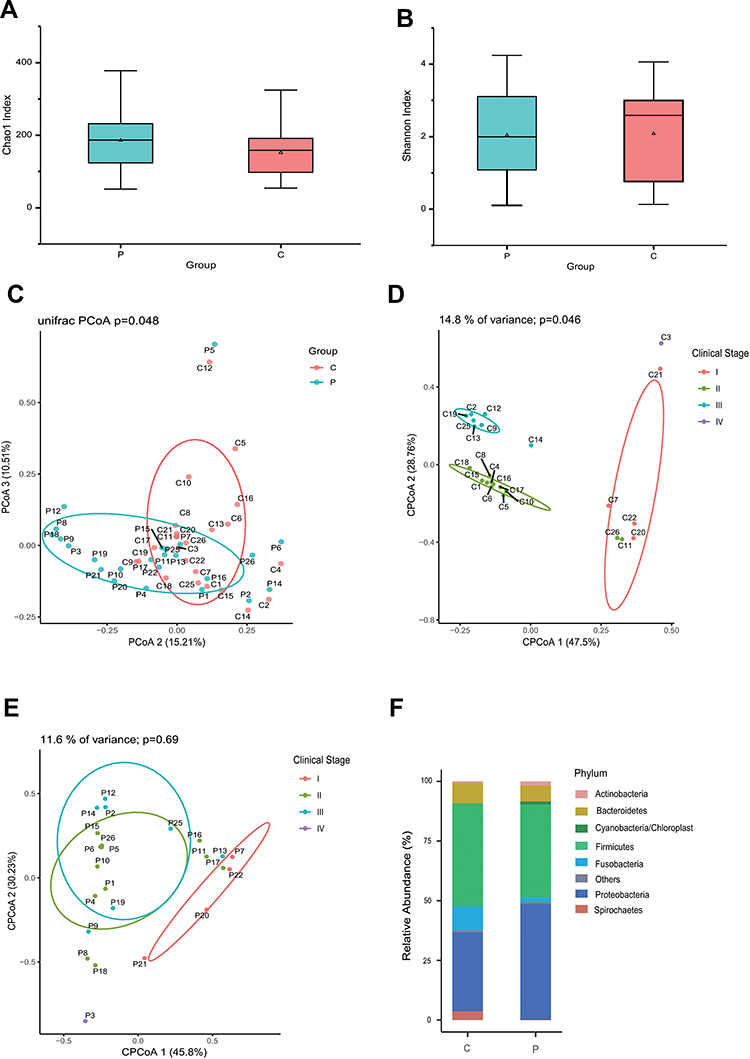 |
Figure 1 Profiles of the oral microbiome in OSCC. The alpha diversity was estimated using Chao1 (A) and Shannon (B) indices. PCoA plots for comparing community structure between paracancerous and cancerous tissues (C), between clinical stages in cancerous tissues (D) and paracancerous tissues (E). The composition of microbiome at the phylum level was compared between paracancerous and cancerous tissues (F). (P) paracancerous tissues; (C) cancerous tissues. |
Altered Composition of the Microbiome in OSCC
Compositional analyses showed the phyla of Proteobacteria, Firmicutes, Bacteroidetes and Fusobacteria were dominant in the microbiome of both groups (Figure 1F). The relative abundance of Firmicutes, Bacteroidetes, Fusobacteria, and Spirochaetes was increased in cancerous lesions. Differences with respect to the relative abundance of Fusobacteria (9.80% vs 1.70%) and Spirochaetes (3.63% vs 0.18%) were statistically significant using Mann–Whitney U-test (P = 0.043 and 0.032, FDR-adjusted P = 0.089 and 0.083, respectively). The abundance of Proteobacteria, Actinobacteria, and Cyanobacteria in cancerous lesions was lower compared to paracancerous tissues. The differences of relative abundance of Actinobacteria (0.77% vs 1.78%) and Cyanobacteria (0.23% vs 1.33%) were statistically significant (P = 0.021 and P = 0.013, FDR-adjusted P = 0.067 and 0.051, respectively). At the genus level, LEfSe analyses identified 15 genera which had a LDA score >3.0 (Figure 2A). The relative abundance of Fusobacterium, Treponema, Streptococcus, Peptostreptococcus, Carnobacterium, Tannerella, Parvimonas, and Filifactor were increased in cancerous lesions (Figure 2B). Of these, Fusobacterium had the highest LDA score. In contrast, the relative abundance of Streptophyta, Brevundimonas, Paenibacillus, Microbacterium, Desulfovibrio, Mucispirillum, and Arthrobacter were decreased in cancerous lesions (Figure 2C).
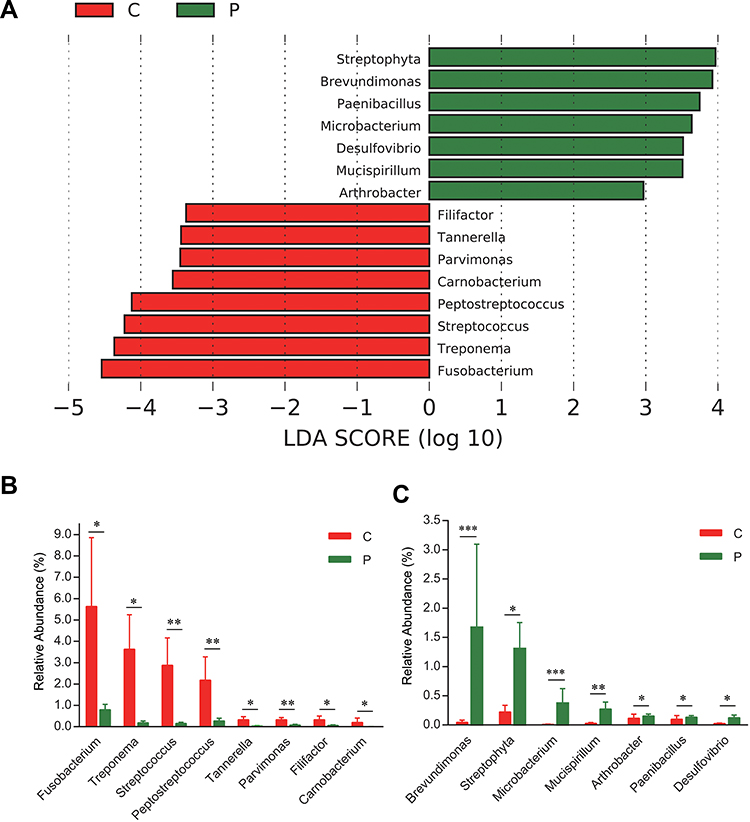 |
Figure 2 LEfSe analyses of microbiome composition between paracancerous and cancerous tissues. Bacteria genera enriched in cancerous tissues had a positive LDA score, while those depleted had a negative score. Bacteria with LDA scores >3 are shown (A). Relative abundance of genera enriched in cancerous tissues (B). Relative abundance of genera enriched in paracancerous tissues (C). *P < 0.05; **P < 0.01; ***P < 0.001. All FDR-adjusted P values were <0.05. |
Microbial Signatures Associated with OSCC
To determine microbial signatures capable of discriminating cancerous lesions from paracancerous tissues, an RF classifying model was built with the AUC-RF algorithm. The results showed a minimal set of 12 bacteria genera that maximally differentiated cancer sites from paracancerous sites. It contained Microbacterium, Streptococcus, Brevundimonas, Peptostreptococcus, Streptophyta, Paenibacillus, Actinomyces, Parvimonas, Mucispirillum, Arthrobacter, Rhizobium and Fusobacterium (Figure 3A and B). Most of these (10/12) have been identified to have a LDA value > 3.0 by the LEfSe analyses, including four genera (Fusobacterium, Parvimonas, Peptostreptococcus and Streptococcus) enriched in cancerous lesions and six depleted genera (Arthrobacter, Brevundimonas, Microbacterium, Mucispirillum, Paenibacillus, and Streptophyta). RF models trained with this optimal set of features resulted in an out-of-bag error rate of 33.33%. To assess the model classifying accuracy, a 20-times repeated 10-fold cross-validation was performed. The AUC value from cross-validations was 0.82 [95% confidence interval (CI): 0.70–0.94] (Figure 3C). This set of 12 genera was further validated in an independent Chinese Shanghai cohort with AUC of 0.69 (95% CI: 0.54–0.80) (Figure 3D). The results suggested that these oral mucosal bacteria associated with OSCC may predict the risk of OSCC.
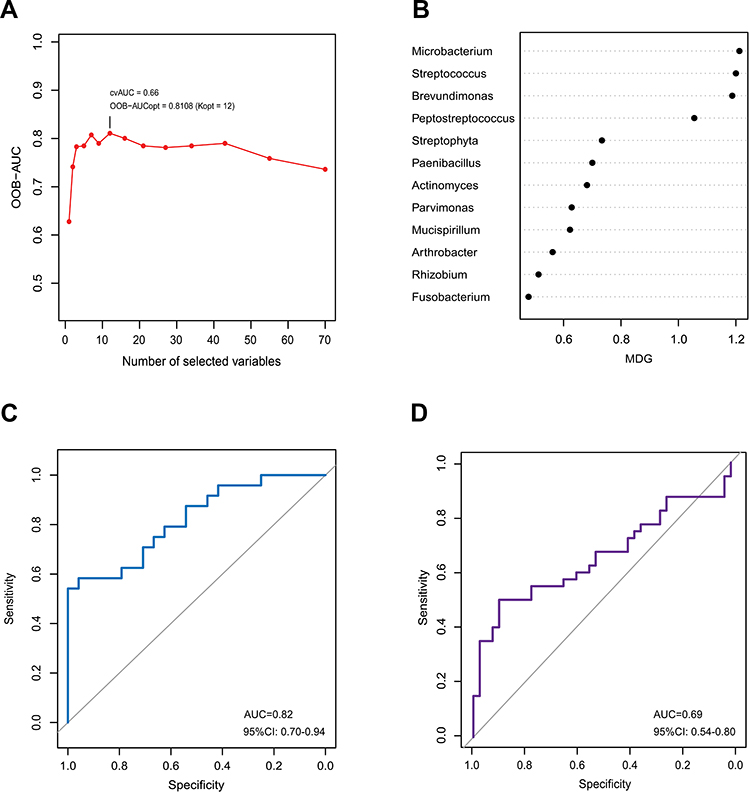 |
Figure 3 Identification of microbial signature associated with OSCC. The random forest model was constructed using AUC-RF algorithm based on bacteria which were present in more than 20% samples and had a relative abundance of over 0.05%. The model containing 12 genera was selected as the optimal model based on the highest OOB-AUC value obtained from the backward elimination process performed using the AUC-RF algorithm with the median decrease Gini (MDG) importance measure (A). MDG of selected genera in the optimal set (B). The ROC curve of the optimal model for classifying cancerous tissues from paracancerous tissues (C). The ROC curve of validation in a independent cohort in Shanghai (D). |
Co-Occurrence Network in OSCC
The co-occurrence network differed substantially between cancerous lesions and paracancerous tissues (Figure 4). The network was simplified in group C with a decreased number of nodes (Table 2). The network density and average degree were also lower in group C, which demonstrated a reduction in the network complexity. The clustering coefficient of the network was lower, leading to an increased number of components and more fragmented sub-networks in group C (Figure 4).
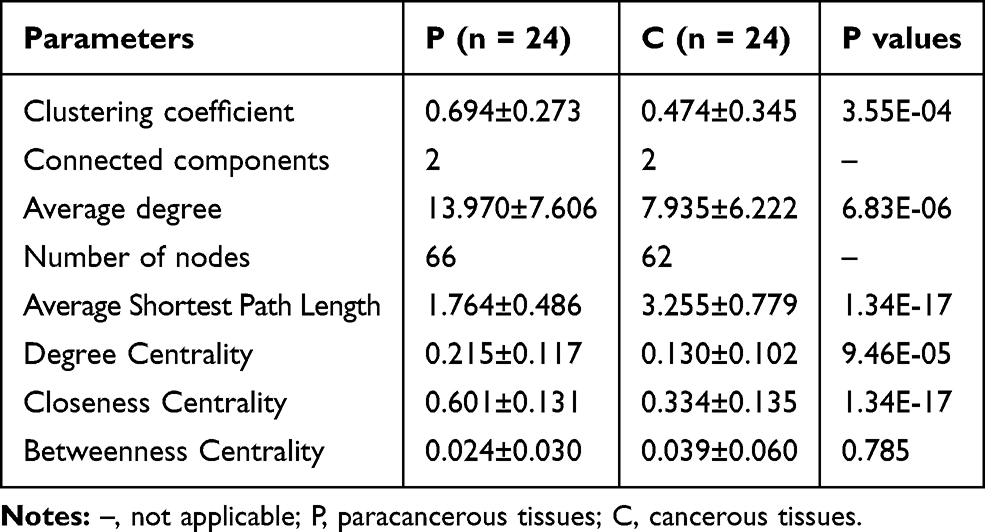 |
Table 2 Features of Co-Occurrence Network of the Oral Microbiome |
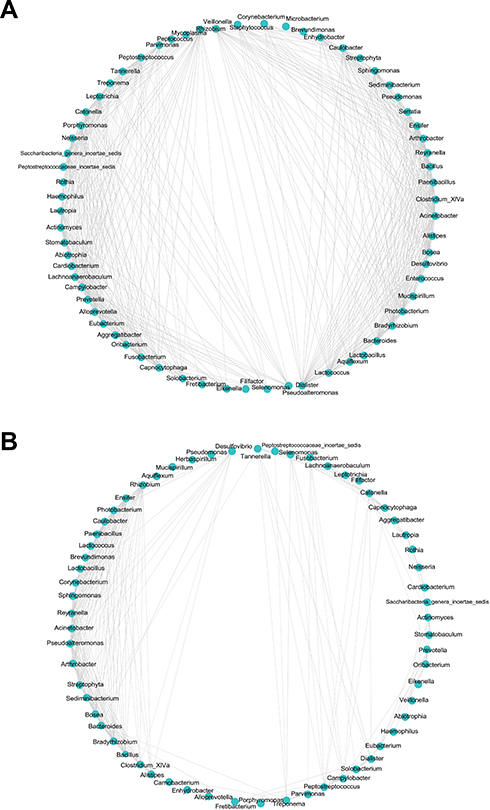 |
Figure 4 Correlation network in paracancerous tissues (A) and cancerous tissues (B). The correlation coefficient was calculated with Spearman’s rank correlation test (|r| ≥0.6). Cytoscape was used for network construction. |
Predicted Functions of the OSCC Microbiome
Functional capacities of the OSCC microbiome were predicted using PICRUSt. Compared with paracancerous tissues, the average relative frequencies of pathways related to metabolism, especially amino acid metabolism, were decreased at KEGG levels 1 and 2 (Figure 5A and B). Furthermore, reduced relative frequencies in OSCC were found for pathways of KEGG level 3 related to amino acid metabolism including phenylalanine metabolism, tryptophan metabolism, arginine and proline metabolism, valine, leucine and isoleucine degradation, lysine degradation and tyrosine metabolism (Figure 5C). Nevertheless, the relative frequencies of methane metabolism, glucose-related metabolism, such as phosphotransferase system (PTS) and glycolysis, were significantly enriched in cancer lesions (Figure 5D). These alterations suggested functional disorders of amino acid metabolism and increased capacity of glucose utilization in the microbiome of OSCC. To validate these results, the predicted functions were compared between two randomized groups. The results showed no significant differences between two groups at KEGG levels 1–3 (Supplementary Table 1).
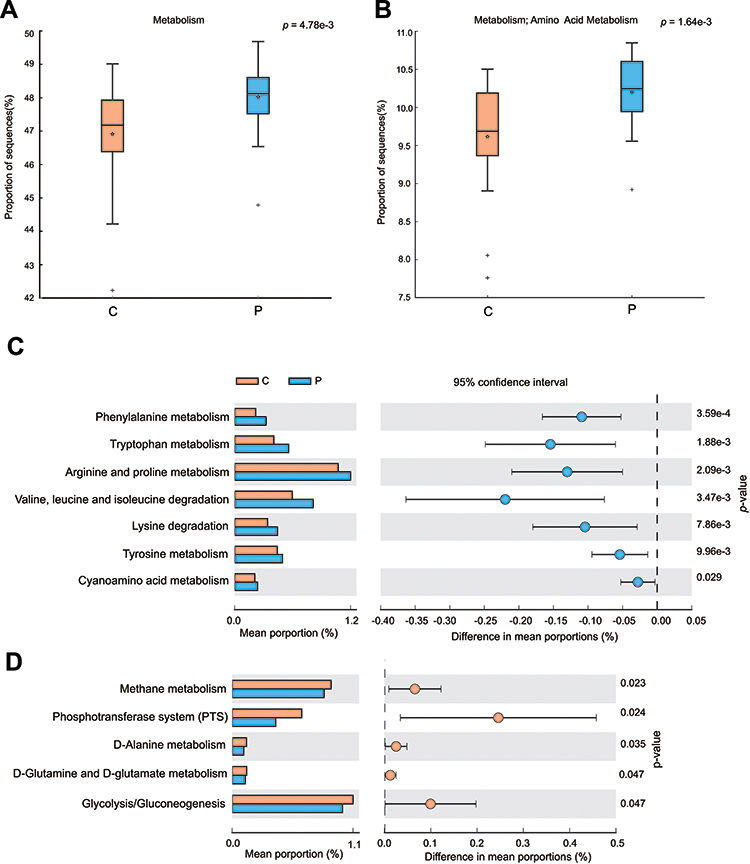 |
Figure 5 Differential functions predicted using PICRUSt between paracancerous and cancerous tissues. The function of metabolism at level 1 in KEGG pathway (A) and amino acid metabolism at level 2 (B). The decreased (C) or increased (D) relative frequency of functions of amino acid metabolism at level 3 in cancerous tissues. Differences between groups in the predicted functions were compared using STAMP. Statistical differences are considered when P < 0.05. |
Discussion
Our results demonstrated significant differences in the β-diversity (including PCoA and constrained PCoA analysis) of the oral microbiome between cancerous and paracancerous tissues. These findings indicate altered community structure of the oral microbiome in cancerous lesions. However, the α-diversity including Chao1 and Shannon indices showed no significant differences. Consistent with our results, previous studies have found no significant differences in α-diversity between cancerous lesions and paratumoral mucosa in patients with colorectal cancer.28 Constrained PCoA analyses demonstrated an apparent separation among the different clinical stages in cancerous lesions of OSCC. It should be noted that the sample size in different stages was small. Thus, the observed association between variations of the oral microbiome and cancer progression needs to be demonstrated in studies with a large sample size. Nonetheless, in a previous study, the oral microbiome in patients with stage IV OSCC was different from that in healthy controls.29 The microbiome communities showed a progressive shift with the progression of OSCC stage.29 These findings are consistent with our results wherein the community structure of the oral microbiome was found to changes with the stages of OSCC, indicating the potential involvement of the oral microbiome in cancer progression.
In recent studies, microbial signatures identified using RF machine learning algorithm were used to predict different diseases.14–16 The identified signatures can be viewed as a minimized representation of the microbial community for exploring mechanisms of microbial dysbiosis and targets for manipulating the dysbiotic microbiome. In a study by Zackular et al, the final numbers of colon tumor were quantitatively predicted on the basis of the initial composition of the gut microbiome using RF algorithm.30 In another report, a minimal set of 22 viral genera were identified that differentiated CRC patients from controls and predicted CRC outcomes.14 An RF model for predicting exacerbation of radiation-induced mucositis was generated using oral microbiome, it showed a high predictive accuracy (AUC = 0.89).31 Currently, few studies have been conducted to identify the microbial signature in OSCC. Our study revealed an RF model consisting of 12 relevant bacteria with differential abundance between the cancerous lesions and paracancerous tissues of OSCC. The trained model was capable of predicting OSCC with considerably high accuracy (AUC = 0.82). Moreover, the validation in an independent cohort showed a moderate accuracy. Monitoring the composition and abundance of these 12 bacteria may help predict the risk of OSCC, facilitate early diagnosis and treatment of OSCC and help improve the prognosis of OSCC.
In our study, the LDA scores of 15 genera were >3.0 when comparing the oral microbiome of cancerous lesions with that of paracancerous tissues. Furthermore, these bacteria showed differential abundance between the two groups, suggesting a close association between these bacteria and OSCC. The majority (10/12) of bacteria in the optimal set identified by RF analyses were contained in these 15 bacteria genera. The highly consistent results between these analyses demonstrate that variations of the optimal set of bacteria reflect the dysbiotic features of the oral microbiome associated with OSCC, accounting for remarkable capacity of the set to discriminating OSCC from normal tissues. Of the optimal set of bacteria, Fusobacterium, Parvimonas, Peptostreptococcus and Streptococcus were enriched in cancerous lesions. The association of these four bacteria with OSCC has been reported. It has been found an increase in the abundance of Fusobacteria in OSCC, especially in the late stage.11,32 A significant enrichment of Fusobacterium, Peptostreptococcus, Peptococcus and Parvimonas in OSCC surface lesions has been demonstrated.9,33 Variations in the abundance of Peptostreptococcus and Parvimonas in the salivary microbiome have been observed between normal individuals, oral precursor lesion and cancer patients.34 Infection with S. anginosus occurs frequently in OSCC.35 Species of these genera have been isolated from the oral tumor and metastatic lymphatic nodes.36,37 These results support a close association between these enriched bacteria and OSCC. In addition, these enriched bacteria may have carcinogenic potential. Previous studies have shown that F. nucleatum may induce tumorigenesis through the inflammatory NF-κB signaling pathway.38,39 F. nucleatum expresses the adhesion molecule FadA which binds to E-cadherin on epithelial cells, inhibiting its tumor-suppressor activity.40 Streptococcus spp. possesses alcohol dehydrogenase activity leading to production of the carcinogenic acetaldehyde, which is potentially involved in the occurrence of oral cancer.41 These findings suggest that our RF analyses identified a group of bacteria with carcinogenic potentials enriched in OSCC. In addition to these bacteria, we also found depletion of six bacteria genera in OSCC. Further studies are required to unravel the causes of variations in the abundance of these bacteria and their roles in carcinogenesis.
Bacterial interaction is a determinant of the homeostasis of the microbiome. Studies have shown reduced network complexity in peritumoral or tumoral tissues of the stomach in comparison with normal gastric mucosa.42 In our study, strongly interacted genera were picked up according to |r| ≥0.6 to construct microbial network. Our results demonstrated a simplified microbial network in cancerous lesions of OSCC, with the reduction in the number of nodes, network density, average degree, and clustering coefficient in cancer sites, suggesting fragmented and simplified network. These findings indicated the loss of certain bacterial interactions in OSCC, leading to disruption of the homeostasis of oral microbiome. However, a recent study found increased network complexity in OSCC.9 The contradictory results may be attributed to the difference in the cut-off value of correlation coefficient used bacterial species for the construction of microbial network.
The functional profile in the cancer-associated microbiome shows substantial changes. In a previous study, the functions related to protein and amino acid metabolism (such as valine, leucine and isoleucine, phenylalanine, tyrosine and tryptophan biosynthesis) showed an inverse association with OSCC progression.29 Similar results were obtained in a study of saliva metabolomics wherein phenylalanine metabolism was found down-regulated in OSCC.43 Consistent with this, in our study, the functional prediction of oral bacterial communities showed a significant decrease in genes involved in amino acid metabolism (such as phenylalanine metabolism, tryptophan metabolism, arginine, and proline metabolism) in OSCC lesions. However, methane metabolism and glucose-related metabolism (such as PTS and glycolysis) were significantly enriched in cancer lesions. Tryptophan metabolism is associated with the evasion of immune surveillance by cancer cells.44 Decreased levels of tryptophan were shown to promote the generation of immune-suppressive T cells promoting cancer development.45 Cancer cells appear to utilize glycolytic metabolism for energy production and precursors for the increased rate of anabolic processes.46 These suggest the gene functional disorders of amino acid metabolism and increased capacity of glucose utilization in the microbiome are associated with OSCC.
In summary, this study revealed dysbiosis in OSCC featured with functional and compositional changes. We identified a microbial signature comprising 12 bacteria associated with OSCC, which may be used as a biomarker for clinical prediction of the risk of OSCC. Further studies are required to explore the potential clinical application of the microbial signature.
Disclosure
The authors report no conflicts of interest in this work.
References
1. Kademani D. Oral cancer. Mayo Clin Proc. 2007;82(7):878–887. doi:10.4065/82.7.878
2. Hooper SJ, Crean SJ, Fardy MJ, et al. A molecular analysis of the bacteria present within oral squamous cell carcinoma. J Med Microbiol. 2007;56(Pt12):1651–1659. doi:10.1099/jmm.0.46918-0
3. Crozier E, Sumer BD. Head and neck cancer. Med Clin North Am. 2010;94(5):1031–1046. doi:10.1016/j.mcna.2010.05.014
4. Yost S, Stashenko P, Choi Y, et al. Increased virulence of the oral microbiome in oral squamous cell carcinoma revealed by metatranscriptome analyses. Int J Oral Sci. 2018;10(4):32. doi:10.1038/s41368-018-0037-7
5. Karpiński TM. Role of oral microbiota in cancer development. Microorganisms. 2019;7(1):20. doi:10.3390/microorganisms7010020
6. Zhang Y, Wang X, Li H, Ni C, Du Z, Yan F. Human oral microbiota and its modulation for oral health. Biomed Pharmacother. 2018;99:883–893. doi:10.1016/j.biopha.2018.01.146
7. Pushalkar S, Ji X, Li Y, et al. Comparison of oral microbiota in tumor and non-tumor tissues of patients with oral squamous cell carcinoma. BMC Microbiol. 2012;12:144. doi:10.1186/1471-2180-12-144
8. Mager DL, Haffajee AD, Devlin PM, Norris CM, Posner MR, Goodson JM. The salivary microbiota as a diagnostic indicator of oral cancer: a descriptive, non-randomized study of cancer-free and oral squamous cell carcinoma subjects. J Transl Med. 2005;3:27. doi:10.1186/1479-5876-3-27
9. Zhao H, Chu M, Huang Z, et al. Variations in oral microbiota associated with oral cancer. Sci Rep. 2017;7(1):11773. doi:10.1038/s41598-017-11779-9
10. Hayes RB, Ahn J, Fan X, et al. Association of oral microbiome with risk for incident head and neck squamous cell cancer. JAMA Oncol. 2018;4(3):358–365. doi:10.1001/jamaoncol.2017.4777
11. Zhang Z, Yang J, Feng Q, et al. Compositional and functional analysis of the microbiome in tissue and saliva of oral squamous cell carcinoma. Front Microbiol. 2019;10:1439. doi:10.3389/fmicb.2019.01439
12. Darveau RP. Periodontitis: a polymicrobial disruption of host homeostasis. Nat Rev Microbiol. 2010;8(7):481–490. doi:10.1038/nrmicro2337
13. Hornung R, Wright MN. WrightMN. Block forests: random forests for blocks of clinical and omics covariate data. BMC Bioinformatics. 2019;20(1):358. doi:10.1186/s12859-019-2942-y
14. Nakatsu G, Zhou H, Wu WKK, et al. Alterations in enteric virome are associated with colorectal cancer and survival outcomes. Gastroenterology. 2018;155(2):529–541. doi:10.1053/j.gastro.2018.04.018
15. Yu G, Hu N, Wang L, et al. Gastric microbiota features associated with cancer risk factors and clinical outcomes: a pilot study in gastric cardia cancer patients from Shanxi, China. Int J Cancer. 2017;141(1):45–51. doi:10.1002/ijc.30700
16. Half E, Keren N, Reshef L, et al. Fecal microbiome signatures of pancreatic cancer patients. Sci Rep. 2019;9(1):16801. doi:10.1038/s41598-019-53041-4
17. Amin MB, Edge SB, Greene FL, et al. AJCC Cancer Staging Manual.
18. Wang L, Zhou J, Xin Y, et al. Bacterial overgrowth and diversification of microbiota in gastric cancer. Eur J Gastroenterol Hepatol. 2016;28(3):261–266. doi:10.1097/MEG.0000000000000542
19. Edgar RC. UPARSE: highly accurate OTU sequences from microbial amplicon reads. Nat Methods. 2013;10(10):996–998. doi:10.1038/nmeth.2604
20. Edgar RC. Search and clustering orders of magnitude faster than BLAST. Bioinformatics. 2010;26(19):2460–2461. doi:10.1093/bioinformatics/btq461
21. Segata N, Izard J, Waldron L, et al. Metagenomic biomarker discovery and explanation. Genome Biol. 2011;12(6):R60. doi:10.1186/gb-2011-12-6-r60
22. Langille MG, Zaneveld J, Caporaso JG, et al. Predictive functional profiling of microbial communities using 16S rRNA marker gene sequences. Nat Biotechnol. 2013;31(9):814–821. doi:10.1038/nbt.2676
23. Parks DH, Tyson GW, Hugenholtz P, Beiko RG. STAMP: statistical analysis of taxonomic and functional profiles. Bioinformatics. 2014;30(21):3123–3124. doi:10.1093/bioinformatics/btu494
24. Calle ML, Urrea V, Boulesteix AL, Malats N. AUC-RF: a new strategy for genomic profiling with random forest. Hum Hered. 2011;72(2):121–132. doi:10.1159/000330778
25. Hanley JA, McNeil BJ. The meaning and use of the area under a receiver operating characteristic (ROC) curve. Radiology. 1982;143(1):29–36. doi:10.1148/radiology.143.1.7063747
26. Benjamini Y, Hochberg Y. Controlling the false discovery rate – a practical and powerful approach to multiple testing. J R Statist Soc B. 1995;57(1):289–300.
27. Anderson MJ, Willis TJ. Canonical analysis of principal coordinates: a useful method of constrained ordination for ecology. Ecology. 2003;84(2):511–525. doi:10.1890/0012-9658(2003)084[0511:CAOPCA]2.0.CO;2
28. Allali I, Delgado S, Marron PI, et al. Gut microbiome compositional and functional differences between tumor and non-tumor adjacent tissues from cohorts from the US and Spain. Gut Microbes. 2015;6(3):161–172. doi:10.1080/19490976.2015.1039223
29. Yang CY, Yeh YM, Yu HY, et al. Oral microbiota community dynamics associated with oral squamous cell carcinoma staging. Front Microbiol. 2018;9:862. doi:10.3389/fmicb.2018.00862
30. Zackular JP, Baxter NT, Chen GY, Schloss PD. Manipulation of the gut microbiota reveals role in colon tumorigenesis. mSphere. 2015;1(1):
31. Zhu XX, Yang XJ, Chao YL, et al. The potential effect of oral microbiota in the prediction of mucositis during radiotherapy for nasopharyngeal carcinoma. EBioMedicine. 2017;18:23–31. doi:10.1016/j.ebiom.2017.02.002
32. Schmidt BL, Kuczynski J, Bhattacharya A, et al. Changes in abundance of oral microbiota associated with oral cancer. PLoS One. 2014;9(6):e98741. doi:10.1371/journal.pone.0098741
33. Li Y, He J, He Z, et al. Phylogenetic and functional gene structure shifts of the oral microbiomes in periodontitis patients. ISME J. 2014;8(9):1879–1891. doi:10.1038/ismej.2014.28
34. Lee WH, Chen HM, Yang SF, et al. Bacterial alterations in salivary microbiota and their association in oral cancer. Sci Rep. 2017;7(1):16540. doi:10.1038/s41598-017-16418-x
35. Sasaki M, Yamaura C, Ohara-Nemoto Y, et al. Streptococcus anginosus infection in oral cancer and its infection route. Oral Dis. 2005;11(3):151–156. doi:10.1111/j.1601-0825.2005.01051.x
36. Sakamoto H, Naito H, Ohta Y, et al. Isolation of bacteria from cervical lymph nodes in patients with oral cancer. Arch Oral Biol. 1999;44(10):789–793. doi:10.1016/S0003-9969(99)00079-5
37. Sakamoto H, Sasaki J, Nord CE. Association between bacterial colonization on the tumor, bacterial translocation to the cervical lymph nodes and subsequent postoperative infection in patients with oral cancer. Clin Microbiol Infect. 1999;5(10):612–616. doi:10.1111/j.1469-0691.1999.tb00417.x
38. Kostic AD, Chun E, Robertson L, et al. Fusobacterium nucleatum potentiates intestinal tumorigenesis and modulates the tumor-immune microenvironment. Cell Host Microbe. 2019;20(1):207–215. doi:10.1016/j.chom.2013.07.007
39. DiDonato JA, Mercurio F, Karin M. NF-κB and the link between inflammation and cancer. Immunol Rev. 2012;246(1):379–400. doi:10.1111/j.1600-065X.2012.01099.x
40. Rubinstein MR, Wang X, Liu W, Hao Y, Cai G, Han YW. Fusobacterium nucleatum promotes colorectal carcinogenesis by modulating E-cadherin/β-catenin signaling via its FadA adhesin. Cell Host Microbe. 2013;14(2):195–206. doi:10.1016/j.chom.2013.07.012
41. Meurman JH, Uittamo J. Oral micro-organisms in the etiology of cancer. Acta Odontol Scand. 2008;66(6):321–326. doi:10.1080/00016350802446527
42. Liu X, Shao L, Liu X, et al. Alterations of gastric mucosal microbiota across different stomach microhabitats in a cohort of 276 patients with gastric cancer. EBioMedicine. 2019;40:336–348. doi:10.1016/j.ebiom.2018.12.034
43. Wang Q, Gao P, Wang X, Duan Y. The early diagnosis and monitoring of squamous cell carcinoma via saliva metabolomics. Sci Rep. 2014;4:6802. doi:10.1038/srep06802
44. Hashim NAA, Ab-Rahim S, Suddin LS, Saman MSA, Mazlan M. Global serum metabolomics profiling of colorectal cancer. Mol Clin Oncol. 2019;11(1):3–14. doi:10.3892/mco.2019.1853
45. Grohmann U, Bronte V. Control of immune response by amino acid metabolism. Immunol Rev. 2010;236:243–264. doi:10.1111/j.1600-065X.2010.00915.x
46. Vander Heiden MG, Cantley LC, Thompson CB. Understanding the Warburg effect: the metabolic requirements of cell proliferation. Science. 2009;324(5930):1029–1033. doi:10.1126/science.1160809
 © 2020 The Author(s). This work is published and licensed by Dove Medical Press Limited. The full terms of this license are available at https://www.dovepress.com/terms.php and incorporate the Creative Commons Attribution - Non Commercial (unported, v3.0) License.
By accessing the work you hereby accept the Terms. Non-commercial uses of the work are permitted without any further permission from Dove Medical Press Limited, provided the work is properly attributed. For permission for commercial use of this work, please see paragraphs 4.2 and 5 of our Terms.
© 2020 The Author(s). This work is published and licensed by Dove Medical Press Limited. The full terms of this license are available at https://www.dovepress.com/terms.php and incorporate the Creative Commons Attribution - Non Commercial (unported, v3.0) License.
By accessing the work you hereby accept the Terms. Non-commercial uses of the work are permitted without any further permission from Dove Medical Press Limited, provided the work is properly attributed. For permission for commercial use of this work, please see paragraphs 4.2 and 5 of our Terms.