")
Back to Journals » OncoTargets and Therapy » Volume 10
Sialylation facilitates self-assembly of 3D multicellular prostaspheres by using cyclo-RGDfK(TPP) peptide
Authors Haq S, Samuel V , Haxho F, Akasov R , Leko M, Burov SV , Markvicheva E, Szewczuk MR
Received 31 January 2017
Accepted for publication 31 March 2017
Published 4 May 2017 Volume 2017:10 Pages 2427—2447
DOI https://doi.org/10.2147/OTT.S133563
Checked for plagiarism Yes
Review by Single anonymous peer review
Peer reviewer comments 2
Editor who approved publication: Dr Jianmin Xu
Sabah Haq,1 Vanessa Samuel,1 Fiona Haxho,1 Roman Akasov,2,3 Maria Leko,4 Sergey V Burov,4 Elena Markvicheva,2 Myron R Szewczuk1
1Department of Biomedical and Molecular Sciences, Queen’s University, Kingston, ON, Canada; 2Polymers for Biology Laboratory, Shemyakin-Ovchinnikov Institute of Bioorganic Chemistry, Russian Academy of Sciences, 3Sechenov First Moscow State Medical University, Institute for Regenerative Medicine, Moscow, 4Synthesis of Peptides and Polymer Microspheres Laboratory, Institute of Macromolecular Compounds, Russian Academy of Sciences, St Petersburg, Russia
Background: Prostaspheres-based three dimensional (3D) culture models have provided insight into prostate cancer (PCa) biology, highlighting the importance of cell–cell interactions and the extracellular matrix (EMC) in the tumor microenvironment. Although these 3D classical spheroid platforms provide a significant advance over 2D models mimicking in vivo tumors, the limitations involve no control of assembly and structure with only limited spatial or glandular organization. Here, matrix-free prostaspheres from human metastatic prostate carcinoma PC3 and DU145 cell lines and their respective gemcitabine resistant (GemR) variants were generated by using cyclic Arg-Gly-Asp-D-Phe-Lys peptide modified with 4-carboxybutyl-triphenylphosphonium bromide (cyclo-RGDfK(TPP)).
Materials and methods: Microscopic imaging, immunocytochemistry (ICC), flow cytometry, sialidase, and WST-1 cell viability assays were used to evaluate the formation of multicellular tumor spheroid (MCTS), cell survival, morphologic changes, and expression levels of α2,6 and α2,3 sialic acid (SA) and E- and N-cadherin in DU145, PC3, and their GemR variants.
Results: By using the cyclo-RGDfK(TPP) peptide platform in a dose- and time-dependent manner, both DU145 and DU145GemR cells formed small MCTS. In contrast, PC3 and PC3GemR cells formed irregular multicellular aggregates at all concentrations of cyclo-RGDfK(TPP) peptide, even after 6 days of incubation. ICC and flow cytometry results revealed that DU145 cells expressed higher amounts of E-cadherin but lower N-cadherin compared with PC3 cells. By using Maackia amurensis (α2,3-SA-specific MAL-II) and Sambucus nigra (α2,6-SA specific SNA) lectin-based cytochemistry staining and flow cytometry, it was found that DU145 and DU145GemR cells expressed 5 times more α2,6-SA than α2,3-SA on the cell surface. PC3 cells expressed 4 times more α2,3-SA than α2,6-SA, and the PC3GemR cells showed 1.4 times higher α2,6-SA than α2,3-SA. MCTS volume was dose-dependently reduced following pretreatment with α2,6-SA-specific neuraminidase (Vibrio cholerae). Oseltamivir phosphate enhanced cell aggregation and compaction of 3D MCTS formed with PC3 cells.
Conclusion: The relative levels of specific sialoglycan structures on the cell surface correlate with the ability of PCa cells to form avascular multicellular prostaspheres.
Keywords: PC3 and DU145 cell lines, cadherin, oseltamivir phosphate, gemcitabine, chemoresistance, neuraminidase, EMT, spheroid
Introduction
Development of new forms of cancer therapy is an emerging research area. The focus is to establish more innovative and accurate in vitro models that mimic the in vivo tumor and to simulate the tumor microenvironment.1,2 An understanding of the inter-complexity between cancer cells and their organ-specific microenvironments has provided an opportunity to develop novel therapies.3 Developing an optimal in vitro tumor model has its challenges. Monolayer cell culture models do not represent tumor cell interactions with their microenvironment involving the nutrient, oxygen, and catabolites that exist in solid tumors in vivo.4–6 In vitro tumor models should have three dimensional (3D) spatial organization with heterogeneous multicellular systems, addressing metabolic specificities and complex interplay of cell–cell and cell–extracellular matrix (ECM) interactions. The cell and ECM contacts influence the response of tumor cells to different subsets of cells within the microenvironment. The in vitro 3D culture techniques have shown superiority to conventional monolayer cultures, allowing a more accurate simulation of the tumor microenvironment, cancer cell phenotypes, and their behavior in response to drugs similar to those detectable in vivo.1 The 3D multicellular tumor spheroids (MCTSs) are now being developed.7,8 They closely resemble small avascular tumors with complex cell–cell and cell–matrix interactions.9,10 In addition, MCTS is a powerful 3D in vitro model to study tumor and tumor cell proliferation, morphology, cell invasion, drug binding, and chemo-resistance.11–14 Compared with two dimensional (2D) monolayer cell platforms, MCTS expresses increased resistance to chemotherapy, perhaps due to their ability to mimic multicellular arrangements and ECM deposition of avascular tumors.15 The MCTS also simulates cell–cell and cell–microenvironment interactions that are necessary for cancer cell processes like epithelial–mesenchymal transition, chemotherapy resistance, and metastasis.14,16 These properties of MCTS are particularly relevant to prostate cancer (PCa) studies. PCa possesses a microenvironment that is characterized by hypoxia, acidosis, and nutrient deprivation.2 Ellem et al have also discussed in detail the formation of prostaspheres that develop into spherical multicellular aggregates within a 3D culture system.2
PCa is the fifth leading cause of death from cancer in men globally, estimating approximately >300,000 deaths worldwide in 2012.17 The mechanisms of PCa initiation, progression, and metastasis still remain poorly understood. The development of PCa may be dependent on genetic and environmental factors. Wallace et al have identified 17 different pathways that are altered in PCa.18 However, the molecular mechanisms governing the formation and progression of PCa are still not well understood.19,20 Of the many techniques to study PCa formation and development, prostaspheres produced from PCa cells grown suspended in a purified ECM gel/matrix in vitro2,16,21 or within a hanging drop2 represent the most commonly used systems in the field. Other commonly used techniques for spheroid formation may include spontaneous aggregation, spinner flasks, rotatory cell culture systems, liquid overlay, low binding plates, microencapsulation, and cell cultivation in ultra-low attachment round-bottom plates where cell aggregation occurs as a result of mechanical forces or surface properties, preventing cell attachment to the bottom of the well.7,11,15,22–26 These methods have several limitations and drawbacks including lack of rapidity, reproducibility, simplicity, and less cost-effectiveness.27 Experimentally, these models have other common problems such as efficiency of forming spheroids, long-term culture maintenance, control of spheroid size, necrotic cores in large spheroids, and poor control of cell distribution. Although these systems provide a significant advance over 2D models in representing in vivo tumors, they also remain poorly representative of the natural heterogeneity of the prostate. There is no control of assembly and structure and only very limited spatial or glandular organization. Nevertheless, prostasphere-based 3D culture models have yielded important information regarding the development of PCa, highlighting the role of cell–cell interactions and the importance of the stroma and ECM in the microenvironment.
There is now interest in developing more realistic in vitro models of human tumors that mimic the key properties of the tumor microenvironment. To this end, in vitro models of PCa are being derived from patient’s biopsy specimens to generate organoids that recapitulate the tissue histology and lineage hierarchy of the tumor in vitro. Gao et al28 reported success in the generation of organoids and provided detailed molecular characterization of seven human-derived PCa organoid lines derived from diverse disease sites including circulating tumor cells. The organoid lines recapitulated the phenotype and diversity of castrate-resistant PCa, androgen receptor (AR)-dependent adenocarcinoma, AR-negative adenocarcinoma, neuroendocrine carcinoma, and squamous differentiation.28 More importantly, these organoid lines were found to be amenable to drug testing both in vitro and in vivo.28 The prostate organoids derived from a biopsy specimen may indeed provide the next-generation sequencing or in vitro therapeutic trials in a clinically meaningful way.29 Karthaus et al30 have recapitulated prostate gland architecture by using organoid approach where both basal and luminal cellular populations were found to contain bipotent progenitor cells that retain full differentiation toward basal and luminal lineages in vitro. These organoid cultures were proposed to be an ideal study tool for the initiation of PCa. However, it is noteworthy that the efficiency for establishing continuously propagated organoid lines from metastatic biopsies was ~15%–20%, which may be highly dependent on the growth conditions.28 In addition, these tumor organoids are reproducibly maintained for 1–2 months, but many of them were populated by tumor-associated spindle cells or normal epithelial cells present in the biopsy material. Drost et al31 describe a strategy protocol for the generation of 3D prostate organoid cultures from healthy mouse and human prostate cells, which are highly dependent on the culture medium components involving several critical steps for successful organoids. Furthermore, the 3D organoid model has a low split rate and a low proliferation rate, which may present difficulties in time-sensitive cell culture experiments. Another limitation is that the organoid model contains both normal and cancerous PCa cells, and the normal cells tend to outgrow the cancerous PCa cells.
The 3D spheroid model using cyclic Arg-Gly-Asp-D-Phe-Lys (cyclo-RGDfK) peptide modified with 4-carboxybutyl-triphenylphosphonium bromide (cyclo-RGDfK(TPP)) peptide, which only contains cancerous PCa cells, may be better suited for in vitro cancer research. To this end, Akasov et al have developed a more effective one-step highly reproducible technique of 3D spheroid formation by using synthetic cyclo-RGDfK peptide that closely mimics the natural ECM proteins binding to α5β1 integrins on the cell membrane.32 The cyclo-RGDfK peptide promotes self-assembly of cancer cells, avoiding cell-plate surface adhesion.4 Cyclo-RGDfK peptide and α5β1 integrin interactions facilitate cadherin expressions on the cell membrane. Cadherin–cadherin interactions among the cancer cells result in cell compaction and spheroid formation.16 In addition, the self-assembly formation of monolayer cultures into MCTS is enhanced by the cyclo-RGDfK(TPP) peptide to facilitate cell aggregation. Figure 1 depicts the graphical abstract of cyclo-RGDfK(TPP) peptide and α5β1 integrin interactions. These interactions are proposed to facilitate increased E-cadherin expressions on the cell membrane. The spheroids formed by cyclo-RGDfK(TPP) peptide have been shown to have an average diameter range of 80 μm and vary among different cancer cell lines and serum concentration in the medium.4 The report also proposed that the cyclo-RGDfK(TPP) peptide mimics the ability of natural ECM protein to induce cell aggregation via α5β1 integrin. Similar reports by other groups have proposed that formation of MCTS depends on the interactions between cell surface glycosylated integrins such as αvβ3 and α5β1 and their ligands fibronectin, laminin, and collagen.4,33–35
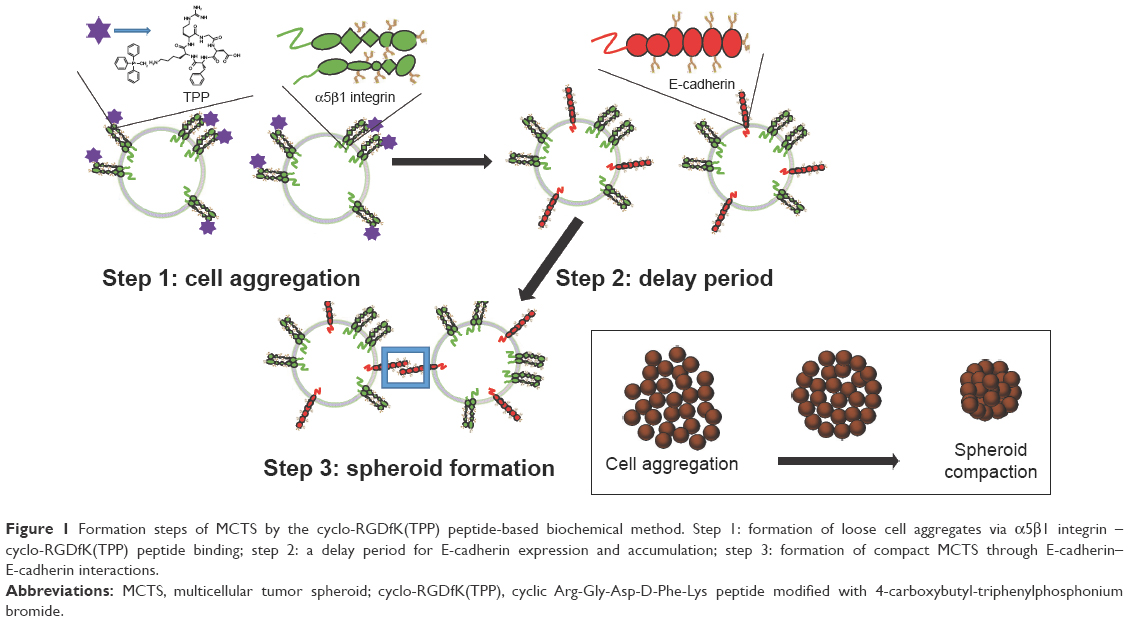 | Figure 1 Formation steps of MCTS by the cyclo-RGDfK(TPP) peptide-based biochemical method. Step 1: formation of loose cell aggregates via α5β1 integrin – cyclo-RGDfK(TPP) peptide binding; step 2: a delay period for E-cadherin expression and accumulation; step 3: formation of compact MCTS through E-cadherin–E-cadherin interactions. |
Aberrant patterns of glycosylation have also emerged as one of the hallmarks of cancer including acquired chemoresistance.36 Developmental patterns of tumor growth, progression cell invasiveness, and metastatic ability are highly influenced by aberrant cell surface-specific sialoglycan structures on glycoproteins like integrins αvβ3, αvβ5, α5β1, and α6β4.37–42 Slambrouck et al showed that in androgen-sensitive human prostate adenocarcinoma LNCaP-derived C4-2B PCa cells, the adhesion between integrin α2β1 and collagen type I is dependent on cell surface α2,3-sialylation of α2 subunits of the integrin receptor.43 Hypersialylation of integrin β1 activates integrin signaling and enhances colon cancer cell progression and metastasis probably due to enhanced α2,6-sialyltransferase activity.38 Similarly, Park et al linked raised levels of cell surface α2,6-sialic acids (SAs) to colorectal cancer invasion, spread, and chemotherapy resistance due to increased expression of β-galactoside α2,6-sialyltransferase.44 The effect of altered sialoglycan pattern of αvβ3 integrin on metastatic potential of melanoma cells was examined by Pochec′ et al.45 They observed that metastatic spread of melanoma cells is facilitated by αvβ3- and β1-6-branched sialylated complex-type N-glycans.
Despite a clear association between hypersialylation and PCa progression and metastasis, the role of aberrant sialoglycan patterns in the formation of MCTS is not well defined. The authors have previously showed that sialylation promotes the formation of MCTS in both parental and chemoresistant human breast MCF7 and pancreatic PANC1 cell lines by using the cyclo-RGDfK(TPP) peptide platform.46 This study hypothesizes that sialylation of cell surface glycoproteins promotes the formation of 3D prostaspheres in vitro. The data in this report support the hypothesis. The relative levels of specific sialoglycan structures on the cell surface correlate with the ability of PCa cells to form avascular multicellular prostaspheres and to further the understanding of the mechanism of the development of PCa in vivo.
Materials and methods
Reagents
Cyclo-RGDfK was synthesized and modified with 4-carboxy-butyl-triphenylphosphonium bromide to prepare a cyclo-RGDfK(TPP) peptide in the laboratory of Prof S Burov, Saint-Petersburg, Russia, by using standard methods of peptide synthesis.4 Maackia amurensis lectin 2 (MAL-II), Sambucus nigra lectin (SNA), and peanut agglutinin (PNA) were bought from Vector Laboratories Inc. (Burlingame, CA, USA) MAL-II binds to α2,3-SAlinked to terminal galactose and SNA to α2,6-SAlinked to terminal galactose and to lesser degree α2,3 linkage.47 PNA binds to Gal-β(1-3)-GalNAc. Neuraminidase (Neu) from Vibrio cholerae was obtained from Gibco laboratories (Thermo Fisher Scientific, Waltham, MA, USA). Neu hydrolyzes terminal N- or 0-acylneuraminic acids which are α2,6-, α2,3-, or α2,8-linked (rate: α2,6>α2,3>α2,8) to glycoconjugates. Oseltamivir phosphate (OP) solution was prepared by dissolving 75 mg Tamiflu (Hoffman-La Roche Ltd., Basel, Switzerland) capsule in sterile 1× phosphate-buffered saline (PBS) followed by centrifugation at 1,000 rpm for 10 minutes.48 The stock extracted OP at 20 mg/mL was characterized to have identical properties as the pure OP compound.48 Working dilutions of OP (50–800 μg/mL) were prepared in cell culture-conditioned medium (1× Dulbecco’s Modified Eagle’s Medium [DMEM])-conditioned medium supplemented with 10% fetal calf serum (FCS; HyClone, Logan, UT, USA), and 5 μg/mL plasmocinTM (InvivoGen, San Diego, CA, USA) and were used for the in vitro experiments.
Cell lines
PC3 (human prostate carcinoma, epithelial-like, ATCC® CRL1435™) and DU145 (human prostate carcinoma, epithelial-like ATCC® HTB-81™) derived from the metastatic site in the bone and brain were purchased from ATCC (Manassas, VA, USA) collection. PC3 and DU145 cells do not express the AR and prostate-specific antigen49 but exhibit low levels of acid phosphatase and testosterone-5-α reductase activity.50 The cells were grown in 1× DMEM-conditioned medium supplemented with 10% FCS (HyClone), and 5 μg/mL plasmocin™ (InvivoGen) in a 5% CO2 incubator at 37°C. At ~80% confluence, the cells were passaged at least five times before use in the experiments. Gemcitabine-resistant PC3 (PC3GemR) and DU145 (DU145GemR) variant cell lines were cultured in conditioned medium containing 0.01 μM gemcitabine for over 1 year.
Lectin cytochemistry staining for SA
Cells were cultured in 24-well tissue culture plate with glass coverslips for 24 hours in CO2-incubator at 37°C. The PC3, DU145, and the chemoresistant variant cells were fixed with 4% paraformaldehyde (PFA) for 20 minutes at room temperature followed by washing with 1× PBS pH 7.4. Cells were incubated with MAL-II (biotinylated M. amurensis lectin II, B-1265; Vector Laboratories Inc.) and SNA (biotinylated elderberry bark lectin, B-1305; Vector Laboratories Inc.) at a concentration of 10 μg/mL in PBS for 1 hour at room temperature. The cells were washed three times with 1× PBS. After washing, the cells were incubated with streptavidin-conjugated Alexa Fluor 594 for 1 hour at room temperature in the dark. The background controls were cells with no biotinylated lectins added in the above procedure. After three washings with 1× PBS, slides were mounted on fluorescent mounting media and analyzed with Carl Zeiss Imager 2 fluorescence microscope at 200× and 400× magnification.
WST-1 cell proliferation assay
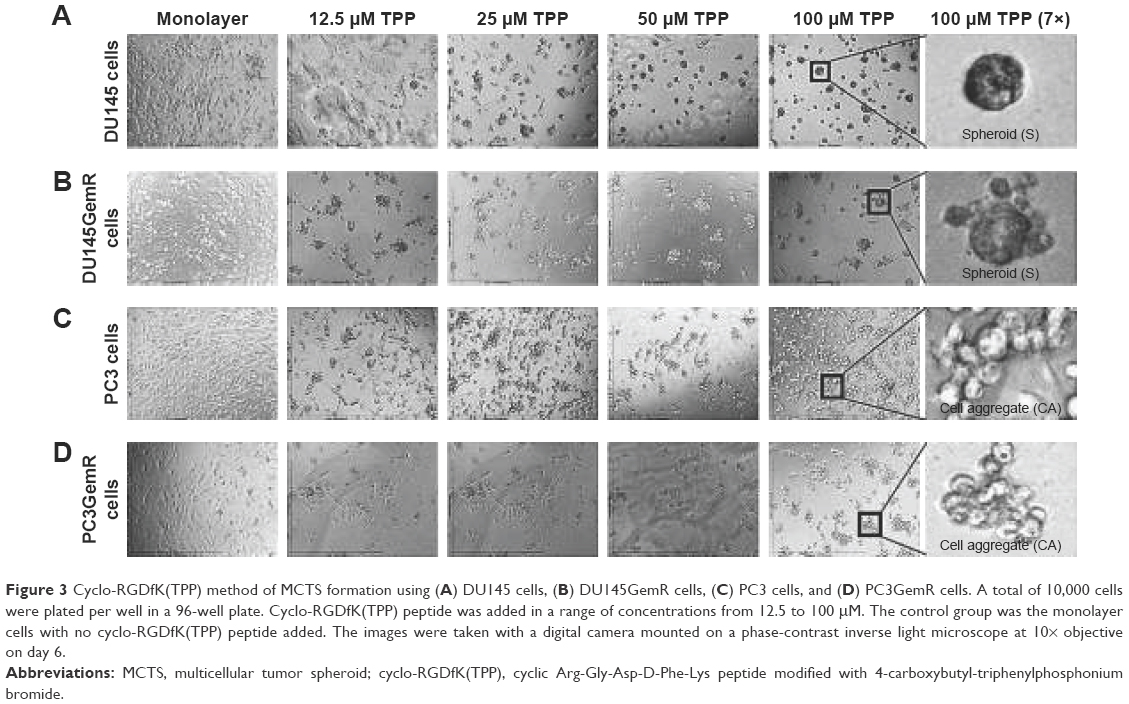
WST-1 assay is a measure of cell viability based on the cleavage of the WST-1 tetrazolium salt to soluble formazan by cellular mitochondrial dehydrogenase enzyme.51 The absorbance recorded at 450 nm is directly proportional to the number of living cells in culture. Cells were grown to 80%–90% confluence in T25 flasks, and seeded in a 96-well tissue culture plate at a density of 10,000 cells/well for 3 hours followed by addition of 50 μM cyclo-RGDfK(TPP) peptide directly to the cells. They were treated with different concentrations of MAL-II, SNA, PNA, Neu (V. cholerae), and OP or left untreated for 6 days. The spheroids and the attached cells were incubated with 10 μL of WST-1 reagent (Roche Diagnostics Division de Hoffman La Roche Limitée, Laval-des-Rapides, QC, Canada) for 2 hours at 37°C. Cell viability was determined as a percentage of control and illustrated as a bar graph by using GraphPad Prism software (GraphPad Software, Inc., La Jolla, CA, USA). The following formula was used to determine cell viability as a percent of control for each time point after each lectin or drug treatment:
|
The cells growing in the conditioned medium containing 50 μM cyclo-RGDfK(TPP) peptide are the control group.
Flow cytometry analysis
Cells were grown to ~90% confluence in T75 flasks. For the measurement of terminal SA, cells were stained with biotinylated MAL-II or SNA for 1 hour on ice. They were washed 3× with 1× PBS supplemented with 2% FCS followed by DyLight488-conjugated streptavidin (BioLegend Inc., San Diego, CA, USA) for 30 minutes on ice and fixed with 2% PFA. Controls without lectin were used to normalize for background fluorescence and were only incubated with DyLight488-conjugated streptavidin. For the detection of E- and N-cadherin, live cells were stained with anti-E- or N-cadherin rabbit monoclonal antibody (Cell Signaling Technology, Inc., Danvers, MA, USA) for 1 hour on ice. The cells were washed 3× with PBS supplemented with 2% FCS, stained with DyLight 488-conjugated goat anti-rabbit immunoglobulin (IgG) (Santa Cruz Biotechnology Inc., Dallas, TX, USA) for 30 minutes on ice, and fixed by using 2% PFA. Control wells without primary antibody were used to normalize for background fluorescence and were only stained with secondary DyLight488-conjugated goat anti-rabbit IgG. A total of 5×10⁵ cells were analyzed by Beckman Coulter Cytomics FC500 flow cytometry and CxP software (Beckman Coulter, Inc., Brea, CA, USA) in the Queen’s University Biomedical Imaging Center (QUBIC). The median fluorescence for each histogram is represented for 100% gated cells.
Sialidase assay
The sialidase activity assay was performed as described previously.52,53 Briefly, cells were incubated overnight on 12 mm sterile circular glass slides in a conditioned medium in a 24-well plate. After removing the medium, each well was supplemented with 0.318 mM 2-(4-methylumbelliferyl)-D-N-acetylneuraminic acid (4-MUNANA; Biosynth International, Itasca, IL, USA) substrate in Tris-buffered saline (TBS, pH 7.4) and select wells were stimulated with epidermal growth factor (EGF, 100 μg/mL). The substrate is hydrolyzed by cell surface membrane sialidase to give free 4-methylumbelliferone that has a fluorescence emission of 450 nm (blue color) following an excitation at 365 nm. Fluorescent images were taken after 1–2 minutes by using epi-fluorescent microscopy (10× objective). Mean fluorescence surrounding the cells was quantified using ImageJ (National Institutes of Health, Bethesda, MD, USA).
Phase-contrast microscopy and measurement of MCTS volume
The morphology of PC3, DU145, PC3GemR, and DU145GemR cells were studied before and after the addition of cyclo-RGDfK(TPP) peptide. The cells were plated in a 96-well plate and treated with cyclo-RGDfK(TPP) peptide, or a combination of cyclo-RGDfK(TPP) peptide and lectin, Neu, or OP. Any changes in cellular morphology, aggregation, and MCTS formation were observed. The wells were visualized by using inverted phase-contrast microscopy, and the images were acquired by using a scope-mounted camera (Thermo Fisher Scientific) at 4× and 10× magnification over 6 days. The diameter of MCTS was calculated by using the scale bar in the phase-contrast images. At least, 20 spheroids were measured per bar. ImageJ software was used to measure two diameters from each individual spheroid, which were then averaged and divided to calculate the average radius. This average radius was used in the volume calculations listed below. MCTS is defined as a compact, rounded spheroid with a distinct border of diameter ≥60 μm, containing cells indistinguishable from one another. The following formulae were used to determine spheroid volume as previously described in detail:4,5,32,46
10× objective images: V = (4/3) π r3, |
where r is the average radius (microns)
4× objective images: V = (2.5)(4/3) π r3, |
where r is the average radius (microns)
For the 4× objective images, the formula includes 2.5 to normalize the values to the 10× objective images.
Agarose-based and cyclo-RGDfK(TPP) peptide-based MCTS formation
MCTS formation by using the classical (agarose-based) method was performed as described previously.12 Briefly, 1.5% weight of agarose was heated in a water bath for 15 minutes. 50 μL of liquid agar was then pipetted into each well of a flat-bottomed 96-well plate. Cooling at room temperature for 15–20 minutes solidified the agar, and thus agarose-coated plates were formed. Cells were added to the agarose-coated plates at a concentration of 10,000 cells/well and incubated at 37°C for up to 1 week. Alternatively, cyclo-RGDfK(TPP) peptide-induced intercellular assembly and MCTS formation were performed as described previously.4,32 By using this method, cells were grown in a T25 flask to 90% confluence, then plated in a 96-well plate at a density of 10,000 cells/well (100 μL/well) in 1× DMEM containing 10% FCS, and further incubated for 2–3 hours at 37°C for them to adhere to the bottom of the wells. The medium was replaced with 100 μL of cyclo-RGDfK(TPP) peptide at concentrations ranging from 6 to 100 μM, diluted in 1× DMEM-conditioned medium. The cells were incubated for 6 days at 37°C in a humidified incubator.
Immunocytochemistry (ICC)
The localization and expression levels of E- and N-cadherin on PC3, DU145, PC3GemR, and DU145GemR were determined by using ICC analysis. Cells were plated on glass coverslips in a 24-well plate and incubated for 24 hours at 37°C. The cells were fixed with 4% PFA for 30 minutes on ice, washed with 1× PBS and blocked with 1% bovine serum albumin (BSA) in 1× PBS for 1 hour. Cells were then incubated with primary E- or N-cadherin rabbit monoclonal antibodies for 2 hours at room temperature. The cells were then washed 3× with PBS, stained with DyLight 594-conjugated goat anti-rabbit IgG (Santa Cruz Biotechnology Inc.) for 2 hours at room temperature. Background fluorescence was normalized by controlling for cells incubated with secondary antibody alone. Fluorescent images were captured by using a Zeiss M2 fluorescence microscope (Carl Zeiss Meditec AG, Jena, Germany) at 200× and 400× magnification and quantified by using Corel Photo Paint 8.0 software.
Results
Generation of matrix-free prostaspheres
This study compared two methods for determining the efficiency of in vitro MCTS formation by using the classical agarose-based and the biochemical cyclo-RGDfK(TPP) peptide-based methods. Androgen-independent parental DU145 and PC3 cells and GemR variants, DU145GemR and PC3GemR cells, were used to form matrix-free MCTS by using the classical7 and cyclo-RGD-induced method.32
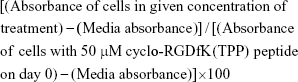
Both DU145 and DU145GemR form loose cell aggregates in the agarose-coated well technique (Figure 2A and B). In contrast, by using the cyclo-RGDfK(TPP) peptide-based method, DU145 and DU145GemR cells formed small spheroids, but DU145 cells were observed to form tighter compact spheroids of diameter ≥60 μm. These results are consistent with another report that has shown DU145 cells forming tight spheroids by 3D matrigel culture method.54
 | Figure 2 Prostaspheres of (A) DU145 and (B) DU145GemR cells by the classical agarose and cyclo-RGDfK(TPP) peptide methods in a time-dependent manner. The images were taken with a digital camera mounted on a phase-contrast inverse light microscope at 10× magnification. A total of 10,000 cells/well were plated on 1.5% weight of agarose-coated 96-well plates for 7 days in the classical agarose method. For the cyclo-RGDfK(TPP) peptide method, 10,000 cells were added to each well in a 96-well plate. Cyclo-RGDfK(TPP) peptide was added at a concentration of 50 μM for both DU145 and DU145GemR cells (A and B). |
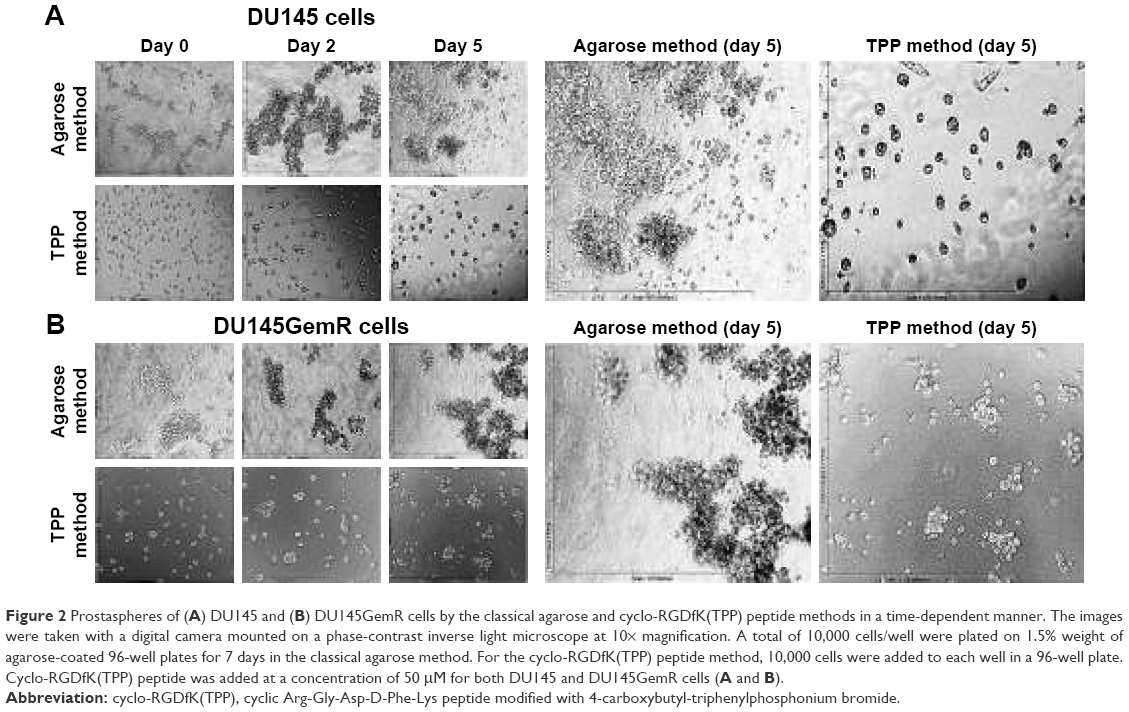
Figure 3 illustrates the formation of MCTS by using the cyclo-RGDfK(TPP) peptide-based method. The optimal formation of MCTS by using the four PCa cell lines was investigated by using cyclo-RGDfK(TPP) peptide at different concentrations over various time points. DU145 cells formed tight compacted MCTS with increasing incubation time (1–6 days) over the concentration range of 12.5–100 μM (Figure 3A). DU145GemR cells started to aggregate and initiated the formation of MCTS at a lower concentration of cyclo-RGDfK(TPP) peptide (12.5 μM), whereas DU145 cells exposed to the same cyclo-RGDfK(TPP) peptide concentration did not form MCTS and remained as a monolayer culture.
 | Figure 3 Cyclo-RGDfK(TPP) method of MCTS formation using (A) DU145 cells, (B) DU145GemR cells, (C) PC3 cells, and (D) PC3GemR cells. A total of 10,000 cells were plated per well in a 96-well plate. Cyclo-RGDfK(TPP) peptide was added in a range of concentrations from 12.5 to 100 μM. The control group was the monolayer cells with no cyclo-RGDfK(TPP) peptide added. The images were taken with a digital camera mounted on a phase-contrast inverse light microscope at 10× objective on day 6. |
PC3 and PC3GemR cells formed irregular multicellular aggregates at all concentrations of cyclo-RGDfK(TPP) peptide (Figure 3C and D). There were no visible MCTS even after 6 days of incubation. Exposure to 100 μM cyclo-RGDfK(TPP) peptide induced PC3GemR cells to form irregular multicellular aggregates, whereas PC3 cells demonstrated a mixture of adhered monolayer cells and irregular multicellular aggregates. To determine whether a longer incubation time had an effect on MCTS formation and/or size, all the four cell lines were incubated at 37°C for up to 18 days (data not shown). Notably, there were no significant differences in the formation of MCTS and diameter for an incubation interval of 6 days or longer. The data suggest that 6 days of incubation with 50 μM cyclo-RGDfK(TPP) peptide were optimal conditions for the formation of MCTS.
Irregular spheroids and loose cell aggregates have been previously reported for malignant melanoma A-375 and human glioblastoma A-172 cell lines using the cyclo-RGDfK(TPP) peptide method.32 The findings of the present study with the PC3 PCa cells do not support the premise that spheroid-forming ability of cancer cells is directly proportional to their malignant potential.32 In contrast, the results with the PC3 cells were quite different from that observed by Harma et al,54 where tight compact spheroids were formed by using the 3D matrigel culture system. The cyclo-RGDfK(TPP) peptide method relies on the biochemical interactions of cell–cell adhesions involving α5β1 integrin4,32 and E-cadherin,16,35 which may explain the difference of MCTS formation through 3D matrigel and cyclo-RGDfK(TPP) peptide methods. The reasons for these findings are unclear. Tran et al55 have demonstrated a lack of E-cadherin expression in PC3 cells, which may explain the difficulty of PC3 cells forming spheroids through the cyclo-RGDfK(TPP) peptide method.
Formation of MCTS is associated with higher levels of E-cadherin expression on the surface of PCa cells
ICC and flow cytometry analyses were used to determine whether the ability of PCa cells to form MCTS is associated with the relative levels of cell surface adhesion molecules. DU145 cells expressed higher levels of E-cadherin in comparison with PC3 cells (Figure 4A and B), whereas expectedly N-cadherin expression levels were found to be much lower in DU145 cells than that for PC3 cells. The higher E-cadherin expression in DU145 cells may contribute to the formation of tight compacted and well-defined MCTS. These results are consistent with what others have reported.56 Through flow cytometry analyses of the data (Figure 4C), it has been shown that there are no significant differences between the relative expression levels of E- versus N-cadherin on PC3 and DU145 cells.
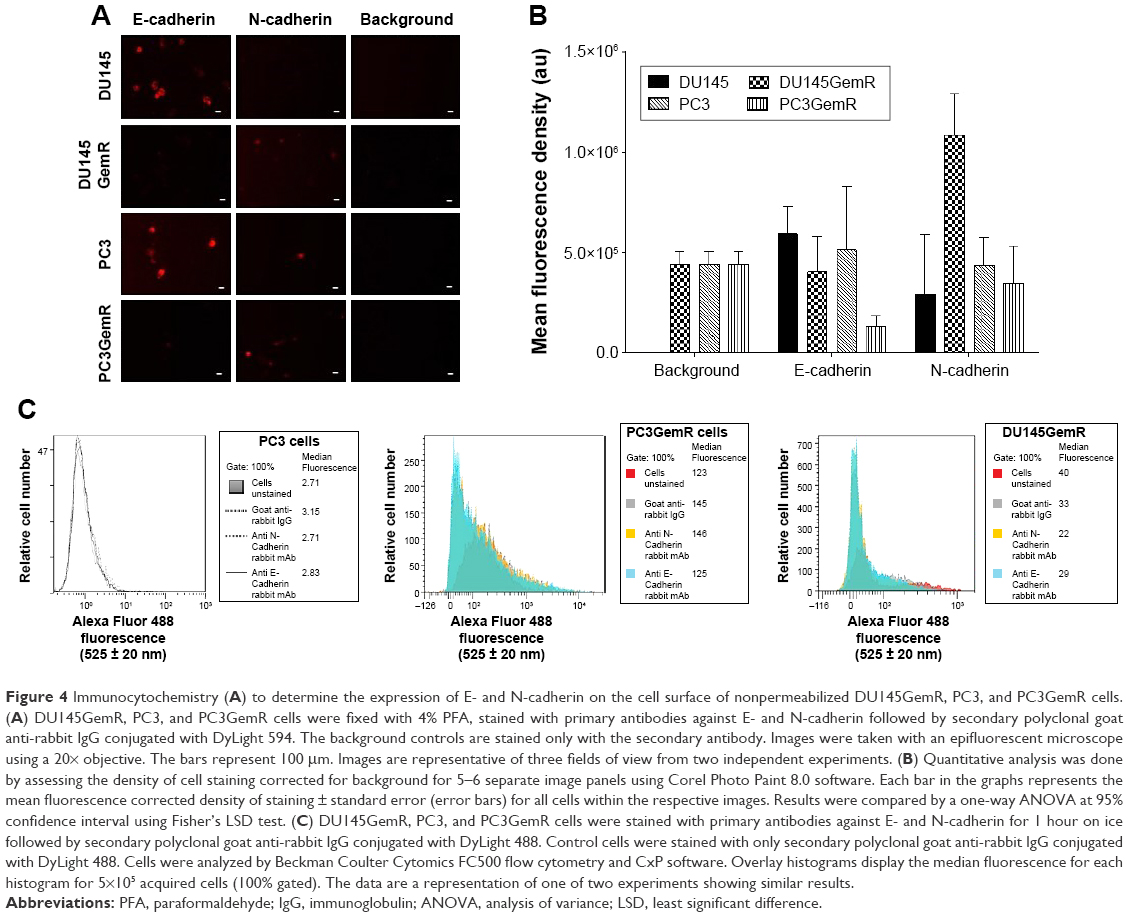 | Figure 4 Immunocytochemistry (A) to determine the expression of E- and N-cadherin on the cell surface of nonpermeabilized DU145GemR, PC3, and PC3GemR cells. (A) DU145GemR, PC3, and PC3GemR cells were fixed with 4% PFA, stained with primary antibodies against E- and N-cadherin followed by secondary polyclonal goat anti-rabbit IgG conjugated with DyLight 594. The background controls are stained only with the secondary antibody. Images were taken with an epifluorescent microscope using a 20× objective. The bars represent 100 μm. Images are representative of three fields of view from two independent experiments. (B) Quantitative analysis was done by assessing the density of cell staining corrected for background for 5–6 separate image panels using Corel Photo Paint 8.0 software. Each bar in the graphs represents the mean fluorescence corrected density of staining ± standard error (error bars) for all cells within the respective images. Results were compared by a one-way ANOVA at 95% confidence interval using Fisher’s LSD test. (C) DU145GemR, PC3, and PC3GemR cells were stained with primary antibodies against E- and N-cadherin for 1 hour on ice followed by secondary polyclonal goat anti-rabbit IgG conjugated with DyLight 488. Control cells were stained with only secondary polyclonal goat anti-rabbit IgG conjugated with DyLight 488. Cells were analyzed by Beckman Coulter Cytomics FC500 flow cytometry and CxP software. Overlay histograms display the median fluorescence for each histogram for 5×10⁵ acquired cells (100% gated). The data are a representation of one of two experiments showing similar results. |
Cell surface expression of α2,3-SA and α2,6-SA on PCa cells promotes the formation of MCTS
Developmental patterns and progression of tumor growth are highly influenced by aberrant cell surface-specific sialoglycan structures on glycoproteins.37 This study investigated the extent of SA levels on the cell surface of PC3 and PC3GemR (Figure 5) and DU145 and DU145GemR cells (Figure 6). ICC and flow cytometry analyses were performed by using α2,3-SA-specific MAL-II and α2,6-SA-specific SNA lectins. PC3GemR show similar levels of α2,6-SA and α2,3-SA levels (Figure 5). However only PC3 cells (Figure 5G) expressed 4 times more α2,3-SA than α2,6-SA. Among the four cell lines, PC3 shows the highest level of α2,3-SA on the cell surface. Both the parental and GemR DU145 cells express 5 times more α2,6-SA than α2,3-SA levels on the cell surface (Figure 6). Similar findings of increased sialylation in resistant cancer cells have been reported previously in acute myeloid leukemia57 and colorectal cancer.44 Figure 7 illustrates the combined α2,3-SA and α2,6-SA expressions on the four cell lines. PC3GemR cells express 1.4 times more α2,6-SA than α2,3-SA.
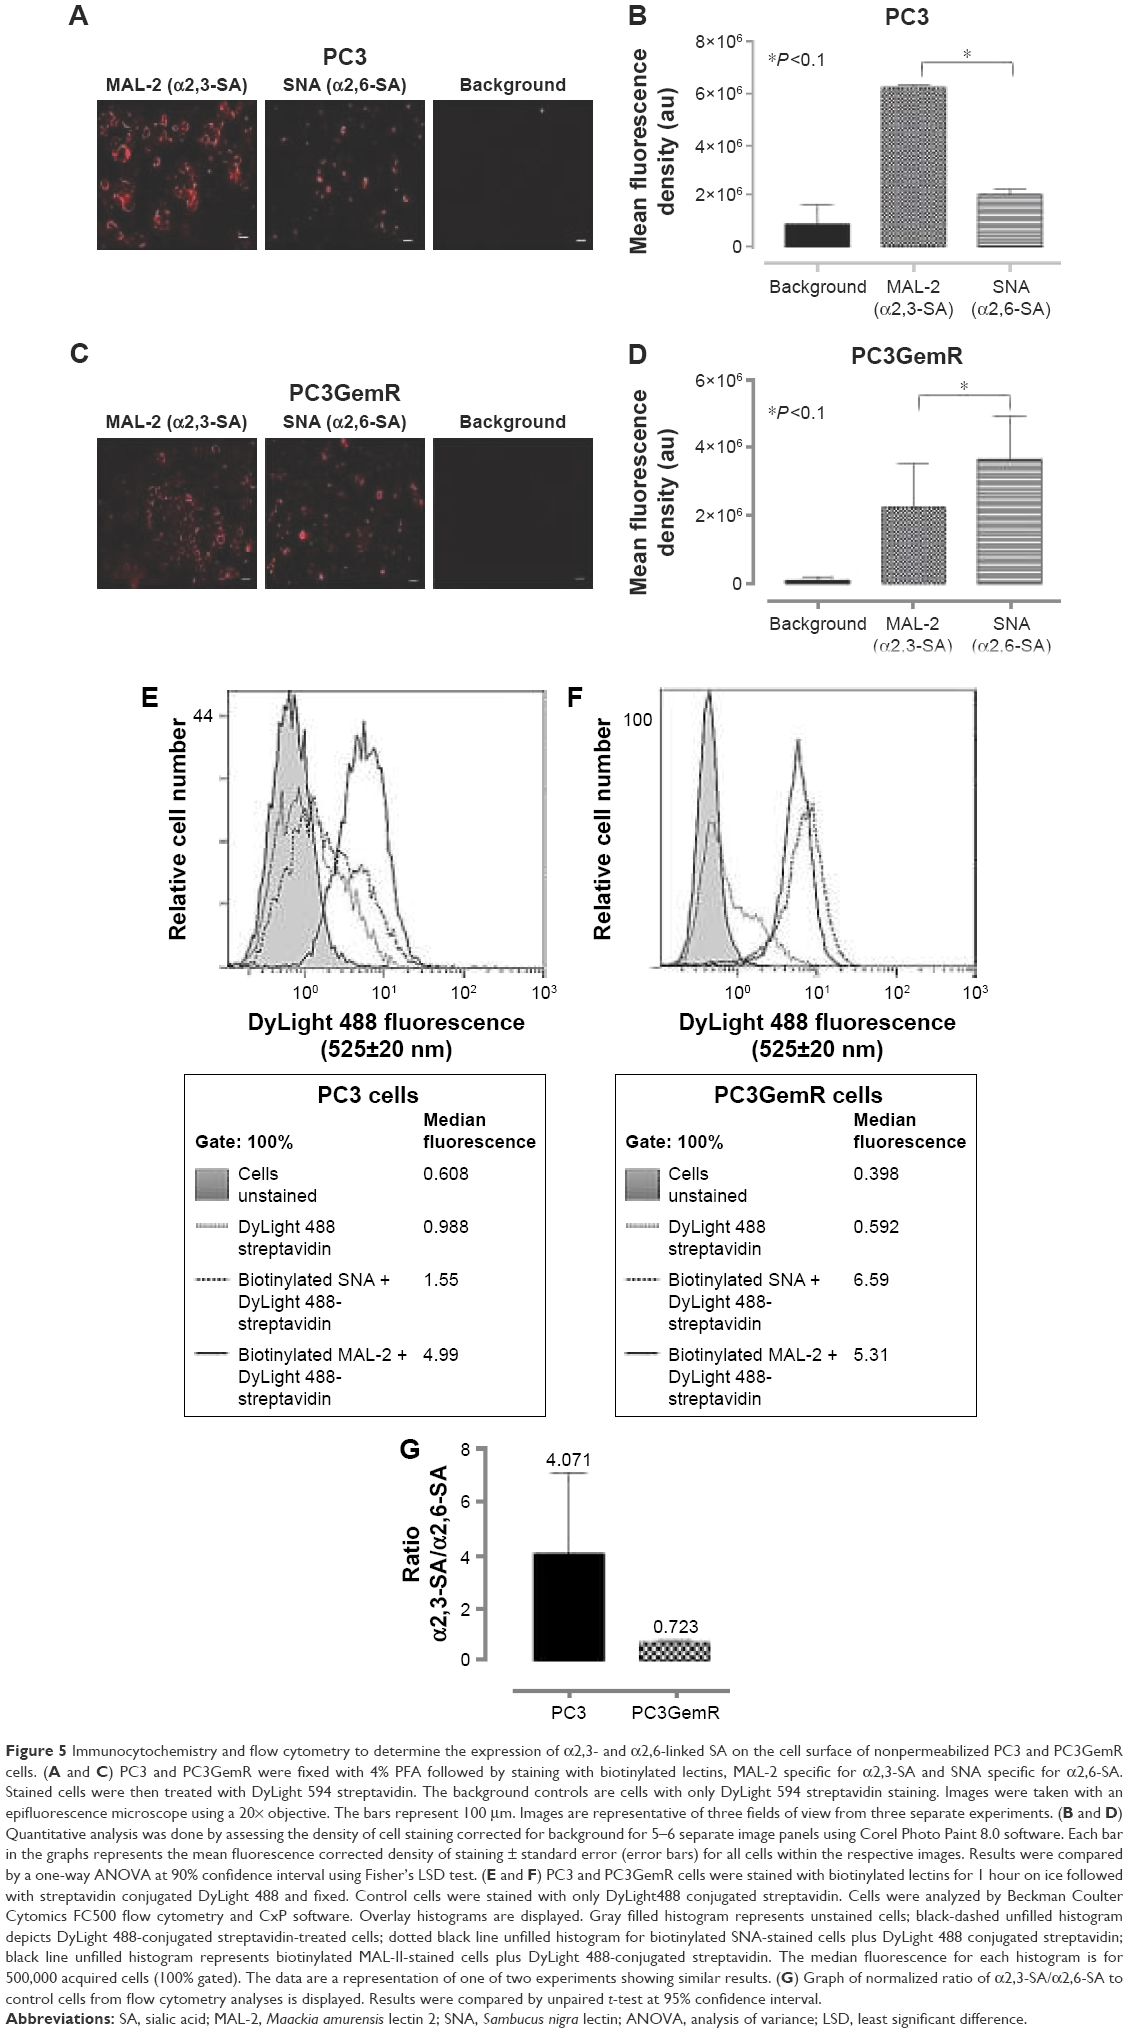 | Figure 5 Immunocytochemistry and flow cytometry to determine the expression of α2,3- and α2,6-linked SA on the cell surface of nonpermeabilized PC3 and PC3GemR cells. (A and C) PC3 and PC3GemR were fixed with 4% PFA followed by staining with biotinylated lectins, MAL-2 specific for α2,3-SA and SNA specific for α2,6-SA. Stained cells were then treated with DyLight 594 streptavidin. The background controls are cells with only DyLight 594 streptavidin staining. Images were taken with an epifluorescence microscope using a 20× objective. The bars represent 100 μm. Images are representative of three fields of view from three separate experiments. (B and D) Quantitative analysis was done by assessing the density of cell staining corrected for background for 5–6 separate image panels using Corel Photo Paint 8.0 software. Each bar in the graphs represents the mean fluorescence corrected density of staining ± standard error (error bars) for all cells within the respective images. Results were compared by a one-way ANOVA at 90% confidence interval using Fisher’s LSD test. (E and F) PC3 and PC3GemR cells were stained with biotinylated lectins for 1 hour on ice followed with streptavidin conjugated DyLight 488 and fixed. Control cells were stained with only DyLight488 conjugated streptavidin. Cells were analyzed by Beckman Coulter Cytomics FC500 flow cytometry and CxP software. Overlay histograms are displayed. Gray filled histogram represents unstained cells; black-dashed unfilled histogram depicts DyLight 488-conjugated streptavidin-treated cells; dotted black line unfilled histogram for biotinylated SNA-stained cells plus DyLight 488 conjugated streptavidin; black line unfilled histogram represents biotinylated MAL-II-stained cells plus DyLight 488-conjugated streptavidin. The median fluorescence for each histogram is for 500,000 acquired cells (100% gated). The data are a representation of one of two experiments showing similar results. (G) Graph of normalized ratio of α2,3-SA/α2,6-SA to control cells from flow cytometry analyses is displayed. Results were compared by unpaired t-test at 95% confidence interval. |
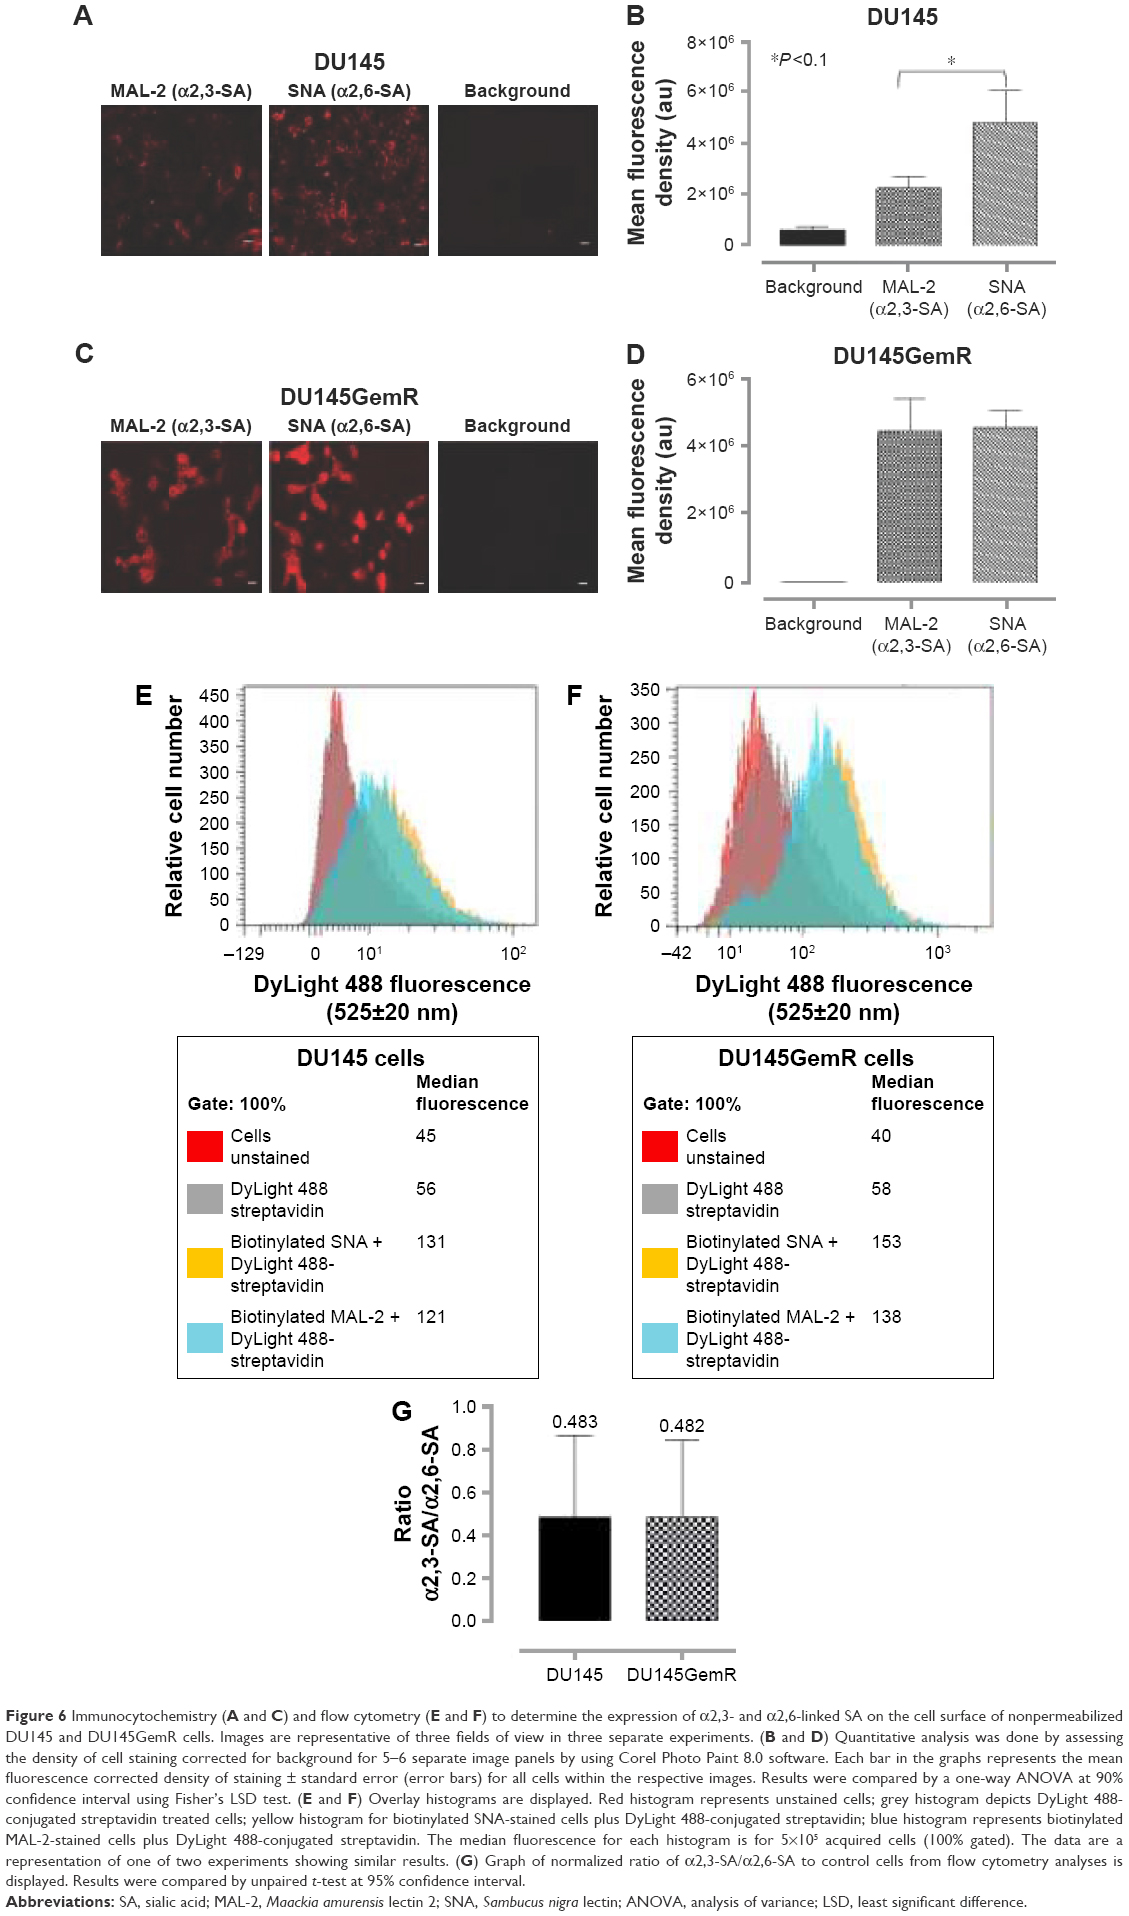 | Figure 6 Immunocytochemistry (A and C) and flow cytometry (E and F) to determine the expression of α2,3- and α2,6-linked SA on the cell surface of nonpermeabilized DU145 and DU145GemR cells. Images are representative of three fields of view in three separate experiments. (B and D) Quantitative analysis was done by assessing the density of cell staining corrected for background for 5–6 separate image panels by using Corel Photo Paint 8.0 software. Each bar in the graphs represents the mean fluorescence corrected density of staining ± standard error (error bars) for all cells within the respective images. Results were compared by a one-way ANOVA at 90% confidence interval using Fisher’s LSD test. (E and F) Overlay histograms are displayed. Red histogram represents unstained cells; grey histogram depicts DyLight 488-conjugated streptavidin treated cells; yellow histogram for biotinylated SNA-stained cells plus DyLight 488-conjugated streptavidin; blue histogram represents biotinylated MAL-2-stained cells plus DyLight 488-conjugated streptavidin. The median fluorescence for each histogram is for 5×10⁵ acquired cells (100% gated). The data are a representation of one of two experiments showing similar results. (G) Graph of normalized ratio of α2,3-SA/α2,6-SA to control cells from flow cytometry analyses is displayed. Results were compared by unpaired t-test at 95% confidence interval. |
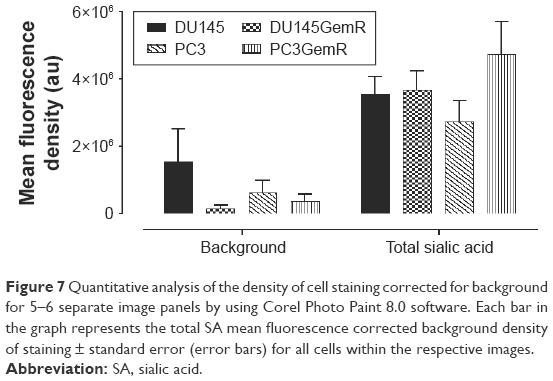 | Figure 7 Quantitative analysis of the density of cell staining corrected for background for 5–6 separate image panels by using Corel Photo Paint 8.0 software. Each bar in the graph represents the total SA mean fluorescence corrected background density of staining ± standard error (error bars) for all cells within the respective images. |
PCa cells express Neu1 sialidase activity in vitro
Since the resistant PC3GemR and DU145GemR cells seem to have more SA expression on the cell surface than their parental cell lines, whether these resistant cell lines have a diminished sialidase activity on their cell surface need to be determined. The authors have previously reported that several glycosylated growth factor receptors such as epidermal growth factor receptor (EGFR) are regulated by Neu1 sialidase activity.48,58,59 Activated Neu1 hydrolyzes α2,3-sialyl residues of the receptors, which allows the removal of steric hindrance between receptors, allowing subsequent kinase activation and cellular signaling. To determine whether the PCa cells express sialidase activity on the cell surface, a sialidase assay was performed as previously established and optimized.52,60,61 Sialidase activity is measured in the periphery surrounding the live cells due to the lysis of fluorogenic substrate 4-MUNANA into 4-methylumbelliferone product which has an emission wavelength of 450 nm. The mean fluorescence of 50 multipoint replicates surrounding the live cells were determined and quantified by using ImageJ (Figure 8B). As expected, DU145GemR cells show no differences in their sialidase activity unlike their parental DU145 cells (Figure 8). Notably, these differences are more significant between PC3 and PC3GemR cells (P<0.05).
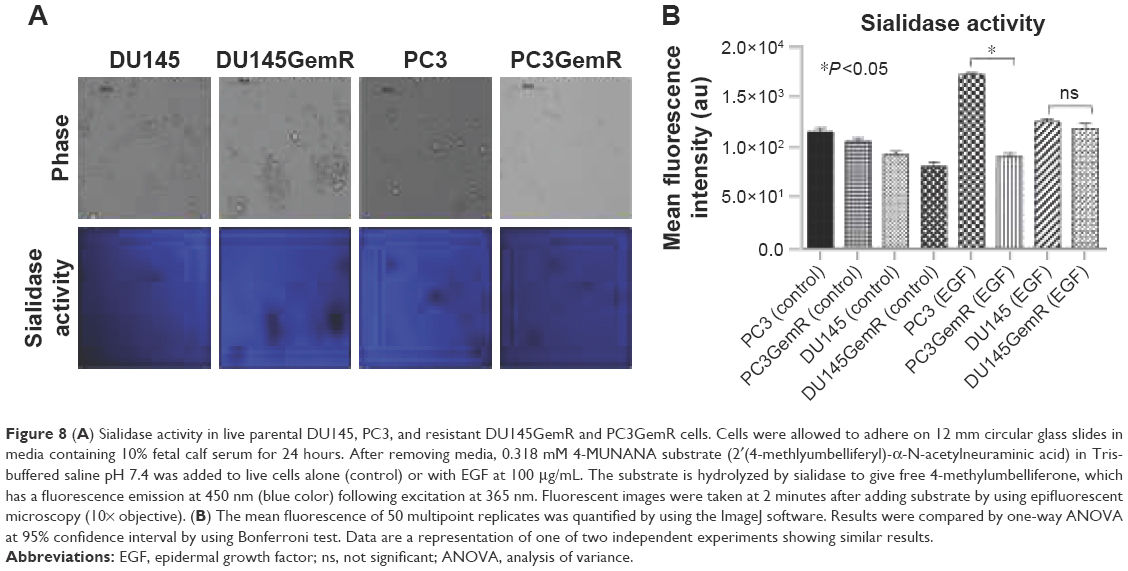 | Figure 8 (A) Sialidase activity in live parental DU145, PC3, and resistant DU145GemR and PC3GemR cells. Cells were allowed to adhere on 12 mm circular glass slides in media containing 10% fetal calf serum for 24 hours. After removing media, 0.318 mM 4-MUNANA substrate (2′(4-methlyumbelliferyl)-α-N-acetylneuraminic acid) in Tris-buffered saline pH 7.4 was added to live cells alone (control) or with EGF at 100 μg/mL. The substrate is hydrolyzed by sialidase to give free 4-methylumbelliferone, which has a fluorescence emission at 450 nm (blue color) following excitation at 365 nm. Fluorescent images were taken at 2 minutes after adding substrate by using epifluorescent microscopy (10× objective). (B) The mean fluorescence of 50 multipoint replicates was quantified by using the ImageJ software. Results were compared by one-way ANOVA at 95% confidence interval by using Bonferroni test. Data are a representation of one of two independent experiments showing similar results. |
Role of Neu1 sialidase inhibitor OP in the formation of prostasphere
Since OP inhibits Neu1 sialidase, which has been shown to form a complex with glycosylated receptors on the cell surface, the resulting function of OP treatment of the cells is to block Neu1 activity in cleaving of α2,3-sialyl residues on EGFR with enhanced α2,3-sialyl residues expression on the cell surface of cancer cells.58 This study investigated the role of α2,3-SA expression levels on the efficacy of cyclo-RGDfK(TPP) peptide-induced MCTS formation in parental and GemR DU145 and PC3 cells. Interestingly, the volume of resultant MCTS from all cell lines except PC3 decreased with increased concentration of OP from 50 to 200 μg/mL (Figure 9A and B). A WST-1 cell viability assay was performed to determine whether the decrease in MCTS volume was a result of a cytotoxic effect of OP. It was observed that ≥200 μg/mL OP significantly reduced the cell viability of DU145GemR and PC3GemR MCTS and cell aggregates (Figure 9C). Even though PC3 cells formed multicellular aggregates, the volume was not impacted by OP treatment. Strikingly, when pretreated with 100 μg/mL OP for 3 days, PC3 aggregates seemed to be have more regular spheroidal properties and tightly compacted compared with untreated aggregates (Figure 9F). These findings may be partially explained by the subsequent OP-mediated increase in the retention of cell surface α2,3-SA in comparison with α2,6-SA (Figure 5A, B, E, and G). As mentioned earlier, only PC3 cells expressed higher levels of α2,3-SA compared with α2,6-SA. All the other cell lines expressed more α2,6-SA than α2,3-SA on the cell surface (Figures 5 and 6).
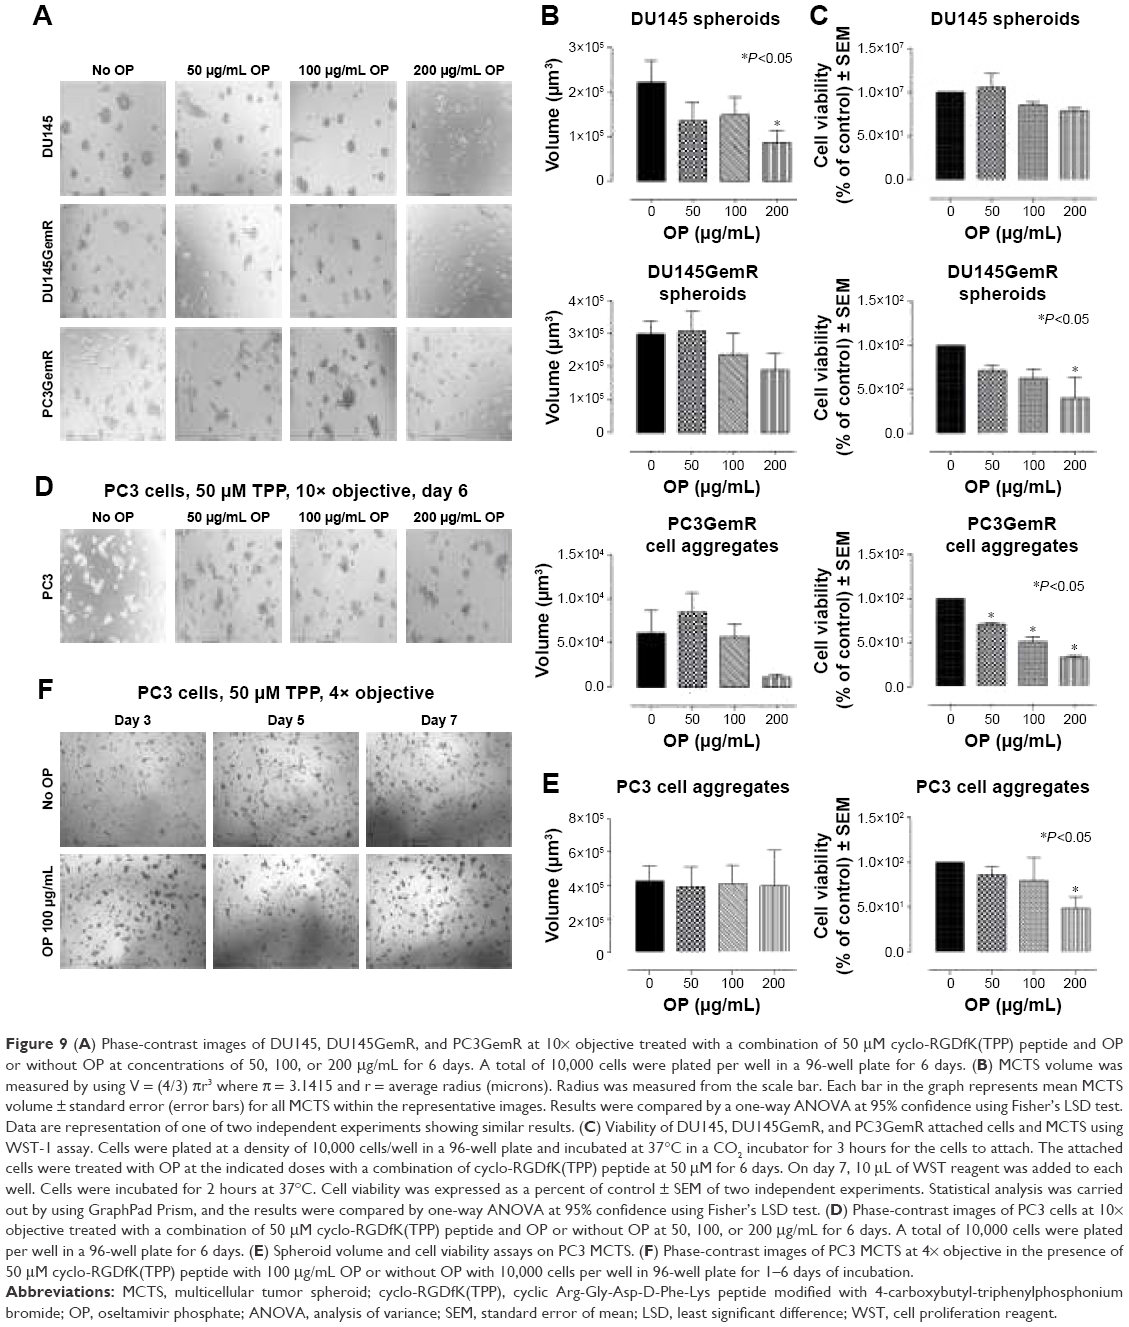 | Figure 9 (A) Phase-contrast images of DU145, DU145GemR, and PC3GemR at 10× objective treated with a combination of 50 μM cyclo-RGDfK(TPP) peptide and OP or without OP at concentrations of 50, 100, or 200 μg/mL for 6 days. A total of 10,000 cells were plated per well in a 96-well plate for 6 days. (B) MCTS volume was measured by using V = (4/3) πr3 where π = 3.1415 and r = average radius (microns). Radius was measured from the scale bar. Each bar in the graph represents mean MCTS volume ± standard error (error bars) for all MCTS within the representative images. Results were compared by a one-way ANOVA at 95% confidence using Fisher’s LSD test. Data are representation of one of two independent experiments showing similar results. (C) Viability of DU145, DU145GemR, and PC3GemR attached cells and MCTS using WST-1 assay. Cells were plated at a density of 10,000 cells/well in a 96-well plate and incubated at 37°C in a CO2 incubator for 3 hours for the cells to attach. The attached cells were treated with OP at the indicated doses with a combination of cyclo-RGDfK(TPP) peptide at 50 μM for 6 days. On day 7, 10 μL of WST reagent was added to each well. Cells were incubated for 2 hours at 37°C. Cell viability was expressed as a percent of control ± SEM of two independent experiments. Statistical analysis was carried out by using GraphPad Prism, and the results were compared by one-way ANOVA at 95% confidence using Fisher’s LSD test. (D) Phase-contrast images of PC3 cells at 10× objective treated with a combination of 50 μM cyclo-RGDfK(TPP) peptide and OP or without OP at 50, 100, or 200 μg/mL for 6 days. A total of 10,000 cells were plated per well in a 96-well plate for 6 days. (E) Spheroid volume and cell viability assays on PC3 MCTS. (F) Phase-contrast images of PC3 MCTS at 4× objective in the presence of 50 μM cyclo-RGDfK(TPP) peptide with 100 μg/mL OP or without OP with 10,000 cells per well in 96-well plate for 1–6 days of incubation. |
Effect of V. cholerae Neu on prostasphere formation
The relationship between in situ cell surface expression of SA and the ability to form spheroids in PCa cells was investigated. The hypothesis is that removal of α2,3-SA and α2,6-SA could prevent cell aggregation and spheroid formation. On pretreatment with V. cholerae Neu (hydrolyzes terminal N- or O-acylneuraminic acids which are α2,6-, α2,3-, or α2,8-linked at rate: α2,6 > α2,3 > α2,8) in the presence of 50 μM cyclo-RGDfK(TPP) peptide, all four cell lines showed a significant inhibition of cell aggregation and spheroid formation (Figure 10). The images show more attached cells in the Neu-treated groups compared with the untreated control. Determining the spheroid volumes from the diameter, which were measured from the scale bar, quantitatively represented the effect of Neu on spheroid formation (Figure 10D).
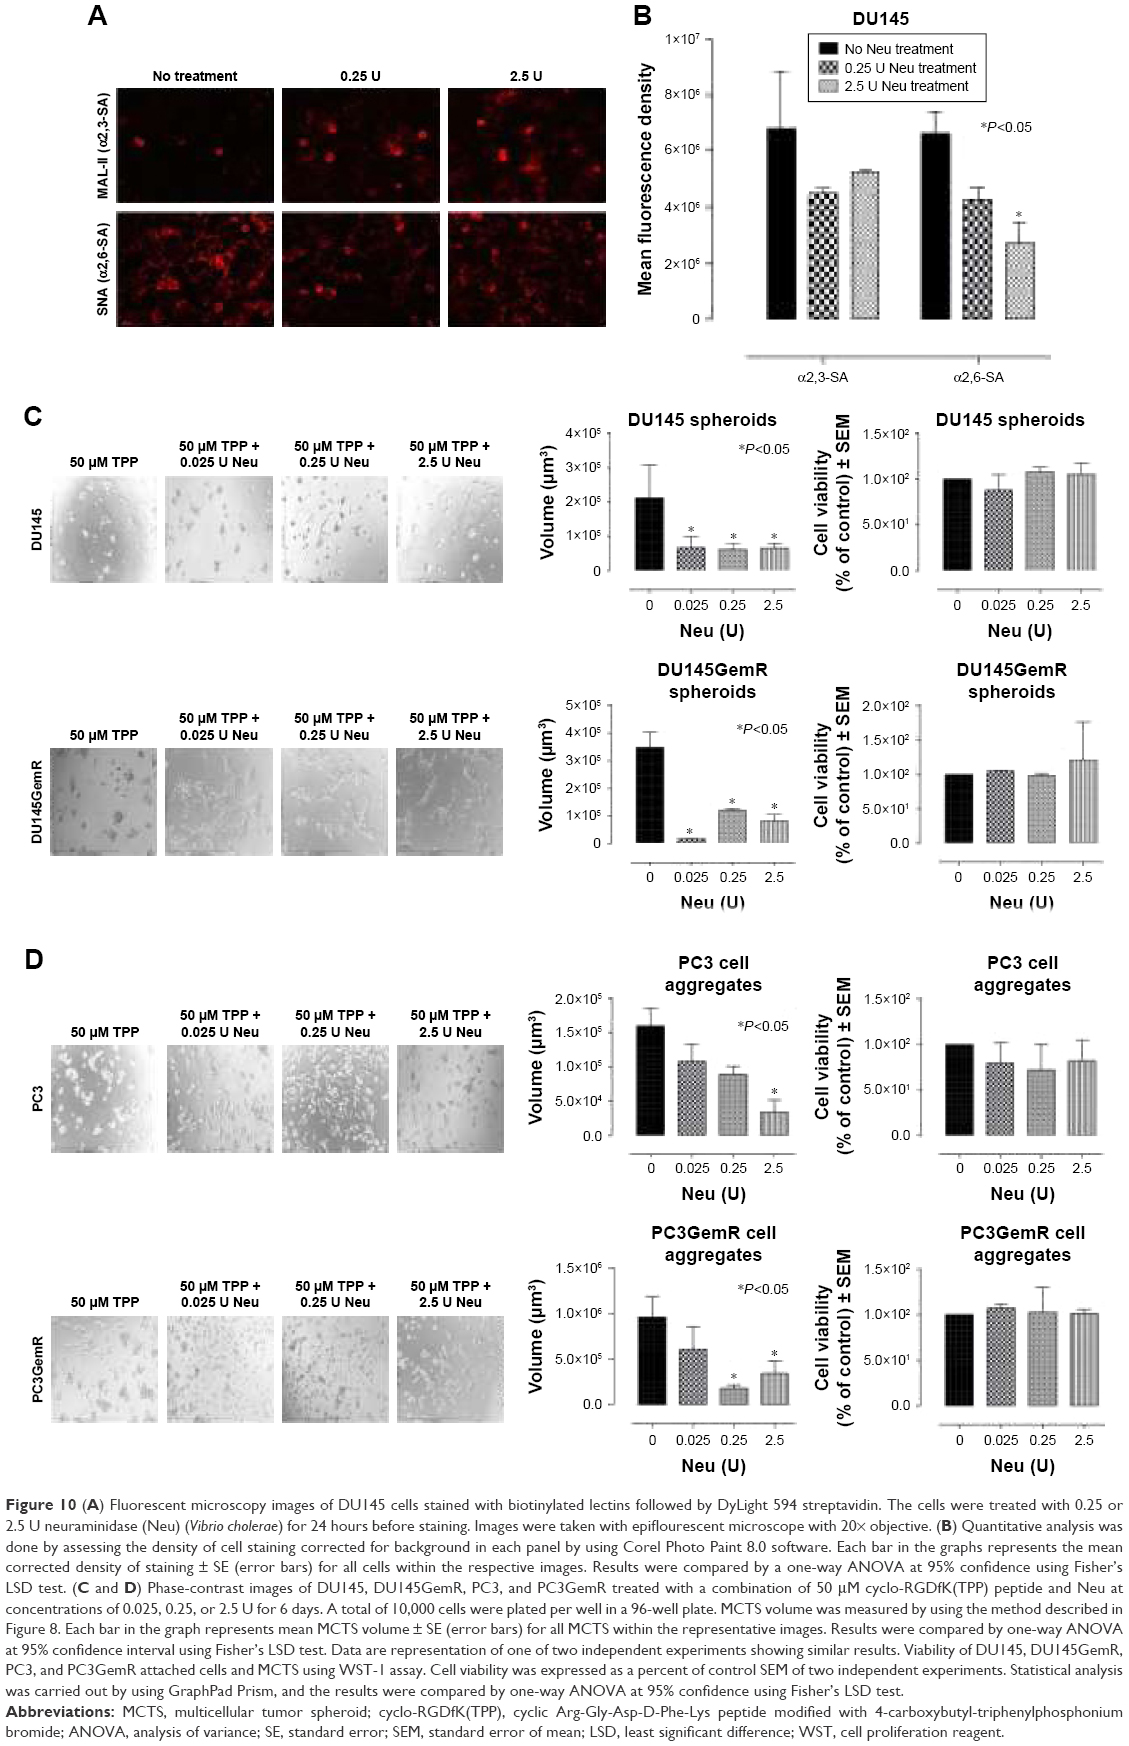 | Figure 10 (A) Fluorescent microscopy images of DU145 cells stained with biotinylated lectins followed by DyLight 594 streptavidin. The cells were treated with 0.25 or 2.5 U neuraminidase (Neu) (Vibrio cholerae) for 24 hours before staining. Images were taken with epiflourescent microscope with 20× objective. (B) Quantitative analysis was done by assessing the density of cell staining corrected for background in each panel by using Corel Photo Paint 8.0 software. Each bar in the graphs represents the mean corrected density of staining ± SE (error bars) for all cells within the respective images. Results were compared by a one-way ANOVA at 95% confidence using Fisher’s LSD test. (C and D) Phase-contrast images of DU145, DU145GemR, PC3, and PC3GemR treated with a combination of 50 μM cyclo-RGDfK(TPP) peptide and Neu at concentrations of 0.025, 0.25, or 2.5 U for 6 days. A total of 10,000 cells were plated per well in a 96-well plate. MCTS volume was measured by using the method described in Figure 8. Each bar in the graph represents mean MCTS volume ± SE (error bars) for all MCTS within the representative images. Results were compared by one-way ANOVA at 95% confidence interval using Fisher’s LSD test. Data are representation of one of two independent experiments showing similar results. Viability of DU145, DU145GemR, PC3, and PC3GemR attached cells and MCTS using WST-1 assay. Cell viability was expressed as a percent of control SEM of two independent experiments. Statistical analysis was carried out by using GraphPad Prism, and the results were compared by one-way ANOVA at 95% confidence using Fisher’s LSD test. |
The cytotoxic effect of Neu on the attached cells and floating spheroids was also determined by the WST-1 cell proliferation assay. The spheroids were pretreated with 0.025, 0.25, and 2.5 U Neu. Specific activity of Neu (V. cholerae) is 1 μmol N-acetylneuraminic acid per minute that is split off from human acid α1-glycoprotein (10 mg/mL incubation mixture) by 1 U Neu. The absorbance is recorded at 450 nm which directly correlates with the number of metabolically active cells. Cell viability was expressed as the percentage of control ± standard error mean of duplicate values. The results in Figure 10E show that Neu treatment at all concentrations has no cytotoxic effects on spheroids and cell aggregates for the indicated cell lines. These data demonstrate that Neu decreases the volume of prostasphere formation and cell aggregates without any effect on the cell viability.
Effect of specific SA lectins on PCa MCTS formation
The effect of blocking/masking α2,3-SA and α2,6-SA with specific SA lectins on prostsphere formation was studied in a lectin inhibition assay. Both the parental and resistant cell lines were pretreated with MAL-II lectin (α2,3-SA), SNA lectin (α2,6-SA), and peanut agglutinin PNA (galactosyl (β-1,3) N-acetylgalactosamine) in combination with 50 μM cyclo-RGDfK(TPP) peptide (Figure 11). The spheroids were observed after 6 days of incubation. Unexpectedly, there was no inhibition of DU145 and DU145GemR cell aggregation and spheroid formation with any of the lectins. However, only α2,3-SA-specific MAL-II prevented cell aggregation of PC3 and PC3GemR cell lines in a dose-dependent manner represented by the spheroid volume. The viability of the spheroids and cell aggregates formed in the presence of increasing concentrations of MAL-II/SNA/PNA was measured by the WST-1 assay. The parental DU145 and the resistant DU145GemR spheroids and cell aggregates were viable in the presence of MAL-II/SNA/PNA. On the contrary, PC3GemR cell aggregates showed a 20%–50% decrease in cell viability following treatment with 50 μg/mL MAL-II.
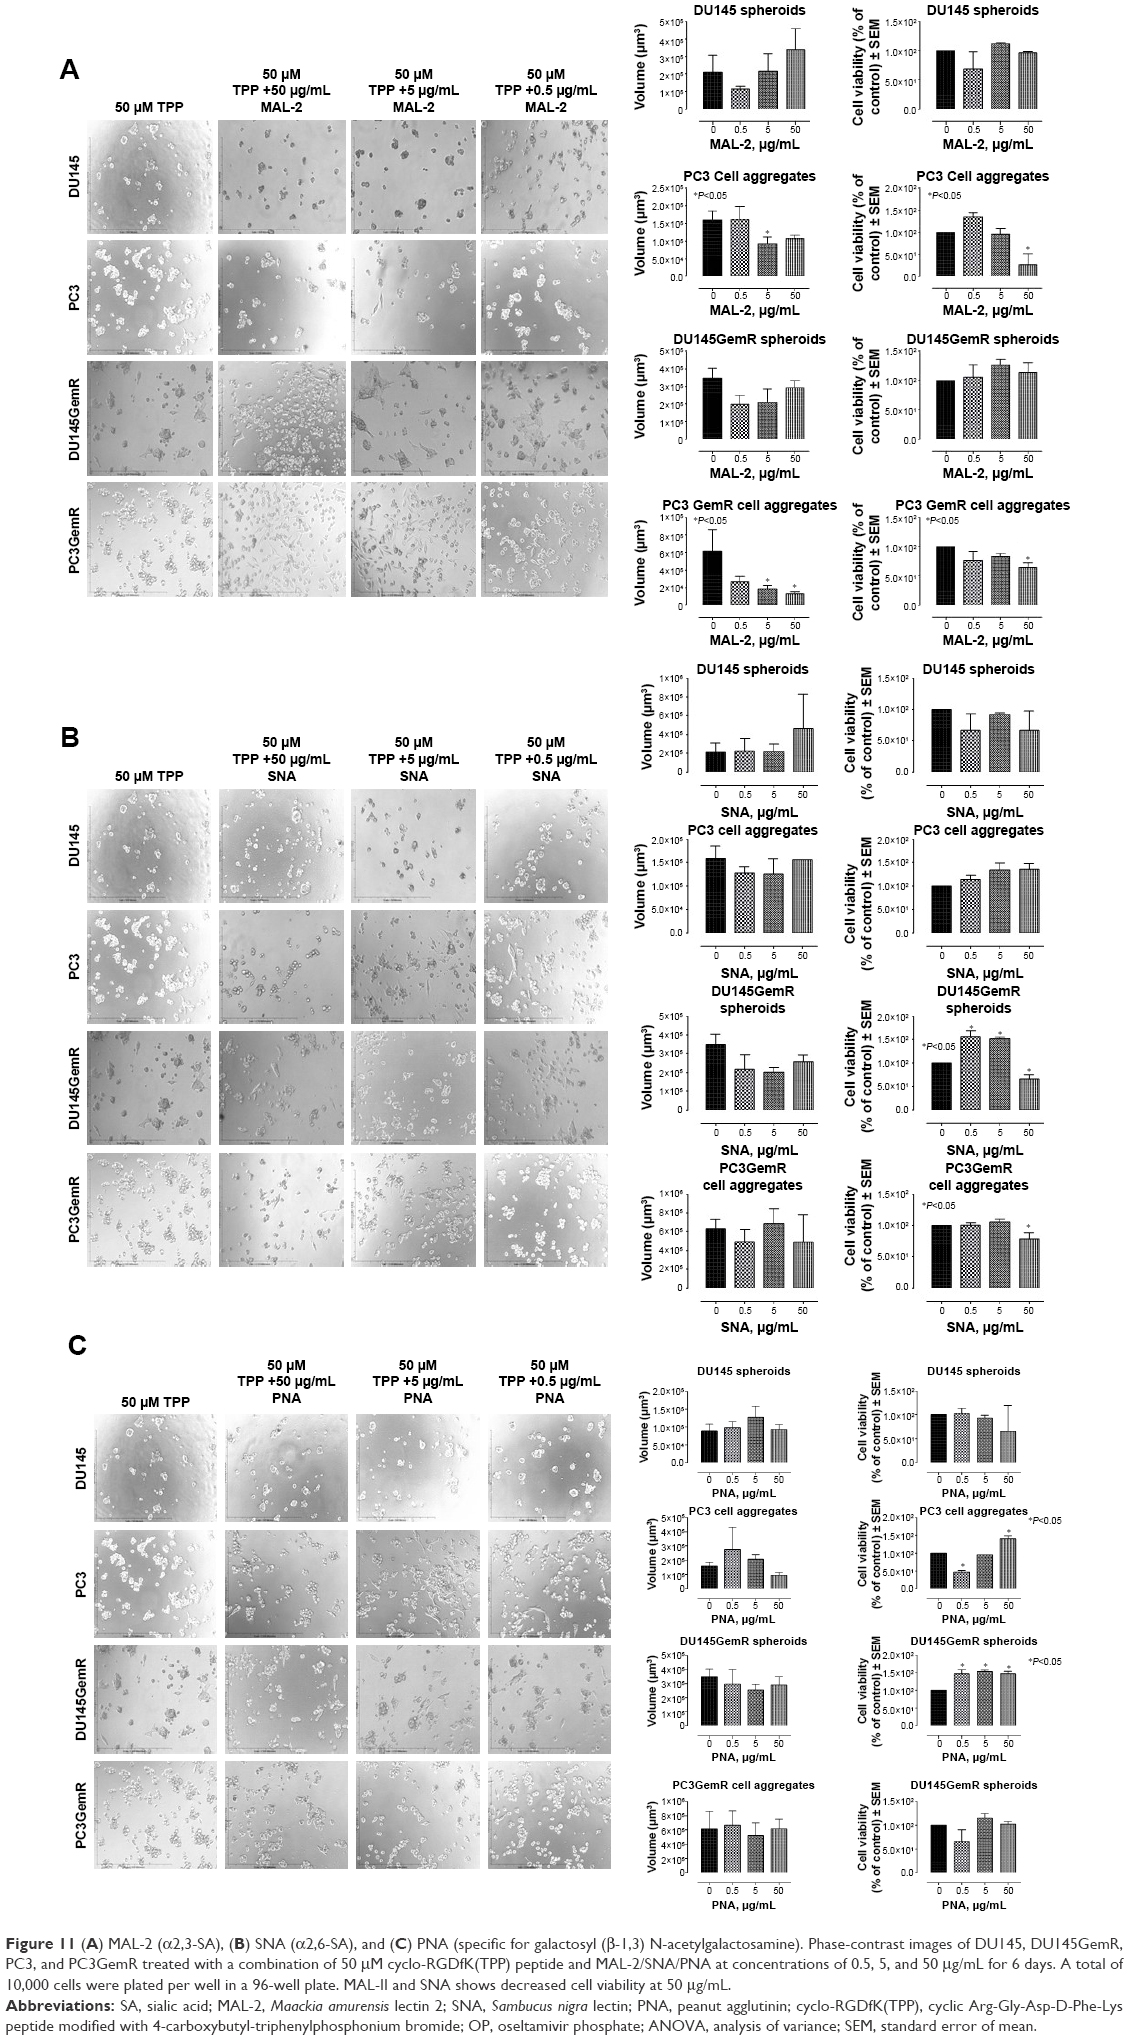 | Figure 11 (A) MAL-2 (α2,3-SA), (B) SNA (α2,6-SA), and (C) PNA (specific for galactosyl (β-1,3) N-acetylgalactosamine). Phase-contrast images of DU145, DU145GemR, PC3, and PC3GemR treated with a combination of 50 μM cyclo-RGDfK(TPP) peptide and MAL-2/SNA/PNA at concentrations of 0.5, 5, and 50 μg/mL for 6 days. A total of 10,000 cells were plated per well in a 96-well plate. MAL-II and SNA shows decreased cell viability at 50 μg/mL. |
Discussion
The classical agarose-coated well technique and the synthetic cyclo-RGDfK(TPP) peptide-based method were initially used to generate matrix-free MCTS with the PCa cell lines. In the present study, both DU145 and DU145GemR cells formed loose and irregular cell aggregates in the agarose-coated well technique and did not form MCTS. However, the same cell lines formed tight, compact MCTS of diameter ≥60 μM through the cyclo-RGDfK(TPP) peptide-based method as described previously by Akasov et al.32 This finding is consistent with another report where DU145 cells formed tight MCTS through 3D matrigel culture method.54 DU145GemR cells started to aggregate and formed MCTS at a lower concentration of cyclo-RGDfK(TPP) peptide compared with DU145 cells that retained their monolayer culture at the same concentration. On the contrary, parental and resistant PC3 cells formed irregular multicellular aggregates. At 100 μM cyclo-RGDfK(TPP) peptide, PC3GemR cells formed only multicellular aggregates without any adhered monolayer cells, whereas the PC3 cells were a mixture of adhered monolayer cells and multicellular aggregates after 6 days of incubation.
Hedlund et al reported consistent formation of PC3 cell aggregates by using the classical agarose-coated technique.62 In contrast, Harma et al showed that tightly compact spheroids with PC3 cells could be formed by using the 3D matrigel culture system.54 The cyclo-RGDfK(TPP) peptide-based method uses the biochemical properties of the cell surface to form MCTS as opposed to the mechanical forces used in the classical method.32 The report also proposes that the cyclo-RGDfK(TPP) peptide mimics the ability of natural ECM protein to induce cell aggregation through α5β1-integrins. The 3D spheroid characterization showed unimodal structures, ranging from 60 to 120 μm in diameter, and varying between cell lines and medium serum concentration.32 The ability of different PCa cell lines to form MCTS by the biochemical method might be explained by their expression levels of α2,3-SA and α2,6-SA.
In the present study, the formation of prostaspheres of parental and resistant DU145 and PC3 PCa cell lines is dependent on the SA content on the cell surface of these cells. Both the parental and resistant DU145 cells expressed ~5-fold greater cell surface α2,6-SA than α2,3-SA. PC3GemR cells showed only ~1.4 times higher expression of cell surface α2,6-SA compared with α2,3-SA. However, only for PC3 cells, the relative level of α2,3-SA was 4-fold higher than α2,6-SA. The PC3 cell line was the only cell line unable to form MCTS by using cyclo-RGDfK(TPP) peptide at all concentrations and time points. It seems that the α2,6-SA may play a greater role in the formation of prostasphere. This is in agreement with other reports where the characteristic and biologic outcomes of tumor cells is more influenced by α2,6-sialylation compared with α2,3-sialylation.63 Akasov et al have reported similar observations for breast and pancreatic cancer cells in the formation of spheroids. MCF-7 and PANC-1 cells, and their drug-resistant cancer cell lines (MCF-7 TMX and PANC1-GemR) express different SA content, which influenced their ability to form spheroids under cyclo-RGDfK(TPP) peptide-induced self-assembly.46 Cancer cell aggregation and compaction correlated with the presence of α2,3-SA and α2,6-SA cell surface residues to form spheroids under cyclo-RGDfK(TPP) peptide-induced self-assembly. Removal or blockage of SA inhibited cell aggregation for MCF7 and MCF-7 TMX cells under cyclo-RGDfK(TPP) peptide treatment. Neu inhibitor OP enhanced cell aggregation and promoted compaction of cell aggregates. Since sialylation of cell surface glycoproteins plays a role in cancer MCTS formation, our results in the present study are very similar to those of Akasov et al46 for breast and pancreatic cancer cells and those by Terao et al.64 Terao et al demonstrated that MCTS-forming cells and CD24high/CD44high cancer stem-like cells of pancreatic PANC1 cells express higher levels of fucosylated glycans than the monolayer cells.64
E- and N-cadherin expressions on the cell surface of PCa cells were analyzed by ICC and flow cytometry to determine whether this is related to the ability of formation of prostasphere. The results of the present study indicate that higher levels of E-cadherin expression on the cell surface of PCa cells may contribute to the formation of MCTS. DU145 cells that formed the most tight, compact MCTS had the highest level of cell surface E-cadherins. The expression levels of N-cadherin were found to be much lower in DU145 cells than that of PC3 cells. This was consistent with many other previous reports that stated higher E-cadherin expression facilitated the formation of spheroid with breast carcinoma cell lines and hepatocytes.46,56 The formation of matrix-free MCTS depends on the higher expression of cell–cell adhesion molecules like α5β1 integrin32 and E-cadherin.35,65 However, the expression of both E- and N-cadherin was very weak for all the four cell lines as illustrated by the flow cytometry findings. A possible explanation might be because PCa cells DU145 and PC3 retain some stem cell characteristics, and the ability of this phenotype could alter its E-cadherin expression during the process of invasion.66 Hence, it is thought that these PCa cells might have altered the cadherin expression over time as they were passaged.
It is well known that glycosylation regulates different aspects of cancer cell behavior. It affects cell survival, evasion of apoptosis, invasion, metastasis and cell–cell and cell–ECM adhesion.63 Branched N-glycans influence cell–cell and cell–ECM adhesion mediated through molecules like E-cadherin and integrins.67 Deman et al showed removal of α2,3-SA from the surface of human MCF-7 cells abolished E-cadherin-dependent cell–cell adhesion in an aggregation assay.68 The addition of α2,6-linked SA to the β1 integrin subunit changes the attachment of several β1-containing integrins to fibronectin (α5β1), VCAM-1 (α4β1), laminin (α3β1), and collagen (α1β1 and α2β1).63 For example, increased α2,6-linked sialic on α1β1 and α2β1 integrins results in better adhesion to collagen I.63 Similarly, Yu et al reported that α2,6 sialylation of α5 subunit of α5β1 integrin is essential for fibronectin-mediated focal adhesion kinase phosphorylation in mouse hepatocarcinoma H22 cells.69 This finding suggested that sialylation of α5β1 integrin is an important factor in promoting adhesion between fibronectin and integrin on the cell membrane. Another group demonstrated that α2,8-linked oligosialic acid on the α5 subunit of integrin α5β1 on the cell membrane of human melanoma G361 cells facilitates adhesion to fibronectin.70 ST6GalNAc1 is a sialyltransferase enzyme that catalyzes the transfer of SA onto Tn antigen at the α2,6 position resulting in the formation of sialyl Tn antigen. Even though ST6GalNAc1 and sialyl Tn antigen induced by androgens are upregulated in PCa cells, Munkley et al found that DU145 cells transfected with ST6GalNAc1 when injected into nude mice resulted in a decrease in tumor growth in vivo.71 This shows that in vivo conditions and findings cannot always be mimicked in animal models. Despite a clear relationship between cell surface α2,6-SA, α2,3-SA, and adhesion to ECM proteins, cancer progression, and metastasis, the role of sialylation in the formation of MCTS has not been studied in detail. The authors have previously shown that sialylation facilitates the formation of 3D MCTS with human breast MCF7 and pancreatic PANC1 cell lines by using the cyclo-RGDfK(TPP) peptide method.46 The results with PCa MCTS further validate these findings. The mechanism by which the α2,6-SA and α2,3-SA on the α5β1 integrin and E-cadherin on the DU145 and PC3 monolayer cells facilitates cell aggregation, adhesion, and MCTS formation is not very clear. As stated by Christie et al,72 an increased sialylation of the β1 integrin can result in the alteration in the conformation of the integrin receptors, which finally affects its interaction with other glycolipid and glyproteins on the cell membrane. The crosslinking of the negatively charged α2,6-SA and α2,3-SA63,73 with positively charged Ca2+ cations in the E-cadherin-mediated cell adhesion might contribute to additional adhesive electrostatic interaction between the cancer cells.68 Cell surface SA moieties also contribute to the activation of E-cadherin by the intracellular signaling pathways.68 The crosslinking of negatively charged SAs with the cyclo-RGDfK(TPP) peptide may also increase adhesive interactions between the cancer cells. This would confer better and stronger adhesion between the monolayer cells transmogrifying them into cell aggregates and tumor spheroids.
The association between reduced sialylation of the PCa cell surface and the ability of the cell lines to form MCTS was also investigated. On pretreatment with Neu in the presence of 50 μM cyclo-RGDfK(TPP) peptide, all the four PCa cell lines showed a significant inhibition of cell aggregation and MCTS formation without having any cytotoxic effects. These observations are in agreement with the previous findings.46 However, pretreating the cells with SA-specific plant lectins, MAL-II and SNA, did not have any effect on MCTS formation. These results suggest that cell surface sialylation may facilitate cell–cyclo-RGDfK(TPP) peptide and cell–cell adhesion and aggregation in MCTS formation that will provide a better understanding of the mechanisms of in vivo tumor development.
Neu1 sialidase has been demonstrated to have a major role in multistep tumorgenesis.74 Cell surface Neu1 has also been documented to desialylate integrin β4 as evaluated by PNA- and MAL-II-lectin blotting of immunoprecipitates with anti-integrin β4 antibody.38 The Neu1 inhibitor OP targets Neu1 and significantly inhibits the survival of cancer cells. It is proposed that this process is initiated by the desialylation of receptor tyrosine kinase. It has been reported that OP has anti-cancer activity against pancreatic, ovarian, and triple-negative breast cancer cell types.48,75 OP has been shown to inhibit the Neu1 sialidase activity of LPS-stimulated BMC2 macrophage cells60 and EGF-stimulated PANC1 cells.59 To study the anticancer activity of OP, human pancreatic cancer cells were implanted in RAGxCγ double mutant mice to develop xenograft tumors. Downstream cell signaling molecules such as phosphorylated EGFR, pStat1, and pNFκB were significantly reduced in the tumor lysates of the OP-treated cohort as compared with the untreated cohort. Phospho-protein end-points of Akt-Thr308, PDGFRα-Tyr754, and STAT1-Tyr701 were also reduced in the tumor lysates from OP-treated cohort compared with the untreated group. Thus, the effect of OP was investigated on the PCa MCTS formation. Since OP inhibits Neu1, the study hypothesized an increased expression of α2,3-sialyl residues on cell surface glycoproteins of the PCa cell lines. The prostasphere volume from all the cell lines except PC3 decreased with increasing concentrations of OP. The decrease in spheroid volume could be due to either inhibition of matrix metalloprotease-9 (MMP-9)-mediated cell motility or cytotoxic effect.48,76–78 It was reported that αvβ3 integrin cooperates with MMP-9 in breast cancer cell migration.79 This cooperation between αvβ3 and MMP-9 was influenced by the state of activation of the integrin. The cell viability of DU145, DU145GemR, PC3, and PC3GemR prostaspheres and cell aggregates were reduced with ≥200 μg/mL OP treatment. It was observed that only the PC3 cell aggregates treated with 100 μg/mL OP formed darker cell aggregates and compaction on day 3 compared with the untreated aggregates. This may be due to the higher expression of cell surface α2,3-sialyl residues compared with α2,6-sialyl residues in the PC3 cell line. All the other cell lines expressed more α2,6-SA than α2,3-SA on the cell surface. In a previous report, the authors found that PANC1 cell lines formed darker cell aggregates following treatment with 200 μg/mL OP for 5 days, whereas 400 μg/mL OP-treated MCF7 cells produced early MCTS compared with the untreated cells.46 PC3, MCF7, and PANC1 cell lines all have higher expression of α2,3-sialyl residues on the cell surface than α2,6-sialyl residues. This may be the reason why OP has an effect on these cell lines and not on DU145 cells that express more α2,6-sialyl residues.
Conclusion
Altered sialylation of tumor cell surface glycoproteins has been described to be highly associated with the metastatic phenotype of cancer. Tumor-derived SAs have been shown to disable cytotoxicity mechanisms of effector immune cells, trigger production of immune suppressive cytokines and dampen activation of antigen-presenting cells. This aberrant sialylation would indeed favor tumor growth and progression. The significance of these data identifies the key sialyl residues in the formation of 3D multicellular PCa spheroids mimicking small avascular tumors with complex cell–cell and cell–matrix interactions in culture and helps in understanding the mechanism and processes involved in solid prostate tumor formation in vivo. The data of the present study validate that MCTS models mimic in vivo tumors.
Acknowledgments
S Haq is the recipient of Queen’s Graduate Award (QGA) and the 2016 Ontario Graduate Scholarship (OGS). F Haxho was the recipient of Queen’s Graduate Award (QGA), the Graduate Entrance Tuition Award (GETA), the Natural Sciences and Engineering Research Council of Canada (NSERC), Alexander Graham Bell Canada Graduate Scholarship-Master’s (CGS M), and now the Vanier Canada Graduate Scholarship. V Samuel is the recipient of the Queen’s University Principal’s Scholarship and the Board of Governor’s Award.
The authors acknowledge Matt Gordon, coordinator of the QUBIC, Faculty of Health Sciences for his expertise in performing the flow cytometry, and Dr Ronald Neufeld, Professor Emeritus, Department of Chemical Engineering, Queen’s University, Kingston, Ontario.
This work was supported in part by grants to MR Szewczuk from the Natural Sciences and Engineering Research Council of Canada, private sector cancer funding from the Josefowitz Family and Encyt Technologies, Inc.
Disclosure
The authors report no conflicts of interest in this work.
References
Bissell MJ, Radisky D. Putting tumours in context. Nat Rev Cancer. 2001;1(1):46–54. | ||
Ellem SJ, De-Juan-Pardo EM, Risbridger GP. In vitro modeling of the prostate cancer microenvironment. Adv Drug Deliv Rev. 2014;79–80:214–221. | ||
Corn PG. The tumor microenvironment in prostate cancer: elucidating molecular pathways for therapy development. Cancer Manag Res. 2012;4:183–193. | ||
Akasov R, Gileva A, Zaytseva-Zotova D, et al. 3D in vitro co-culture models based on normal cells and tumor spheroids formed by cyclic RGD-peptide induced cell self-assembly. Biotechnol Lett. 2017;39(1):45–53. | ||
Mikhail AS, Eetezadi S, Allen C. Multicellular tumor spheroids for evaluation of cytotoxicity and tumor growth inhibitory effects of nanomedicines in vitro: a comparison of docetaxel-loaded block copolymer micelles and Taxotere(R). PLoS One. 2013;8(4):e62630. | ||
LaBarbera DV, Reid BG, Yoo BH. The multicellular tumor spheroid model for high-throughput cancer drug discovery. Expert Opin Drug Discov. 2012;7(9):819–830. | ||
Kim JB. Three-dimensional tissue culture models in cancer biology. Semin Cancer Biol. 2005;15(5):365–377. | ||
Sutherland RM, Durand RE. Growth and cellular characteristics of multicell spheroids. Recent Results Cancer Res. 1984;95:24–49. | ||
Carver K, Ming X, Juliano RL. Multicellular tumor spheroids as a model for assessing delivery of oligonucleotides in three dimensions. Mol Ther Nucleic Acids. 2014;3:e153. | ||
Horning JL, Sahoo SK, Vijayaraghavalu S, et al. 3-D tumor model for in vitro evaluation of anticancer drugs. Mol Pharmaceutics. 2008;5(5):849–862. | ||
Raghavan S, Mehta P, Horst EN, Ward MR, Rowley KR, Mehta G. Comparative analysis of tumor spheroid generation techniques for differential in vitro drug toxicity. Oncotarget. 2016;7(13):16948–16961. | ||
Friedrich J, Seidel C, Ebner R, Kunz-Schughart LA. Spheroid-based drug screen: considerations and practical approach. Nat Protoc. 2009;4(3):309–324. | ||
Hirschhaeuser F, Menne H, Dittfeld C, West J, Mueller-Klieser W, Kunz-Schughart LA. Multicellular tumor spheroids: an underestimated tool is catching up again. J Biotechnol. 2010;148(1):3–15. | ||
Haycock JW. 3D cell culture: a review of current approaches and techniques. Methods Mol Biol. 2011;695:1–15. | ||
Mehta G, Hsiao AY, Ingram M, Luker GD, Takayama S. Opportunities and challenges for use of tumor spheroids as models to test drug delivery and efficacy. J Control Release. 2012;164(2):192–204. | ||
Lin R-Z, Chang H-Y. Recent advances in three-dimensional multicellular spheroid culture for biomedical research. Biotechnol J. 2008;3(9–10):1172–1184. | ||
Ferlay J, Soerjomataram I, Dikshit R, et al. Cancer incidence and mortality worldwide: sources, methods and major patterns in GLOBOCAN 2012. Int J Cancer. 2015;136(5):E359–E386. | ||
Wallace TA, Prueitt RL, Yi M, et al. Tumor immunobiological differences in prostate cancer between African-American and European-American men. Cancer Res. 2008;68(3):927–936. | ||
Baetke SC, Adriaens ME, Seigneuric R, Evelo CT, Eijssen LM. Molecular pathways involved in prostate carcinogenesis: insights from public microarray datasets. PLoS One. 2012;7(11):e49831. | ||
Bosland MC. The role of steroid hormones in prostate carcinogenesis. J Natl Cancer Inst Monogr. 2000;(27):39–66. | ||
Kunjithapatham R, Karthikeyan S, Geschwind J-F, et al. Reversal of anchorage-independent multicellular spheroid into a monolayer mimics a metastatic model. Sci Rep. 2014;4:6816. | ||
Hickman JA, Graeser R, de Hoogt R, et al. Three-dimensional models of cancer for pharmacology and cancer cell biology: capturing tumor complexity in vitro/ex vivo. Biotechnol J. 2014;9(9):1115–1128. | ||
Vinci M, Gowan S, Boxall F, et al. Advances in establishment and analysis of three-dimensional tumor spheroid-based functional assays for target validation and drug evaluation. BMC Biology. 2012;10(1):1–21. | ||
Correia AL, Bissell MJ. The tumor microenvironment is a dominant force in multidrug resistance. Drug Resist Updat. 2012;15(1–2):39–49. | ||
Burleson KM, Casey RC, Skubitz KM, Pambuccian SE, Oegema TR Jr, Skubitz AP. Ovarian carcinoma ascites spheroids adhere to extracellular matrix components and mesothelial cell monolayers. Gynecol Oncol. 2004;93(1):170–181. | ||
Vinci M, Box C, Eccles SA. Three-dimensional (3D) tumor spheroid invasion assay. J Vis Exp. 2015;(99):e52686. | ||
Ivanov DP, Parker TL, Walker DA, et al. Multiplexing spheroid volume, resazurin and acid phosphatase viability assays for high-throughput screening of tumour spheroids and stem cell neurospheres. PLoS One. 2014;9(8):e103817. | ||
Gao D, Vela I, Sboner A, et al. Organoid cultures derived from patients with advanced prostate cancer. Cell. 2014;159(1):176–187. | ||
Vela I, Chen Y. Prostate cancer organoids: a potential new tool for testing drug sensitivity. Expert Rev Anticancer Ther. 2015;15(3):261–263. | ||
Karthaus Wouter R, Iaquinta Phillip J, Drost J, et al. Identification of multipotent luminal progenitor cells in human prostate organoid cultures. Cell. 2014;159(1):163–175. | ||
Drost J, Karthaus WR, Gao D, et al. Organoid culture systems for prostate epithelial and cancer tissue. Nat Protoc. 2016;11(2):347–358. | ||
Akasov R, Zaytseva-Zotova D, Burov S, et al. Formation of multicellular tumor spheroids induced by cyclic RGD-peptides and use for anticancer drug testing in vitro. Int J Pharm. 2016;506(1–2):148–157. | ||
Casey RC, Burleson KM, Skubitz KM, et al. Beta 1-integrins regulate the formation and adhesion of ovarian carcinoma multicellular spheroids. Am J Pathol. 2001;159(6):2071–2080. | ||
Salmenpera P, Kankuri E, Bizik J, et al. Formation and activation of fibroblast spheroids depend on fibronectin-integrin interaction. Exp Cell Res. 2008;314(19):3444–3452. | ||
Lin RZ, Chou LF, Chien CC, Chang HY. Dynamic analysis of hepatoma spheroid formation: roles of E-cadherin and beta1-integrin. Cell Tissue Res. 2006;324(3):411–422. | ||
Kim YJ, Varki A. Perspectives on the significance of altered glycosylation of glycoproteins in cancer. Glycoconj J. 1997;14(5):569–576. | ||
Bull C, Stoel MA, den Brok MH, Adema GJ. Sialic acids sweeten a tumor’s life. Cancer Res. 2014;74(12):3199–3204. | ||
Uemura T, Shiozaki K, Yamaguchi K, et al. Contribution of sialidase NEU1 to suppression of metastasis of human colon cancer cells through desialylation of integrin beta4. Oncogene. 2009;28(9):1218–1229. | ||
Dennis J. Glycoprotein glycosylation and cancer progression. Biochim Biophy Acta. 1999;1473(1):21–34. | ||
Dennis JW, Laferte S. Tumor cell surface carbohydrate and the metastatic phenotype. Cancer Metastasis Rev. 1987;5(3):185–204. | ||
Hakomori S. Glycosylation defining cancer malignancy: new wine in an old bottle. Proc Natl Acad Sci U S A. 2002;99(16):10231–10233. | ||
Handa K, Hakomori SI. Carbohydrate to carbohydrate interaction in development process and cancer progression. Glycoconj J. 2012;29(8–9):627–637. | ||
Van Slambrouck S, Groux-Degroote S, Krzewinski-Recchi MA, Cazet A, Delannoy P, Steelant WF. Carbohydrate-to-carbohydrate interactions between alpha2,3-linked sialic acids on alpha2 integrin subunits and asialo-GM1 underlie the bone metastatic behaviour of LNCAP-derivative C4-2B prostate cancer cells. Biosci Rep. 2014;34(5):pii.e00138. | ||
Park JJ, Lee M. Increasing the alpha 2, 6 sialylation of glycoproteins may contribute to metastatic spread and therapeutic resistance in colorectal cancer. Gut Liver. 2013;7(6):629–641. | ||
Pochec E, Bubka M, Rydlewska M, Janik M, Pokrywka M, Litynska A. Aberrant glycosylation of alphavbeta3 integrin is associated with melanoma progression. Anticancer Res. 2015;35(4):2093–2103. | ||
Akasov R, Haq S, Haxho F, et al. Sialylation transmogrifies human breast and pancreatic cancer cells into 3D multicellular tumor spheroids using cyclic RGD-peptide induced self-assembly. Oncotarget. 2016;7(40):66119–66134. | ||
Lehmann F, Tiralongo E, Tiralongo J. Sialic acid-specific lectins: occurrence, specificity and function. Cell Mol Life Sci. 2006;63(12):1331–1354. | ||
O’Shea LK, Abdulkhalek S, Allison S, Neufeld RJ, Szewczuk MR. Therapeutic targeting of Neu1 sialidase with oseltamivir phosphate (Tamiflu(R)) disables cancer cell survival in human pancreatic cancer with acquired chemoresistance. Onco Targets Ther. 2014;7:117–134. | ||
Tai S, Sun Y, Squires JM, et al. PC3 is a cell line characteristic of prostatic small cell carcinoma. Prostate. 2011;71(15):1668–1679. | ||
Russell PJ, Kingsley EA. Human prostate cancer cell lines. Methods Mol Med. 2003;81:21–39. | ||
Tan AS, Berridge MV. Superoxide produced by activated neutrophils efficiently reduces the tetrazolium salt, WST-1 to produce a soluble formazan: a simple colorimetric assay for measuring respiratory burst activation and for screening anti-inflammatory agents. J Immunol Methods. 2000;238(1–2):59–68. | ||
Amith SR, Jayanth P, Finlay T, et al. Detection of Neu1 sialidase activity in regulating Toll-like receptor activation. J Vis Exp. 2010;(43):pii.2142. | ||
Amith SR, Jayanth P, Franchuk S, et al. Neu1 desialylation of sialyl alpha-2,3-linked beta-galactosyl residues of TOLL-like receptor 4 is essential for receptor activation and cellular signaling. Cell Signal. 2010;22(2):314–324. | ||
Harma V, Virtanen J, Makela R, et al. A comprehensive panel of three-dimensional models for studies of prostate cancer growth, invasion and drug responses. PLoS One. 2010;5(5):e10431. | ||
Tran NL, Nagle RB, Cress AE, Heimark RL. N-Cadherin expression in human prostate carcinoma cell lines: an epithelial-mesenchymal transformation mediating adhesion with stromal cells. Am J Pathol. 1999;155(3):787–798. | ||
Vega FM, Thomas M, Reymond N, Ridley AJ. The Rho GTPase RhoB regulates cadherin expression and epithelial cell-cell interaction. Cell Commun Signal. 2015;13:6. | ||
Ma H, Zhou H, Song X, Shi S, Zhang J, Jia L. Modification of sialylation is associated with multidrug resistance in human acute myeloid leukemia. Oncogene. 2015;34(6):726–740. | ||
Abdulkhalek S, Hrynyk M, Szewczuk MR. A novel G-protein-coupled receptor-signaling platform and its targeted translation in human disease. Res Rep Biochem. 2013;3:17–30. | ||
Gilmour AM, Abdulkhalek S, Cheng TS, et al. A novel epidermal growth factor receptor-signaling platform and its targeted translation in pancreatic cancer. Cell Signal. 2013;25(12):2587–2603. | ||
Amith SR, Jayanth P, Franchuk S, et al. Dependence of pathogen molecule-induced toll-like receptor activation and cell function on Neu1 sialidase. Glycoconj J. 2009;26(9):1197–1212. | ||
Woronowicz A, Amith SR, De Vusser K, et al. Dependence of neurotrophic factor activation of Trk tyrosine kinase receptors on cellular sialidase. Glycobiology. 2007;17(1):10–24. | ||
Hedlund TE, Duke RC, Miller GJ. Three-dimensional spheroid cultures of human prostate cancer cell lines. Prostate. 1999;41(3):154–165. | ||
Schultz MJ, Swindall AF, Bellis SL. Regulation of the metastatic cell phenotype by sialylated glycans. Cancer Metastasis Rev. 2012;31(3–4):501–518. | ||
Terao N, Takamatsu S, Minehira T, et al. Fucosylation is a common glycosylation type in pancreatic cancer stem cell-like phenotypes. World J Gastroenterol. 2015;21(13):3876–3887. | ||
Lin R-Z, Chang H-Y. Recent advances in three-dimensional multicellular spheroid culture for biomedical research. Biotechnol J. 2008;3(9–10):1172–1184. | ||
Bae KM, Parker NN, Dai Y, Vieweg J, Siemann DW. E-cadherin plasticity in prostate cancer stem cell invasion. Am J Cancer Res. 2011;1(1):71–84. | ||
Zhao Y, Sato Y, Isaji T, et al. Branched N-glycans regulate the biological functions of integrins and cadherins. FEBS J. 2008;275(9):1939–1948. | ||
Deman JJ, Van Larebeke NA, Bruyneel EA, et al. Removal of sialic acid from the surface of human MCF-7 mammary cancer cells abolishes E-cadherin-dependent cell-cell adhesion in an aggregation assay. In Vitro Cell Dev Biol Anim. 1995;31(8):633–639. | ||
Yu S, Fan J, Liu L, Zhang L, Wang S, Zhang J. Caveolin-1 up-regulates integrin alpha2,6-sialylation to promote integrin alpha5beta1-dependent hepatocarcinoma cell adhesion. FEBS Lett. 2013;587(6):782–787. | ||
Nadanaka S, Sato C, Kitajima K, Katagiri K, Irie S, Yamagata T. Occurrence of oligosialic acids on integrin alpha 5 subunit and their involvement in cell adhesion to fibronectin. J Biol Chem. 2001;276(36):33657–33664. | ||
Munkley J, Oltean S, Vodak D, et al. The androgen receptor controls expression of the cancer-associated sTn antigen and cell adhesion through induction of ST6GalNAc1 in prostate cancer. Oncotarget. 2015;6(33):34358–34374. | ||
Christie DR, Shaikh FM, Lucas JA 4th, Lucas JA 3rd, Bellis SL. ST6Gal-I expression in ovarian cancer cells promotes an invasive phenotype by altering integrin glycosylation and function. J Ovarian Res. 2008;1(1):3. | ||
Eylar EH, Madoff MA, Brody OV, Oncley JL. The contribution of sialic acid to the surface charge of the erythrocyte. J Biol Chem. 1962;237:1992–2000. | ||
Haxho F, Neufeld RJ, Szewczuk MR. Neuraminidase-1: a novel therapeutic target in multistage tumorigenesis. Oncotarget. 2016;7(26):40860–40881. | ||
Abdulkhalek S, Geen O, Brodhagen L, et al. Transcriptional factor snail controls tumor neovascularization, growth and metastasis in mouse model of human ovarian carcinoma. Clin Transl Med. 2014;3:28. | ||
Haxho F, Allison S, Alghamdi F, et al. Oseltamivir phosphate monotherapy ablates tumor neovascularization, growth, and metastasis in mouse model of human triple-negative breast adenocarcinoma. Breast Cancer. 2014;6:191–203. | ||
Bourboulia D, Stetler-Stevenson WG. Matrix metalloproteinases (MMPs) and tissue inhibitors of metalloproteinases (TIMPs): positive and negative regulators in tumor cell adhesion. Semin Cancer Biol. 2010;20(3):161–168. | ||
Sossey-Alaoui K, Ranalli TA, Li X, Bakin AV, Cowell JK. WAVE3 promotes cell motility and invasion through the regulation of MMP-1, MMP-3, and MMP-9 expression. Exp Cell Res. 2005;308(1):135–145. | ||
Rolli M, Fransvea E, Pilch J, Saven A, Felding-Habermann B. Activated integrin alphavbeta3 cooperates with metalloproteinase MMP-9 in regulating migration of metastatic breast cancer cells. Proc Natl Acad Sci U S A. 2003;100(16):9482–9487. |
 © 2017 The Author(s). This work is published and licensed by Dove Medical Press Limited. The full terms of this license are available at https://www.dovepress.com/terms.php and incorporate the Creative Commons Attribution - Non Commercial (unported, v3.0) License.
By accessing the work you hereby accept the Terms. Non-commercial uses of the work are permitted without any further permission from Dove Medical Press Limited, provided the work is properly attributed. For permission for commercial use of this work, please see paragraphs 4.2 and 5 of our Terms.
© 2017 The Author(s). This work is published and licensed by Dove Medical Press Limited. The full terms of this license are available at https://www.dovepress.com/terms.php and incorporate the Creative Commons Attribution - Non Commercial (unported, v3.0) License.
By accessing the work you hereby accept the Terms. Non-commercial uses of the work are permitted without any further permission from Dove Medical Press Limited, provided the work is properly attributed. For permission for commercial use of this work, please see paragraphs 4.2 and 5 of our Terms.