")
Back to Journals » ClinicoEconomics and Outcomes Research » Volume 8
Short- and longer-term health-care resource utilization and costs associated with acute ischemic stroke
Authors Johnson B, Bonafede M, Watson C
Received 3 September 2015
Accepted for publication 21 December 2015
Published 23 February 2016 Volume 2016:8 Pages 53—61
DOI https://doi.org/10.2147/CEOR.S95662
Checked for plagiarism Yes
Review by Single anonymous peer review
Peer reviewer comments 3
Editor who approved publication: Professor Giorgio Colombo
Barbara H Johnson,1 Machaon M Bonafede,1 Crystal Watson2
1Outcomes Research, Truven Health Analytics, Cambridge, MA, USA; 2Health Economics and Outcomes Research, Biogen, Cambridge, MA, USA
Objectives: The mean lifetime cost of ischemic stroke is approximately $140,048 in the United States, placing stroke among the top 10 most costly conditions among Medicare beneficiaries. The objective of this study was to describe the health-care resource utilization and costs in the year following hospitalization for acute ischemic stroke (AIS).
Methods: This retrospective claims analysis quantifies utilization and costs following inpatient admission for AIS among the commercially insured and Medicare beneficiaries in the Truven Health databases. Patients who were 18 years or older and continuously enrolled for 12 months before and after an AIS event occurring (index) between January 2009 and December 2012 were identified. Patients with AIS in the year preindex were excluded. Demographic and clinical characteristics were evaluated at admission and in the preindex, respectively. Direct costs, readmissions, and inpatient length of stay (LOS) were described in the year postindex.
Results: The eligible populations comprised 20,314 commercially insured patients and 31,037 Medicare beneficiaries. Average all-cause costs were $61,354 and $44,929 (commercial and Medicare, respectively) in the first year after the AIS. Approximately 50%–55% of total 12-month costs were incurred between day 31 and day 365 following the incident AIS. One quarter (24.6%) of commercially insured patients and 38.8% of Medicare beneficiaries were readmitted within 30 days with 16.6% and 71.7% (commercial and Medicare, respectively) of those having a principal diagnosis of AIS. The average AIS-related readmission length of stay was nearly three times that of the initial hospitalization for both commercially insured patients (3.8 vs 10.8 days) and Medicare beneficiaries (4.0 vs 10.8 days).
Conclusion: In addition to the substantial costs of the initial hospitalization of an AIS, these costs double within the year following this event. Given the high cost associated with AIS, new interventions reducing either the acute or longer-term burden of AIS are needed.
Keywords: acute ischemic stroke, health-care resource utilization, health-care costs, readmissions
Background
Approximately 800,000 strokes occur annually in the United States, causing nearly 130,000 deaths each year.1 For the millions of stroke survivors, long-term disability and lost productivity incur an additional cost.2 Nearly 90% of strokes are ischemic, caused by a blockage in the cerebral artery, which restricts blood flow. A swift response is critical to limiting the death of brain cells, which create a fluid-filled cavity in the brain called the infarct area. Advances in treatment have been made in the last decade – after years as the third leading cause of death, in 2015 stroke dropped to fifth.3 The risk of stroke increases with age, is more common among women, and is a major contributor to long-term disability, especially among the elderly.4
One of the top ten contributors to Medicare costs,5 the burden of stroke is expected to increase concomitantly as the populace ages.6 Among the relatively few cost-effectiveness studies related to stroke, most have focused on short-term, hospital-associated costs4 and few have documented the substantial long-term direct and indirect costs due to rehabilitation and lost productivity.7 According to the American Heart Association, the mean lifetime cost of ischemic stroke is approximately $140,048 in the United States.6 In 2008, the cost of lost productivity ($15.5 billion) was nearly equivalent to the direct cost of treating stroke ($18.8 billion).2 The total direct and indirect annual costs related to stroke in the USA are currently estimated at between $36.5 and $65 billion,4,6 an amount that is expected to exceed $180 billion by 2030.6
In health economics studies, direct costs include hospitalization, nursing home admission, fees for physicians and other health-care professionals, medications, durable medical equipment, outpatient rehabilitation, and home health care. In addition to its position as one of the leading causes of death, caring for stroke survivors imposes a substantial economic burden on society, similar to cancer, diabetes, and depression.4 Despite evidence that long-term costs are substantial, few studies have quantified the long-term direct costs attributable to ischemic stroke.8–10 While guidelines are in place to ensure optimal inpatient stroke care, few studies have systematically evaluated predictors of readmission after stroke, a measure of inpatient quality of care.11
This retrospective claims study updates the relatively outdated literature quantifying relative short-term (days 1–30) and longer-term (days 31–365) inpatient and outpatient costs attributable to acute ischemic stroke (AIS). We also describe all-cause and AIS-related readmission rates within 30 and 90 days. The dataset includes more than 50,000 commercially insured patients and Medicare recipients and is among the largest stroke-related cost studies conducted to date.
Methods
Data sources
This retrospective study includes claims data for the period January 1, 2008 to December 31, 2013. Two databases were queried: the MarketScan® Commercial Claims and Encounters Database (Commercial, Truven Health Analytics, Cambridge, MA, USA) and the MarketScan® Medicare Supplemental and Coordination of Benefits (Medicare Supplemental, Truven Health Analytics).
The Commercial database captures inpatient, outpatient, and prescription drug data for approximately 40 million employees and dependents annually. These beneficiaries were covered under a variety of plans, including fee-for-service and managed care plans, such as exclusive provider organizations (EPOs), consumer-driven or high-deductible health plans (CDHP/HDHP), preferred provider organizations (PPOs), point-of-service plans (POS), comprehensive/indemnity and health maintenance organizations (HMOs).
The Medicare Supplemental database contains data for approximately 4 million retirees annually with employer-sponsored Medicare supplemental insurance. Claims paid by both the Medicare-covered portion (represented as coordination of benefits amount) and the employer-paid portion are included in this database.
Both the Commercial and Medicare Supplemental databases provide detailed cost, utilization, and outcomes data for health-care services performed in both inpatient and outpatient settings. Patients are linked longitudinally using a unique identifier to allow for follow-up among those moving from a commercial plan to a Medicare plan. The adjudicated medical claims are also linked to their outpatient prescription drug claims and person-level enrollment data through the use of unique identifiers to provide a comprehensive data set, which captures cost and utilization across the health-care delivery system. The data contained in these databases are statistically de-identified and have been certified to satisfy the conditions set forth in Sections 164.514 (a)-(b)1ii of the Health Insurance Portability and Accountability Act. As such, this study using existing de-identified information, is exempt from the US Department of Health and Human Services (HHS) regulations, that require institutional review board approval and patient consent was not deemed necessary.
Population
The inclusion criteria were patients at least 18 years of age with an inpatient claim for AIS (index date) defined as follows: diagnosis-related group (DRG) code 061, 062, 063 or DRG code 064, 065, 066 and confirming ischemic stroke International Classification of Diseases – 9th revision, Clinical Modification (ICD-9-CM) diagnosis of 434.x1 in any position. Patients must also have had at least 24 months of continuous enrollment (12 months before and 12 months after the index date).
The baseline and follow-up periods were defined for each patient based on the first diagnosis of AIS (index date) between January 1, 2009 and January 1, 2013. The baseline was defined as the 12 months prior to the index date. The follow-up period was a fixed 12-month period beginning on the index date. The entire study period was January 1, 2008 to December 31, 2013.
Candidates for the study were excluded if their claims history presented evidence of pregnancy or delivery during the baseline or follow-up periods or an AIS event during the baseline period.
Analysis
The primary explanatory variables were AIS with major complications/comorbidities (MCC), AIS with complications/comorbidities (CC), and AIS without complications/comorbidities with and without tissue plasminogen activator. A full list of identifying codes is included as supplementary material.
Demographic characteristics captured at the index date included age, sex, geographic region (based on the primary health plan subscriber’s home address in the following US Census Bureau geographic regions: Northeast, Mid-West, South, West), urban/rural residence, insurance plan type (comprehensive/indemnity, HMO, PPO/EPO, POS, CDHP/HDHP, or other/unknown), discharge status, and index year. Selected clinical characteristics were captured during the baseline period and included one index of patient health: the Deyo–Charlson Comorbidity Index, specific cardiovascular events: transient ischemic attack, atrial fibrillation, peripheral artery disease, coronary artery disease, cardiovascular event requiring hospitalization (myocardial infarction, heart failure, unstable angina), and the following comorbid diseases: chronic kidney disease, deep venous thrombosis, diabetes, family history of stroke, homocystinemia, hypercoagulable state, hyperlipidemia, hypertension, metabolic syndrome, obesity, sleep apnea, and tobacco use.
Economic outcomes included total inpatient hospital costs for qualifying AIS admission; inpatient utilization of rehabilitative therapy during the qualifying AIS admission; length of stay for qualifying AIS admission; health-care costs measured over 0–30 and 31–365 days, which included inpatient, outpatient hospital, emergency room, outpatient office, and outpatient pharmacy costs. All costs were adjusted to 2013 US dollars using the medical care services component of the consumer price index.12
Clinical outcomes were measured by the frequency and costs attributable to 30-day and 90-day all-cause and AIS-related readmissions. AIS-related readmissions were defined as having a DRG code 061, 062, 063 or DRG code 064, 065, 066 and confirming ischemic stroke ICD-9-CM diagnosis of 434.x1 in any position. Time to first readmission was calculated based on the days elapsed from the discharge date of the index AIS hospitalization to the date of the readmission. Length of stay for both 30-day and 90-day readmissions was also calculated.
Bivariate analyses were conducted on all available study variables for AIS patients and stratified by DRG and payor (Commercial vs Medicare). Chi-square tests for homogeneity were used to test for significant differences in the distributions of categorical variables and two-tailed Student’s t-tests were used to test for significant differences in the distributions of continuous measures.
Results
Demographics
The demographic characteristics for the commercial and Medicare populations under study are depicted in Table 1. The mean (standard deviation, SD) age of commercial patients was 54.1 years (7.9) and 42.1% were female. The mean (SD) age of Medicare beneficiaries was 78.6 years (7.9), and 53.1% of them were female. Similar to the overall MarketScan regional distribution, both commercial and Medicare populations tended to reside in the South (41.2% and 27.8%, respectively) and North Central (25.2% and 37.7%, respectively) regions of the USA.
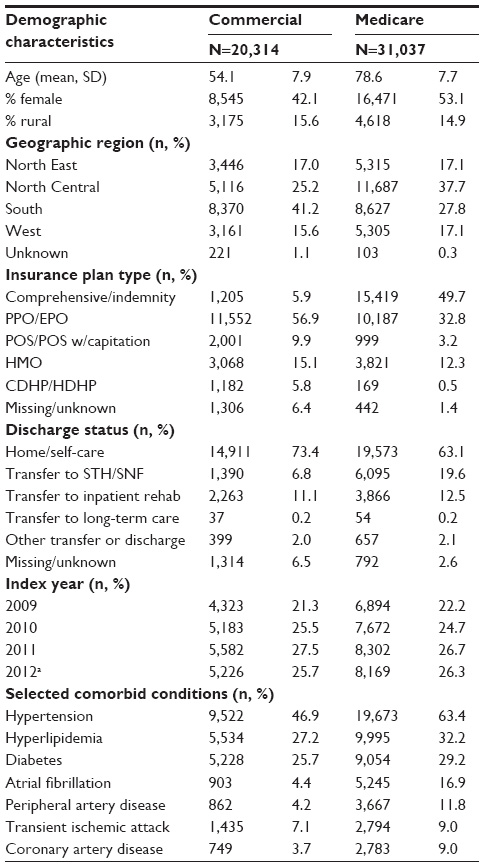 | Table 1 Selected demographic characteristics by payer |
With respect to insurance plan type, just over half of the commercial patients had an EPO/PPO type (56.9%) while approximately half of the Medicare patients had a comprehensive/indemnity plan (49.7%) and 32.8% had an EPO/PPO plan.
As expected, hypertension, hyperlipidemia, and diabetes were the three leading comorbid conditions for both populations (Table 1). Commercial patients tended to be discharged into home or self-care (73.4%) and inpatient rehabilitation (11.1%) with only a fraction (6.8%) being transferred to short-term hospitals or skilled nursing facilities. While the majority (63.1%) of Medicare beneficiaries was discharged into home or self-care, 19.6% were transferred to short-term hospitals or skilled nursing facilities, and 12.5% were transferred to inpatient rehabilitation.
Costs
Mean all-cause costs for commercial and Medicare patients in the year following an AIS were $61,354 and $44,929, respectively. A substantial share (50–55%) of this cost occurred more than 30 days after the index admission for AIS (Figures 1 and 2). During this 31–365-day time frame, costs were largely attributable to services delivered in an outpatient setting: 63% and 65% for all-cause costs (commercial and Medicare, respectively) and 83% and 85% for AIS-related costs (commercial and Medicare, respectively). The cost drivers were increased utilization of various outpatient services, such as outpatient hospital visits, office visits, and rehabilitative therapy. In the commercial population, 40.1% of total costs (mean, SD) were AIS-related ($24,737, $36,166) with three-quarters (74.7%) of those attributed to the initial AIS hospitalization. Among Medicare beneficiaries, 44.6% of total costs (mean, SD) were AIS-related ($20,041, $23,681) with 66.5% of those attributed to the initial AIS hospitalization.
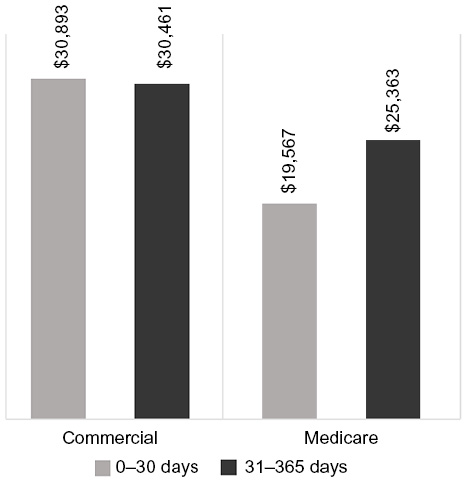 | Figure 1 Distribution of 0–30- and 31–365-day mean all-cause costs, adjusted to 2013 US dollars. |
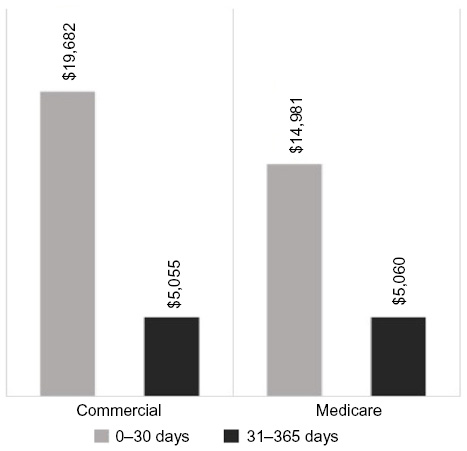 | Figure 2 Distribution of 0–30- and 31–365-day mean acute ischemic stroke-related costs, adjusted to 2013 US dollars. |
As expected, all-cause and AIS-related health-care costs were highest for commercial patients with MCC ($86,112 and $29,933) compared to those with CC ($53,750 and $23,933) and without CC ($41,045 and $18,601) (P-value <0.001 for both comparisons). Total health-care costs among Medicare beneficiaries followed the same trend, with the more complex patients costing more for all-cause conditions as well as AIS-related sequelae. For Medicare patients with MCC, all-cause and AIS-related health-care costs were $56,087 and $23,260, respectively, compared to $43,002 and $20,261, respectively, among those with CC, and those without CC were $32,905 and $14,818, respectively (P-value <0.001 for both comparisons) (Figures 3 and 4).
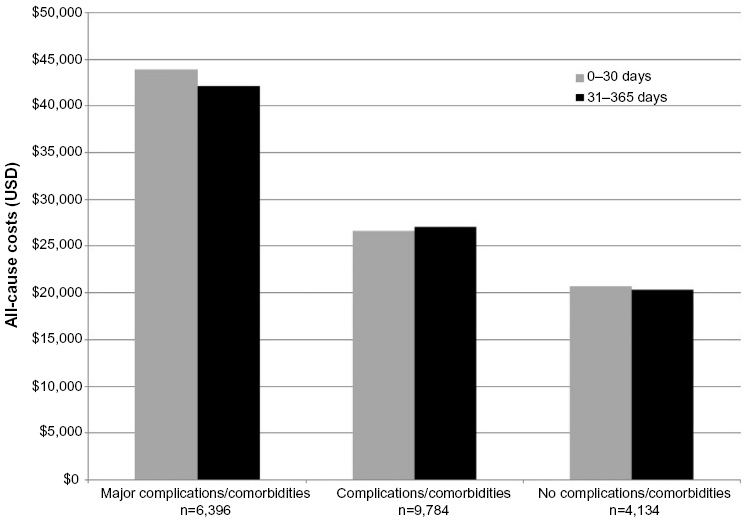 | Figure 3 Short (0–30 days) and longer-term (31–365 days) all-cause costs stratified by acute ischemic stroke severity in the commercial population. |
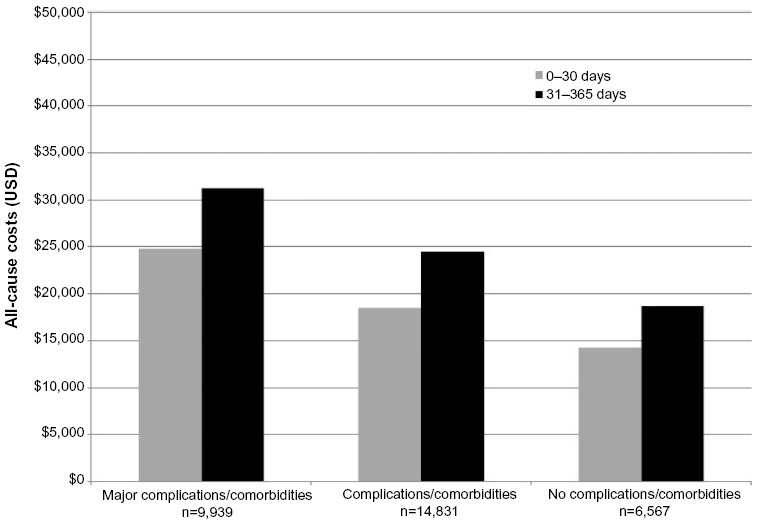 | Figure 4 Short (0–30 days) and longer-term (31–365 days) all-cause costs stratified by acute ischemic stroke severity in the Medicare population. |
Readmissions
With respect to readmissions, 25% of commercial patients (n=5,004) were readmitted within 30 days of discharge from the index AIS hospitalization; of those, 16.6% were AIS-related readmissions (Table 2). This trend held for 90-day readmissions as well: 30% of commercially insured patients were readmitted within 90 days of discharge from the index AIS hospitalization, and 16.5% of those patients were readmitted for AIS-related conditions. As expected, more severe AIS patients had higher readmission rates at both 30 and 90 days. The 30-day readmission rates were highest for commercial patients with MCC (35% and 15.8%, all-cause and AIS-related, respectively), followed by patients with CC (22.4% and 15.7%, all-cause and AIS-related), and patients without CC had the lowest all-cause rate, but the proportion of those that were AIS-related were highest among all groups (14.0% and 23.2%, all-cause and AIS-related). The 90-day readmission rates trended similarly.
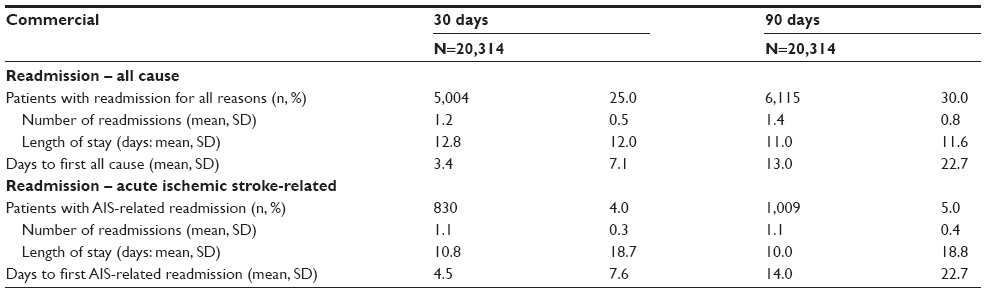 | Table 2 All-cause and acute ischemic stroke-related readmissions – Commercial |
Overall, 39% (n=12,042) of Medicare patients had a readmission within 30 days, and of these, nearly three-quarters (71.7%) were AIS-related (Table 3). Compared to patients without readmissions, patients who were readmitted were much more likely to have been discharged to inpatient rehabilitation after the acute episode (29.6% vs 1.6%) and a larger proportion had baseline hypertension (66.0% vs 61.7%), diabetes (31.1% vs 28.0%), atrial fibrillation (17.9% vs 16.3%), and chronic kidney disease (8.4% vs 7.4%) (all comparisons P<0.001). Similar to commercial patients, the Medicare 30-day readmission rates (both all-cause and AIS-related) were highest for patients with MCC (46.3% and 32.6%), followed by patients with CC (39.3% and 28.2%), and patients without CC had the lowest rates (26.8% and 20.1%). The 90-day readmission rates trended similarly.
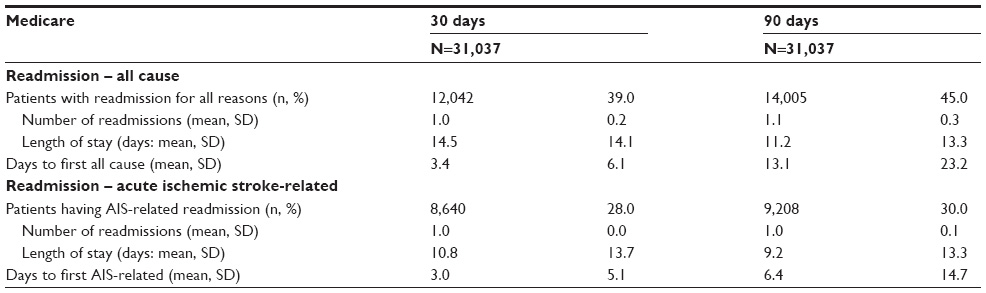 | Table 3 All-cause and acute ischemic stroke-related readmissions – Medicare |
Discussion
The typical time horizon for evaluating the total direct costs attributable to AIS should be extended beyond the 30-day and 90-day periods. For both commercial and Medicare populations in our study, at least half the total cost of care accrued in the 31–365 days after the AIS event. Overall AIS-related costs in the short term (0–30 days) were largely driven by the initial inpatient admission, while over the longer term (31–365 days) the AIS-related costs were generally attributable to outpatient services for home health care, ambulance services, diagnostic radiology, rehabilitation, and pharmacy.
Interestingly, among the few published studies that estimate the total 1-year costs of ischemic stroke in the USA, the cost attributable to the initial hospitalization is shrinking. In our study, approximately 50% of the first-year cost of stroke was attributable to the initial hospitalization. In their study of 2002–2003 administrative claims, Engel-Nitz et al13 reported cost of hospitalization for stroke and first-year follow-up costs of $15,634 and $25,036, respectively, 62% of costs being attributable to the initial hospitalization. In their study of lifetime cost of stroke based on data from 1990, Taylor et al14 found that 70% of first-year costs were attributable to the initial hospitalization. This trend could be due to the decrease in the AIS mortality rate, meaning less patients are dying who have large inpatient costs, but no additional costs that year. It could also be a reflection of the increasing complexity of postdischarge care among stroke patients.
Readmissions are common among AIS patients, and particularly so for the elderly. Readmission rates in our study were relatively high: 25% and 39% within 30 days for commercial and Medicare patients, respectively. In a recent study of 307,887 Medicare fee-for-service patients with an inpatient hospital discharge of ischemic stroke, 14.4% were readmitted within 30 days of discharge.11 The adjusted 30-day readmission rate reported by Fonarow et al15 in their study of Medicare fee-for-service patients was 14.1%, which more than doubled at 90 days to 29.2%. Fehnel et al16 reported crude 30-day and 90-day readmission rates of 21% and 35%, respectively, among stroke patients in the minimum data set. In our study, 28% of Medicare patients were readmitted within 30 days for AIS-related conditions. In fact, most of the Medicare readmissions in our study were for AIS-related sequelae. Of the 12,042 30-day Medicare readmissions in our study, 71.7% were for AIS complications. At an average inpatient cost of $12,000, this equates to nearly $104 million.
Similarly, two-thirds (65.7%) of 90-day Medicare readmissions were for AIS sequelae (9,208/14,005). Medicare patients were thus four times more likely than commercial patients to be readmitted within either 30 or 90 days for AIS-related conditions, indicating that more effective inpatient care is necessary to reduce long-term disease burden, particularly among the vulnerable elderly population.
In their study of Medicare beneficiaries from 2003 to 2008, Qian et al17 reported 1-year all-cause readmission rates of 55.6% and 1-year stroke-related of 14.4%. While their all-cause rates trend similarly to the 90-day readmission rates of this study, our Medicare population saw much higher AIS-related 90-day readmissions. There may be multiple reasons for differences in AIS-related readmission rates in the Lichtman et al,11 Fonarow et al,15 and Qian et al17 studies compared to the current study. First, there has been a decrease in the AIS mortality rate; therefore, more patients in the current study are eligible for readmission. Second, those studies use a broader definition of stroke, which could be an indicator of a less severe population not requiring the same level of care as those patients in the current study.
Limitations
As with all retrospective database studies, several limitations must be considered. This study included only those individuals with commercial health coverage or private Medicare supplemental coverage. Consequently, findings may not be generalizable to the uninsured or patients with other health insurance coverage. Second, the potential for misclassification of AIS is present as patients are identified through administrative claims data as opposed to medical records. Diagnoses on claims may be coded incorrectly or not coded at all, thereby potentially introducing measurement error with respect to ICD-9-CM and DRG-based variables. Inpatient readmissions for AIS-related sequelae may be over- or underestimated based on claims data. While we excluded patients with any evidence of stroke during the 12-month baseline period, some may have had a prior history of stroke, which increases the risk of complications to subsequent strokes. Finally, because Medicare beneficiaries are only responsible for a Part A deductible for each benefit period (beginning on admission date and ending when beneficiary has not received any inpatient hospital care for 60 consecutive days), any subsequent inpatient claim before this time does not appear in the Medicare Supplemental database because there is no patient responsibility for payment. To accommodate this limitation, a previously published algorithm was used to calculate 30-day and 90-day readmission rates in the Medicare population, and thus the Medicare readmission rates may be conservative and costs understated.18
Conclusion
This study of inpatient and outpatient commercial and Medicare claims following an AIS indicates that a substantial share of costs attributable to AIS extend beyond 30 days for both populations. Readmission rates for AIS-related complications were high, especially among Medicare beneficiaries within 30 and 90 days of discharge. Additional research should seek to quantify the degree to which more timely or effective inpatient treatment can attenuate long-term disability and reduce readmissions, thereby reducing the economic burden levied by rehabilitation after ischemic stroke. In addition, few studies have attempted to define predictors of 30-day stroke readmission, an area of the literature that should be developed using expert recommendations.19 This need is particularly timely given that a 30-day stroke readmission metric will be deployed in 2017 by the Centers for Medicare and Medicaid as a hospital quality indicator for the Inpatient Quality Reporting Program.
Acknowledgment
The authors wish to acknowledge Allison Krug for her assistance with the development and formatting of this manuscript. This work was funded by Biogen.
Disclosure
BHJ and MMB are employees of Truven Health Analytics and received financial support from Biogen to conduct the analyses. CW is an employee and shareholder of Biogen. The authors report no other conflicts of interest in this work.
References
Kochanek KD, Xu J, Murphy SL, Minino AM, Kung HC. Deaths: final data for 2009. Natl Vital Stat Rep. 2011;60(3):1–116. | |
Centers for Disease Control and Prevention (CDC). Prevalence of stroke – United States, 2006–2010. MMWR Morb Mortal Wkly Rep. 2012;61(20):379–382. | |
Centers for Disease Control and Prevention (CDC). Stroke Fact Sheet. 2015. Available from: http://www.cdc.gov/dhdsp/data_statistics/fact_sheets/fs_stroke.htm. Accessed April 21, 2015. | |
Demaerschalk BM, Hwang HM, Leung G. US cost burden of ischemic stroke: a systematic literature review. Am J Manag Care. 2010;16(7):525–533. | |
Andrews RM, Elixhauser A. The National Hospital Bill: Growth Trends and 2005 Update on the Most Expensive Conditions by Payer: Statistical Brief #42. Healthcare Cost and Utilization Project (HCUP) Statistical Briefs. Rockville, MD: Agency for Healthcare Research and Quality; 2006. | |
Go AS, Mozaffarian D, Roger VL, et al. Executive summary: heart disease and stroke statistics – 2014 update: a report from the American Heart Association. Circulation. 2014;129(3):399–410. | |
Kolominsky-Rabas PL, Heuschmann PU, Marschall D, et al. Lifetime cost of ischemic stroke in Germany: results and national projections from a population-based stroke registry: the Erlangen Stroke Project. Stroke. 2006;37(5):1179–1183. | |
Godwin KM, Wasserman J, Ostwald SK. Cost associated with stroke: outpatient rehabilitative services and medication. Top Stroke Rehabil. 2011;18(Suppl 1):676–684. | |
Mittmann N, Seung SJ, Hill MD, et al. Impact of disability status on ischemic stroke costs in Canada in the first year. Can J Neurol Sci. 2012;39(6):793–800. | |
Saxena SK, Ng TP, Yong D, Fong NP, Gerald K. Total direct cost, length of hospital stay, institutional discharges and their determinants from rehabilitation settings in stroke patients. Acta Neurol Scand. 2006;114(5):307–314. | |
Lichtman JH, Leifheit-Limson EC, Jones SB, Wang Y, Goldstein LB. Preventable readmissions within 30 days of ischemic stroke among Medicare beneficiaries. Stroke. 2013;44(12):3429–3435. | |
Bureau of Labor Statistics (BLS), U.S. Department of Labor. Consumer Price Index. News Release USDL-14-0037. 2013;10. Available from: http://www.bls.gov/news.release/archives/cpi_01162014.pdf. Accessed January 9, 2016. | |
Engel-Nitz NM, Sander SD, Harley C, Rey GG, Shah H. Costs and outcomes of noncardioembolic ischemic stroke in a managed care population. Vasc Health Risk Manag. 2010;6:905–913. | |
Taylor TN, Davis PH, Torner JC, Holmes J, Meyer JW, Jacobson MF. Lifetime cost of stroke in the United States. Stroke. 1996;27(9):1459–1466. | |
Fonarow GC, Smith EE, Reeves MJ, et al; Get With the Guidelines Steering Committee and Hospitals. Hospital level variation in mortality and rehospitalization for medicare beneficiaries with acute ischemic stroke. Stroke. 2011;42:159–166. | |
Fehnel CR, Lee Y, Wendell LC, Thompson BB, Potter NS, Mor V. Post-acute care data for predicting readmission after ischemic stroke: a nationwide cohort analysis using the minimum data set. J Am Heart Assoc. 2015;4(9):e002145. | |
Qian F, Fonarow GC, Smith EE, et al. Racial and ethnic differences in outcomes in older patients with acute ischemic stroke. Circ Cardiovasc Qual Outcomes. 2013;6(3):284–292. | |
Johnson BH, Smoyer-Tomic KE, Siu K, et al. Readmission among hospitalized patients with nonvalvular atrial fibrillation. Am J Health Syst Pharm. 2013;70(5):414–422. | |
Krumholz HM, Brindis RG, Brush JE, et al. Standards for statistical models used for public reporting of health outcomes: an American Heart Association Scientific Statement from the Quality of Care and Outcomes Research Interdisciplinary Writing Group: cosponsored by the Council on Epidemiology and Prevention and the Stroke Council. Endorsed by the American College of Cardiology Foundation. Circulation. 2006;113(3):456–462. |
Supplementary materials
Identifying acute ischemic stroke in the study population:
- DRG 061 (AIS with tPA and MCC),
- DRG 062 (AIS with tPA and complications/comorbidities [CC]),
- DRG 063 (AIS with tPA without CC/MCC),
- DRG 064 (AIS with MCC and confirmatory ischemic stroke ICD-9-CM of 434.x1),
- DRG 065 (AIS with CC and confirmatory ischemic stroke ICD-9-CM of 434.x1) or
- DRG 066 (AIS without CC/MCC and confirmatory ischemic stroke ICD-9-CM of 434.x1).
 © 2016 The Author(s). This work is published and licensed by Dove Medical Press Limited. The full terms of this license are available at https://www.dovepress.com/terms.php and incorporate the Creative Commons Attribution - Non Commercial (unported, v3.0) License.
By accessing the work you hereby accept the Terms. Non-commercial uses of the work are permitted without any further permission from Dove Medical Press Limited, provided the work is properly attributed. For permission for commercial use of this work, please see paragraphs 4.2 and 5 of our Terms.
© 2016 The Author(s). This work is published and licensed by Dove Medical Press Limited. The full terms of this license are available at https://www.dovepress.com/terms.php and incorporate the Creative Commons Attribution - Non Commercial (unported, v3.0) License.
By accessing the work you hereby accept the Terms. Non-commercial uses of the work are permitted without any further permission from Dove Medical Press Limited, provided the work is properly attributed. For permission for commercial use of this work, please see paragraphs 4.2 and 5 of our Terms.