")
Back to Journals » Therapeutics and Clinical Risk Management » Volume 19
Shifts in Intestinal Metabolic Profile Among Kidney Transplantation Recipients with Antibody-Mediated Rejection
Authors Wang J, Zhang X, Li M, Li R, Zhao M
Received 14 December 2022
Accepted for publication 26 February 2023
Published 3 March 2023 Volume 2023:19 Pages 207—217
DOI https://doi.org/10.2147/TCRM.S401414
Checked for plagiarism Yes
Review by Single anonymous peer review
Peer reviewer comments 4
Editor who approved publication: Dr Deyun Wang
Junpeng Wang,1,2 Xiaofan Zhang,3 Mengjun Li,4 Ruoying Li,4 Ming Zhao1
1Department of Organ Transplantation, Zhujiang Hospital, Southern Medical University, Guangzhou, People’s Republic of China; 2Department of Urology, Henan Provincial People’s Hospital, Zhengzhou University People’s Hospital, Zhengzhou, People’s Republic of China; 3Medical Research Center, The Second Affiliated Hospital of Zhengzhou University, Zhengzhou, People’s Republic of China; 4Department of Pathophysiology, School of Basic Medical Sciences, Zhengzhou University, Zhengzhou, People’s Republic of China
Correspondence: Ming Zhao, Tel/Fax + 86 020 62782501, Email [email protected]
Background: Antibody-mediated rejection (AMR) is emerging as the main cause of graft loss after kidney transplantation. Our previous study revealed the gut microbiota alternation associated with AMR in kidney transplant recipients, which was predicted to affect the metabolism-related pathways.
Methods: To further investigate the shifts in intestinal metabolic profile among kidney transplantation recipients with AMR, fecal samples from kidney transplant recipients and patients with end-stage renal disease (ESRD) were subjected to untargeted LC-MS-based metabolomics.
Results: A total of 86 individuals were enrolled in this study, including 30 kidney transplantation recipients with AMR, 35 kidney transplant recipients with stable renal function (KT-SRF), and 21 participants with ESRD. Fecal metabolome in patients with ESRD and kidney transplantation recipients with KT-SRF were parallelly detected as controls. Our results demonstrated that intestinal metabolic profile of patients with AMR differed significantly from those with ESRD. A total of 172 and 25 differential metabolites were identified in the KT-AMR group, when compared with the ESRD group and the KT-SRF group, respectively, and 14 were common to the pairwise comparisons, some of which had good discriminative ability for AMR. KEGG pathway enrichment analysis demonstrated that the different metabolites between the KT-AMR and ESRD groups or between KT-AMR and KT-SRF groups were significantly enriched in 33 or 36 signaling pathways, respectively.
Conclusion: From the metabolic point of view, our findings may provide key clues for developing effective diagnostic biomarkers and therapeutic targets for AMR after kidney transplantation.
Keywords: antibody-mediated rejection, kidney transplantation, intestinal metabolic profile, LC-MS, end-stage renal disease
Introduction
Kidney transplantation is the preferred option of end-stage renal disease (ESRD), leading to improved quality of life, and lower cost compared with hemodialysis.1 Kidney allograft survival has significantly improved with the advances in immunosuppressive regimens and transplant surgery.2 However, current immunosuppressants were mainly against T cells to inhibit T cell-mediated rejection (TCMR), and antibody-mediated rejection (AMR) is emerging as the major cause of graft loss after kidney transplantation.3,4 Donor-specific antibodies (DSA) against human leukocyte antigen (HLA) are considered to be the leading cause of AMR, which could damage vascular endothelium of allografts by antibody-dependent cellular cytotoxicity (ADCC) and complement-dependent cytotoxicity (CDC).5 Nowadays, treatment options for AMR are mainly plasmaphereses, intravenous immunoglobulin, and anti-B-cell therapy (rituximab), which still provide limited results.6 Thus, determining underlying factors that might affect the occurrence and development of AMR is an important unmet medical need in kidney transplant.
The human gut microbiota, also referred to as the second brain, is a complex microbial ecosystem harboring numerous species of bacteria, virus, fungi, and protozoa, and play vital roles in maintaining host physiology and homeostasis.7,8 Gut microbes could catabolize exogenous dietary components and other constituents, and produce an extremely diverse reservoir of metabolites which is a crucial factor in host–microbe interactions.9 Alteration in the metabolic activities or composition of the gut microbiota has been associated with diverse diseases such as chronic inflammatory diseases, cardiovascular diseases, obesity, cancers, and behavioral disorders.10–12 Dysbiosis of the gut microbiota in patients with ESRD was demonstrated to shape a detrimental metabolome aggravating renal fibrosis and oxidative stress,13 suggesting that the gut microbiota could affect renal function of the host via metabolites.
Increasing research attention is focused on gut microbiota-derived metabolites and their particular roles. Short chain fatty acids (SCFAs), as the main products of gut metabolism, could not only regulate energy metabolism through multiple mechanisms, but also modulate cell function through specific G protein–coupled receptors (GPRs) or by inhibiting histone deacetylase (HDAC) activity.14,15 The inhibition of HDAC by SCFAs could also suppress the proliferation of tumor cells16 and NF-κB-mediated inflammation.17,18 Besides SCFAs, other intestinal metabolites, aromatic amino acid metabolites, tryptophan metabolites, and phenylalanine metabolites were also reported to play an important role in the development of the disease.15 Notably, manipulation of the intestinal metabolism by a high-fiber diet or supplementation with sodium acetate generated tolerance dependent on Tregs and GPR43, and exhibited protection from rejection,19 suggesting the possible involvement of intestinal metabolism in regulating graft rejection.
In our previous study, we have profiled the gut microflora correlated with AMR in kidney transplantation recipients through the 16S rDNA sequencing approach, and identified significant differences in the composition of gut microbiota in recipients with AMR versus the recipients with stable renal function.20 The intestinal microbiota and metabolic regulation of the host are closely linked.21 Our predictive analysis with PICRUSt and KEGG annotations also demonstrated that majority of the functional pathways significantly changed in the AMR group were associated with the metabolism. Therefore, we speculate that the intestinal metabolic profile of the recipients with AMR may differ from that of the recipients with stable renal function. To further explore the shifts in intestinal metabolic profile among kidney transplantation recipients with AMR, fecal samples from kidney transplantation recipients with AMR were subjected to untargeted LC-MS-based metabolomics. In parallel, we investigated the fecal metabolome in kidney transplantation recipients with stable renal function as the controls. To exclude the effect of renal function on intestinal metabolites, an additional group of patients with ESRD were also included as controls.
Materials and Methods
Study Participants and Sample Collection
A total of 86 individuals from Henan Provincial People’s Hospital were enrolled in this study, including 30 kidney transplantation recipients with AMR, 35 kidney transplantation recipients with stable renal function, and 21 patients with ESRD. This study was approved by the Ethics Committee of Henan Provincial People’s Hospital. AMR was diagnosed according to the Banff 2019 criteria.22 In this study, AMR refers to chronic active AMR. Subjects were excluded if they reported a history of infection, non-infectious diarrhea, antibiotic usage, or gastrointestinal surgery. Recipients with AMR were required to collect fecal samples within 24 hours of diagnosis before treatment of rejection. Fecal samples from kidney transplantation recipients with stable renal functions and patients with ESRD were collected as controls. Fecal pellets were collected freshly, frozen immediately and stored at −80°C until further use.
Sample Processing
Briefly, 400 μL of prechilled methanol/acetonitrile/water (V/V/V, 4:4:2) solution was added to the tube containing about 100 mg of fecal sample, vortexed for 60s, and left standing undisturbed for 60 min at −20°C. Then, the mixture was precipitated via centrifugation at 14,000 rpm for 20 min at 4°C, and the supernatants were collected and vacuum-dried. The residues were reisolated in 100 μL of acetonitrile/water (V/V, 1:1), vortexed to mix for 60s, followed by centrifugation at 14,000 rpm for 15 min at 4°C. 20 µL of the obtained supernatant were utilized for further untargeted LC-MS metabolomics analysis.
Untargeted Metabolomics by LC-MS
Regarding chromatographic conditions, hydrophilic interaction liquid chromatography (HILIC) column was utilized for the sample separation with Agilent 1290 Infinity LC ultrahigh performance liquid chromatography (UHPLC; Palo Alto, CA, USA). The column temperature was 25°C and the flow rate was 0.3 mL/min. Mobile phase solvent system consisted of 25 mM ammonium acetate and 25 mM aqueous ammonia in water (mobile phase A) and acetonitrile (mobile phase B). The gradient elution method was detailed as follows: 0–1 min, 95% B; 1–14 min, linear elution from 95% to 65% B; 14–16 min, linear elution from 65% to 40% B; 16–18 min, hold at 40% B; 18–18.1 min, linear elution from 40% to 95% B; 18.1–23 min, maintained at 95% B. The samples were maintained at 4°C throughout the analysis. For the purposes of monitoring and evaluating the system stability and data reliability, QC samples were utilized.
For detection, electrospray ionization (ESI) was conducted in the positive ion and negative ion modes. After UHPLC separation, samples were analyzed by mass spectrometry with an AB SCIEX 6600 Triple-TOF- mass spectrometry (AB SCIEX, USA). ESI source parameters were as follows: ion source gas 1, 60 psi; ion source gas 2, 60 psi; curtain gas, 30 psi; source temperature, 600°C; ion spray voltage floating, ± 5500 V. Detector parameters were as follows: MS scan m/z range, 60–1000 Da; product ion scan m/z range, 25–1000 Da; MS scan accumulation time, 0.20 s/spectra; product ion scan accumulation time, 0.05 s/spectra; DP, ± 60 V; and collision energy, 35±15 eV. Isotopes smaller than 4 Da were excluded from the IDA set, and 6 candidate ions were monitored per cycle.
Data Handling and Statistical Analysis
Raw mass spectrometric files were converted into mzXML format through ProteoWizard, and further analyzed by XCMS software package. Metabolites were identified by a self-built database from the laboratory (Shanghai Paisennuo Biological Technology Co. Ltd, Shanghai, China) retrieved using accurate mass number matching (<25 ppm) and second stage spectrogram matching. We removed the ion peak with missing values more than 50% from the XCMS data. The SIMCA-P package (Version 14.1, Umetrics, Umea, Sweden) was used for multivariate pattern recognition analysis.23 Student’s t-test and variation multiple analysis were used in the unidimensional statistical analysis. When calculating quartiles, the median is included as a value in the data set. Identification of differential metabolites was on the basis of univariate statistical analysis P value <0.05 and multidimensional statistical analysis VIP > 1. All graphs were drawn using the R software.
Demographic data and clinical indicators of the participants were gained from Henan Provincial People’s Hospital. Statistical Package for Social Science (SPSS 21.0, Chicago, IL, USA) was utilized to compare demographic data and clinical parameters among groups. We considered P values of <0.05 to be significant.
Results
Participant Demographics and Clinical Data
This research enrolled 30 kidney transplantation recipients with AMR, 35 kidney transplantation recipients with stable renal function and negative DSAs, and 21 patients with ESRD. Clinical and demographics characteristics of the individuals included in this research are presented in Table 1. Histomorphological lesions in recipients with AMR according to the Banff 2019 criteria were shown in Table S1 in Supplementary Materials. The three groups did not show significant differences in age, gender, body mass index (BMI), serum uric acid, alkaline phosphatase, lactate dehydrogenase, white blood cell, and platelet. Compared with that in the KT-SRF group, significant higher levels of serum creatinine (P < 0.0001), blood urea nitrogen (P < 0.0001), urine protein (P < 0.0001), and lower levels of serum hemoglobin (P < 0.0001) were observed in the KT-AMR and ESRD groups. Levels of serum albumin in KT-AMR group were significantly lower than that in the KT-SRF group and ESDR group (P < 0.0001; P = 0.0053, respectively).
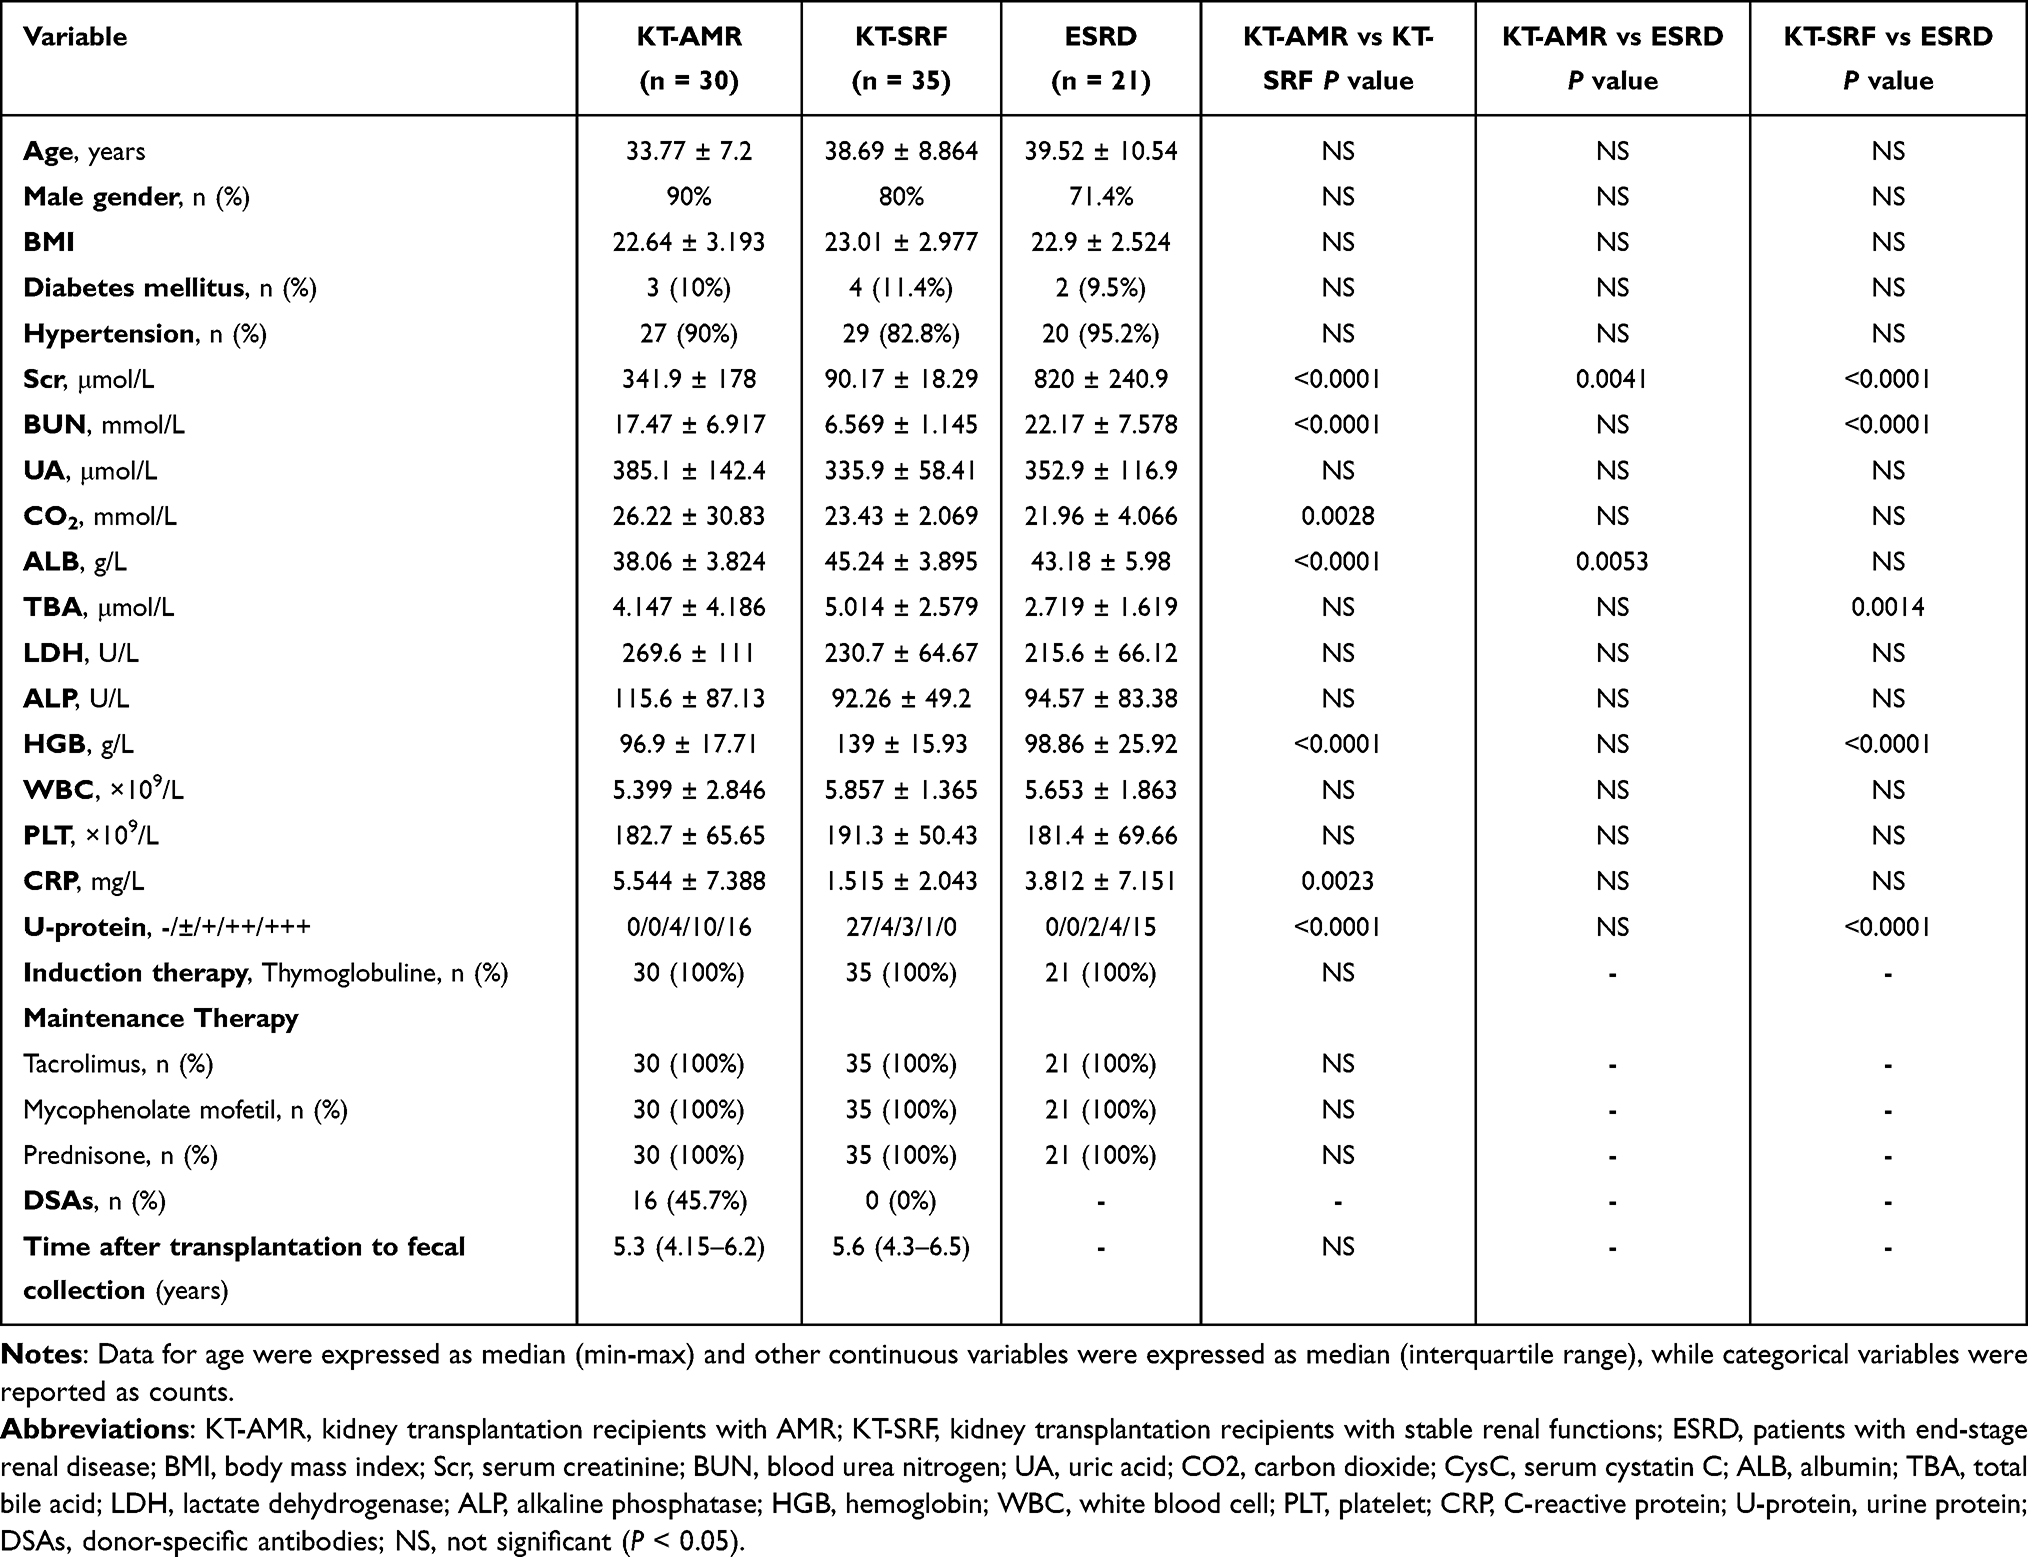 |
Table 1 Comparisons of Demographic and Clinical Characteristics Between Recipients with AMR and Controls |
Differences in Intestinal Metabolic Profiles Among the KT-AMR, KT-SRF, and ESRD Groups
To understand the intestinal metabolic changes associated with AMR after kidney transplant, an untargeted metabolomics analysis was performed on fecal samples from KT-AMR, KT-SRF, and ESRD groups using LC-MS. There were 11,683 metabolic ion peaks extracted, including 6205 positive and 5478 negative ion peaks. Firstly, the overall metabolic variations among different groups were analyzed by unsupervised principal component analysis (PCA). On PCA score plots, quality control (QC) samples were clustered well, indicating the reliability and stability of the data (Figure 1A and B). PCA score plots showed that the KT-AMR group and KT-SRF group overlapped with each other, and both groups were obviously separated from the ESRD group both in positive ion mode (Figure 1A) and negative ion mode (Figure 1B). In order to get a deeper look into the significant discriminant metabolites and maximize the sample separation between groups, supervised orthogonal partial least-squares discriminant analysis (OPLS-DA) was also conducted. OPLS-DA analysis in positive and negative ion modes (Figure 1C–H) showed that the KT-AMR and KT-SRF and ESRD groups were separated from each other, and each group could be gathered together (Figure 1C–H). The OPLS-DA model obtained for KT-SRF vs ESRD exhibited the highest predictive ability (ESI+: Q2 = 0.912 or ESI-: Q2 = 0.909; Figure 1E and H), followed by the KT-AMR vs ESRD model (ESI+: Q2 = 0.888 or ESI-: Q2 = 0.895; Figure 1C and F), while the KT-AMR vs KT-SRF model showed the lowest predictive ability (ESI+: Q2 = 0.348 or ESI-: Q2 = 0.178; Figure 1D and G). The above results suggested that intestinal metabolome of recipients with AMR differed significantly from those with ESRD, whereas they were not obviously different from those of recipients with stable renal functions.
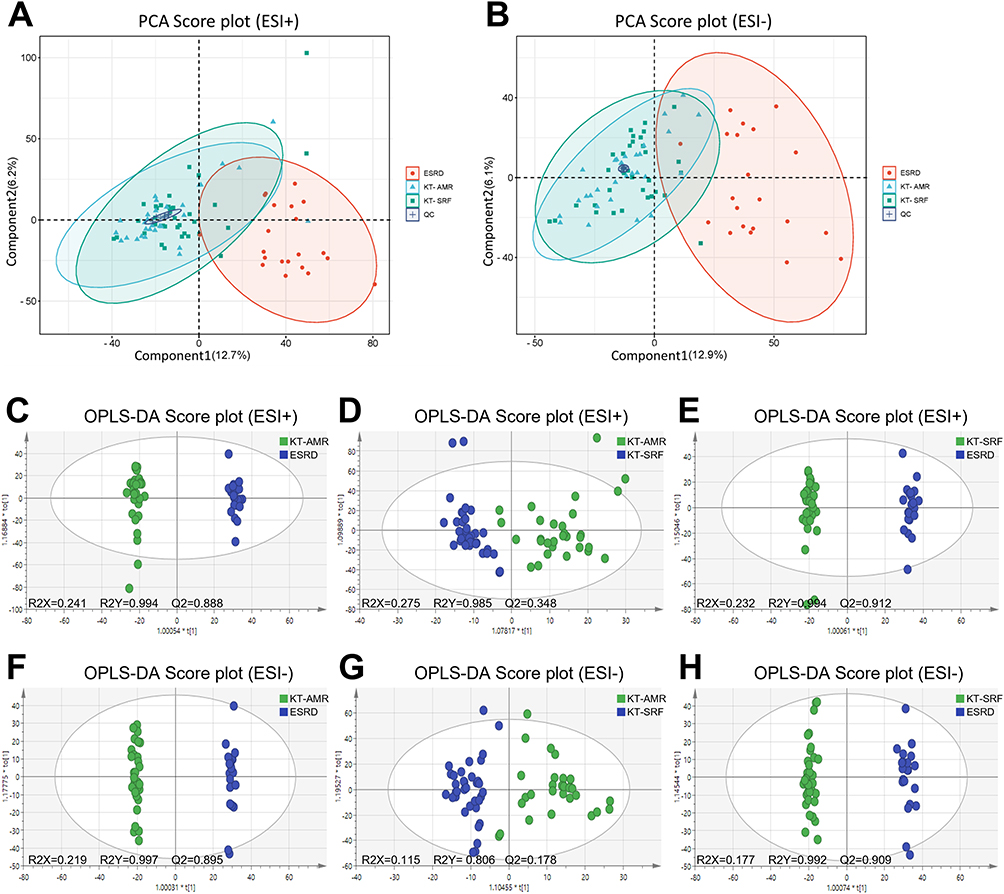 |
Figure 1 Differences in intestinal metabolic profiles among the KT-AMR, KT-SRF, and ESRD groups. (A) PCA score plots in the ESI+ mode; (B) PCA score plots in the ESI- mode; (C) OPLS-DA score plots in the ESI+ mode (KT-AMR vs ESRD); (D) OPLS-DA score plots in the ESI+ mode (KT-AMR vs KT-SRF); (E) OPLS-DA score plots in the ESI+ mode (KT-SRF vs ESRD); (F) OPLS-DA score plots in the ESI- mode (KT-AMR vs ESRD); (G) OPLS-DA score plots in the ESI- mode (KT-AMR vs KT-SRF); (H) OPLS-DA score plots in the ESI- mode (KT-SRF vs ESRD). Abbreviations: KT-AMR, kidney transplantation recipients with AMR; KT-SRF, kidney transplantation recipients with stable renal functions; ESRD, patients with end-stage renal disease. |
Identification of Differential Intestinal Metabolites
Metabolites were selected as potential metabolic biomarkers with the combination of variable importance in projection (VIP) >1 in the OPLS-DA model, and P < 0.05 in Kruskal–Wallis test among different groups. A total of 172 metabolites (21 upregulated and 151 downregulated) showed significant differences in the KT-AMR group compared with the ESRD group, and 25 metabolites (18 upregulated and 7 downregulated) showed significant differences in the KT-AMR group compared with the KT-SRF group (Figure 2A and Table S2 in Supplementary Materials). Moreover, 23 upregulated and 136 downregulated metabolites were also found in the KT-SRF group, when compared with the ESRD group (Figure 2A and Table S2 in Supplementary Materials). Among the differential metabolites, 14 were differentially expressed in both the ESRD group and the KT-SRF group compared to the KT-AMR group (Figure 2B and Table S2 in Supplementary Materials). Notably, there were significantly higher levels of N-Palmitoylsphingosine and Erucamide, and lower levels of 3b-Hydroxy-5-cholenoic acid, N-Acetyl-L-Histidine, Enoxolone and Arg-Glu in the KT-AMR group than the other groups.
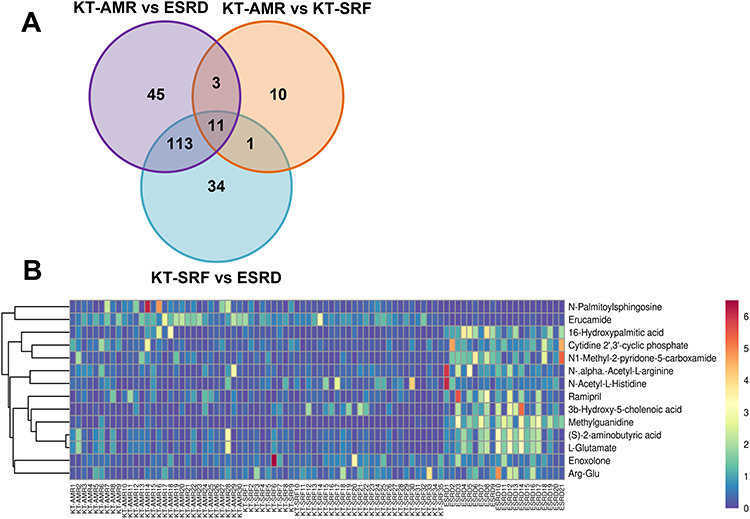 |
Figure 2 Differential intestinal metabolites among the KT-AMR, KT-SRF, and ESRD groups. (A) Wayne figures of overlapping and different metabolites among groups; (B) the heatmap of 14 differential intestinal metabolites in both the ESRD group and the KT-SRF group compared the KT-AMR group. Abbreviations: KT-AMR, kidney transplantation recipients with AMR; KT-SRF, kidney transplantation recipients with stable renal functions; ESRD, patients with end-stage renal disease. |
Evaluation of the Discriminating Ability of Potential Biomarkers in AMR After Kidney Transplantation
To further determine whether the differential metabolites, which were differentially expressed in both the ESRD group and the KT-SRF group compared to the KT-AMR group, could be used as a biomarker to differentiate the recipients with AMR from recipients with stable renal function, and patients with ESRD, we conducted ROC curve analysis. The results demonstrated that when distinguishing recipients with AMR from the patients with ESRD, all of the 14 differential metabolites had AUC values larger than 0.7. Among them, N-Palmitoylsphingosine (AUC = 0.9524), Methylguanidine (AUC = 0.9952) and Erucamide (AUC = 0.9968) were observed to have excellent predictive abilities (Figure 3A). However, when these metabolites were used to differentiate recipients with AMR from recipients with stable renal function, their predictive abilities were moderate, and the AUC values ranged between 0.7219 and 0.5914 (Figure 3B). Thus, we then examined the discriminant validity of the six top-ranked predicting metabolites (N-Palmitoylsphingosine, N1-Methyl-2-pyridone-5-carboxamide, Methylguanidine, Enoxolone Arg-Glu, and N-Acetyl-L-Histidine) to determine their ability to distinguish the KT-AMR and KT-SRF groups by using multivariate logistic regression. The result showed that the combination obviously improved the model’s ability to discriminate between the KT-AMR and KT-SRF groups, with an AUC of 0.919 (Figure 3C). The multivariate model of biomarkers for discriminating between KT-AMR and KT-SRF group was shown in Supplementary Materials. In addition, we assessed the abilities of these metabolites in discriminating between the KT-SRF and ESRD groups, and among them, Methylguanidine, Erucamide, 16-Hydroxypalmitic acid, and (S)-2-aminobutyric acid showed good discriminative power to distinguish these groups (Figure 3D).
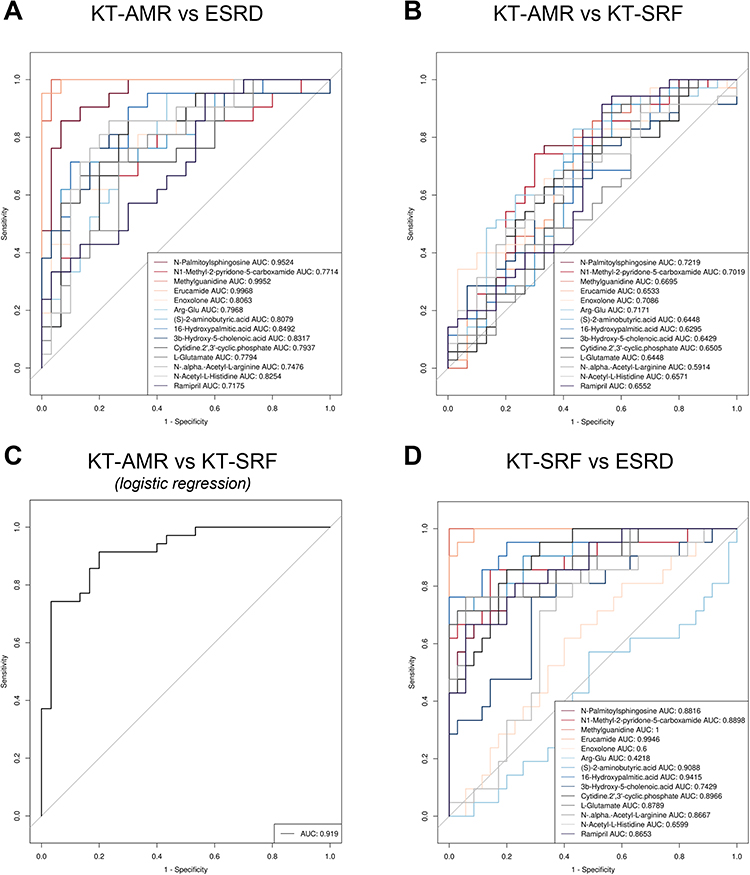 |
Figure 3 Receiver operating characteristic (ROC) curves of potential metabolic biomarkers. (A) ROC curves of metabolites to discriminate between the KT-AMR and ESRD groups; (B) ROC curves of metabolites to discriminate between the KT-AMR and KT-SRF groups; (C) ROC curves of the combination of metabolic biomarkers using logistic regression models to discriminate between the KT-AMR and KT-SRF groups; (D) ROC curves of metabolites to discriminate between the KT-SRF and ESRD groups. Abbreviations: AUC, the total area under the ROC curve; KT-AMR, kidney transplantation recipients with AMR; KT-SRF, kidney transplantation recipients with stable renal functions; ESRD, patients with end-stage renal disease. |
Metabolic Pathway Enrichment Analysis
Furthermore, the functional analysis of pathways related to the pairwise differential metabolites between the three groups was conducted using KEGG analysis, respectively. The top 10 enrichment pathways were represented by bubble charts in Figure 4A–C. In total, the 172 differential metabolites between the KT-AMR and the ESRD groups were assigned to 33 KEGG pathways, mainly including ABC transporters, biosynthesis of amino acids, and Alanine, aspartate and glutamate metabolism (Table S3 in Supplementary Materials and Figure 4A). While the 25 differential metabolites between the KT-AMR and the KT-SRF groups were enriched to 36 pathways, including Histidine metabolism, GABAergic synapse, and D-Glutamine and D-glutamate metabolism, etc. (Table S4 in Supplementary Materials and Figure 4B). Among these enriched pathways, 20 pathways (ABC transporters, biosynthesis of amino acids, Alanine, aspartate and glutamate metabolism, etc.) were shared by the pairwise comparisons (Table S3 and S4 in Supplementary Materials). At the same time, pathway enrichment analysis for KEGG was also performed for the differential metabolites between the KT-SRF and the ESRD groups, and 34 enriched pathways such as Histidine metabolism, GABAergic synapse, and D-Glutamine and D-glutamate metabolism were identified (Table S5 in Supplementary Materials and Figure 4C).
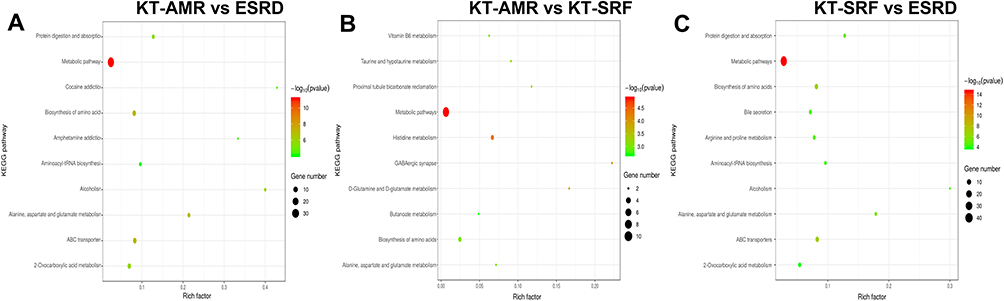 |
Figure 4 Metabolic pathway enrichment analysis. The top 10 enrichment pathways were represented by bubble charts. (A) ROC curves of microbial biomarkers. (A) Pathway enrichment analysis of differential metabolites between the KT-AMR and ESRD groups; (B) pathway enrichment analysis of differential metabolites between the KT-AMR and KT-SRF groups; (C) pathway enrichment analysis of differential metabolites between the KT-SRF and ESRD groups. Abbreviations: KT-AMR, kidney transplantation recipients with AMR; KT-SRF, kidney transplantation recipients with stable renal functions; ESRD, patients with end-stage renal disease. |
Discussion
The findings of this study demonstrated that intestinal metabolic profile of patients with AMR differed significantly from those with ESRD, whereas they were not obviously different from those of recipients with stable renal functions. A total of 172 and 25 differential metabolites were identified in the KT-AMR group, when compared with the ESRD group and the KT-SRF group, respectively. Differential metabolites including N-Palmitoylsphingosine, Methylguanidine and Erucamide, have discriminative power to distinguish the KT-AMR and ESRD groups. Combination of N-Palmitoylsphingosine, N1-Methyl-2-pyridone-5-carboxamide, Methylguanidine, Enoxolone, Arg-Glu, and N-Acetyl-L-Histidine could effectively discriminate the KT-AMR group well from the KT-SRF group. The results of KEGG pathway enrichment analysis indicated that the differential metabolites between the KT-AMR and ESRD groups or between KT-AMR and KT-SRF groups were significantly enriched in 33 or 36 signaling pathways, respectively.
Abnormal metabolism, such as abnormal glucose regulation, obesity and metabolic syndrome, dyslipidaemia, metabolic bone disease, and hyperuricaemia, are common in kidney transplantation recipients, which are considered possibly associated with decreased long-term renal graft survival.24 Our previous study revealed dysbiosis of gut microbiota in renal transplant recipients with AMR.20 The main differences between the present study and our previous study are as follows. Firstly, the purpose of our previous study was to characterize the gut microbiota associated with AMR after kidney transplantation, while the present study aimed to investigate the shifts in intestinal metabolic profile in recipients with AMR. Secondly, in the previous study, we profiled the gut microflora alternation through the 16S rDNA sequencing approach, while the exploration of the shifts in intestinal metabolic profile in this study employed untargeted LC-MS-based metabolomics. Thirdly, for the selection of controls, besides kidney transplantation recipients with stable renal functions, we included an additional group of patients with ESRD as controls to exclude influence on intestinal metabolites by the changes in renal function. Overall, the difference of the intestinal metabolic profiles between the KT-AMR and the KT-SRF groups was not as distinct as with the ESRD group. This could be relevant for the usage of the anti-rejection and anti-infective therapy after kidney transplantation, since antibiotics25,26 or tacrolimus27 treatment was reported to affect the intestinal metabolism by regulating the gut microbiota. The classes and dose of antihypertensive drug were not exactly the same among patients, which somewhat might also impact intestinal metabolites. Considering differences in degree of renal impairment may have an impact on intestinal metabolic profiles, in further study, chronic kidney disease (CKD) patients or kidney recipients who have comparable renal functions but no AMR should be included as the control to reduce the confounding effects as much as possible.
There is growing evidence of roles of intestinal metabolites as biomarkers of human diseases such as colorectal cancer,28 colitis,29 irritable bowel syndrome,30 and Parkinson’s disease.31 In this study, N-Palmitoylsphingosine, Methylguanidine and Erucamide were found to have satisfactory discriminative power to distinguish the KT-AMR and ESRD groups. Among them, the function of Methylguanidine is controversial. Methylguanidine is a kind of guanidine compound, and commonly derived from creatinine in protein catabolism. On one hand, Methylguanidine is suggested to be a uremic toxin that accumulated in renal failure,32 but on the other hand, it showed anti-inflammatory properties by inhibiting the activity of inducible nitric oxide synthase and the release of tumor necrosis factor.33 However, there is little evidence defining the role of these three metabolites in transplant rejection. We identified 25 differential metabolites between KT-AMR and KT-SRF groups, though the difference in their intestinal metabolic profiles was not apparent in general. A multivariable logistic regression model including 6 differential metabolites (N-Palmitoylsphingosine, N1-Methyl-2-pyridone-5-carboxamide, Methylguanidine, Enoxolone Arg-Glu, and N-Acetyl-L-Histidine) could be used to distinguish the KT-AMR and KT-SRF groups. Among these metabolites, we noticed that the level of N1-Methyl-2-pyridone-5-carboxamide in the KT-SRF group was significantly higher than that in the KT-AMR group. N1-methyl-2-pyridone-5-carboxamide could be used as biomarkers of niacin status which was shown to be negatively associated with premature mortality in kidney transplant recipients.34 It has been shown that the urinary excretion of the sum of N1-Methyl-2-pyridone-5-carboxamide and N1-methylnicotinamide was negatively associated with risk of all-cause mortality of kidney transplant recipients. However, the role of N1-Methyl-2-pyridone-5-carboxamide in the pathogenesis of AMR is still unclear and needs further exploration.34
The differential metabolites between the KT-AMR and ESRD groups or between KT-AMR and KT-SRF groups were significantly enriched in 33 or 36 signaling pathways, respectively. We noticed that bile acid metabolism associated pathways (“Bile secretion” or “Taurine and hypotaurine metabolism”) could be enriched in both comparisons. Higher bile acid levels and predominance of conjugated bile acid were independent predictors of chronic lung allograft dysfunction.35 In particular, elevated taurocholic acid was reported to be associated with concurrent acute lung allograft dysfunction36 and intestinal transplant rejection.37 Actually, besides bile acid metabolism, it is worthy of attention that many differential metabolites were enriched in “Biosynthesis of amino acids” and “D-Glutamine and D-glutamate metabolism” pathways. D-glutamine exhibited good diagnostic capability for the diagnosis of the early acute rejection after heart transplantation with a high sensitivity and specificity.38 Moreover, inhibition of glutamine metabolism was considered to prevent graft rejection by inhibiting generation and function of effector T cells. In fully mismatched skin and heart allograft transplantation models, the inhibitor of glutamine metabolism 6-diazo-5-oxo-L-norleucine (DON) combined with the glycolytic inhibitor 2-deoxyglucose (2-DG) and the anti-type II diabetes drug metformin, were demonstrated to prevent or delay graft rejection.39 Thus, the role of bile acid metabolism and glutamine metabolism in the development and progression of AMR after kidney transplantation deserves further clarification.
Notably, our findings should be taken in consideration with limitations. Firstly, the intestinal metabolic profiles of recipients with AMR were not obviously different from those of recipients with stable renal functions, and the ability to store and analyze fecal samples is often underpowered in the clinic, thus the application of intestinal metabolome in AMR diagnosis and treatment would be restricted to some extent. Secondly, the design of the study is partially inappropriate. In this study, we included patients with ESRD as one of the control groups. However, the patients with ESRD did not receive immunosuppressive therapy as the kidney recipients did, and immunosuppressants such as tacrolimus27 was reported to affect the intestinal metabolism by regulating the gut microbiota. Therefore, the difference of intestinal metabolism between patients with ERSD and transplant recipients is largely attributed to the immunosuppressive treatment.
In conclusion, we have compared intestinal metabolic profile of the KT-AMR group to the ESRD and KT-SRF groups, and identified differentially expressed metabolites associated with AMR after kidney transplantation. From the metabolic point of view, our findings may provide key clues for developing effective diagnostic biomarkers and therapeutic targets for AMR after kidney transplantation. Further investigation is also needed to clarify the role of the alternation of intestinal metabolic profiles in the pathogenesis and development of AMR.
Data Sharing Statement
All data for this study are included in this published article.
Ethical Approval
This study complied with the Declaration of Helsinki. The donated organs were from living related donations and cardiac death donations. We confirmed that all organs were donated voluntarily with written informed consent, and this was conducted in accordance with the Declaration of Istanbul.
All procedures performed in studies involving human participants were conducted in accordance with the ethical guideline based on the regulations of Henan Provincial People’s Hospital federal regulations. Informed consent was obtained from all individual participants included in the study.
Author Contributions
All authors made a significant contribution to the work reported, whether that is in the conception, study design, execution, acquisition of data, analysis and interpretation, or in all these areas; took part in drafting, revising or critically reviewing the article; gave final approval of the version to be published; have agreed on the journal to which the article has been submitted; and agree to be accountable for all aspects of the work.
Funding
This research was supported by the Medical Science and Technology Research Project of Henan Province (Grant No. LHGJ20210049). The sponsors had no role in study design, data collection, data analysis, data interpretation, or writing of the report.
Disclosure
The authors declare no conflicts of interest in this work.
References
1. Butler CR, Wightman A, Richards CA, et al. Thematic analysis of the health records of a national sample of us veterans with advanced kidney disease evaluated for transplant. JAMA Intern Med. 2021;181:212–219. doi:10.1001/jamainternmed.2020.6388
2. Halloran PF. Immunosuppressive drugs for kidney transplantation. N Engl J Med. 2004;351:2715–2729. doi:10.1056/NEJMra033540
3. de Leur K, Clahsen-van groningen MC, van den Bosch TPP, et al. Characterization of ectopic lymphoid structures in different types of acute renal allograft rejection. Clin Exp Immunol. 2018;192:224–232. doi:10.1111/cei.13099
4. Loupy A, Lefaucheur C, Vernerey D, et al. Complement-binding anti-HLA antibodies and kidney-allograft survival. N Engl J Med. 2013;369:1215–1226. doi:10.1056/NEJMoa1302506
5. Loupy A, Lefaucheur C. Antibody-mediated rejection of solid-organ allografts. N Engl J Med. 2018;379:1150–1160. doi:10.1056/NEJMra1802677
6. Budde K, Durr M. Any progress in the treatment of antibody-mediated rejection? J Am Soc Nephrol. 2018;29:350–352. doi:10.1681/ASN.2017121296
7. Shanahan F, Ghosh TS, O’Toole PW. The healthy microbiome-what is the definition of a healthy gut microbiome? Gastroenterology. 2021;160:483–494. doi:10.1053/j.gastro.2020.09.057
8. Thursby E, Juge N. Introduction to the human gut microbiota. Biochem J. 2017;474:1823–1836. doi:10.1042/BCJ20160510
9. Agus A, Clement K, Sokol H. Gut microbiota-derived metabolites as central regulators in metabolic disorders. Gut. 2021;70:1174–1182. doi:10.1136/gutjnl-2020-323071
10. Cani PD. Gut microbiota - at the intersection of everything? Nat Rev Gastroenterol Hepatol. 2017;14:321–322. doi:10.1038/nrgastro.2017.54
11. Lynch SV, Pedersen O. The human intestinal microbiome in health and disease. N Engl J Med. 2016;375:2369–2379. doi:10.1056/NEJMra1600266
12. Cussotto S, Sandhu KV, Dinan TG, Cryan JF. The neuroendocrinology of the microbiota-gut-brain axis: a behavioural perspective. Front Neuroendocrinol. 2018;51:80–101. doi:10.1016/j.yfrne.2018.04.002
13. Wang X, Yang S, Li S, et al. Aberrant gut microbiota alters host metabolome and impacts renal failure in humans and rodents. Gut. 2020;69:2131–2142. doi:10.1136/gutjnl-2019-319766
14. Maslowski KM, Vieira AT, Ng A, et al. Regulation of inflammatory responses by gut microbiota and chemoattractant receptor GPR43. Nature. 2009;461:1282–1286. doi:10.1038/nature08530
15. Wang Y, Wang H, Howard AG, et al. Circulating Short-Chain fatty acids are positively associated with adiposity measures in Chinese adults. Nutrients. 2020;12. doi:10.3390/nu12072127
16. Acharya MR, Sparreboom A, Venitz J, Figg WD. Rational development of histone deacetylase inhibitors as anticancer agents: a review. Mol Pharmacol. 2005;68:917–932. doi:10.1124/mol.105.014167
17. Kendrick SF, O’Boyle G, Mann J, et al. Acetate, the key modulator of inflammatory responses in acute alcoholic hepatitis. Hepatology. 2010;51:1988–1997. doi:10.1002/hep.23572
18. Usami M, Kishimoto K, Ohata A, et al. Butyrate and trichostatin A attenuate nuclear factor kappaB activation and tumor necrosis factor alpha secretion and increase prostaglandin E2 secretion in human peripheral blood mononuclear cells. Nutr Res. 2008;28:321–328. doi:10.1016/j.nutres.2008.02.012
19. Wu H, Singer J, Kwan TK, et al. Gut microbial metabolites induce donor-specific tolerance of kidney allografts through induction of T regulatory cells by short-chain fatty acids. J Am Soc Nephrol. 2020;31:1445–1461. doi:10.1681/ASN.2019080852
20. Wang J, Li X, Wu X, et al. Gut microbiota alterations associated with antibody-mediated rejection after kidney transplantation. Appl Microbiol Biotechnol. 2021;105:2473–2484. doi:10.1007/s00253-020-11069-x
21. Nicholson JK, Holmes E, Kinross J, et al. Host-gut microbiota metabolic interactions. Science. 2012;336:1262–1267. doi:10.1126/science.1223813
22. Loupy A, Haas M, Roufosse C, et al. The banff 2019 kidney meeting report (I): updates on and clarification of criteria for T cell- and antibody-mediated rejection. Am J Transplant. 2020;20:2318–2331. doi:10.1111/ajt.15898
23. Triba MN, Le Moyec L, Amathieu R, et al. PLS/OPLS models in metabolomics: the impact of permutation of dataset rows on the K-fold cross-validation quality parameters. Mol Biosyst. 2015;11(1):13–19. doi:10.1039/c4mb00414k
24. Piotti G, Gandolfini I, Palmisano A, Maggiore U. Metabolic risk profile in kidney transplant candidates and recipients. Nephrol Dial Transplant. 2019;34:388–400. doi:10.1093/ndt/gfy151
25. Liu X, Zheng H, Lu R, et al. Intervening effects of total alkaloids of corydalis saxicola bunting on rats with antibiotic-induced gut microbiota dysbiosis based on 16S rRNA gene sequencing and untargeted metabolomics analyses. Front Microbiol. 2019;10:1151. doi:10.3389/fmicb.2019.01151
26. Gao K, Pi Y, Peng Y, Mu CL, Zhu WY. Time-course responses of ileal and fecal microbiota and metabolite profiles to antibiotics in cannulated pigs. Appl Microbiol Biotechnol. 2018;102:2289–2299. doi:10.1007/s00253-018-8774-2
27. Jiao W, Zhang Z, Xu Y, et al. Butyric acid normalizes hyperglycemia caused by the tacrolimus-induced gut microbiota. Am J Transplant. 2020;20:2413–2424. doi:10.1111/ajt.15880
28. Wang Z, Cui B, Zhang F, et al. Development of a correlative strategy to discover colorectal tumor tissue derived metabolite biomarkers in plasma using untargeted metabolomics. Anal Chem. 2019;91:2401–2408. doi:10.1021/acs.analchem.8b05177
29. Liu F, Liu J, Wang TTY, et al. Molecular and microbial signatures predictive of prebiotic action of neoagarotetraose in a dextran sulfate sodium-induced murine colitis model. Microorganisms. 2020;8:995. doi:10.3390/microorganisms8070995
30. Zhu S, Liu S, Li H, et al. Identification of gut microbiota and metabolites signature in patients with irritable bowel syndrome. Front Cell Infect Microbiol. 2019;9:346. doi:10.3389/fcimb.2019.00346
31. Singh Y, Trautwein C, Dhariwal A, et al. DJ-1 (Park7) affects the gut microbiome, metabolites and the development of innate lymphoid cells (ILCs). Sci Rep. 2020;10:16131. doi:10.1038/s41598-020-72903-w
32. Marzocco S, Di Paola R, Serraino I, et al. Effect of methylguanidine in carrageenan-induced acute inflammation in the rats. Eur J Pharmacol. 2004;484:341–350. doi:10.1016/j.ejphar.2003.11.011
33. Marzocco S, Di Paola R, Ribecco MT, et al. Effect of methylguanidine in a model of septic shock induced by LPS. Free Radic Res. 2004;38:1143–1153. doi:10.1080/10715760410001725517
34. Deen CPJ, Veen AV, Gomes-Neto AW, et al. Urinary Excretion of N(1)-Methylnicotinamide and N(1)-Methyl-2-Pyridone-5-carboxamide and mortality in kidney transplant recipients. Nutrients. 2020;12:2059. doi:10.3390/nu12072059
35. Urso A, Leiva-Juarez MM, Briganti DF, et al. Aspiration of conjugated bile acids predicts adverse lung transplant outcomes and correlates with airway lipid and cytokine dysregulation. J Heart Lung Transplant. 2021;40:998–1008. doi:10.1016/j.healun.2021.05.007
36. Zhang CYK, Ahmed M, Huszti E, et al. C.-. investigators, Bronchoalveolar bile acid and inflammatory markers to identify high-risk lung transplant recipients with reflux and microaspiration. J Heart Lung Transplant. 2020;39:934–944. doi:10.1016/j.healun.2020.05.006
37. Girlanda R, Cheema AK, Kaur P, et al. Metabolomics of human intestinal transplant rejection. Am J Transplant. 2012;12:S18–26. doi:10.1111/j.1600-6143.2012.04183.x
38. Lin F, Ou Y, Huang CZ, Lin SZ, Ye YB. Metabolomics identifies metabolite biomarkers associated with acute rejection after heart transplantation in rats. Sci Rep. 2017;7:15422. doi:10.1038/s41598-017-15761-3
39. Lee CF, Lo YC, Cheng CH, et al. Preventing allograft rejection by targeting immune metabolism. Cell Rep. 2015;13:760–770. doi:10.1016/j.celrep.2015.09.036
 © 2023 The Author(s). This work is published and licensed by Dove Medical Press Limited. The full terms of this license are available at https://www.dovepress.com/terms.php and incorporate the Creative Commons Attribution - Non Commercial (unported, v3.0) License.
By accessing the work you hereby accept the Terms. Non-commercial uses of the work are permitted without any further permission from Dove Medical Press Limited, provided the work is properly attributed. For permission for commercial use of this work, please see paragraphs 4.2 and 5 of our Terms.
© 2023 The Author(s). This work is published and licensed by Dove Medical Press Limited. The full terms of this license are available at https://www.dovepress.com/terms.php and incorporate the Creative Commons Attribution - Non Commercial (unported, v3.0) License.
By accessing the work you hereby accept the Terms. Non-commercial uses of the work are permitted without any further permission from Dove Medical Press Limited, provided the work is properly attributed. For permission for commercial use of this work, please see paragraphs 4.2 and 5 of our Terms.