")
Back to Journals » Diabetes, Metabolic Syndrome and Obesity » Volume 13
Serum ZAG and Adiponectin Levels Were Closely Related to Obesity and the Metabolically Abnormal Phenotype in Chinese Population
Authors Liu M , Zhang K, Wang L, Yang H, Yan K, Pan H , Zhu H, Gong F
Received 9 April 2020
Accepted for publication 3 August 2020
Published 26 August 2020 Volume 2020:13 Pages 3099—3112
DOI https://doi.org/10.2147/DMSO.S257643
Checked for plagiarism Yes
Review by Single anonymous peer review
Peer reviewer comments 2
Editor who approved publication: Dr Konstantinos Tziomalos
Meijuan Liu, Kun Zhang, Linjie Wang, Hongbo Yang, Kemin Yan, Hui Pan, Huijuan Zhu, Fengying Gong
Key Laboratory of Endocrinology of National Health Commission, Department of Endocrinology, Peking Union Medical College Hospital, Chinese Academy of Medical Science and Peking Union Medical College, Beijing 100730, People’s Republic of China
Correspondence: Fengying Gong; Huijuan Zhu
Key Laboratory of Endocrinology of National Health Commission, Department of Endocrinology, Peking Union Medical College Hospital, Chinese Academy of Medical Science and Peking Union Medical College, 1# Shuaifuyuan, Wangfujing, Beijing 100730, People’s Republic of China
Tel +86 10 69155100
Fax +86 10 69155073
Email [email protected]; [email protected]
Introduction: To explore serum zinc-α 2-glycoprotein (ZAG) and adiponectin in metabolically healthy non-obese (MHNO), metabolically healthy obesity (MHO), metabolically abnormal obesity (MAO) and metabolically abnormal diabetic obese (MADO) subjects and the relationship with metabolically phenotypes of obesity.
Methods: Two hundred twenty-five subjects including 32 with MHNO, 40 with MHO, 104 with MAO and 49 with MADO were enrolled. Baseline clinical data and biochemical variables were collected. Serum ZAG and adiponectin levels were measured by enzyme-linked immunosorbent assay (ELISA) kits. Metabolically healthy (< 3 metabolic abnormalities) or abnormal (≥ 3 metabolic abnormalities) subjects were classified based on the National Cholesterol Education Program–Adult Treatment Panel III (NCEP/ATP III) criteria. Obesity (body mass index ≥ 28 kg/m2) was recommended by China Obesity Task Force.
Results: Serum ZAG levels were higher in the MHO group, but were progressively lower in MAO and MADO groups (P all< 0.05). In all subjects, total cholesterol, 2-hour postprandial blood glucose and homeostasis model assessment of adiponectin were independent variables to serum ZAG levels. Compared with subjects in the highest tertile of ZAG, the odds ratio (OR) of metabolically abnormal risks of subjects in the lowest and median tertiles of ZAG were higher both in a univariate and three adjustment models (P all< 0.05). Serum ZAG could discriminate the metabolically abnormal phenotype with receiver operating characteristic (ROC) curve area of 0.622 (95% CI, 0.539– 0.706, P< 0.05). Combination of ZAG and adiponectin had improved diagnosis value accuracy, with ROC curve area of 0.703 (95% CI, 0.629– 0.776, P< 0.05), and 62.7% sensitivity and 73.6% specificity.
Conclusion: Serum ZAG levels were higher in MHO subjects, but lower in MAO and MADO subjects. The decreased serum ZAG levels were closely related to the metabolically abnormal phenotype of obese patients. Serum ZAG, especially the combination with adiponectin might be the potential diagnostic biomarkers for metabolically abnormal obese patients.
Keywords: zinc-α 2-glycoprotein, ZAG, metabolically healthy non-obese, MHNO, metabolically healthy obese, MHO, metabolically abnormal obese, MAO, metabolically abnormal diabetic obese, MADO
Introduction
Obesity has been well known as a severe global health threat. As estimated by reports, the number of obese people has grown more than doubled in the past 30 years.1,2 Although obesity is traditionally accompanied by metabolic comorbidities, such as type 2 diabetes mellitus (T2DM), dyslipidemia, hypertension, which eventually leads to greater cardiovascular and all-cause mortality rates and shorter life expectancy,3,4 increasing literatures show that some obese people present with a relatively metabolic healthy profile and have been named as the metabolically healthy obesity (MHO). The MHO phenotype was firstly described by Andres et al in the 1980’s5 and now accounted for up to 18–44% of the total obese people.6 Previously studies have shown that after a follow-up of 7–15 years or even 30 years, the cardiovascular events, cancer risks and all-cause mortality rates were significantly lower in MHO than that in metabolically abnormal obesity (MAO) subjects.7–11 Notably, MHO is dynamic instead of static, according to the data reported by the prospective North West Adelaide Health Study, after 5.5 to 10.3 years of follow-up, nearly a third of MHO people at baseline transformed to the MAO phenotype.12 Therefore, it is essential to elucidate the mechanisms that could explain the progression from MHO to MAO. Additionally, to identify new biomarkers that may help to discriminate MHO and MAO subjects have great clinical significance.
In recent years, adipose tissue is increasingly being well documented as a functional endocrine organ capable of producing several adipokines, including adiponectin, leptin, tumor necrosis factor alpha, resistin, etc.13 A large number of studies have demonstrated that the disturbance of these adipokines could contribute to systemic metabolic perturbations, including hypertension, hyperlipidemia, T2DM and cardiovascular disease, and thus exert important roles in determining the metabolic status of obesity.14,15 For instance, Ahl et al studied in a total of 2486 Westerners found that serum adiponectin levels were markedly higher in metabolically healthy individuals than that in metabolically unhealthy individuals, and adiponectin might exert a key role in differentiating the metabolically healthy vs unhealthy subjects independent of obesity.16 Consequently, though the underlying mechanisms that could explain the progression from MHO to MAO are largely unknown, the dysregulated adipokines might be one of the key factors, and the measurements of serum adipokine levels might be helpful for evaluating the subclinical metabolic abnormalities.
Zinc-α2-glycoprotein (ZAG) is a new adipokine which was found to be expressed in mouse and human adipose tissues17–19 and secreted by human adipocytes.20 Previously animal studies have demonstrated that ZAG over-expression ob/ob and high fat diet induced obese mice showed marked reductions in body weight and in body fat mass,18,19,21 while ZAG deficient mice exhibited more body weight on both standard and high fat dietary regimens.22 In human subjects, serum ZAG was pathologically decreased in overweight/obese subjects, and was negatively related to body weight, body mass index (BMI), waist circumstance (WC) and fat mass.18 More importantly, recently mounting evidence has revealed the pivotal role of ZAG in metabolic diseases, including T2DM,23 hypertension24 and metabolic syndrome (MetS).25 However, up to now, there is no report to investigate serum ZAG levels in obese adults with different metabolism status.
In light of the above, the purpose of our study was to explore the changes of serum ZAG levels in obese adults with different status of metabolism, including MHO, MAO and metabolically abnormal diabetic obese (MADO) subjects. In addition, the ability of serum ZAG levels to identify subjects with different metabolically phenotypes were also assessed.
Subjects and Methods
Subjects and Study Design
The present study included 193 obese subjects (BMI ≥28 kg/m2) and 32 metabolically healthy non-obese (MHNO) controls (BMI<24 kg/m2) collected from the Peking Union Medical College Hospital (PUMCH). All the enrolled participants met the following desired criteria: (1) the body weight was stable in the past 3 months before the test; (2) subjects did not take part in an overloaded exercise program in the past 3 months before the test; (3) subjects with type 1 diabetes mellitus or its associated acute complications, secondary obesity, infectious diseases or the active stage of autoimmune disease were excluded; (4) subjects were not pregnant, breastfeeding or taking oral contraceptives. Metabolically healthy was defined as having no more than two metabolic abnormalities among the five metabolic components based on the National Cholesterol Education Program–Adult Treatment Panel III (NCEP/ATP III) criteria:26 (1) WC ≥88 cm for females and ≥102 cm for males; (2) systolic blood pressure (SBP) ≥130 mmHg and/or diastolic blood pressure (DBP) ≥85 mmHg or on antihypertensive treatment; (3) fasting blood glucose (FBG) ≥100 mg/dL or on antidiabetic treatment; (4) triglyceride (TG) concentrations ≥150 mg/dL; (5) high-density lipoprotein cholesterol (HDL-C) <50 mg/dL for females and <40 mg/dL for males or on lipid-lowering treatment. Afterward, all the obese participants were further divided into three groups: MHO group was defined as subjects with BMI ≥28 kg/m2 and <3 metabolic abnormalities (n=40); MAO group was defined as subjects with BMI ≥28 kg/m2 and ≥3 metabolic abnormalities (n=104); MADO group was defined as subjects with BMI ≥28 kg/m2 and ≥3 metabolic abnormalities and newly diagnosed T2DM which based on the American Diabetes Association (ADA) criteria27 (n=49). This study was conducted in accordance with the Declaration of Helsinki. This study protocol was approved by the PUMCH ethics committee (No. S-364) and the informed written consent was signed by all subjects before participating in the study.
Anthropometric Measurements
Anthropometric measurements were performed in all subjects with light clothing and no shoes. Height was measured three times by using a stadiometer with the measurement error no more than 0.1 cm. Weight was measured on vertical personnel weighing scale, with a minimum measurement sensitivity of 0.1 kg. BMI was calculated with an equation that dividing weight in kilograms by height in meters squared. WC was recorded by taking a cloth measuring tape and running it around the midpoint of the lower ribs and iliac crest after a normal exhalation.28 Blood pressure was measured twice with subjects seated after at least 5 min of rest by using mercury sphygmomanometer, the mean value of the two measurements was recorded.
Blood Samples Collection and Laboratory Examinations
All participants received a 2 h oral glucose tolerance test (OGTT) with 75 g of oral glucose after 10 h overnight fast. Vein blood samples were taken every 30 min after glucose loading. FBG concentration, 2-hour postprandial blood glucose (2hPG), 0 min, 120 min plasma glucose of OGTT, fasting plasma insulin concentrations (FINS), free fatty acid (FFA) serum lipid levels [total cholesterol (TC), TG, HDL-C, low-density lipoprotein cholesterol (LDL-C)], liver function [aspartate aminotransferase (AST), alanine aminotransferase (ALT)] as well as kidney function [creatinine (Cr), uricemia (Urea)] were measured by conventional automated laboratory methods in the clinical laboratory of PUMCH.
Serum Adipokines Measurements
Serum ZAG and adiponectin concentrations were measured following the instructions of the human enzyme-linked immunosorbent assay (ELISA) kits (USCN Life Science Inc., Wuhan, China). The low limits of detection for ZAG and adiponectin were 1.80 ng/mL and 0.069 ng/mL, respectively. The intra- and inter-assay CVs were 5.04% and 8.20% for ZAG, 4.39% and 8.26% for adiponectin.
Insulin Resistance Assessment
The homeostasis model assessment of insulin resistance (HOMA-IR) was calculated as follows: HOMA-IR=FBG (mmol/L) x FINS (mU/L)/22.5.29 The homeostasis model assessment of adiponectin (HOMA-AD) index was determined by using the following equation: HOMA-AD=FBG (mmol/L) x FINS (mU/L)/[22.5 x adiponectin (μg/mL)].30 The adipose tissue insulin resistance (Adipo-IR) was determined by using the equation as previously reported: Adipo-IR= FINS (pmol/L) × FFA (mmol/L).31 The quantitative insulin check index (QUICKI) was calculated as follows: QUICKI= 1/[log FBG (mg/dL) + log FINS (μU/mL) + log FFA (mmol/L)].32
Statistical Analysis
Data were shown as mean ± standard deviation (SD) or median with interquartile range, as appropriate. The normality of all the data were explored by using Shapiro–Wilk normality test and the skewed distributions were natural logarithm (ln) transformed before analysis. One-way ANOVA and Dunnett’s T3 post hoc test were used for the comparison of continuous parameters in different groups. Bivariate correlation analysis was performed to explore the linear relationship between serum ZAG, adiponectin and other variables. The stepwise multiple linear regression analysis was applied to analyze the independent variables that are affecting serum ZAG and adiponectin levels. Logistic regression analysis was employed to test the odds ratio (OR) and 95% confidence intervals (CI) of serum ZAG and adiponectin for metabolically abnormal risks. All participants were divided into tertiles based on the serum ZAG and adiponectin levels and ORs and 95% CIs were calculated for the lower two categories with the highest one as a reference. We adjusted for age, gender and BMI in Model 1, and further adjusted for SBP, DBP, FBG, FINS, TC, TG, HDL-C, LDL-C and FFA in Model 2, with further adjustment for Cr and UA in Model 3 to exam the association between serum ZAG and adiponectin levels and metabolically abnormal risks. The receiver operating characteristic curve (ROC) analysis was used to explore the capability of ZAG and adiponectin to differentiate metabolically abnormal subjects from controls. The statistical analysis was conducted by SPSS 20.0 for Windows (SPSS Inc, Chicago, IL, USA) and the data graphing was done by using GraphPad Prism 7.0 (GraphPad software Inc., La Jolla, CA, USA). Statistical significance was considered when P<0.05.
Results
General Characteristics of All the Study Participants
The main clinical, anthropometric and biochemical parameters of all the study participants were presented in Table 1. As expected, obese subjects (MHO, MAO, MADO) had significantly higher BMI, WC, SBP, DBP, TG, UA, FINS, 2hPBG, OGTT 120 min PG, HOMA-IR, Adipo-IR, HOMA-AD, but lower HDL-C and QUICKI when compared with subjects in MHNO group (P all <0.05). WC, TG, UA, FBG, 2hPBG, OGTT 0 min PG, OGTT 120 min PG, HOMA-AD were higher, but HDL-C levels were lower in MAO and MADO groups than those in MHO group (P all <0.05). Compared with subjects in MAO group, FFA, FBG, 2hPBG, OGTT 0min PG, OGTT 120 min PG, HOMA-IR, Adipo-IR, HOMA-AD were notably higher, but QUICKI was lower in subjects in MADO group (P all <0.05).
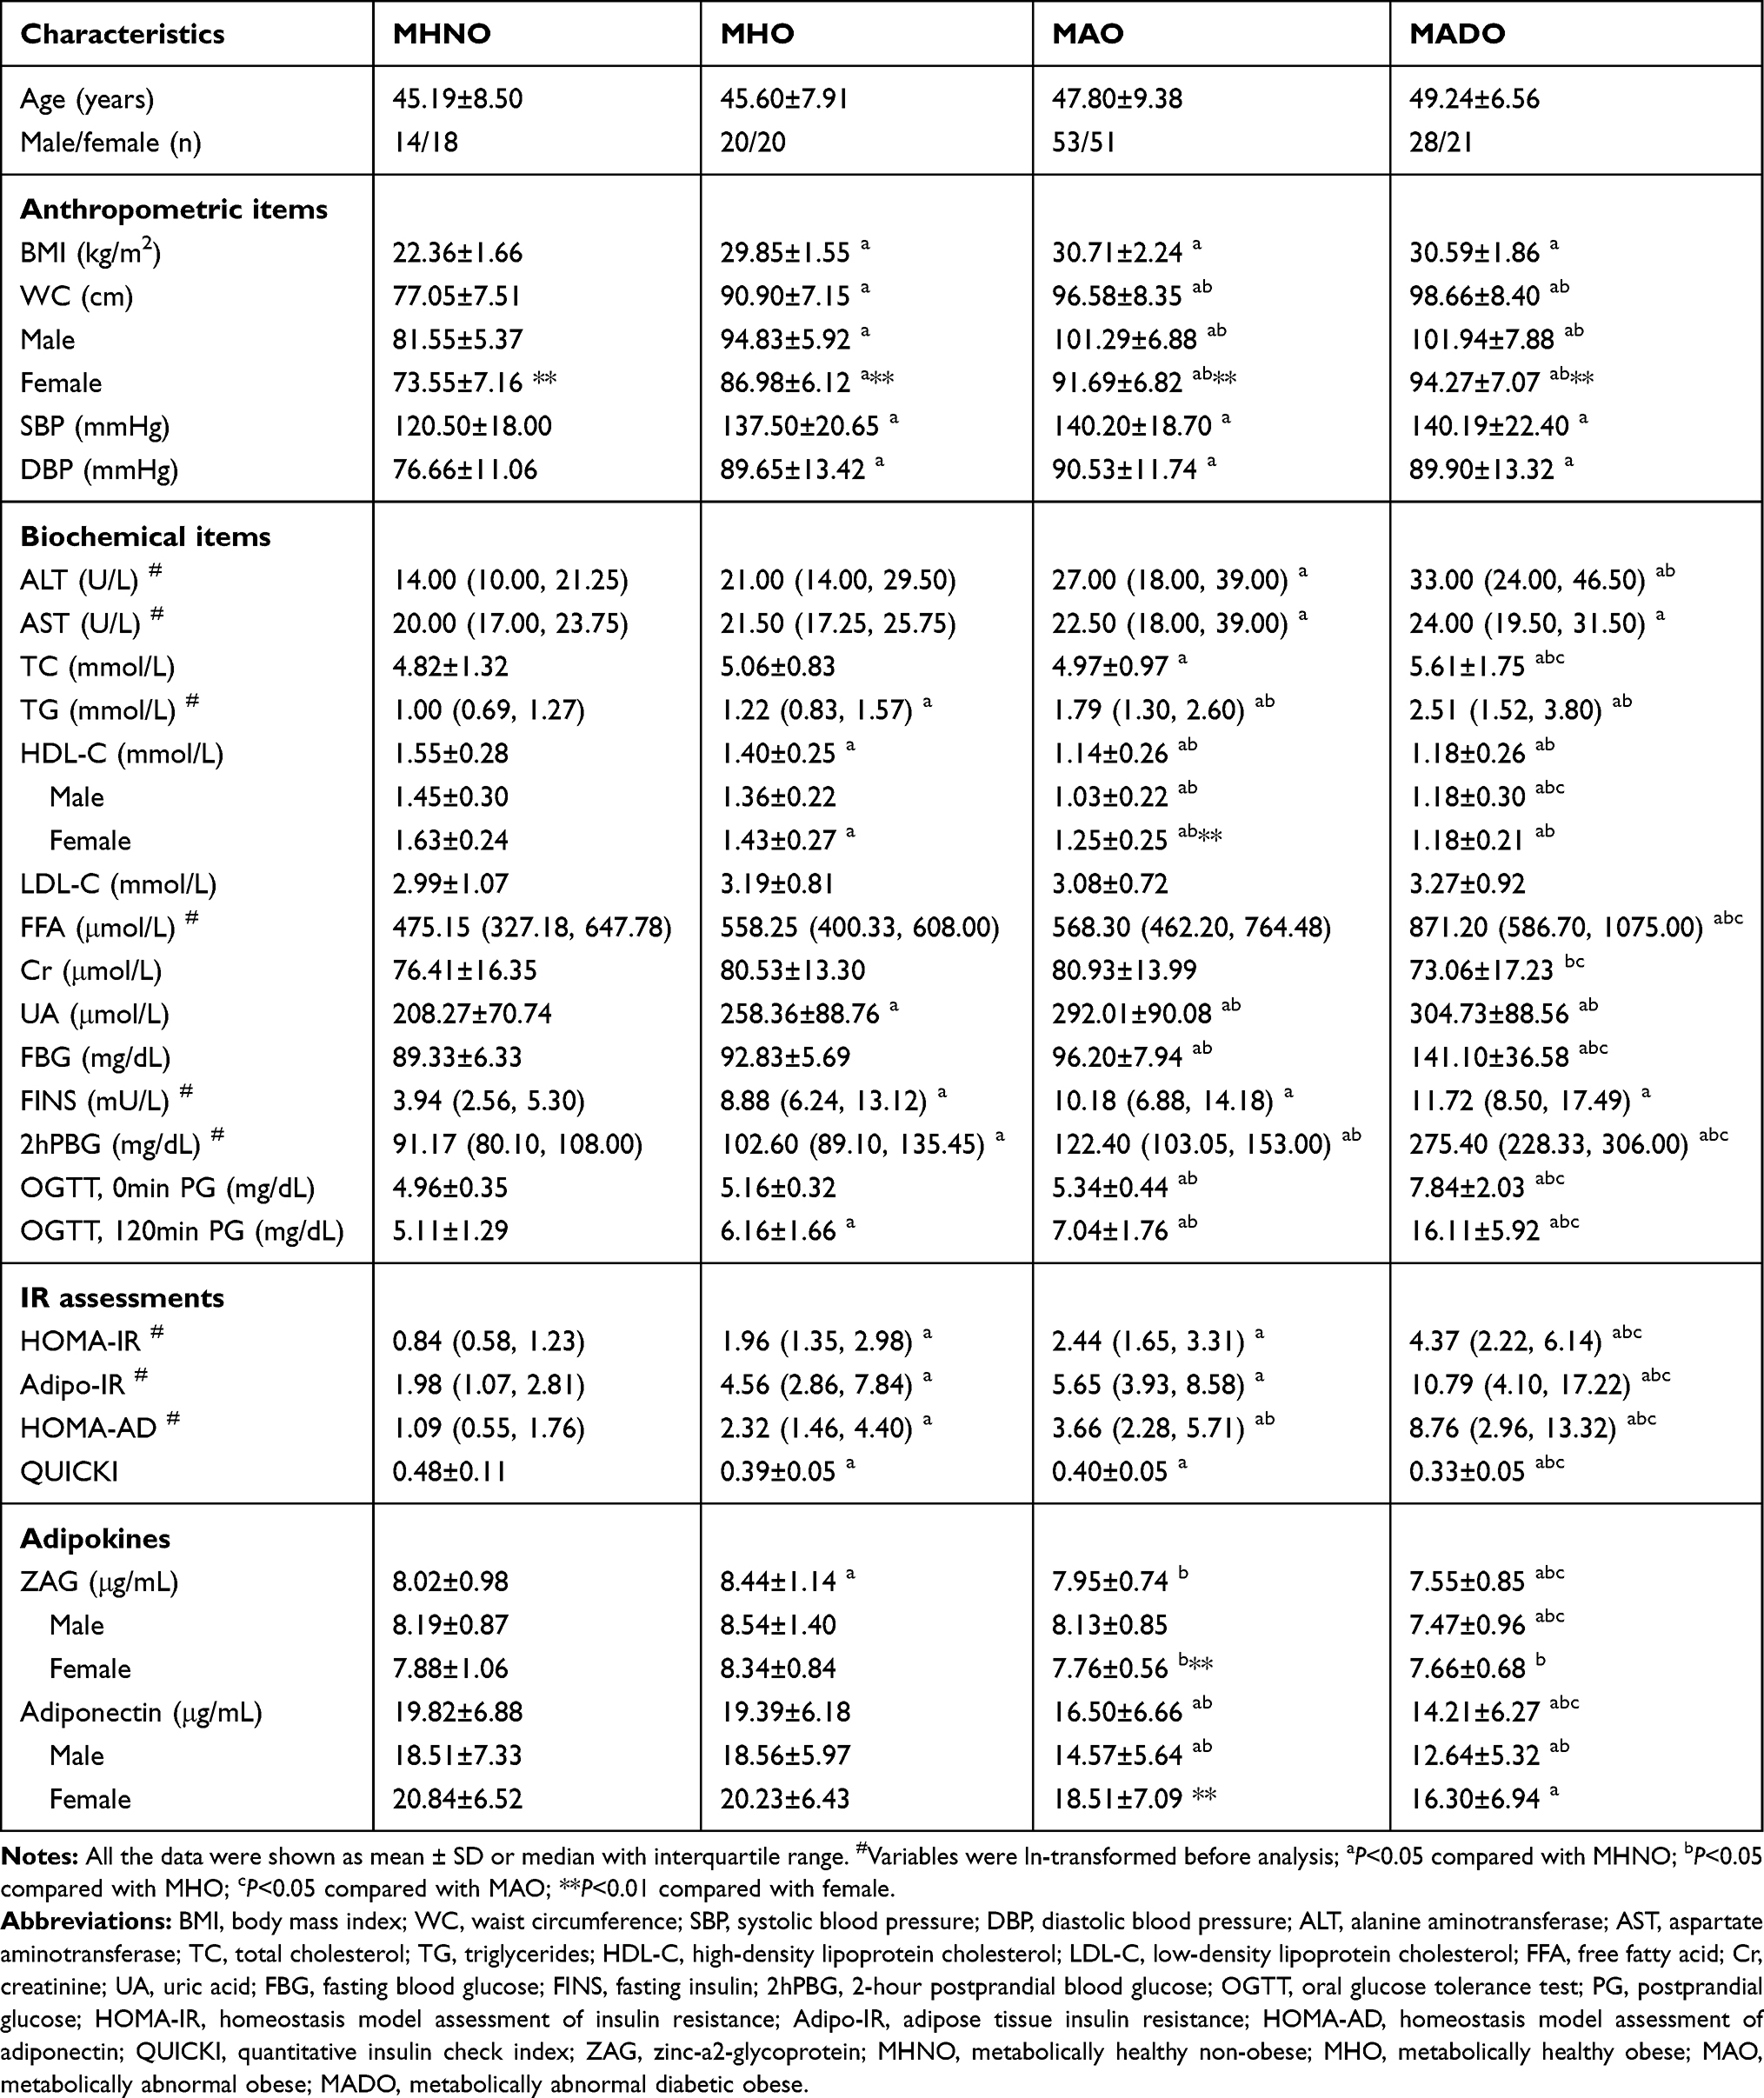 |
Table 1 Demographics and Clinical Characteristics of MHNO, MHO, MAO and MADO Subjects |
Serum ZAG and Adiponectin Levels in All the Study Participants
As displayed in Table 1 and Figure 1A, serum ZAG levels were higher in the MHO group when compared with the MHNO group (8.44±1.14 μg/mL vs 8.02±0.98 μg/mL, P<0.05). As the severity of metabolic abnormalities increased, serum ZAG levels decreased gradually from the MAO group to the MADO group, and ZAG levels were the lowest in MADO group (7.95±0.74 μg/mL and 7.55±0.85 μg/mL vs 8.44±1.14 μg/mL, P<0.05). After further analysis of serum ZAG levels in males and females, respectively, the above similar change trends of ZAG levels in the four groups still existed. However, statistical differences were only found between the MADO group and the MHNO, MHO, MAO groups for males (7.47±0.96 μg/mL vs 8.19±0.87 μg/mL, 8.54±1.40 μg/mL and 8.13±0.85 μg/mL, P all <0.05) (Figure 1B), and between the MHO group and the MAO and MADO groups for females (8.34±0.84 μg/mL vs 7.76±0.56 μg/mL and 7.66±0.68 μg/mL, P all <0.05) (Figure 1C). Additionally, serum ZAG levels in males of the MAO group were higher than that in females as demonstrated in Table 1 (8.13±0.85 μg/mL vs 7.76±0.56 μg/mL, P <0.05).
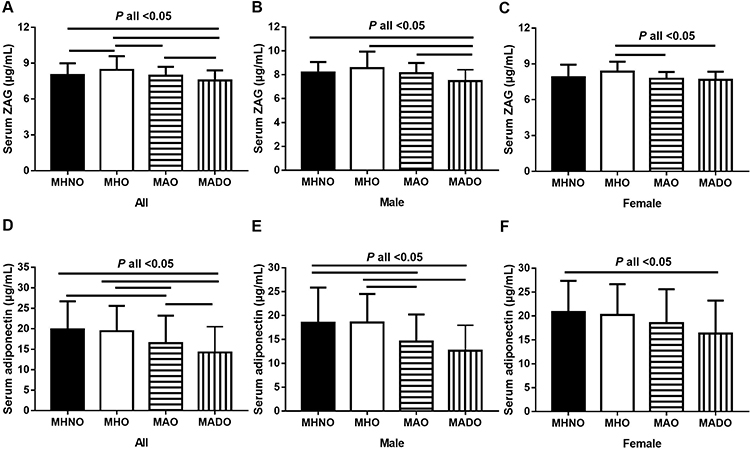 |
Figure 1 Serum ZAG/adiponectin levels in MHNO, MHO, MAO and MADO groups. (A) Serum ZAG levels of all subjects in the 4 groups (n=225). (B) Serum ZAG levels of males in the 4 groups (n=115). (C) Serum ZAG levels of females in the 4 groups (n=110). (D) Serum adiponectin levels of all subjects in the 4 groups (n=225). (E) Serum adiponectin levels of males in the 4 groups (n=115). (F) Serum adiponectin levels of females in the 4 groups (n=110). All values were expressed as the mean ± SD. Abbreviations: ZAG, zinc-α2-glycoprotein; MHNO, metabolically healthy non-obese; MHO, metabolically healthy obese; MAO, metabolically abnormal obese; MADO, metabolically abnormal diabetic obese. |
Inconsistent with the variation trend of serum ZAG in four groups, serum adiponectin levels were the highest in the MHNO group, then gradually decreased with the occurrence of the obesity and the severity of metabolic abnormalities increasing, although the significant differences were not found in the comparison of MHNO and MHO groups (19.82±6.88 μg/mL vs 19.39±6.18 μg/mL, P>0.05) as present in Table 1 and Figure 1D. When compared with the MHNO group, serum adiponectin levels in the MAO and MADO groups were notably decreased by 16.75% and 28.30%, respectively (16.50±6.66 μg/mL and 14.21±6.27 μg/mL vs 19.82±6.88 μg/mL, P all<0.05). When compared with the MHO group, serum adiponectin levels in the MAO and MADO groups were notably decreased by 14.90% and 26.71%, respectively (16.50±6.66 μg/mL and 14.21±6.27 μg/mL vs 19.39±6.18 μg/mL, P all<0.05). Additionally, serum adiponectin levels in the MADO group were further lower than that in the MAO group (14.21±6.27 μg/mL vs 16.50±6.66 μg/mL, P<0.05) (Figure 1D). After further analysis of serum adiponectin levels in males and females, respectively, the above similar variation change trends in the four groups were still existed in females, which showing the gradually decreased levels from the MHNO group to the MHO, MAO and MADO groups although the significant decrease was only found in the MADO group in comparison with the MHNO group (16.30±6.94 μg/mL vs 20.84±6.52 μg/mL, P<0.05) (Figure 1F). Males in both the MAO and MADO groups had significantly lower serum adiponectin levels than those in the MHNO (14.57±5.64 μg/mL and 12.64±5.32 μg/mL vs 18.51±7.33 μg/mL, respectively, both P<0.05) and MHO groups (14.57±5.64 μg/mL and 12.64±5.32 μg/mL vs 18.56±5.97 μg/mL, respectively, both P <0.05) (Figure 1E). Further inconsistent with the variation trend of serum ZAG in the MAO group, serum adiponectin levels in females were found to be higher than that in males as shown in Table 1 (18.51±7.09 μg/mL vs 14.57±5.64 μg/mL, P<0.05).
Associations Between Serum ZAG, Adiponectin and Anthropometric, Biochemical Items and Insulin Resistance Indexes in All the Study Participants
To explore correlation between serum ZAG levels and various clinical variables, the simple bivariate correlation analysis was performed. As presented in Table 2, in all participants, serum ZAG levels were negatively associated with FBG (r=−0.206), 2hPBG (r=−0.209), OGTT 0 min PG (r=−0.206), OGTT 120 min PG (r=−0.209), HOMA-IR (r=−0.172) and HOMA-AD (r=−0.191) (P all <0.01). In MHNO group, serum ZAG levels were positively correlated with TC (r=0.447) (P<0.01). In MAO group, serum ZAG levels were positively correlated with TG (r=0.342) but negatively correlated with gender (r=−0.255) (P all <0.01). In MADO group, serum ZAG levels were negatively correlated with WC (r=−0.321) (P<0.01) (Table 2).
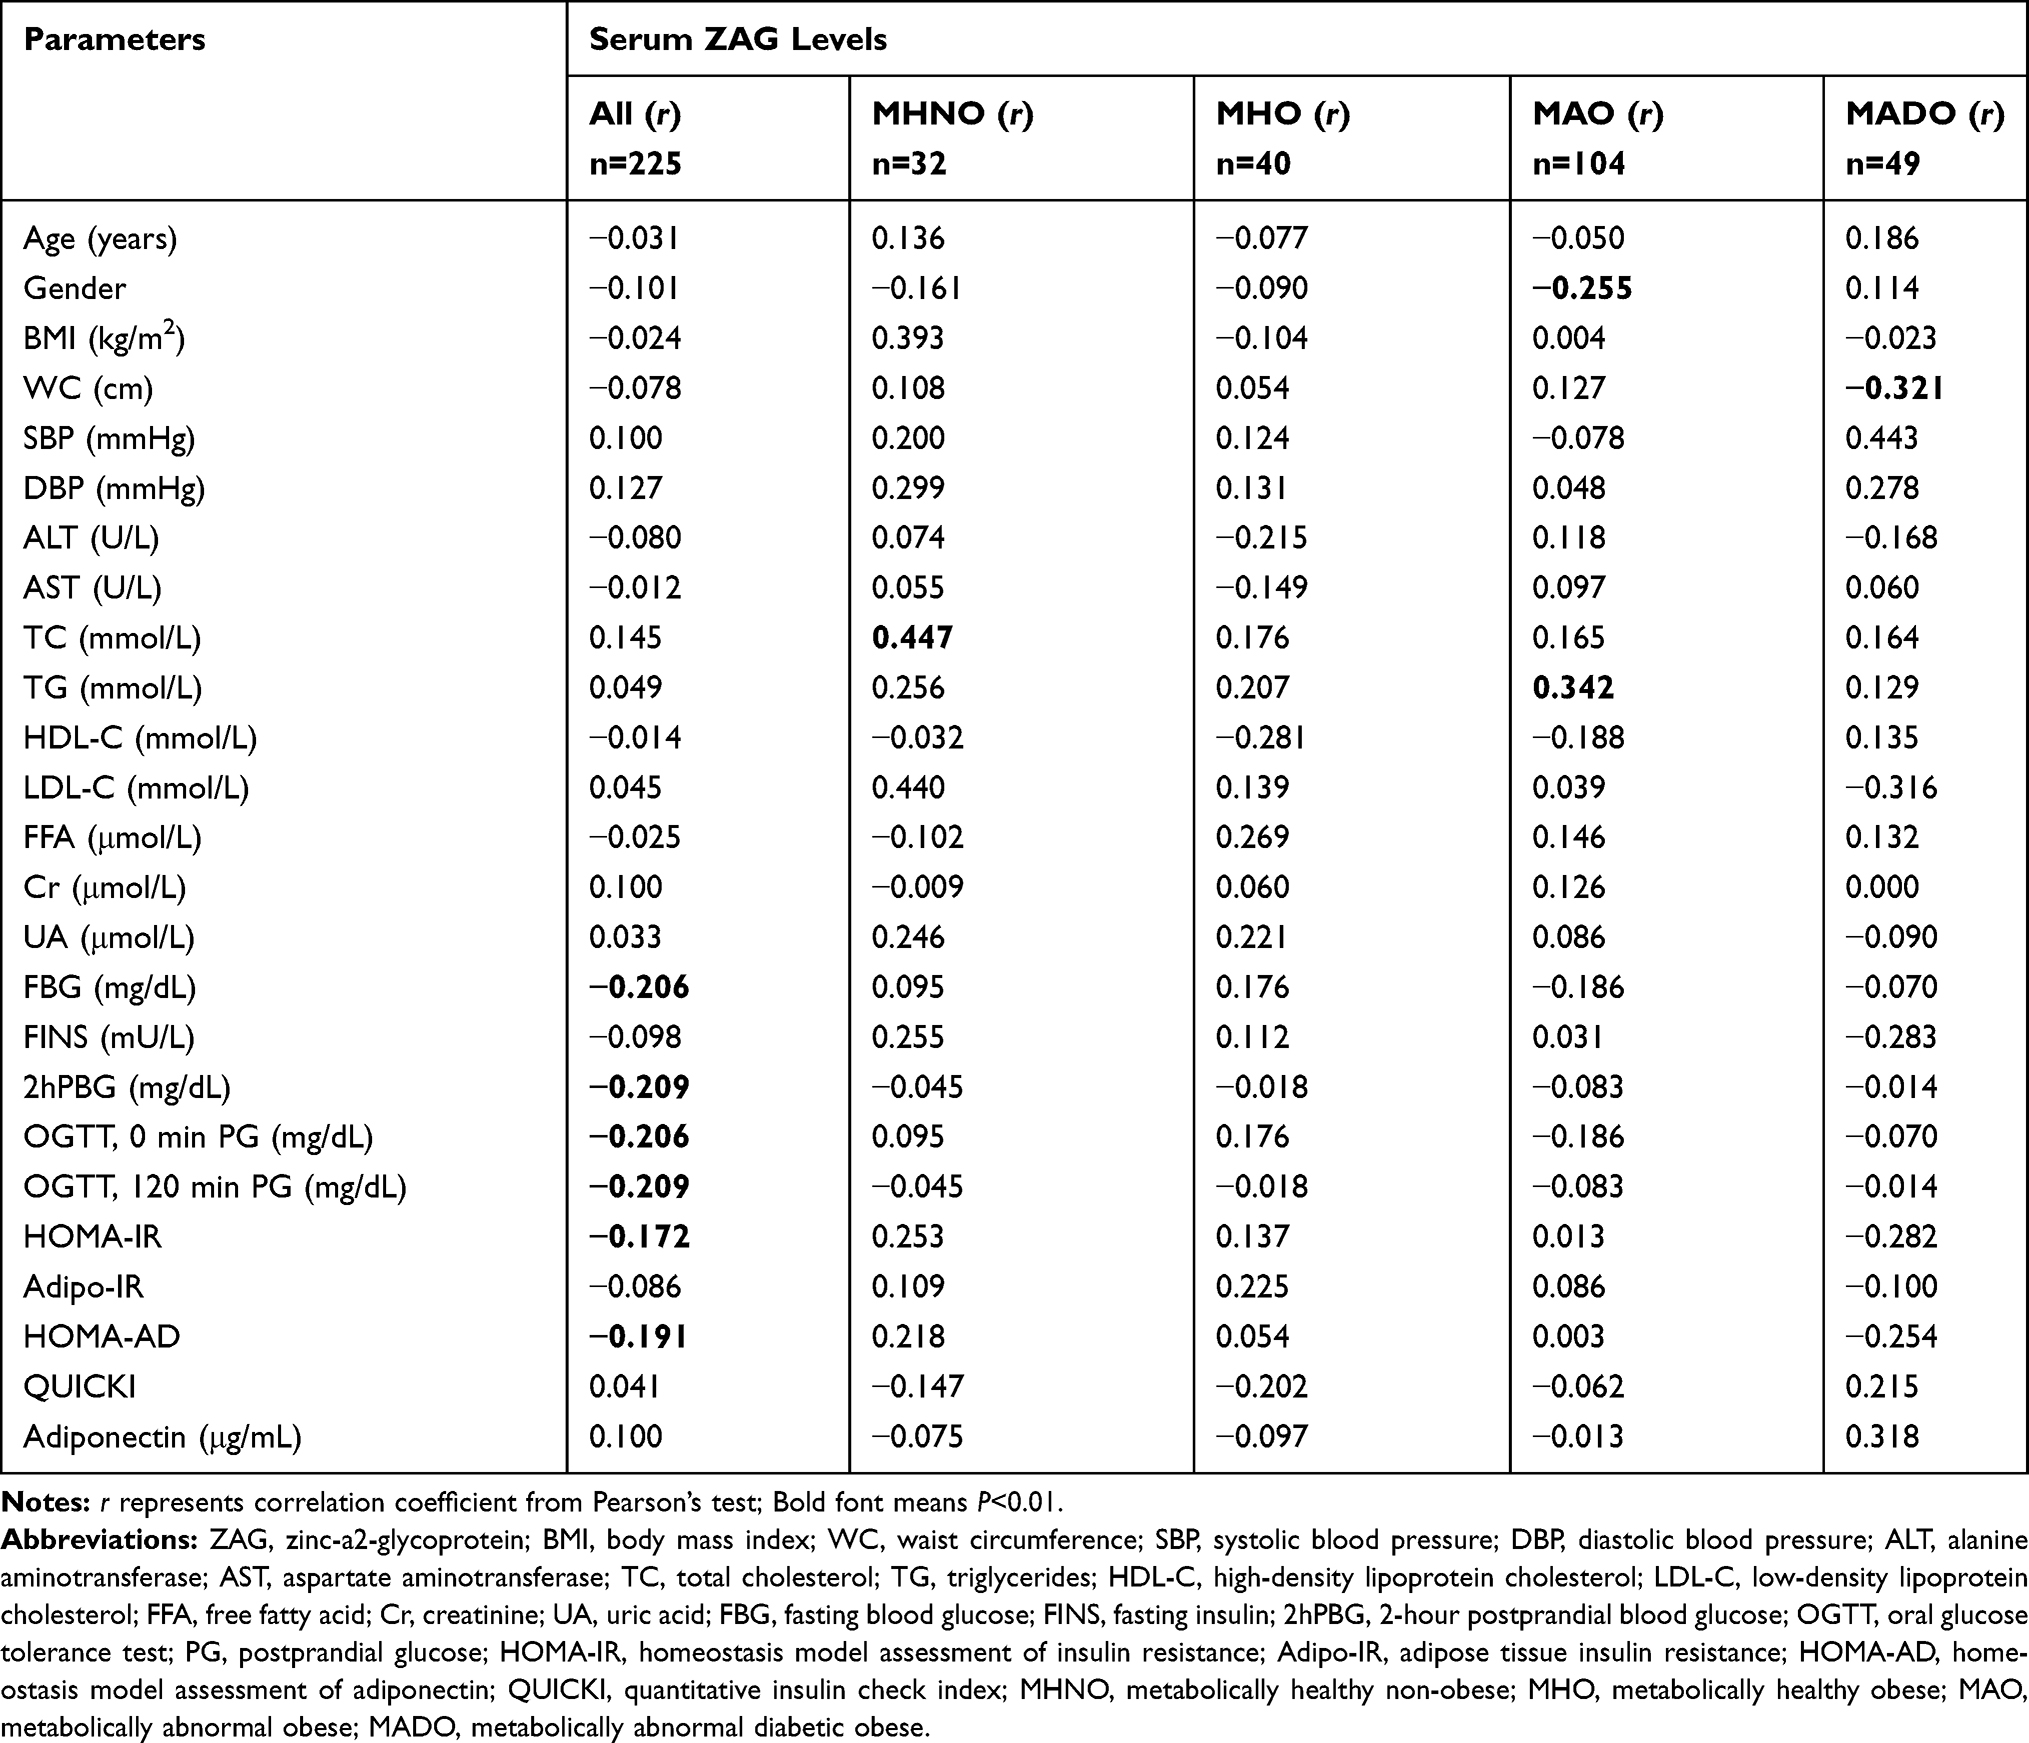 |
Table 2 Correlation Analysis of Parameters Associated with Serum ZAG Levels in Study Population |
The simple correlation between serum adiponectin levels and various clinical variables were also explored. As presented in Table 3, in all participants, serum adiponectin levels were positively correlated with age (r=0.179), gender (r=0.259), HDL-C (r=0.270) and QUICKI (r=0.375), but negatively correlated with BMI (r=−0.233), WC (r=−0.317), DBP (r=−0.221), ALT (r=−0.250), TG (r=−0.224), FFA (r=−0.286), UA (r=−0.314), FINS (r=−0.347), HOMA-IR (r=−0.351) and HOMA-AD (r=−0.558) (P all <0.01). In MHNO group, serum adiponectin levels were negatively correlated with HOMA-AD (r=−0.653) (P<0.01). In MHO group, serum adiponectin levels negatively correlated with WC (r=−0.444) and HOMA-AD (r=−0.671) (P all <0.01). In MAO group, serum adiponectin levels were positively correlated with gender (r=0.297) and QUICKI (r=0.404), but negatively correlated with DBP (r=−0.273), UA (r=−0.261), FINS (r=−0.266), Adipo-IR (r=−0.300) and HOMA-AD (r=−0.630) (P all <0.01). In MADO group, serum adiponectin levels were positively correlated with age (r=0.489) and QUICKI (r=0.410), but negatively correlated with FINS (r=−0.399), HOMA-IR (r=−0.383) and HOMA-AD (r=−0.576) (P all <0.01) (Table 3).
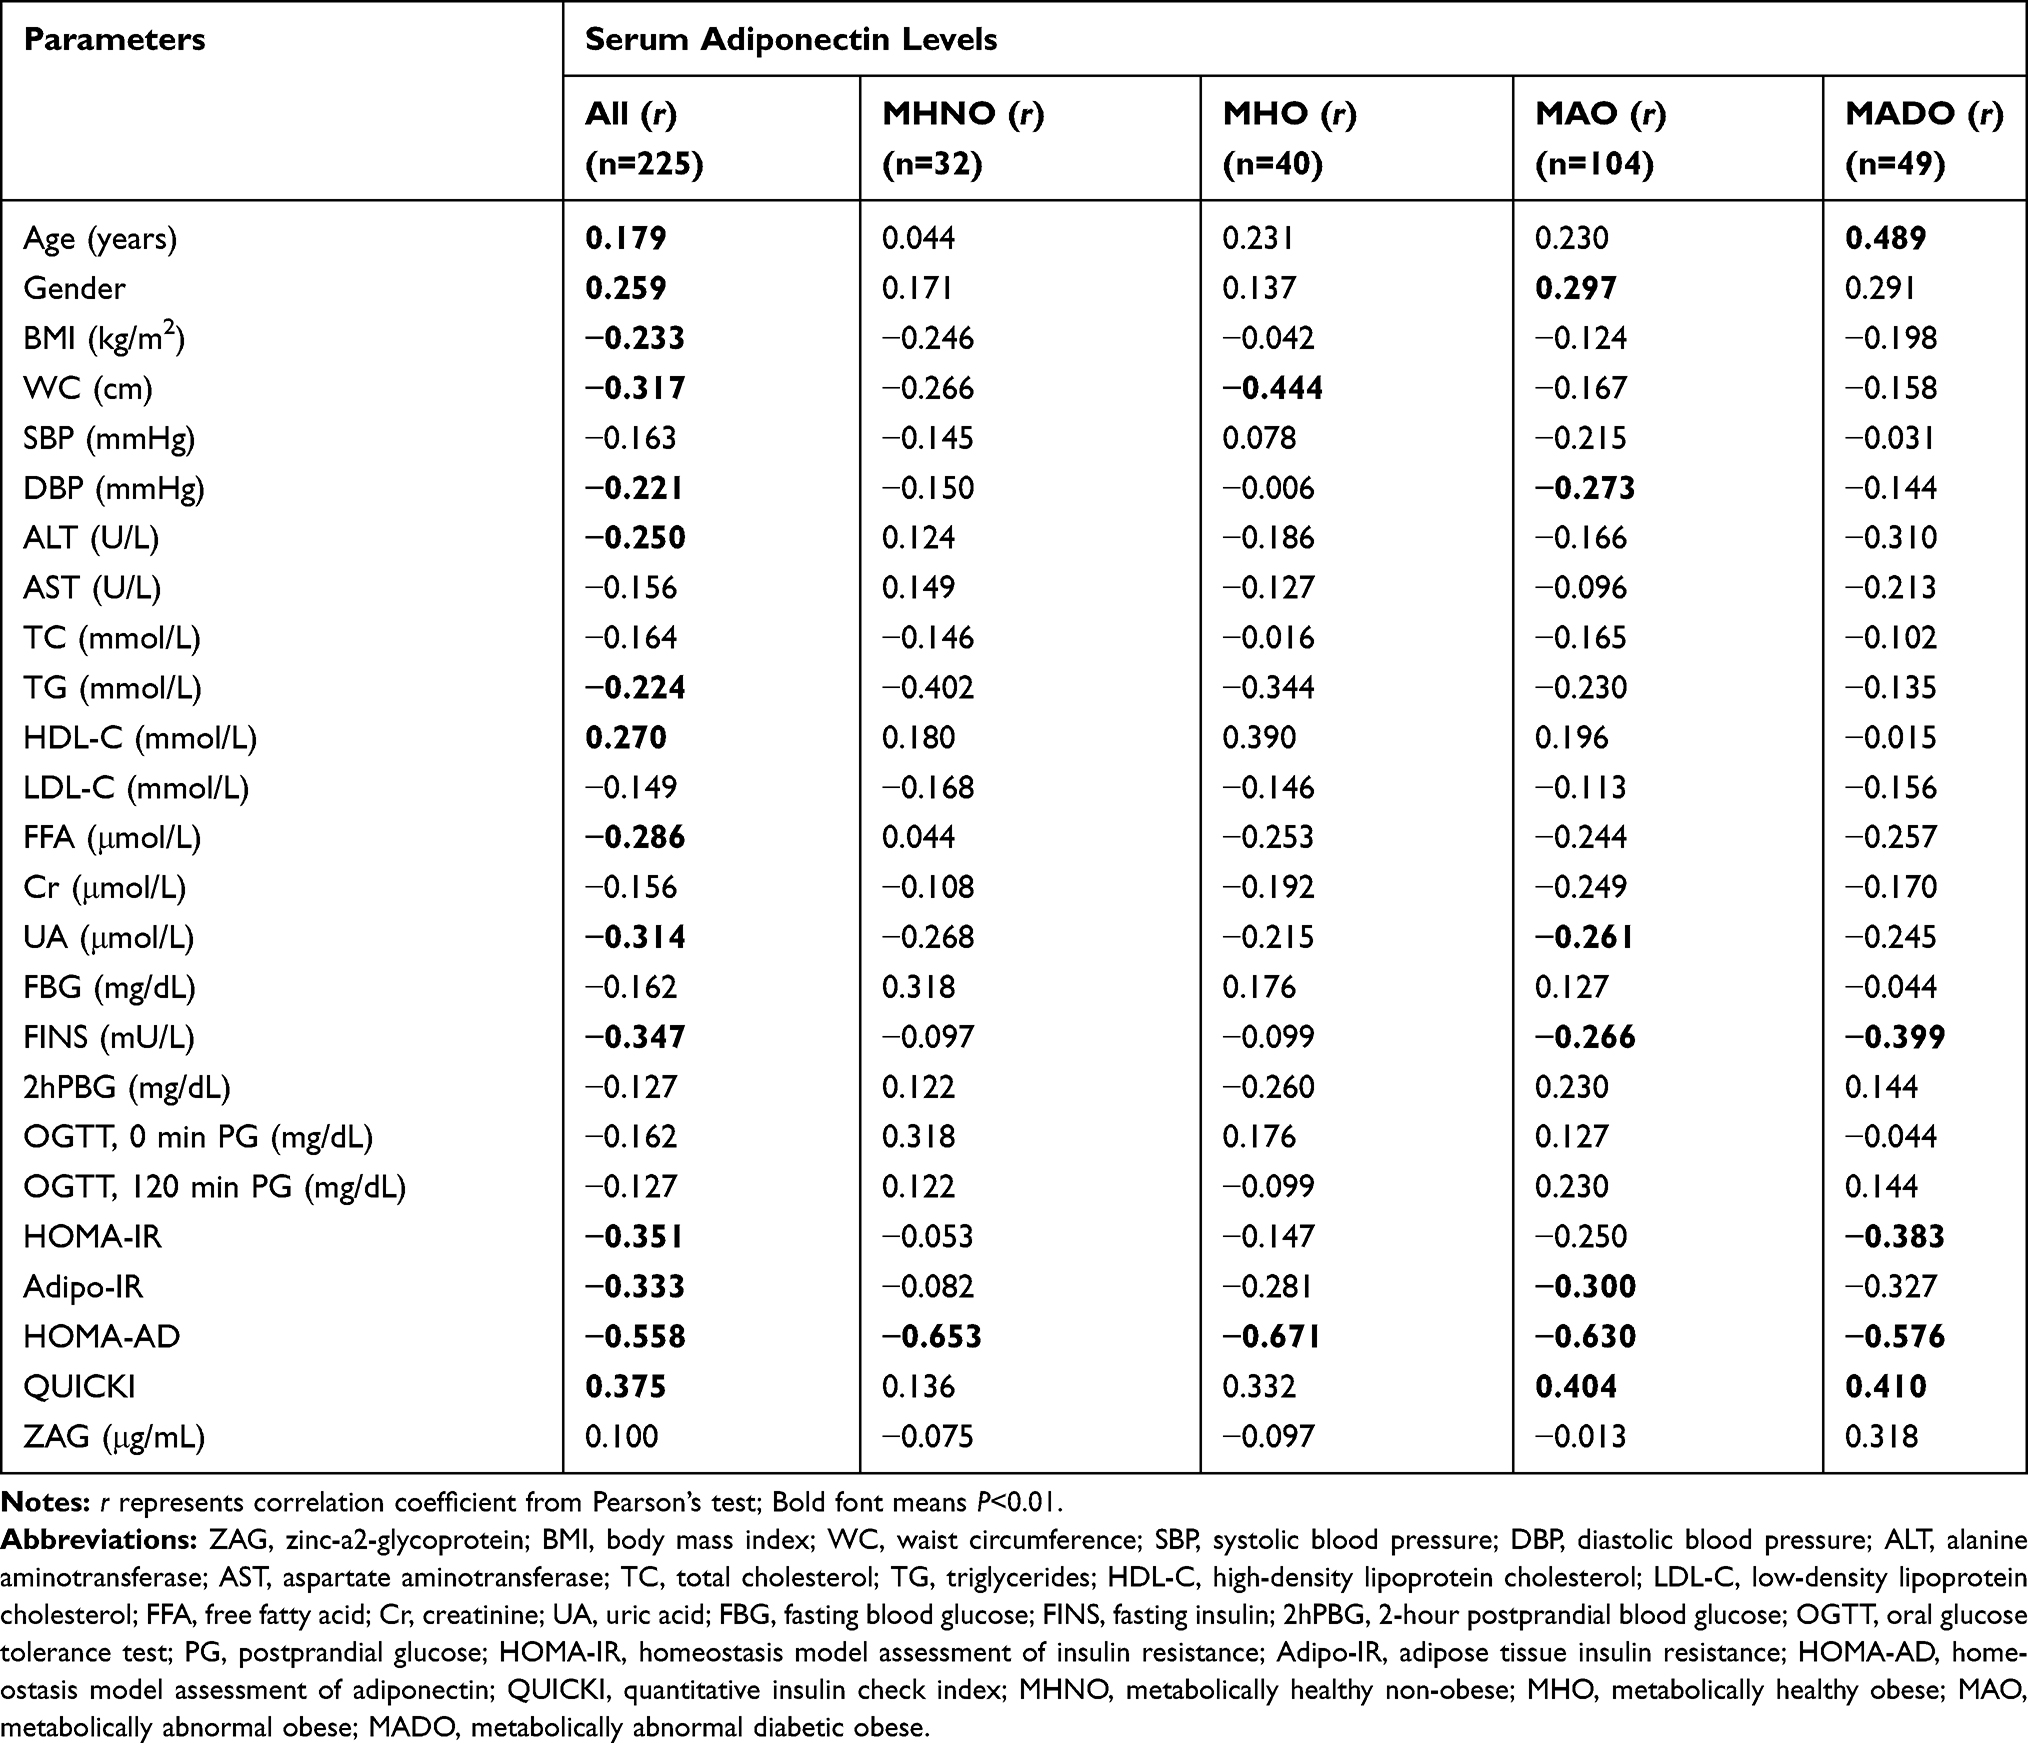 |
Table 3 Correlation Analysis of Parameters Associated with Serum Adiponectin Levels in Study Population |
Stepwise Multiple Linear Regression Analysis with Serum ZAG/Adiponectin as the Dependent Variable in All the Study Participants
In order to further explore the independent factors for serum ZAG or adiponectin levels, the stepwise multiple linear regression analysis was used. As presented in Table 4, when ZAG was considered as the dependent variable in a multiple linear regression analysis with age, gender, BMI, WC, SBP, DBP, TC, TG, HDL-C, LDL-C, ALT, AST, FBG, 2hPBG, FFA, Cr, UA, FINS, OGTT 0 min, OGTT 120 min, HOMA-IR, Adipo-IR, QUICKI and adiponectin as independent variables, TC (β=0.223, P=0.001), 2h PBG (β=−0.201, P=0.005) and HOMA-AD (β=−0.155, P=0.027) maintained independent associations with serum ZAG levels. When adiponectin was considered as the dependent variable in a linear multiple regression analysis, age (β=0.094, P=0.042), DBP (β=−0.115, P=0.015), UA (β=−0.127, P=0.011), HOMA-IR (β=1.119, P<0.001), HOMA-AD (β=−1.375, P<0.001) and QUICKI (β=0.242, P<0.001) were independently related to serum adiponectin levels (Table 4).
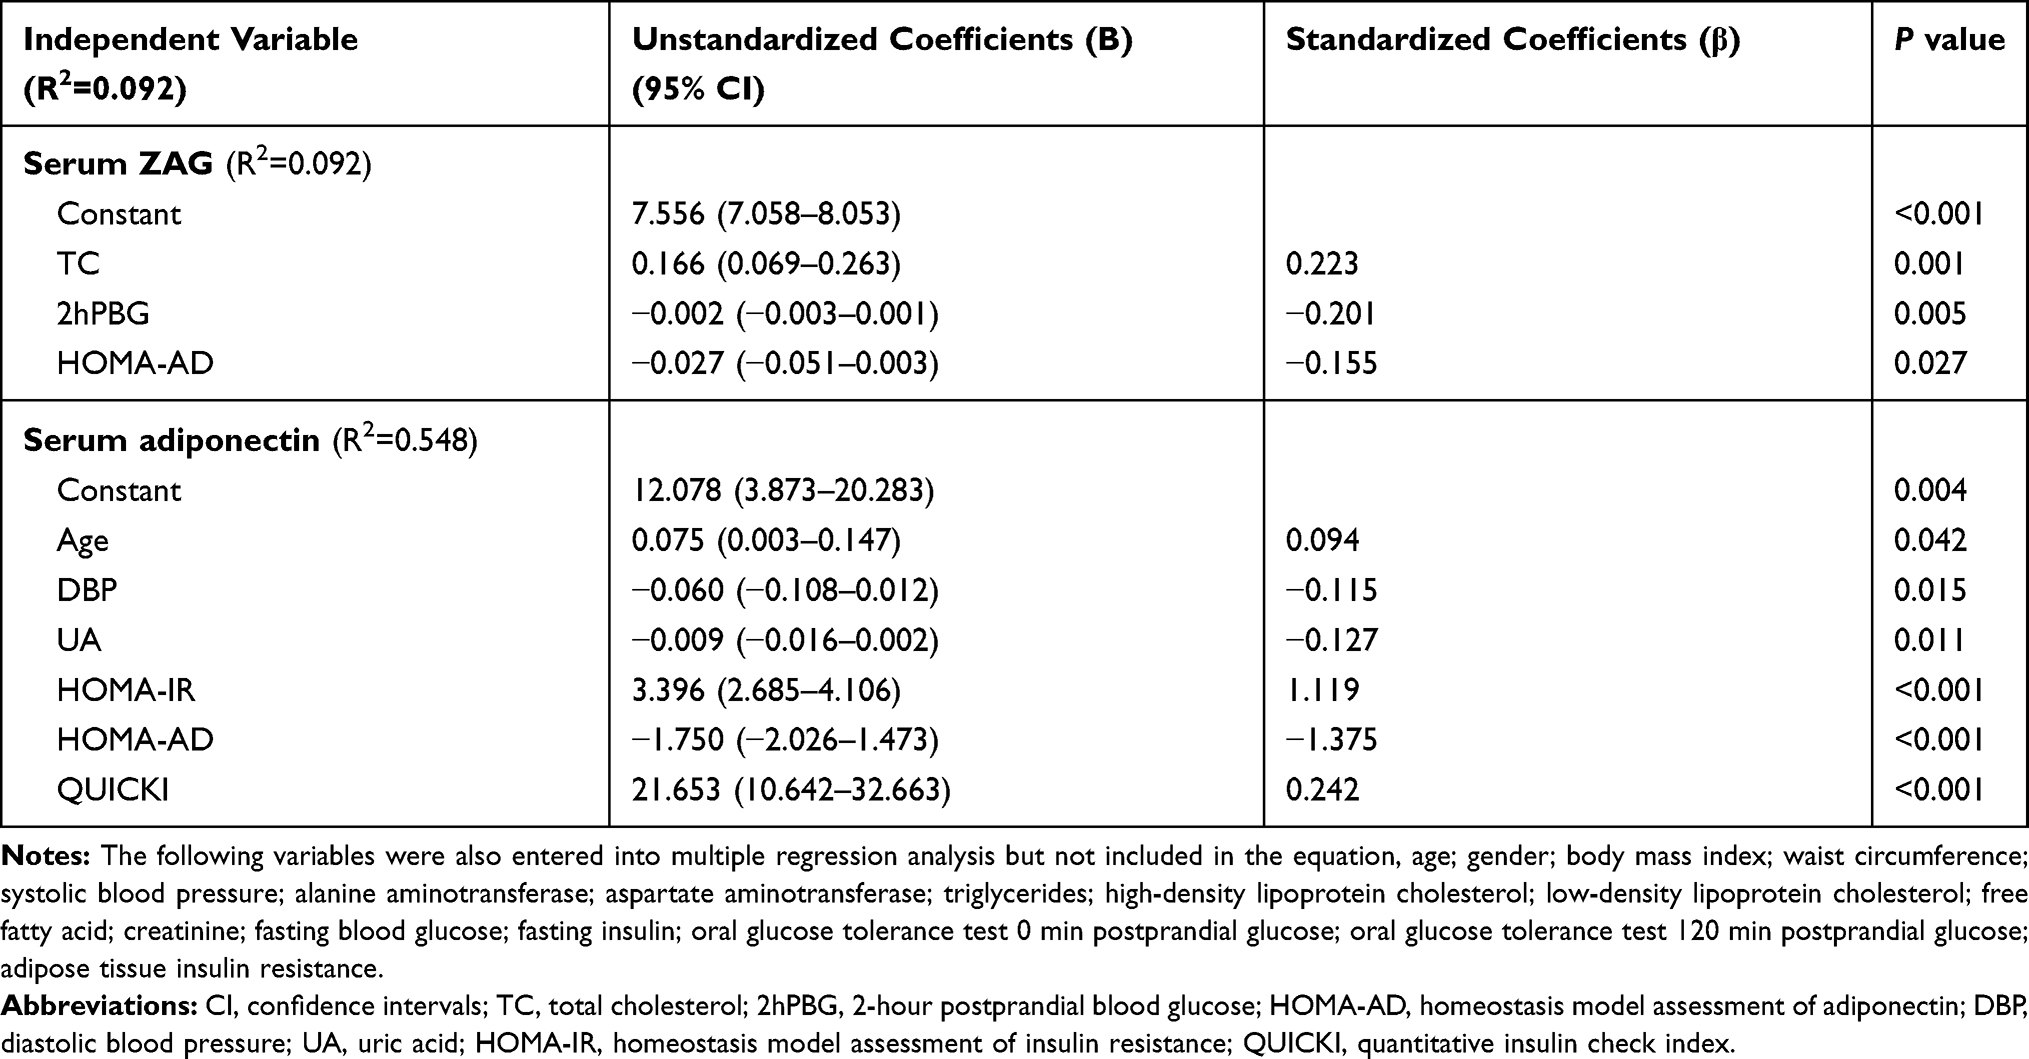 |
Table 4 Stepwise Multiple Linear Regression Analysis with Serum ZAG/Adiponectin as the Dependent Variable in Study Population |
Unconditional Logistic Regression Analysis of Metabolically Abnormal Risks According to Tertiles of ZAG/Adiponectin in All Subjects
Then the unconditional logistic regression analysis was used to explore the association between metabolically abnormal risks and serum ZAG levels in all subjects. As displayed in Table 5, after dividing all subjects into three equal sections based on serum ZAG levels (lowest: <7.582 μg/mL; median: ≥7.582 to <8.283 μg/mL; highest: ≥8.283 μg/mL), the risks of metabolically abnormal in subjects in the lowest and median tertiles of serum ZAG levels were significantly increased, which increased by 1.406–fold (OR=2.406, 95% CI 1.214–4.768, P=0.012) and 1.985–fold (OR=2.985, 95% CI 1.474–6.046, P=0.002), respectively, when compared to those in the highest tertile of ZAG levels. In Model 1, after adjusting age, gender and BMI, the ORs of metabolically abnormal of subjects with the lowest and median tertile of serum ZAG levels were still significantly increased compared with subjects in the highest tertile of ZAG levels (OR=3.542, 95% CI 1.458–8.608, P=0.005, OR=5.036, 95% CI 2.011–12.611, P=0.001, respectively). After further adjusting SBP, DBP, FBG, FINS, TC, TG, HDL-C, LDL-C, FFA based on Model 1 (Model 2), and even further adjusting Cr, UA based on Model 2 (Model 3), subjects in the lowest and median tertile of serum ZAG levels also had significantly higher risks of metabolically abnormal, when compared with those in the highest tertile of ZAG levels (OR=4.877, 95% CI 1.342–17.722, P=0.016, OR=8.585, 95% CI 1.949–37.816, P=0.004, respectively, in Model 2; OR=3.939, 95% CI 1.015–15.289, P=0.048, OR=9.228, 95% CI 1.941–43.863, P=0.005, respectively, in Model 3).
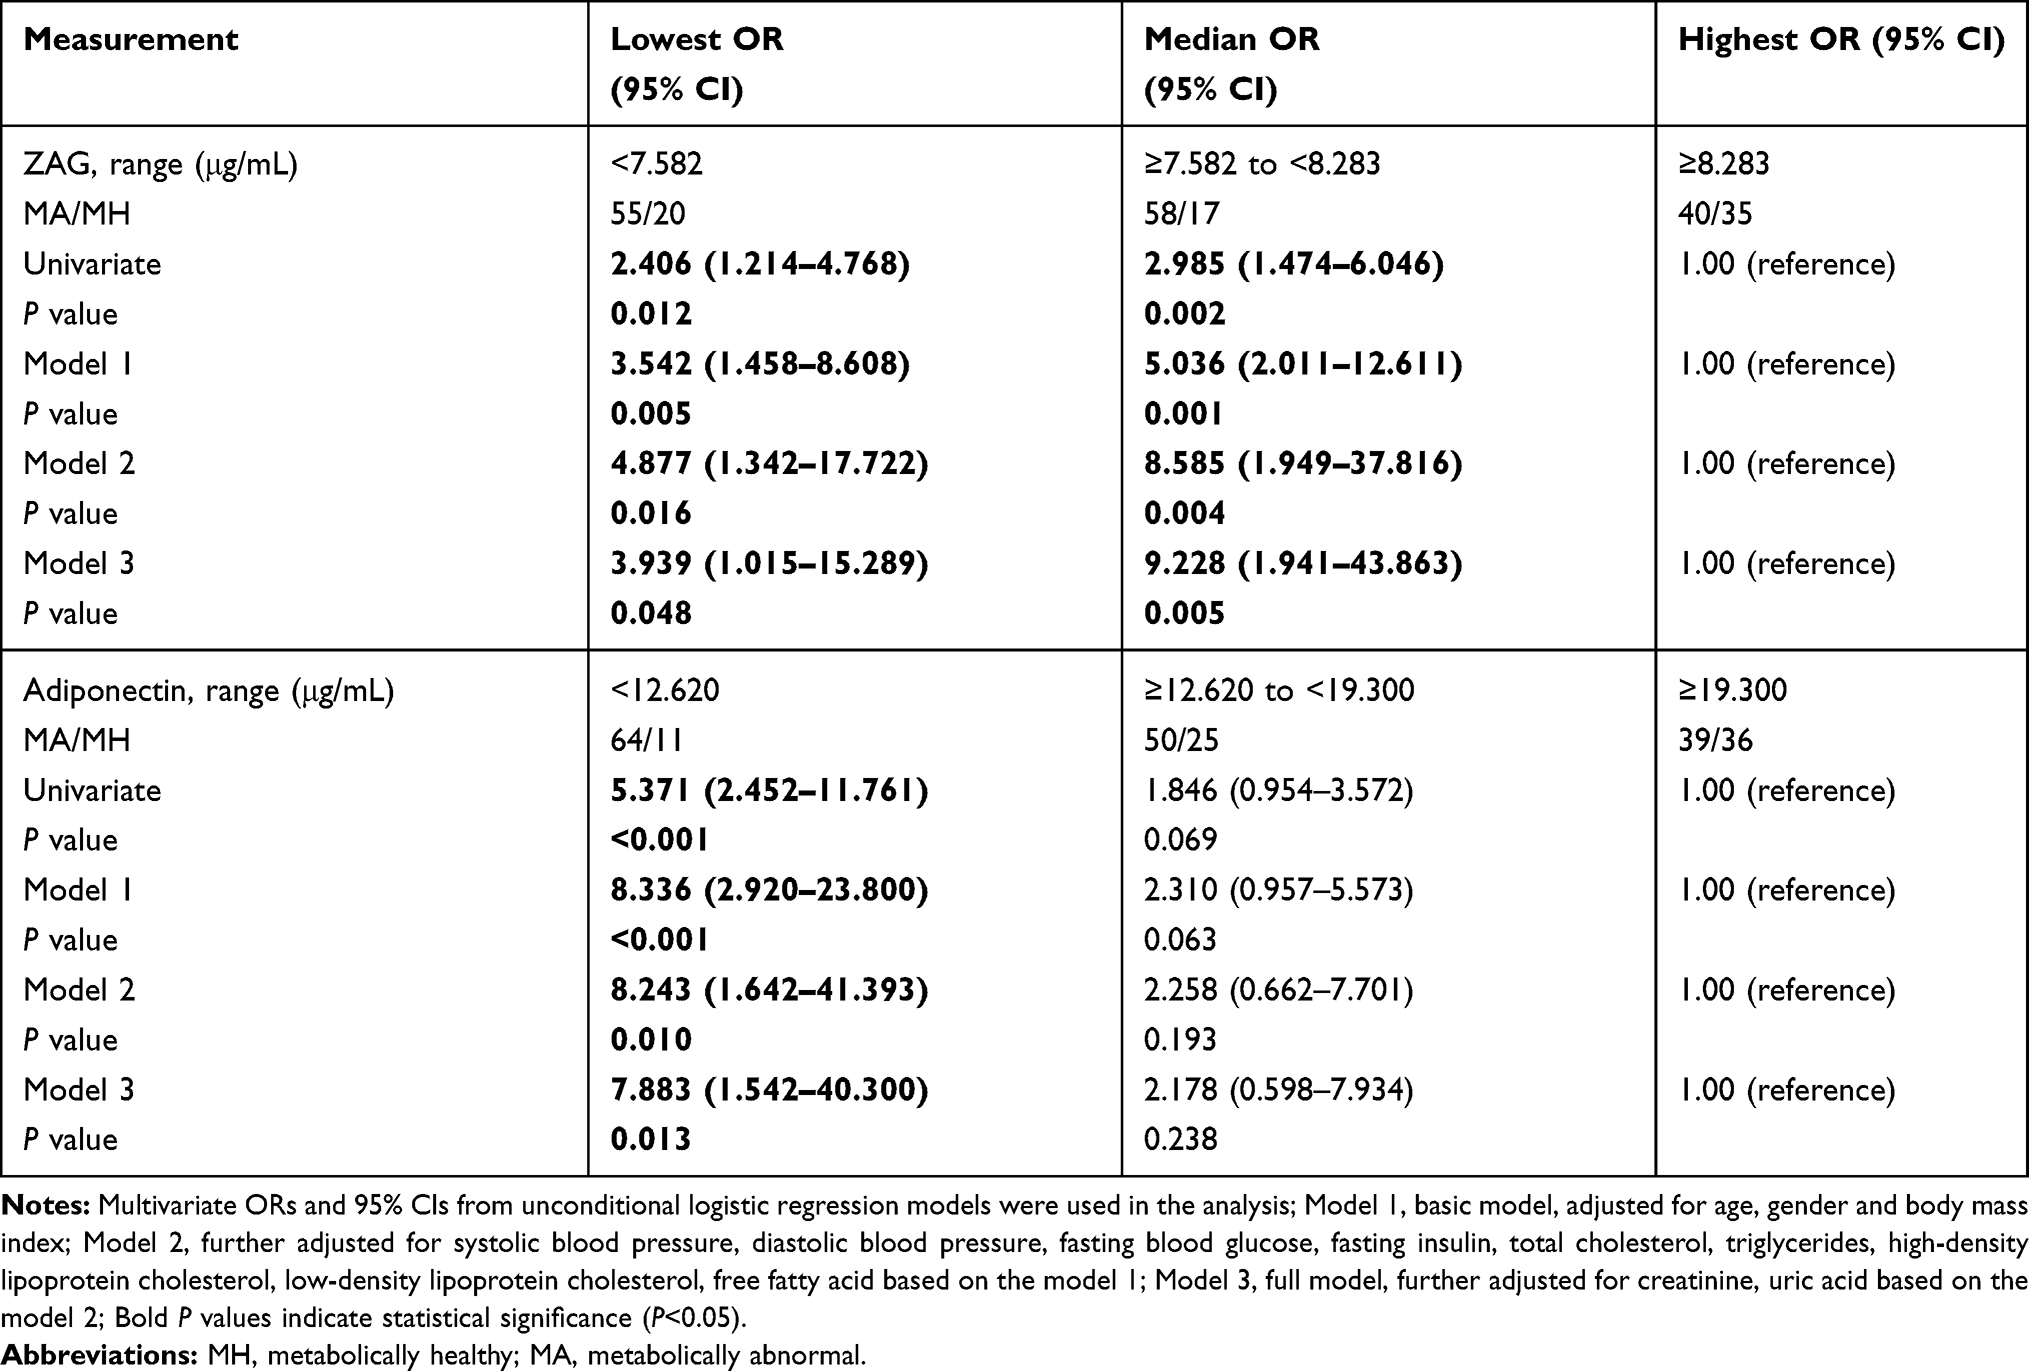 |
Table 5 Unconditional Logistic Regression Analysis of Metabolically Abnormal Risks According to Tertiles of ZAG/Adiponectin in All Subjects |
In addition, the associations between metabolically abnormal risks and serum adiponectin levels in all subjects were also explored. As shown in Table 5, after dividing all subjects into three equal sections based on serum adiponectin levels (lowest: <12.620 μg/mL; median: ≥12.620 to <19.300 μg/mL; highest: ≥19.300 μg/mL), the risks of metabolically abnormal in subjects in the lowest tertile of serum adiponectin levels were significantly increased, which increased by 4.371–fold (OR=5.371, 95% CI 2.452–11.761, P<0.001), when compared to those in the highest tertile of adiponectin levels. In Model 1, after adjusting age, gender and BMI, the ORs of metabolically abnormal of subjects with the lowest tertile of serum adiponectin levels were still significantly increased compared with subjects in the highest tertile of adiponectin levels (OR=8.336, 95% CI 2.920–23.800, P<0.001). After further adjusting SBP, DBP, FBG, FINS, TC, TG, HDL-C, LDL-C, FFA based on Model 1 (Model 2), and even further adjusting Cr, UA based on Model 2 (Model 3), subjects in the lowest tertile of serum adiponectin levels also had significantly higher risks of metabolically abnormal, when compared with those in the highest tertile of adiponectin levels (OR=8.243, 95% CI 1.642–41.393, P=0.010, in Model 2; OR=7.883, 95% CI 1.542–40.300, P=0.013, in Model 3).
Diagnostic Values of Serum ZAG and Adiponectin Levels for Metabolically Abnormal
Finally, the diagnostic values of serum ZAG and adiponectin levels for metabolically abnormal were explored by ROC curve analysis. As shown in Figure 2, the area under ROC curve (AUC) for ZAG alone was 0.623 (95% CI 0.539–0.706, P<0.05) and for adiponectin alone was 0.674 (95% CI 0.601–0.746, P<0.05). The optimal cutoff value for ZAG was 8.25 μg/mL, for adiponectin was 14.11 μg/mL. The sensitivity and specificity were 50.0% and 73.2% for ZAG, and were 81.9% and 48.4% for adiponectin. Moreover, the combination of ZAG and adiponectin gained an improved the discriminatory power with the AUC of 0.703 (95% CI 0.629–0.776, P<0.05), the sensitivity of 62.7% and the specificity of 73.6%.
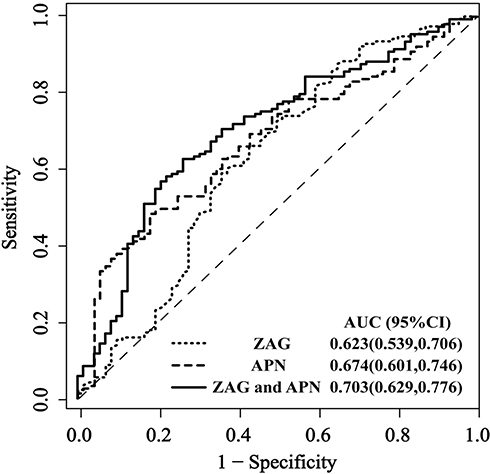 |
Figure 2 Comparison for ROC curves of serum ZAG and adiponectin alone as well as the combination of ZAG with adiponectin in all subjects. Abbreviations: ZAG, zinc-α2-glycoprotein; APN, adiponectin. |
Discussion
Obesity has been long well documented to be highly associated with metabolic disorders. However, some obese people that so-called MHO, present a less deleterious metabolic phenotype. Zinc-α2-glycoprotein, also called ZAG or AZGP1, is a novel identified adipokine which plays important roles in glucose and lipid metabolic regulation as well as insulin sensitivity. Our previous studies together with others have revealed the significantly decreased serum ZAG levels in overweight/obese patients.18,19,33 However, serum ZAG levels in obese subjects with different metabolic status remain unknown. Thus, our present study extended the available information, further exploring serum ZAG levels in MHNO, MHO, MAO and MADO subjects. Consistent with the previous research results, our present studies found that compared with MHNO individuals, serum ZAG levels in the MADO group were significantly reduced, and in the MAO group had a tendency to be decreased.
The novelty of our study is that we displayed for the first time that serum ZAG levels were higher in MHO individuals but lower in MAO or MADO individuals. Moreover, compared with the MHNO group, WC was significantly higher in subjects in the MHO group, and even further higher in the MAO and MADO groups. WC is a measurement of abdominal obesity,34,35 suggesting that fat distribution may affect serum ZAG levels. Previous studies by Garrido-Sánchez et al found that serum insulin levels (β=−0.088, P=0.030) and HOMA-IR (β=0.320, P=0.025) were independent influencing factors of ZAG expression in visceral adipose tissue, which suggested that compared with subcutaneous adipose tissue, ZAG expression in visceral adipose tissue had a more close relationship with the metabolism status of the body.36 We speculated that the higher levels of serum ZAG in MHO individuals may reflect a response of visceral adipose tissue to counteract the metabolic stress imposed by obesity. This scenario is reminiscent of hyperinsulinemia, which is thought to be the consequence of increased production in compensation to obesity-associated resistance to insulin.37 Unfortunately, in MAO or MADO individuals that obesity accompanied with metabolic abnormities, the adipose tissue is dysfunction and decompensated. Thus, serum ZAG levels were decreased although WC was further higher in the MAO and MADO groups. However, our hypothesis needs to be verified by further prospective studies in the future.
Previously, a large number of studies have shown that ZAG was closely related to various metabolic diseases, such as T2DM,23 hypertension24 and metabolic syndrome.25 Consistent with previous studies, a close relationship between serum ZAG levels and the body metabolism status was also found in our present study. Multiple linear regression analysis showed that TC, 2h PBG, HOMA-AD were independent influence factors of serum ZAG levels. Logistic regression analysis showed that compared with subjects with the highest ZAG levels, the risks of metabolically abnormal in subjects in the lowest and median tertile of serum ZAG levels were significantly increased. After adjusting for age, gender and BMI in Model 1, the risks of metabolic abnormalities in subjects with the lowest and median tertile of serum ZAG levels were 1.406 and 1.985 times higher than those with the highest ZAG levels. After additional adjustment for SBP, DBP, FBG, FINS, TC, TG, HDL-C, LDL-C, FFA in Model 2 and Cr and UA in Model 3, this trend still existed, suggesting that the decreased serum ZAG levels were independent risk factors for the increased risk of metabolic abnormalities.
Adiponectin, also known as Arcp30, AdipoQ, apM1, and GBP28, was first discovered and named in mice by Scherer et al in 1995.38 Although adipose tissue was the main source of adiponectin,38 serum adiponectin levels were significantly reduced in obesity, especially in visceral obesity.39 Adiponectin was the most studied adipokines currently, with a variety of effects, such as increased insulin sensitivity, anti-inflammatory, anti-apoptosis and so on.40 Studies have shown that the decreased serum adiponectin levels were closely related to insulin resistance, dyslipidemia, T2DM, as well as cardiovascular disease.41,42 In recent years, a few studies pointed out that serum adiponectin levels had a compensatory elevation in MHO individuals.43–45 Inconsistent with previous studies, no significant difference of serum adiponectin levels was found between the MHUO and MHO groups in our present studies. The discrepancy may be due to the differences in the clinical characteristics of patients, including ethnics, age, gender, the extent of obesity, sample size, drug treatment. Given our present study was the first to explore serum adiponectin levels in obese patients with different metabolic status in the Chinese population, more large-scale studies are still needed to be done in the future.
In addition, consistent with previous studies, our present study also observed the close association between serum adiponectin levels and metabolism. Firstly, compared with the MHO group, serum adiponectin levels decreased gradually in the MAO and MADO groups. Secondly, multiple linear regression analysis showed that DBP, UA, HOMA-IR, HOMA-AD and QUICKI were independent factors influencing serum adiponectin levels. Thirdly, compared with subjects with the highest adiponectin levels, the risk of metabolic abnormalities was significantly increased in subjects with the lowest adiponectin levels, and after adjustment for the other confounding factors in Model 1–3, this phenomenon still existed, which indicated that the decreased serum adiponectin levels were an independent risk factor for the increased risk of metabolic abnormalities. In support of our findings, Aguilar-Salinas et al studied in the Mexican population found that the elevated levels of serum adiponectin increased the likelihood of being metabolically healthy in obese individuals, and this trend remained after adjusting for age, WC and serum insulin levels.43 Ahl et al studied in Western populations further found that higher serum adiponectin levels were associated with better metabolic health not in obese individuals but also in nonobese individuals.16 All these results suggest the key role of serum adiponectin in determining the metabolic health.
Finally, the ROC curve analysis was used to analyze the diagnostic value of serum ZAG/adiponectin for metabolic abnormalities. The AUC for ZAG alone was 0.623 and for adiponectin alone was 0.674. The sensitivity and specificity for ZAG were 50.0% and 73.2%, for adiponectin were 81.9% and 48.4%. These results showed that serum ZAG or adiponectin might be helpful for the diagnosis of metabolic abnormalities. In support of our results, studies performed by Lei et al in middle-aged and older southern Chinese adults found that serum ZAG levels were decreased progressively with an increasing number of the MetS components, and the analysis of ROC curves demonstrated that ZAG could predict MetS with the best cutoff value of 45.2 mg/L (sensitivity 92%, specificity 59%, and AUC 0.80);25 studies performed by Ko et al in Hong Kong, Chinese women with polycystic ovary syndrome found that adiponectin levels were independently associated with the MetS, and the area under the ROC curve of adiponectin for the prediction of MetS was 0.820 with 95% CI 0.737–0.886;46 studies performed by Li et al among Chinese children and adolescents also found that the levels of adiponectin in both boys and girls were significantly declined, and the AUC of adiponectin for diagnosis of MetS in girls were 0.689 for girls and 0.697 for boys.47 Moreover, we found that the combination of ZAG and adiponectin gained an improved discriminatory power with the AUC of 0.703, the sensitivity of 62.7% and the specificity of 73.6%. The diagnostic value of the combination of ZAG and adiponectin for metabolic abnormalities still needs to be confirmed in other large-scale prospective studies in the future.
There are some limitations in our study. Firstly, the cross-sectional design does not allow us to elucidate the causal relationship between serum ZAG levels and the metabolically abnormal phenotype. Secondly, the diagnostic value of ZAG for the metabolically abnormal phenotype observed in our studies needs to be verified in another prospective study. Thirdly, our present studies were conducted in Chinese people with a small sample size. Therefore, large-scale studies in other ethnic groups are necessary in the future.
Conclusion
In conclusion, our results demonstrated that1 serum ZAG levels were higher in MHO individuals; with the severity of metabolic abnormalities increased, serum ZAG levels decreased gradually in MAO and MADO groups.2 After adjusting for age, gender, BMI and other confounders, the decreased serum ZAG levels were closely associated with the presence of metabolically abnormal phenotype.3 Serum ZAG might serve as the potential diagnostic biomarkers for metabolically abnormal patients. Combined serum ZAG and adiponectin have greater diagnostic value for metabolic abnormalities.
Abbreviations
ADA, American Diabetes Association; Adipo-IR, adipose tissue insulin resistance; ALT, alanine aminotransferase; AST, aspartate transaminase; AUC, area under the curve; BMI, body mass index; CI, confidence intervals; Cr, creatinine; DBP, diastolic blood pressure; ELISA, enzyme linked immunosorbent assay; FBG, fasting blood glucose; FFA, free fatty acid; FINS, fasting insulin; HDL-C, high-density lipoprotein cholesterol; HOMA-AD, homeostasis model assessment of adiponectin; HOMA-IR, homeostasis model assessment estimate of insulin resistance; 2hPG, 2-hour postprandial blood glucose; LDL-C, low-density lipoprotein cholesterol; MADO, metabolically abnormal diabetic obese; MAO, metabolically abnormal obesity; MHNO, metabolically healthy non-obese; MHO, metabolically healthy obesity; MetS, metabolic syndrome; NCEP: ATP III, National Cholesterol Education Program–Adult Treatment Panel III; OGTT, oral glucose tolerance test; OR, odds ratio; PUMCH, Peking Union Medical College Hospital; QUICKI, quantitative insulin check index; ROC, receiver operation characteristic; SBP, systolic blood pressure; SD, standard deviation; TC, total cholesterol; T2DM, type 2 diabetes mellitus; TG, triglycerides; UA, uric acid; Urea, urea nitrogen; WC, waist circumstance; ZAG, zinc-α2-glycoprotein.
Data Sharing Statement
The datasets generated for the present study are available on request to the corresponding author Fengying Gong.
Author Contributions
Serum ZAG levels were firstly explored in obese adults with different metabolism status. We found that serum ZAG levels were higher in MHO subjects, but lower in MAO and MADO subjects. The decreased serum ZAG levels were closely related to the metabolically abnormal phenotype of obese patients. Serum ZAG, especially the combination with adiponectin might be the potential diagnostic biomarkers for metabolically abnormal obese patients.
Disclosure
The authors report no conflicts of interest for this work.
References
1. Ng M, Fleming T, Robinson M, et al. Global, regional, and national prevalence of overweight and obesity in children and adults during 1980–2013: a systematic analysis for the Global Burden of Disease Study 2013. Lancet. 2014;384:766–781. doi:10.1016/S0140-6736(14)60460-8
2. Afshin A, Forouzanfar MH, Reitsma MB, et al. Health effects of overweight and obesity in 195 countries over 25 years. N Engl J Med. 2017;377:13–27. doi:10.1056/NEJMoa1614362
3. Mokdad AH, Ford ES, Bowman BA, et al. Prevalence of obesity, diabetes, and obesity-related health risk factors, 2001. JAMA. 2003;289:76–79. doi:10.1001/jama.289.1.76
4. Adams KF, Schatzkin A, Harris TB, et al. Overweight, obesity, and mortality in a large prospective cohort of persons 50 to 71 years old. N Engl J Med. 2006;355:763–778. doi:10.1056/NEJMoa055643
5. Andres R. Effect of obesity on total mortality. Int J Obes. 1980;4:381–386.
6. Primeau V, Coderre L, Karelis AD, et al. Characterizing the profile of obese patients who are metabolically healthy. Int J Obes. 2011;35:971–981. doi:10.1038/ijo.2010.216
7. Song Y, Manson JE, Meigs JB, Ridker PM, Buring JE, Liu S. Comparison of usefulness of body mass index versus metabolic risk factors in predicting 10-year risk of cardiovascular events in women. Am J Cardiol. 2007;100:1654–1658. doi:10.1016/j.amjcard.2007.06.073
8. Arnlov J, Ingelsson E, Sundstrom J, Lind L. Impact of body mass index and the metabolic syndrome on the risk of cardiovascular disease and death in middle-aged men. Circulation. 2010;121:230–236. doi:10.1161/CIRCULATIONAHA.109.887521
9. Calori G, Lattuada G, Piemonti L, et al. Prevalence, metabolic features, and prognosis of metabolically healthy obese Italian individuals: the cremona study. Diabetes Care. 2011;34:210–215. doi:10.2337/dc10-0665
10. Ogorodnikova AD, Kim M, McGinn AP, Muntner P, Khan U, Wildman RP. Incident cardiovascular disease events in metabolically benign obese individuals. Obesity. 2012;20:651–659. doi:10.2337/dc10-0665
11. Hamer M, Stamatakis E. Metabolically healthy obesity and risk of all-cause and cardiovascular disease mortality. J Clin Endocrinol Metab. 2012;97:2482–2488. doi:10.1210/jc.2011-3475
12. Appleton SL, Seaborn CJ, Visvanathan R, et al. Diabetes and cardiovascular disease outcomes in the metabolically healthy obese phenotype: a cohort study. Diabetes Care. 2013;36:2388–2394. doi:10.2337/dc12-1971
13. Galic S, Oakhill JS, Steinberg GR. Adipose tissue as an endocrine organ. Mol Cell Endocrinol. 2010;316:129–139. doi:10.1016/j.mce.2009.08.018
14. Samocha-Bonet D, Chisholm DJ, Tonks K, Campbell LV, Greenfield JR. Insulin-sensitive obesity in humans - a ‘favorable fat’ phenotype? Trends Endocrinol Metab. 2012;23:116–124. doi:10.1016/j.tem.2011.12.005
15. Samocha-Bonet D, Dixit VD, Kahn CR, et al. Metabolically healthy and unhealthy obese–the 2013 stock conference report. Obes Rev. 2014;15:697–708. doi:10.1111/obr.12199
16. Ahl S, Guenther M, Zhao S, et al. Adiponectin levels differentiate metabolically healthy vs unhealthy among obese and nonobese white individuals. J Clin Endocrinol Metab. 2015;100:4172–4180. doi:10.1210/jc.2015-2765
17. Bing C, Bao Y, Jenkins J, et al. Zinc-alpha2-glycoprotein, a lipid mobilizing factor, is expressed in adipocytes and is up-regulated in mice with cancer cachexia. Proc Natl Acad Sci U S A. 2004;101:2500–2505. doi:10.1073/pnas.0308647100
18. Gong FY, Zhang SJ, Deng JY, et al. Zinc-α2-glycoprotein is involved in regulation of body weight through inhibition of lipogenic enzymes in adipose tissue. Int J Obes. 2009;33:1023–1030. doi:10.1038/ijo.2009.141
19. Liu M, Zhu H, Dai Y, et al. Zinc-α2-glycoprotein is associated with obesity in Chinese people and HFD-induced obese mice. Front Physiol. 2018;9:62. doi:10.3389/fphys.2018.00062
20. Bao Y, Bing C, Hunter L, Jenkins JR, Wabitsch M, Trayhurn P. Zinc-alpha2-glycoprotein, a lipid mobilizing factor, is expressed and secreted by human (SGBS) adipocytes. FEBS Lett. 2005;579:41–47. doi:10.1016/j.febslet.2004.11.042
21. Russell ST, Tisdale MJ. Studies on the antiobesity effect of zinc-α2-glycoprotein in the ob/ob mouse. Int J Obes. 2011;35(3):345–354. doi:10.1038/ijo.2010.150
22. Rolli V, Radosavljevic M, Astier V, et al. Lipolysis is altered in MHC class I zinc-alpha(2)-glycoprotein deficient mice. FEBS Lett. 2007;581:394–400. doi:10.1016/j.febslet.2006.12.047
23. Tian M, Liang Z, Liu R, et al. Effects of sitagliptin on circulating zinc-α2-glycoprotein levels in newly diagnosed type 2 diabetes patients: a randomized trial. Eur J Endocrinol. 2016;174(2):147–155. doi:10.1530/EJE-15-0637
24. Zhu HJ, Wang XQ, Pan H, et al. Serum levels of the adipokine zinc- alpha 2-glycoprotein are decreased in patients with hypertension. ISRN Endocrinol. 2014;2014:374090. doi:10.1155/2014/374090
25. Lei L, Li K, Li L, et al. Circulating zinc-α2-glycoprotein levels are low in newly diagnosed patients with metabolic syndrome and correlate with adiponectin. Nutr Metab. 2017;14:53. doi:10.1186/s12986-017-0210-6
26. Cleeman JI, Grundy SM, Becker D, Clark L. Executive summary of the third report of the national cholesterol education program (NCEP) expert panel on detection, evaluation, and treatment of high blood cholesterol in adults (Adult treatment panel III). JAMA. 2001;285:2486–2497. doi:10.1001/jama.285.19.2486
27. American Diabetes Association. 2. Classification and diagnosis of diabetes: standards of medical care in diabetes–2018. Diabetes Care. 2018;41:S13–S27. doi:10.2337/dc18-S002
28. Choe EY, Lee YH, Choi YJ, et al. Waist-to-calf circumstance ratio is an independent predictor of hepatic steatosis and fibrosis in patients with type 2 diabetes. J Gastroenterol Hepatol. 2018;33:1082–1091. doi:10.1111/jgh.14011
29. Matthews DR, Hosker JP, Rudenski AS, Naylor BA, Treacher DF, Turner RC. Homeostasis model assessment: insulin resistance and beta-cell function from fasting plasma glucose and insulin concentrations in man. Diabetologia. 1985;28:412–419. doi:10.1007/bf00280883
30. Hung AM, Sundell MB, Egbert P, et al. A comparison of novel and commonly-used indices of insulin sensitivity in African American chronic hemodialysis patients. Clin J Am Soc Nephrol. 2011;6:767–774. doi:10.2215/CJN.08070910
31. Gastaldelli A, Harrison SA, Belfort-Aguilar R, et al. Importance of changes in adipose tissue insulin resistance to histological response during thiazolidinedione treatment of patients with nonalcoholic steatohepatitis. Hepatology. 2009;50:1087–1093. doi:10.1002/hep.23116
32. Perseghin G, Caumo A, Caloni M, Testolin G, Luzi L. Incorporation of the fasting plasma FFA concentration into QUICKI improves its association with insulin sensitivity in nonobese individuals. J Clin Endocrinol Metab. 2001;86:4776–4781. doi:10.1210/jcem.86.10.7902
33. Selva DM, Lecube A, Hernandez C, Baena JA, Fort JM, Simo R. Lower zinc-α2-glycoprotein production by adipose tissue and liver in obese patients unrelated to insulin resistance. J Clin Endocrinol Metab. 2009;94:4499–4507. doi:10.1210/jc.2009-0758
34. Jensen MD, Ryan DH, Apovian CM, et al. 2013 AHA/ACC/TOS guideline for the management of overweight and obesity in adults: a report of the American college of cardiology/American heart association task force on practice guidelines and the obesity society. Circulation. 2014;129:S102–38. 10.1161/01.cir.0000437739
35. Janssen I, Katzmarzyk PT, Ross R. Waist circumference and not body mass index explains obesity-related health risk. Am J Clin Nutr. 2004;79:379–384. doi:10.1093/ajcn/79.3.379
36. Garrido-Sanchez L, Garcia-Fuentes E, Fernandez-Garcia D, et al. Zinc-alpha 2-glycoprotein gene expression in adipose tissue is related with insulin resistance and lipolytic genes in morbidly obese patients. PLoS One. 2012;7:e33264. doi:10.1371/journal.pone.0033264
37. Freeman AM, Pennings N. Insulin Resistance. Treasure Island (FL): StatPearls Publishing; 2020:26.
38. Scherer PE, Williams S, Fogliano M, Baldini G, Lodish HF. A novel serum protein similar to C1q, produced exclusively in adipocytes. J Biol Chem. 1995;270:26746–26749. doi:10.1074/jbc.270.45.26746
39. Kadowaki T, Yamauchi T, Kubota N, Hara K, Ueki K, Tobe K. Adiponectin and adiponectin receptors in insulin resistance, diabetes, and the metabolic syndrome. J Clin Invest. 2006;116:1784–1792. doi:10.1172/JCI29126
40. Fasshauer M, Bluher M. Adipokines in health and disease. Trends Pharmacol Sci. 2015;36:461–470. doi:10.1016/j.tips.2015.04.014
41. Mojiminiyi OA, Abdella NA, Al AM, Ben NA. Adiponectin, insulin resistance and clinical expression of the metabolic syndrome in patients with Type 2 diabetes. Int J Obes. 2007;31:213–220. doi:10.1038/sj.ijo.0803355
42. Shikany JM, Lewis CE, Freedman BI, et al. Plasma adiponectin concentrations and correlates in African Americans in the hypertension genetic epidemiology network (HyperGEN) study. Metabolism. 2007;56:1011–1016. doi:10.1016/j.metabol.2007.03.020
43. Aguilar-Salinas CA, Garcia EG, Robles L, et al. High adiponectin concentrations are associated with the metabolically healthy obese phenotype. J Clin Endocrinol Metab. 2008;93:4075–4079. doi:10.1210/jc.2007-2724
44. Morrison JA, Glueck CJ, Daniels S, Wang P, Horn P, Stroop D. Paradoxically high adiponectin and the healthy obese phenotype in obese black and white 16-year-old girls. Transl Res. 2010;156:302–308. doi:10.1016/j.trsl.2010.08.003
45. Doumatey AP, Bentley AR, Zhou J, Huang H, Adeyemo A, Rotimi CN. Paradoxical hyperadiponectinemia is associated with the metabolically healthy obese (MHO) phenotype in African Americans. J Endocrinol Metab. 2012;2:51–65. doi:10.4021/jem95W
46. Ko JK, Li HW, Lam KS, et al. Serum adiponectin is independently associated with the metabolic syndrome in Hong Kong, Chinese women with polycystic ovary syndrome. Gynecol Endocrinol. 2016;32:390–394. doi:10.3109/09513590.2015.1126708
47. Li G, Xu L, Zhao Y, et al. Leptin-adiponectin imbalance as a marker of metabolic syndrome among Chinese children and adolescents: the BCAMS study. PLoS One. 2017;12:e186222. doi:10.1371/journal.pone.0186222
 © 2020 The Author(s). This work is published and licensed by Dove Medical Press Limited. The full terms of this license are available at https://www.dovepress.com/terms.php and incorporate the Creative Commons Attribution - Non Commercial (unported, v3.0) License.
By accessing the work you hereby accept the Terms. Non-commercial uses of the work are permitted without any further permission from Dove Medical Press Limited, provided the work is properly attributed. For permission for commercial use of this work, please see paragraphs 4.2 and 5 of our Terms.
© 2020 The Author(s). This work is published and licensed by Dove Medical Press Limited. The full terms of this license are available at https://www.dovepress.com/terms.php and incorporate the Creative Commons Attribution - Non Commercial (unported, v3.0) License.
By accessing the work you hereby accept the Terms. Non-commercial uses of the work are permitted without any further permission from Dove Medical Press Limited, provided the work is properly attributed. For permission for commercial use of this work, please see paragraphs 4.2 and 5 of our Terms.